Zip Codes with the Highest Percentage of Population Employed in Food Preparation & Serving in Miami, FL
RELATED REPORTS & OPTIONS
Food Preparation & Serving
Miami
Compare Zip Codes
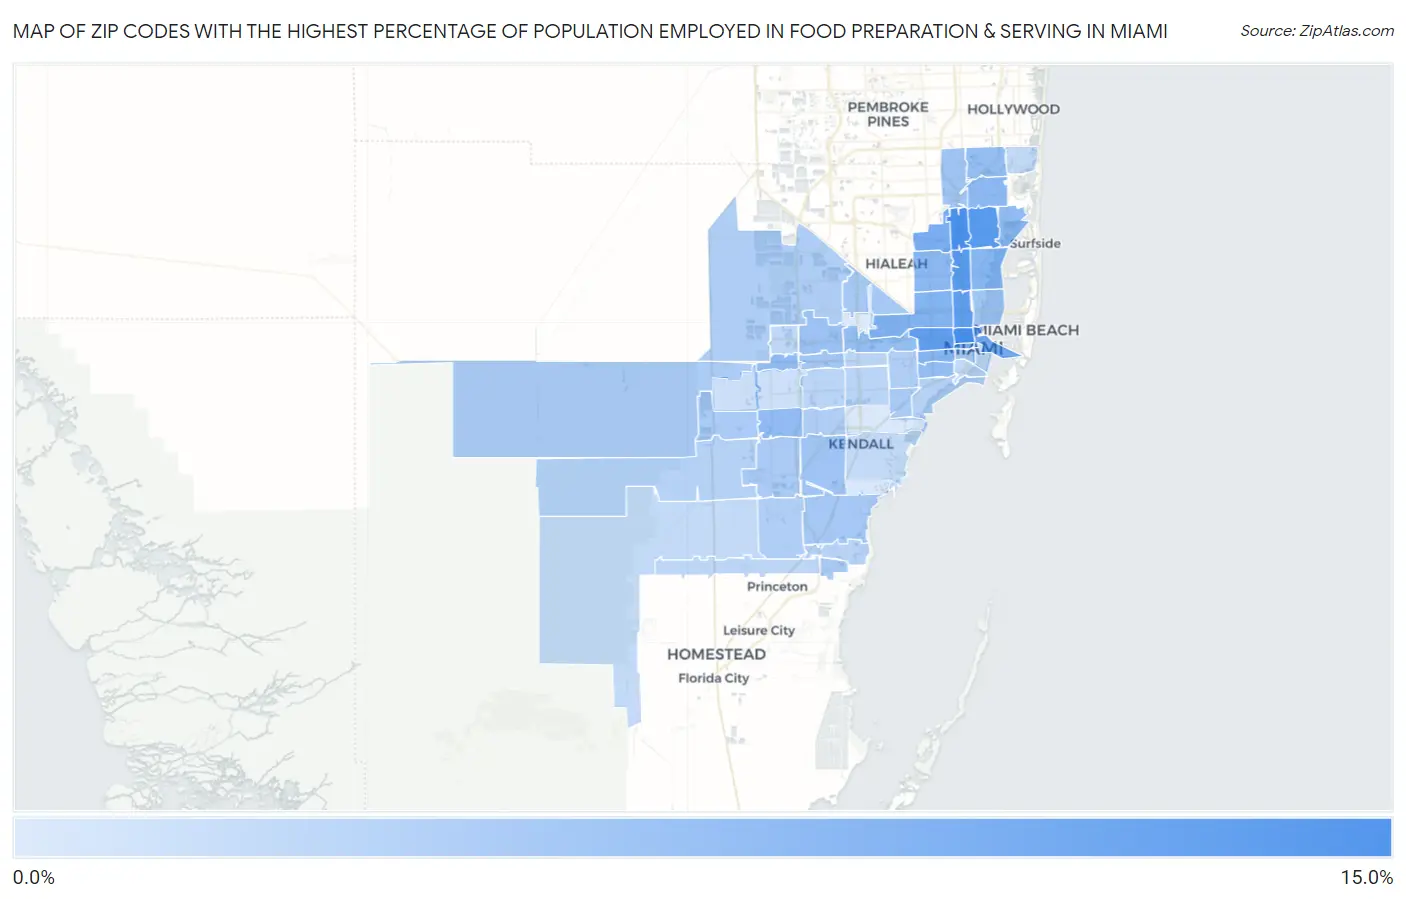
Map of Zip Codes with the Highest Percentage of Population Employed in Food Preparation & Serving in Miami
1.2%
11.6%
Zip Codes with the Highest Percentage of Population Employed in Food Preparation & Serving in Miami, FL
| Zip Code | % Employed | vs State | vs National | |
| 1. | 33136 | 11.6% | 6.1%(+5.48)#51 | 5.3%(+6.28)#1,822 |
| 2. | 33168 | 11.4% | 6.1%(+5.32)#53 | 5.3%(+6.12)#1,873 |
| 3. | 33161 | 10.5% | 6.1%(+4.38)#74 | 5.3%(+5.19)#2,337 |
| 4. | 33150 | 10.4% | 6.1%(+4.26)#79 | 5.3%(+5.07)#2,398 |
| 5. | 33127 | 9.7% | 6.1%(+3.64)#99 | 5.3%(+4.45)#2,854 |
| 6. | 33125 | 9.7% | 6.1%(+3.58)#104 | 5.3%(+4.39)#2,906 |
| 7. | 33132 | 8.3% | 6.1%(+2.25)#170 | 5.3%(+3.06)#4,246 |
| 8. | 33167 | 8.0% | 6.1%(+1.87)#197 | 5.3%(+2.67)#4,791 |
| 9. | 33128 | 7.8% | 6.1%(+1.68)#219 | 5.3%(+2.48)#5,104 |
| 10. | 33142 | 7.2% | 6.1%(+1.16)#289 | 5.3%(+1.96)#6,030 |
| 11. | 33135 | 7.1% | 6.1%(+0.988)#302 | 5.3%(+1.79)#6,384 |
| 12. | 33138 | 7.0% | 6.1%(+0.861)#322 | 5.3%(+1.67)#6,679 |
| 13. | 33162 | 6.6% | 6.1%(+0.549)#371 | 5.3%(+1.35)#7,511 |
| 14. | 33147 | 6.6% | 6.1%(+0.529)#373 | 5.3%(+1.33)#7,558 |
| 15. | 33184 | 6.4% | 6.1%(+0.326)#398 | 5.3%(+1.13)#8,106 |
| 16. | 33181 | 6.4% | 6.1%(+0.324)#399 | 5.3%(+1.13)#8,107 |
| 17. | 33183 | 6.4% | 6.1%(+0.287)#400 | 5.3%(+1.09)#8,202 |
| 18. | 33145 | 6.3% | 6.1%(+0.173)#413 | 5.3%(+0.978)#8,531 |
| 19. | 33126 | 6.1% | 6.1%(-0.017)#446 | 5.3%(+0.787)#9,108 |
| 20. | 33179 | 6.0% | 6.1%(-0.065)#454 | 5.3%(+0.739)#9,258 |
| 21. | 33172 | 5.6% | 6.1%(-0.496)#519 | 5.3%(+0.308)#10,728 |
| 22. | 33176 | 5.3% | 6.1%(-0.816)#554 | 5.3%(-0.011)#11,856 |
| 23. | 33169 | 5.3% | 6.1%(-0.830)#559 | 5.3%(-0.026)#11,921 |
| 24. | 33174 | 5.1% | 6.1%(-0.970)#583 | 5.3%(-0.166)#12,465 |
| 25. | 33137 | 5.1% | 6.1%(-1.04)#592 | 5.3%(-0.234)#12,728 |
| 26. | 33157 | 4.9% | 6.1%(-1.20)#613 | 5.3%(-0.390)#13,373 |
| 27. | 33130 | 4.9% | 6.1%(-1.23)#620 | 5.3%(-0.429)#13,522 |
| 28. | 33146 | 4.8% | 6.1%(-1.33)#637 | 5.3%(-0.524)#13,903 |
| 29. | 33166 | 4.7% | 6.1%(-1.36)#641 | 5.3%(-0.553)#14,027 |
| 30. | 33193 | 4.6% | 6.1%(-1.52)#656 | 5.3%(-0.718)#14,751 |
| 31. | 33186 | 4.5% | 6.1%(-1.55)#658 | 5.3%(-0.742)#14,845 |
| 32. | 33190 | 4.4% | 6.1%(-1.64)#665 | 5.3%(-0.838)#15,211 |
| 33. | 33194 | 4.4% | 6.1%(-1.66)#669 | 5.3%(-0.858)#15,304 |
| 34. | 33178 | 4.4% | 6.1%(-1.73)#675 | 5.3%(-0.921)#15,582 |
| 35. | 33173 | 4.3% | 6.1%(-1.80)#685 | 5.3%(-0.999)#15,937 |
| 36. | 33177 | 4.1% | 6.1%(-1.99)#710 | 5.3%(-1.19)#16,711 |
| 37. | 33134 | 4.1% | 6.1%(-2.01)#712 | 5.3%(-1.20)#16,778 |
| 38. | 33196 | 3.9% | 6.1%(-2.19)#737 | 5.3%(-1.39)#17,540 |
| 39. | 33133 | 3.9% | 6.1%(-2.23)#743 | 5.3%(-1.42)#17,696 |
| 40. | 33189 | 3.7% | 6.1%(-2.43)#773 | 5.3%(-1.62)#18,515 |
| 41. | 33165 | 3.5% | 6.1%(-2.60)#784 | 5.3%(-1.80)#19,247 |
| 42. | 33155 | 3.5% | 6.1%(-2.61)#785 | 5.3%(-1.81)#19,298 |
| 43. | 33144 | 3.3% | 6.1%(-2.78)#805 | 5.3%(-1.97)#20,008 |
| 44. | 33170 | 3.3% | 6.1%(-2.78)#806 | 5.3%(-1.97)#20,021 |
| 45. | 33182 | 3.2% | 6.1%(-2.90)#812 | 5.3%(-2.10)#20,530 |
| 46. | 33129 | 3.0% | 6.1%(-3.04)#817 | 5.3%(-2.24)#21,064 |
| 47. | 33180 | 2.9% | 6.1%(-3.20)#829 | 5.3%(-2.40)#21,704 |
| 48. | 33156 | 2.9% | 6.1%(-3.23)#830 | 5.3%(-2.43)#21,815 |
| 49. | 33187 | 2.8% | 6.1%(-3.26)#832 | 5.3%(-2.45)#21,922 |
| 50. | 33131 | 2.8% | 6.1%(-3.31)#836 | 5.3%(-2.50)#22,117 |
| 51. | 33175 | 2.3% | 6.1%(-3.77)#868 | 5.3%(-2.97)#23,722 |
| 52. | 33185 | 2.3% | 6.1%(-3.82)#873 | 5.3%(-3.02)#23,881 |
| 53. | 33143 | 1.4% | 6.1%(-4.67)#910 | 5.3%(-3.87)#26,174 |
| 54. | 33158 | 1.3% | 6.1%(-4.77)#912 | 5.3%(-3.96)#26,349 |
| 55. | 33122 | 1.2% | 6.1%(-4.88)#915 | 5.3%(-4.08)#26,579 |
1
Common Questions
What are the Top 10 Zip Codes with the Highest Percentage of Population Employed in Food Preparation & Serving in Miami, FL?
Top 10 Zip Codes with the Highest Percentage of Population Employed in Food Preparation & Serving in Miami, FL are:
What zip code has the Highest Percentage of Population Employed in Food Preparation & Serving in Miami, FL?
33136 has the Highest Percentage of Population Employed in Food Preparation & Serving in Miami, FL with 11.6%.
What is the Percentage of Population Employed in Food Preparation & Serving in Miami, FL?
Percentage of Population Employed in Food Preparation & Serving in Miami is 6.9%.
What is the Percentage of Population Employed in Food Preparation & Serving in Florida?
Percentage of Population Employed in Food Preparation & Serving in Florida is 6.1%.
What is the Percentage of Population Employed in Food Preparation & Serving in the United States?
Percentage of Population Employed in Food Preparation & Serving in the United States is 5.3%.