East Williston, FL Map & Demographics
East Williston Map
East Williston Overview
$13,011
PER CAPITA INCOME
$21,627
AVG FAMILY INCOME
24.5%
WAGE / INCOME GAP [ % ]
75.5¢/ $1
WAGE / INCOME GAP [ $ ]
$8,821
FAMILY INCOME DEFICIT
0.48
INEQUALITY / GINI INDEX
674
TOTAL POPULATION
253
MALE POPULATION
421
FEMALE POPULATION
60.10
MALES / 100 FEMALES
166.40
FEMALES / 100 MALES
55.2
MEDIAN AGE
2.7
AVG FAMILY SIZE
2.0
AVG HOUSEHOLD SIZE
221
LABOR FORCE [ PEOPLE ]
37.7%
PERCENT IN LABOR FORCE
13.6%
UNEMPLOYMENT RATE
Income in East Williston
Income Overview in East Williston
| Characteristic | Number | Measure |
| Per Capita Income | 674 | $13,011 |
| Median Family Income | 182 | $21,627 |
| Mean Family Income | 182 | $27,273 |
| Median Household Income | 328 | $0 |
| Mean Household Income | 328 | $21,371 |
| Income Deficit | 182 | $8,821 |
| Wage / Income Gap (%) | 674 | 24.53% |
| Wage / Income Gap ($) | 674 | 75.47¢ per $1 |
| Gini / Inequality Index | 674 | 0.48 |
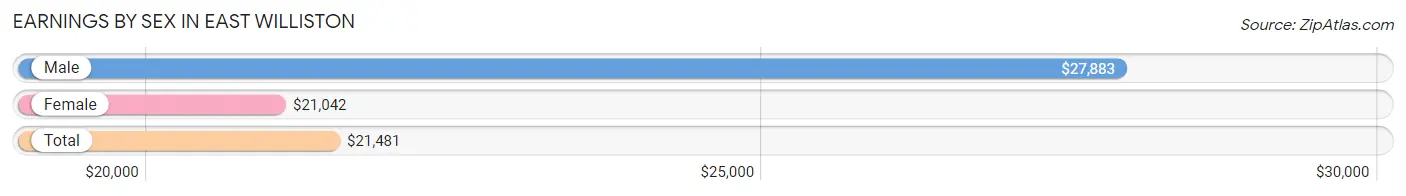
Earnings by Sex in East Williston
Average Earnings in East Williston are $21,481, $27,883 for men and $21,042 for women, a difference of 24.5%.
| Sex | Number | Average Earnings |
| Male | 113 (46.3%) | $27,883 |
| Female | 131 (53.7%) | $21,042 |
| Total | 244 (100.0%) | $21,481 |
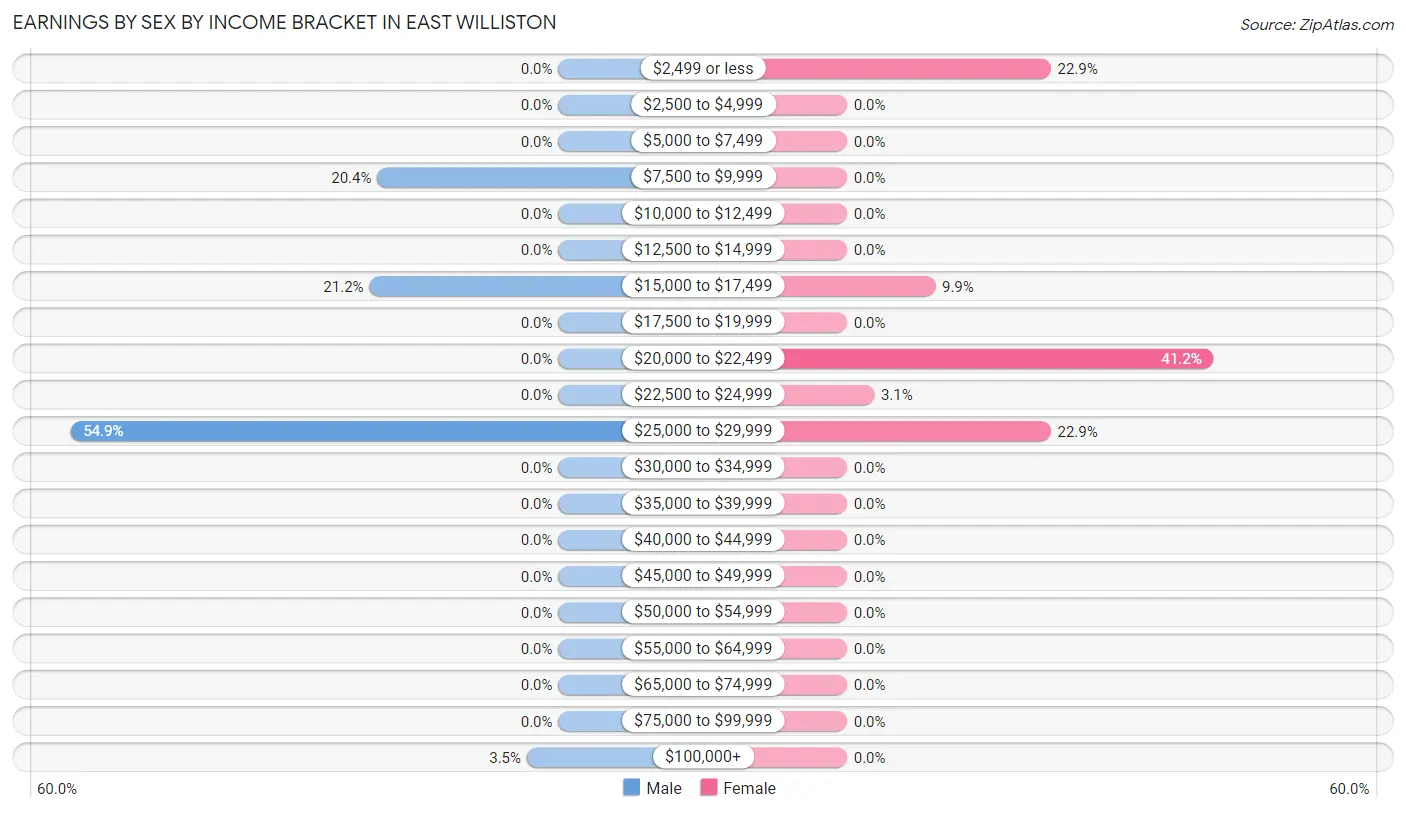
Earnings by Sex by Income Bracket in East Williston
The most common earnings brackets in East Williston are $25,000 to $29,999 for men (62 | 54.9%) and $20,000 to $22,499 for women (54 | 41.2%).
| Income | Male | Female |
| $2,499 or less | 0 (0.0%) | 30 (22.9%) |
| $2,500 to $4,999 | 0 (0.0%) | 0 (0.0%) |
| $5,000 to $7,499 | 0 (0.0%) | 0 (0.0%) |
| $7,500 to $9,999 | 23 (20.3%) | 0 (0.0%) |
| $10,000 to $12,499 | 0 (0.0%) | 0 (0.0%) |
| $12,500 to $14,999 | 0 (0.0%) | 0 (0.0%) |
| $15,000 to $17,499 | 24 (21.2%) | 13 (9.9%) |
| $17,500 to $19,999 | 0 (0.0%) | 0 (0.0%) |
| $20,000 to $22,499 | 0 (0.0%) | 54 (41.2%) |
| $22,500 to $24,999 | 0 (0.0%) | 4 (3.0%) |
| $25,000 to $29,999 | 62 (54.9%) | 30 (22.9%) |
| $30,000 to $34,999 | 0 (0.0%) | 0 (0.0%) |
| $35,000 to $39,999 | 0 (0.0%) | 0 (0.0%) |
| $40,000 to $44,999 | 0 (0.0%) | 0 (0.0%) |
| $45,000 to $49,999 | 0 (0.0%) | 0 (0.0%) |
| $50,000 to $54,999 | 0 (0.0%) | 0 (0.0%) |
| $55,000 to $64,999 | 0 (0.0%) | 0 (0.0%) |
| $65,000 to $74,999 | 0 (0.0%) | 0 (0.0%) |
| $75,000 to $99,999 | 0 (0.0%) | 0 (0.0%) |
| $100,000+ | 4 (3.5%) | 0 (0.0%) |
| Total | 113 (100.0%) | 131 (100.0%) |
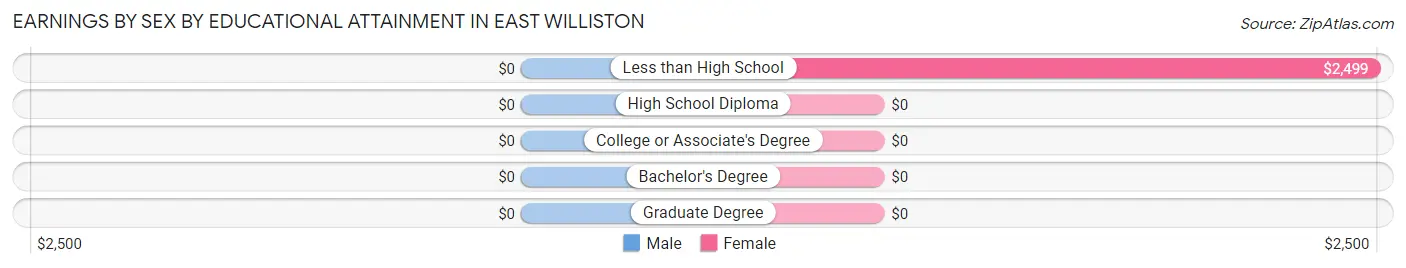
Earnings by Sex by Educational Attainment in East Williston
| Educational Attainment | Male Income | Female Income |
| Less than High School | - | - |
| High School Diploma | - | - |
| College or Associate's Degree | - | - |
| Bachelor's Degree | - | - |
| Graduate Degree | - | - |
| Total | $27,883 | $21,042 |
Family Income in East Williston
Family Income Brackets in East Williston
According to the East Williston family income data, there are 78 families falling into the $15,000 to $24,999 income range, which is the most common income bracket and makes up 42.9% of all families.
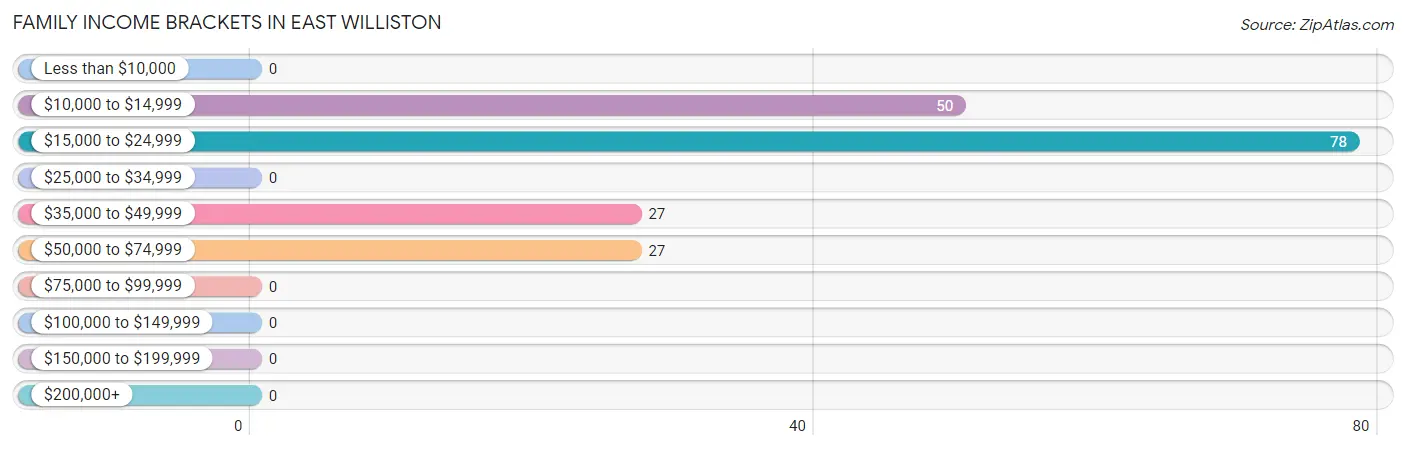
| Income Bracket | # Families | % Families |
| Less than $10,000 | 0 | 0.0% |
| $10,000 to $14,999 | 50 | 27.5% |
| $15,000 to $24,999 | 78 | 42.9% |
| $25,000 to $34,999 | 0 | 0.0% |
| $35,000 to $49,999 | 27 | 14.8% |
| $50,000 to $74,999 | 27 | 14.8% |
| $75,000 to $99,999 | 0 | 0.0% |
| $100,000 to $149,999 | 0 | 0.0% |
| $150,000 to $199,999 | 0 | 0.0% |
| $200,000+ | 0 | 0.0% |
Family Income by Famaliy Size in East Williston
2-person families (75 | 41.2%) account for the highest median family income in East Williston with $23,917 per family, while 2-person families (75 | 41.2%) have the highest median income of $11,958 per family member.
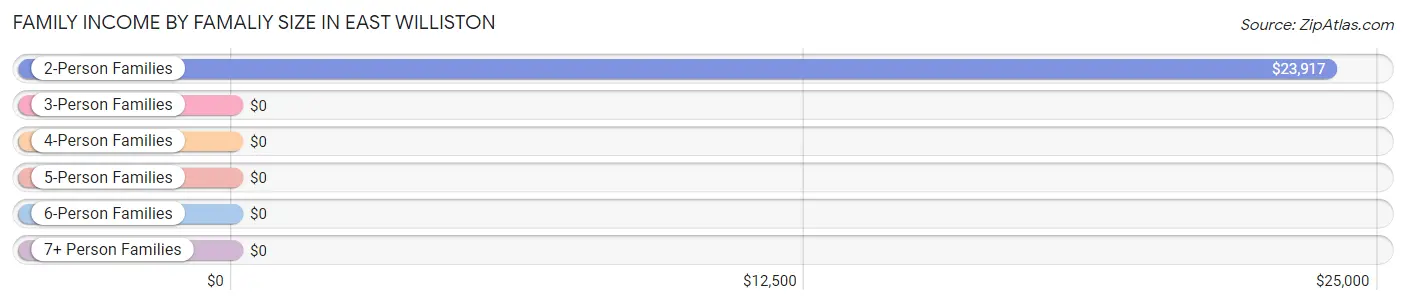
| Income Bracket | # Families | Median Income |
| 2-Person Families | 75 (41.2%) | $23,917 |
| 3-Person Families | 49 (26.9%) | $0 |
| 4-Person Families | 54 (29.7%) | $0 |
| 5-Person Families | 4 (2.2%) | $0 |
| 6-Person Families | 0 (0.0%) | $0 |
| 7+ Person Families | 0 (0.0%) | $0 |
| Total | 182 (100.0%) | $21,627 |
Family Income by Number of Earners in East Williston
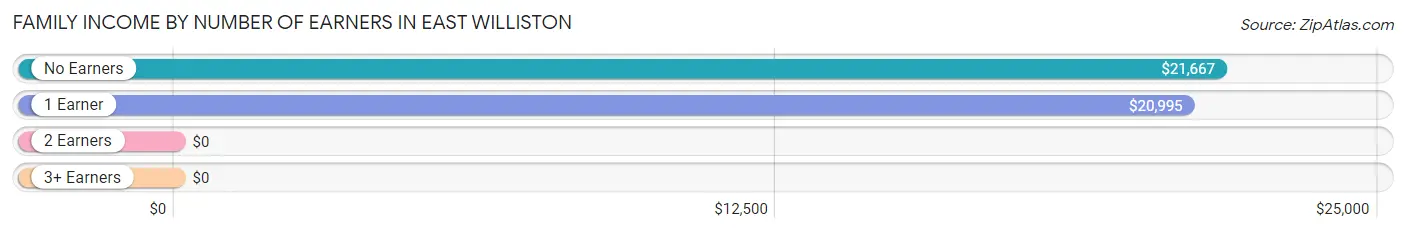
| Number of Earners | # Families | Median Income |
| No Earners | 52 (28.6%) | $21,667 |
| 1 Earner | 103 (56.6%) | $20,995 |
| 2 Earners | 27 (14.8%) | $0 |
| 3+ Earners | 0 (0.0%) | $0 |
| Total | 182 (100.0%) | $21,627 |
Household Income in East Williston
Household Income Brackets in East Williston
With 96 households falling in the category, the less than $10,000 income range is the most frequent in East Williston, accounting for 29.3% of all households.
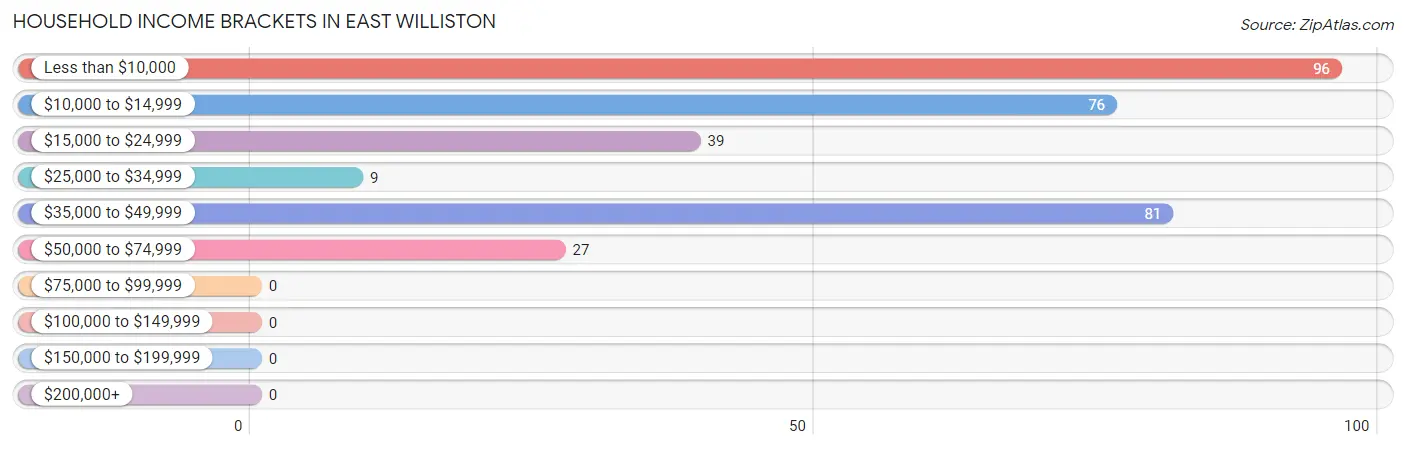
| Income Bracket | # Households | % Households |
| Less than $10,000 | 96 | 29.3% |
| $10,000 to $14,999 | 76 | 23.2% |
| $15,000 to $24,999 | 39 | 11.9% |
| $25,000 to $34,999 | 9 | 2.7% |
| $35,000 to $49,999 | 81 | 24.7% |
| $50,000 to $74,999 | 27 | 8.2% |
| $75,000 to $99,999 | 0 | 0.0% |
| $100,000 to $149,999 | 0 | 0.0% |
| $150,000 to $199,999 | 0 | 0.0% |
| $200,000+ | 0 | 0.0% |
Household Income by Householder Age in East Williston
The median household income in East Williston is $0, with the highest median household income of $37,523 found in the 25 to 44 years age bracket for the primary householder. A total of 107 households (32.6%) fall into this category.
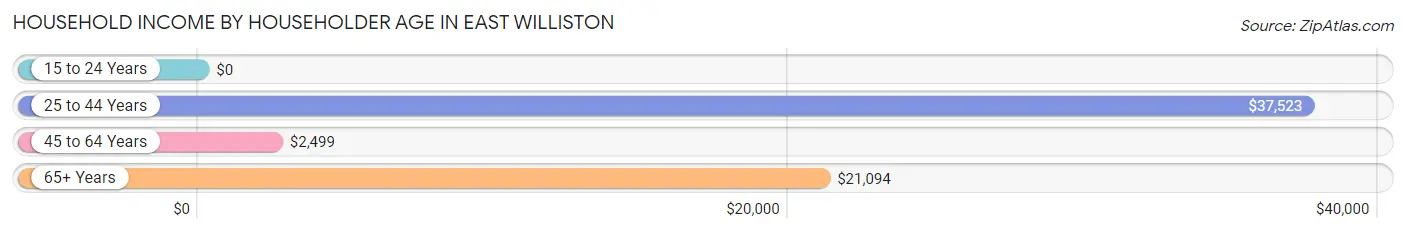
| Income Bracket | # Households | Median Income |
| 15 to 24 Years | 0 (0.0%) | $0 |
| 25 to 44 Years | 107 (32.6%) | $37,523 |
| 45 to 64 Years | 92 (28.1%) | $2,499 |
| 65+ Years | 129 (39.3%) | $21,094 |
| Total | 328 (100.0%) | $0 |
Poverty in East Williston
Income Below Poverty by Sex and Age in East Williston
With 40.7% poverty level for males and 63.7% for females among the residents of East Williston, 16 and 17 year old males and 6 to 11 year old females are the most vulnerable to poverty, with 28 males (100.0%) and 43 females (100.0%) in their respective age groups living below the poverty level.
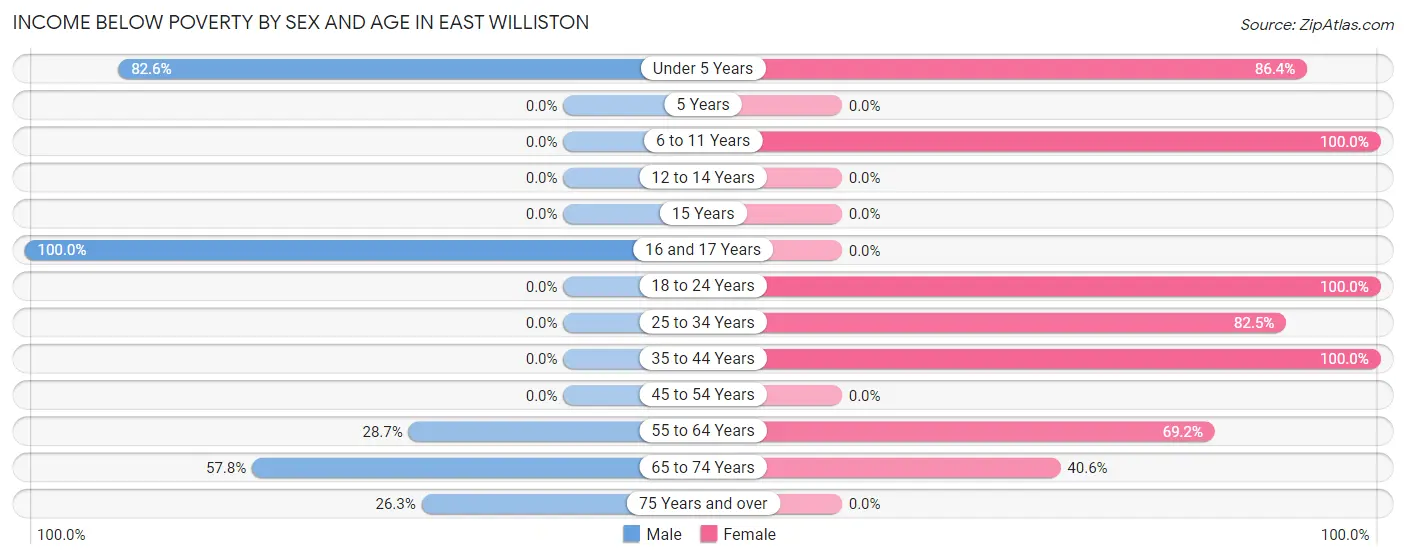
| Age Bracket | Male | Female |
| Under 5 Years | 19 (82.6%) | 19 (86.4%) |
| 5 Years | 0 (0.0%) | 0 (0.0%) |
| 6 to 11 Years | 0 (0.0%) | 43 (100.0%) |
| 12 to 14 Years | 0 (0.0%) | 0 (0.0%) |
| 15 Years | 0 (0.0%) | 0 (0.0%) |
| 16 and 17 Years | 28 (100.0%) | 0 (0.0%) |
| 18 to 24 Years | 0 (0.0%) | 5 (100.0%) |
| 25 to 34 Years | 0 (0.0%) | 80 (82.5%) |
| 35 to 44 Years | 0 (0.0%) | 30 (100.0%) |
| 45 to 54 Years | 0 (0.0%) | 0 (0.0%) |
| 55 to 64 Years | 25 (28.7%) | 63 (69.2%) |
| 65 to 74 Years | 26 (57.8%) | 28 (40.6%) |
| 75 Years and over | 5 (26.3%) | 0 (0.0%) |
| Total | 103 (40.7%) | 268 (63.7%) |
Income Above Poverty by Sex and Age in East Williston
According to the poverty statistics in East Williston, males aged 25 to 34 years and females aged 45 to 54 years are the age groups that are most secure financially, with 100.0% of males and 100.0% of females in these age groups living above the poverty line.
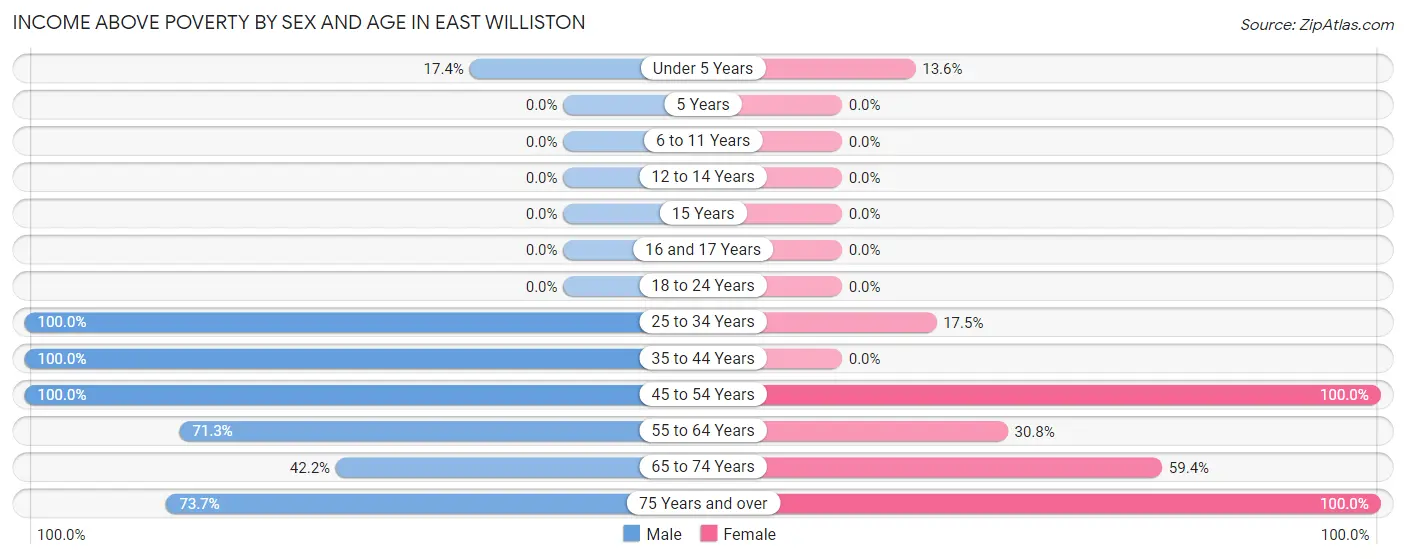
| Age Bracket | Male | Female |
| Under 5 Years | 4 (17.4%) | 3 (13.6%) |
| 5 Years | 0 (0.0%) | 0 (0.0%) |
| 6 to 11 Years | 0 (0.0%) | 0 (0.0%) |
| 12 to 14 Years | 0 (0.0%) | 0 (0.0%) |
| 15 Years | 0 (0.0%) | 0 (0.0%) |
| 16 and 17 Years | 0 (0.0%) | 0 (0.0%) |
| 18 to 24 Years | 0 (0.0%) | 0 (0.0%) |
| 25 to 34 Years | 24 (100.0%) | 17 (17.5%) |
| 35 to 44 Years | 23 (100.0%) | 0 (0.0%) |
| 45 to 54 Years | 4 (100.0%) | 30 (100.0%) |
| 55 to 64 Years | 62 (71.3%) | 28 (30.8%) |
| 65 to 74 Years | 19 (42.2%) | 41 (59.4%) |
| 75 Years and over | 14 (73.7%) | 34 (100.0%) |
| Total | 150 (59.3%) | 153 (36.3%) |
Income Below Poverty Among Married-Couple Families in East Williston
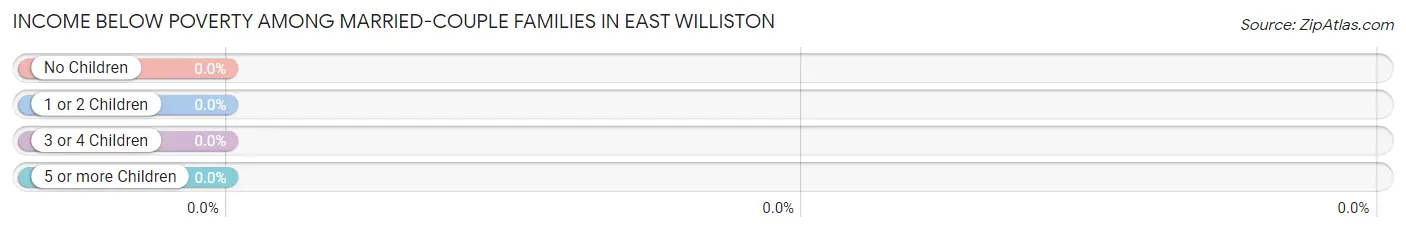
| Children | Above Poverty | Below Poverty |
| No Children | 55 (100.0%) | 0 (0.0%) |
| 1 or 2 Children | 0 (0.0%) | 0 (0.0%) |
| 3 or 4 Children | 0 (0.0%) | 0 (0.0%) |
| 5 or more Children | 0 (0.0%) | 0 (0.0%) |
| Total | 55 (100.0%) | 0 (0.0%) |
Income Below Poverty Among Single-Parent Households in East Williston
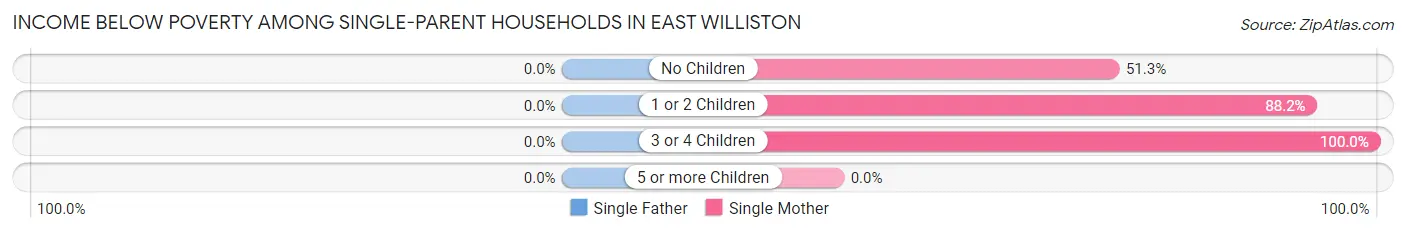
| Children | Single Father | Single Mother |
| No Children | 0 (0.0%) | 20 (51.3%) |
| 1 or 2 Children | 0 (0.0%) | 30 (88.2%) |
| 3 or 4 Children | 0 (0.0%) | 54 (100.0%) |
| 5 or more Children | 0 (0.0%) | 0 (0.0%) |
| Total | 0 (0.0%) | 104 (81.9%) |
Income Below Poverty Among Married-Couple vs Single-Parent Households in East Williston
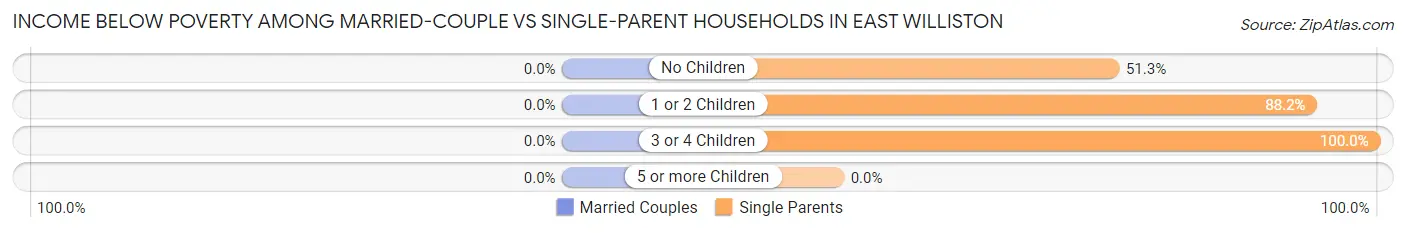
| Children | Married-Couple Families | Single-Parent Households |
| No Children | 0 (0.0%) | 20 (51.3%) |
| 1 or 2 Children | 0 (0.0%) | 30 (88.2%) |
| 3 or 4 Children | 0 (0.0%) | 54 (100.0%) |
| 5 or more Children | 0 (0.0%) | 0 (0.0%) |
| Total | 0 (0.0%) | 104 (81.9%) |
Race in East Williston
The most populous races in East Williston are Black / African American (458 | 67.9%), and White / Caucasian (216 | 32.1%).
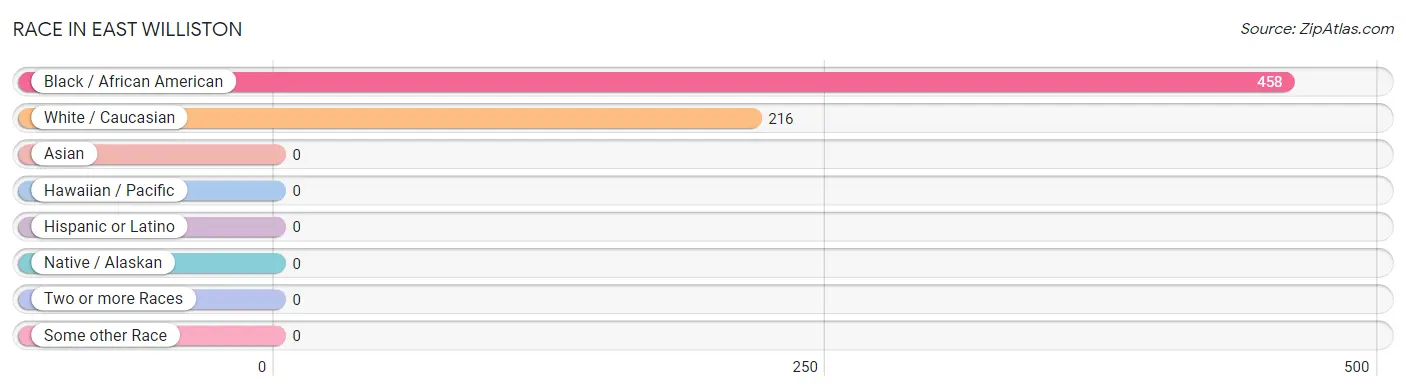
| Race | # Population | % Population |
| Asian | 0 | 0.0% |
| Black / African American | 458 | 67.9% |
| Hawaiian / Pacific | 0 | 0.0% |
| Hispanic or Latino | 0 | 0.0% |
| Native / Alaskan | 0 | 0.0% |
| White / Caucasian | 216 | 32.1% |
| Two or more Races | 0 | 0.0% |
| Some other Race | 0 | 0.0% |
| Total | 674 | 100.0% |
Ancestry in East Williston
The most populous ancestries reported in East Williston are African (73 | 10.8%), Subsaharan African (73 | 10.8%), English (23 | 3.4%), American (18 | 2.7%), and Irish (18 | 2.7%), together accounting for 30.4% of all East Williston residents.
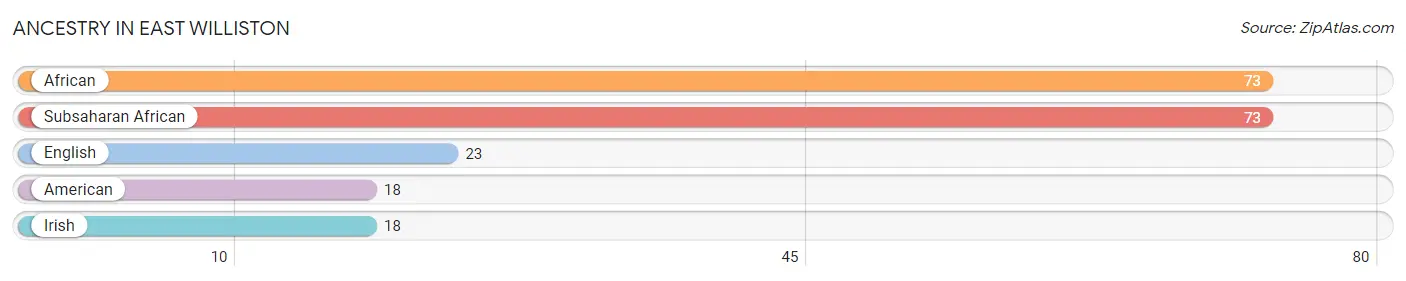
| Ancestry | # Population | % Population |
| African | 73 | 10.8% |
| American | 18 | 2.7% |
| English | 23 | 3.4% |
| Irish | 18 | 2.7% |
| Subsaharan African | 73 | 10.8% | View All 5 Rows |
Immigrants in East Williston

| Immigration Origin | # Population | % Population | View All 0 Rows |
Sex and Age in East Williston
Sex and Age in East Williston
The most populous age groups in East Williston are 55 to 59 Years (62 | 24.5%) for men and 55 to 59 Years (91 | 21.6%) for women.
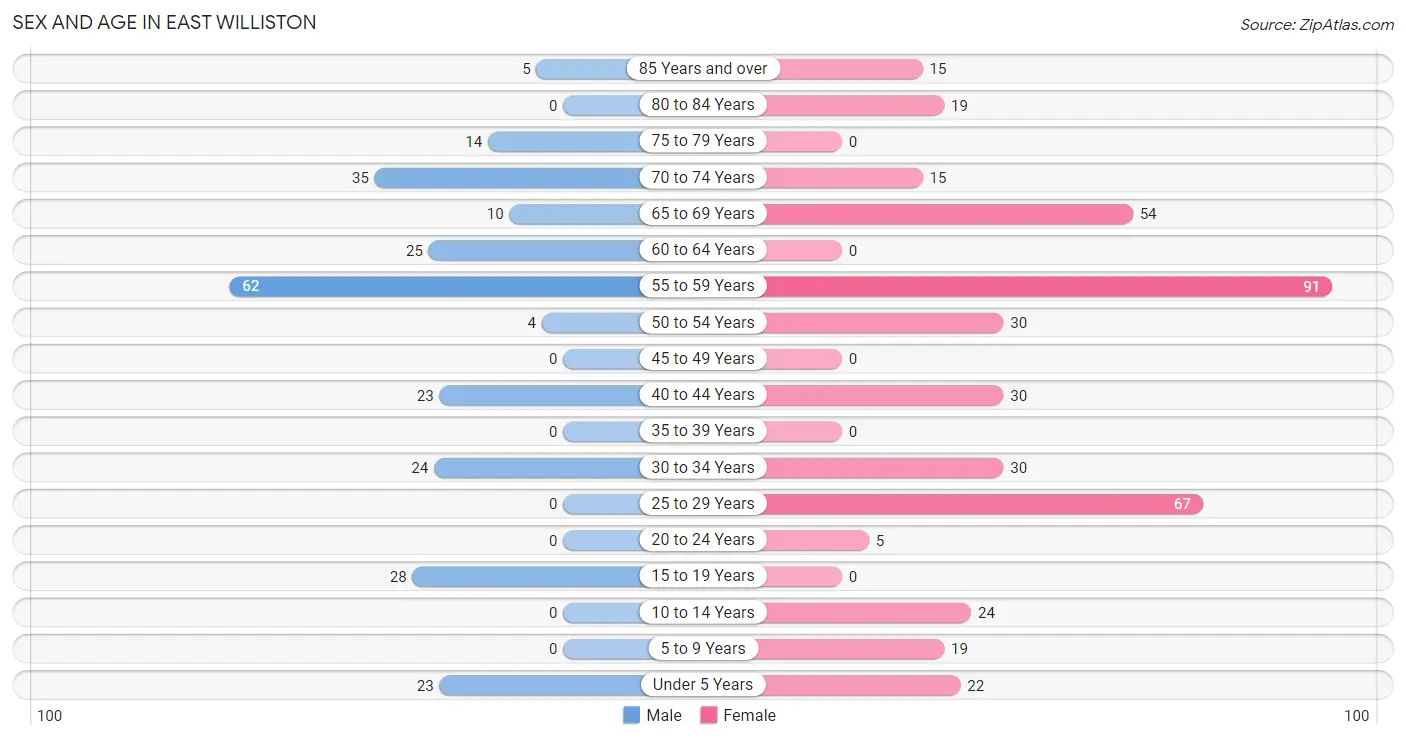
| Age Bracket | Male | Female |
| Under 5 Years | 23 (9.1%) | 22 (5.2%) |
| 5 to 9 Years | 0 (0.0%) | 19 (4.5%) |
| 10 to 14 Years | 0 (0.0%) | 24 (5.7%) |
| 15 to 19 Years | 28 (11.1%) | 0 (0.0%) |
| 20 to 24 Years | 0 (0.0%) | 5 (1.2%) |
| 25 to 29 Years | 0 (0.0%) | 67 (15.9%) |
| 30 to 34 Years | 24 (9.5%) | 30 (7.1%) |
| 35 to 39 Years | 0 (0.0%) | 0 (0.0%) |
| 40 to 44 Years | 23 (9.1%) | 30 (7.1%) |
| 45 to 49 Years | 0 (0.0%) | 0 (0.0%) |
| 50 to 54 Years | 4 (1.6%) | 30 (7.1%) |
| 55 to 59 Years | 62 (24.5%) | 91 (21.6%) |
| 60 to 64 Years | 25 (9.9%) | 0 (0.0%) |
| 65 to 69 Years | 10 (4.0%) | 54 (12.8%) |
| 70 to 74 Years | 35 (13.8%) | 15 (3.6%) |
| 75 to 79 Years | 14 (5.5%) | 0 (0.0%) |
| 80 to 84 Years | 0 (0.0%) | 19 (4.5%) |
| 85 Years and over | 5 (2.0%) | 15 (3.6%) |
| Total | 253 (100.0%) | 421 (100.0%) |
Families and Households in East Williston
Median Family Size in East Williston
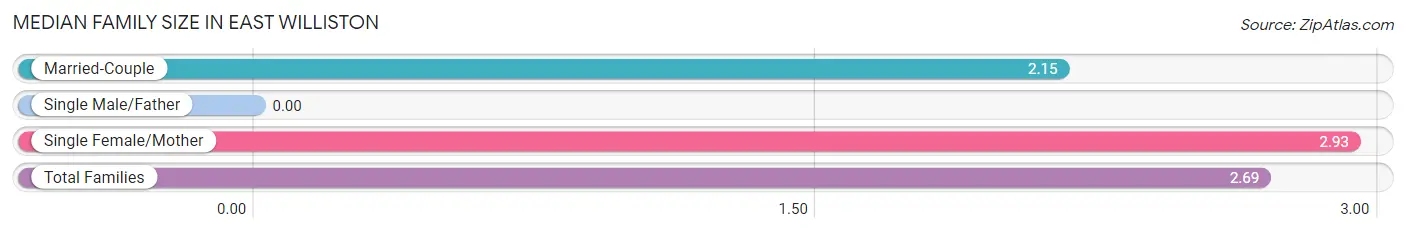
| Family Type | # Families | Family Size |
| Married-Couple | 55 (30.2%) | 2.15 |
| Single Male/Father | 0 (0.0%) | - |
| Single Female/Mother | 127 (69.8%) | 2.93 |
| Total Families | 182 (100.0%) | 2.69 |
Median Household Size in East Williston
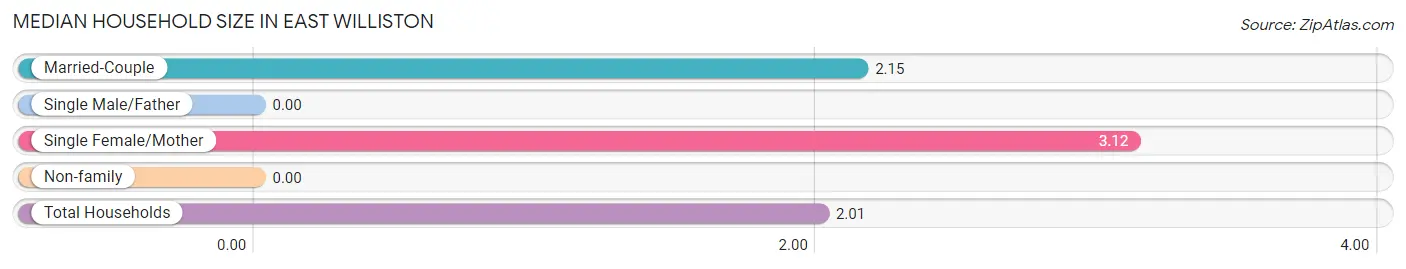
| Household Type | # Households | Household Size |
| Married-Couple | 55 (16.8%) | 2.15 |
| Single Male/Father | 0 (0.0%) | - |
| Single Female/Mother | 127 (38.7%) | 3.12 |
| Non-family | 146 (44.5%) | - |
| Total Households | 328 (100.0%) | 2.01 |
Household Size by Marriage Status in East Williston
Out of a total of 328 households in East Williston, 182 (55.5%) are family households, while 146 (44.5%) are nonfamily households. The most numerous type of family households are 2-person households, comprising 75, and the most common type of nonfamily households are 1-person households, comprising 146.
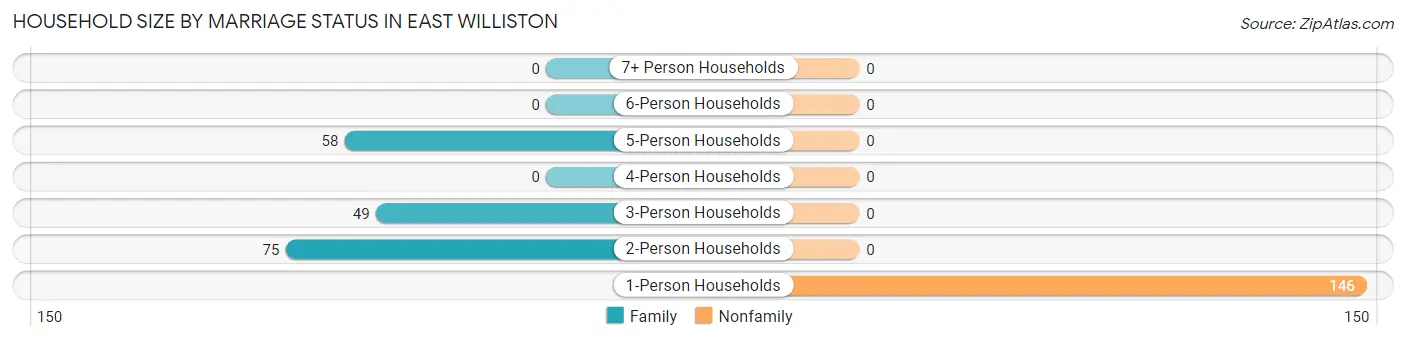
| Household Size | Family Households | Nonfamily Households |
| 1-Person Households | - | 146 (44.5%) |
| 2-Person Households | 75 (22.9%) | 0 (0.0%) |
| 3-Person Households | 49 (14.9%) | 0 (0.0%) |
| 4-Person Households | 0 (0.0%) | 0 (0.0%) |
| 5-Person Households | 58 (17.7%) | 0 (0.0%) |
| 6-Person Households | 0 (0.0%) | 0 (0.0%) |
| 7+ Person Households | 0 (0.0%) | 0 (0.0%) |
| Total | 182 (55.5%) | 146 (44.5%) |
Female Fertility in East Williston
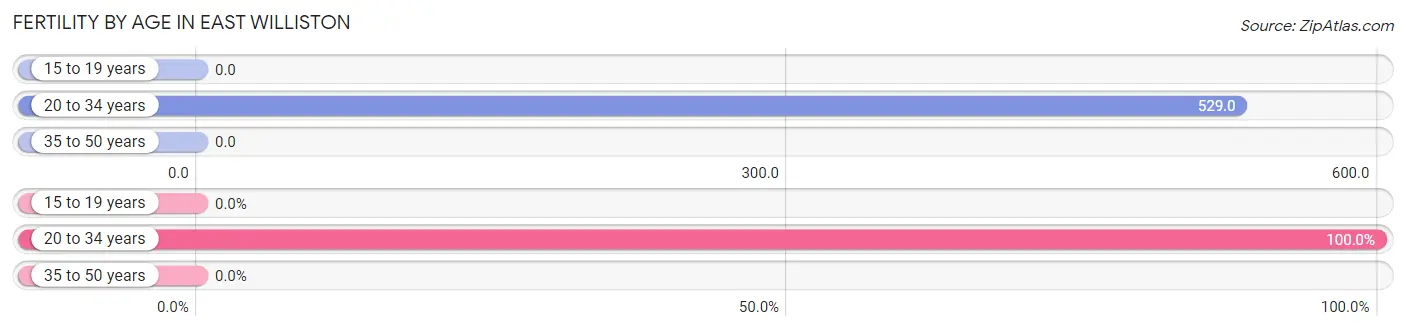
Fertility by Age in East Williston
Average fertility rate in East Williston is 409.0 births per 1,000 women. Women in the age bracket of 20 to 34 years have the highest fertility rate with 529.0 births per 1,000 women. Women in the age bracket of 20 to 34 years acount for 100.0% of all women with births.
| Age Bracket | Women with Births | Births / 1,000 Women |
| 15 to 19 years | 0 (0.0%) | 0.0 |
| 20 to 34 years | 54 (100.0%) | 529.0 |
| 35 to 50 years | 0 (0.0%) | 0.0 |
| Total | 54 (100.0%) | 409.0 |
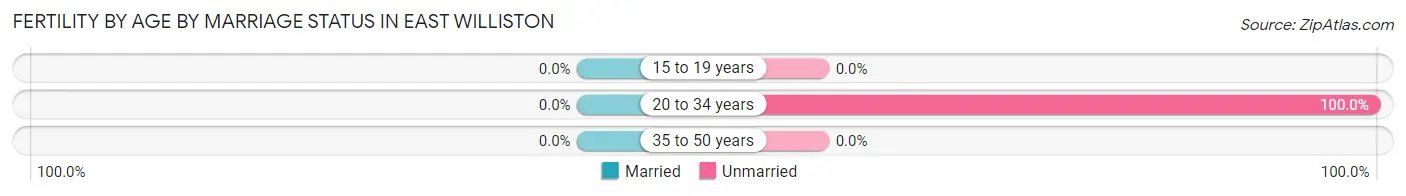
Fertility by Age by Marriage Status in East Williston
| Age Bracket | Married | Unmarried |
| 15 to 19 years | 0 (0.0%) | 0 (0.0%) |
| 20 to 34 years | 0 (0.0%) | 54 (100.0%) |
| 35 to 50 years | 0 (0.0%) | 0 (0.0%) |
| Total | 0 (0.0%) | 54 (100.0%) |
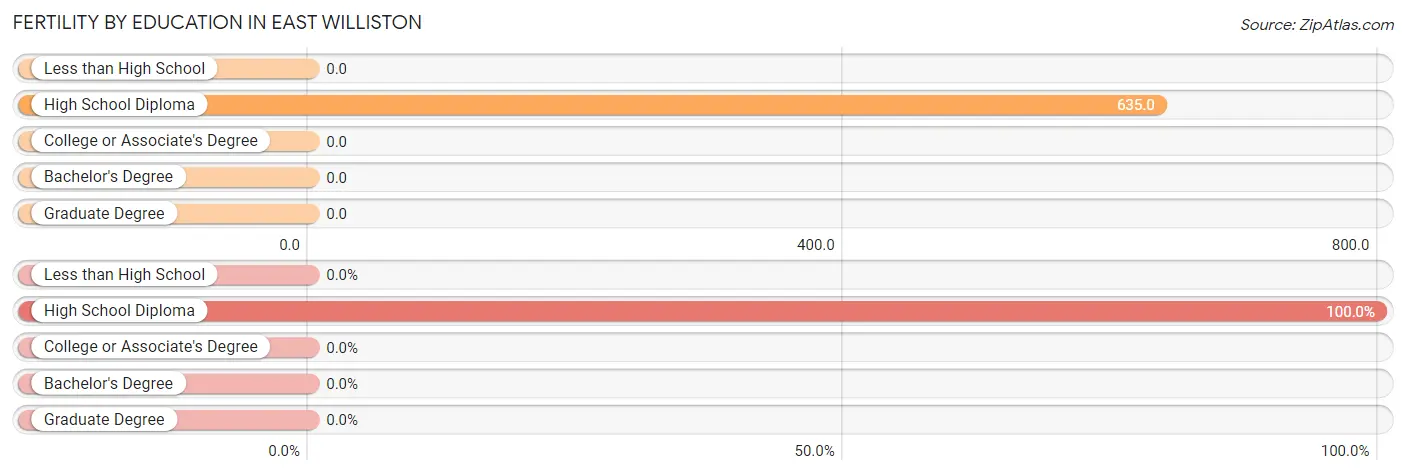
Fertility by Education in East Williston
| Educational Attainment | Women with Births | Births / 1,000 Women |
| Less than High School | 0 (0.0%) | 0.0 |
| High School Diploma | 54 (100.0%) | 635.0 |
| College or Associate's Degree | 0 (0.0%) | 0.0 |
| Bachelor's Degree | 0 (0.0%) | 0.0 |
| Graduate Degree | 0 (0.0%) | 0.0 |
| Total | 54 (100.0%) | 409.0 |
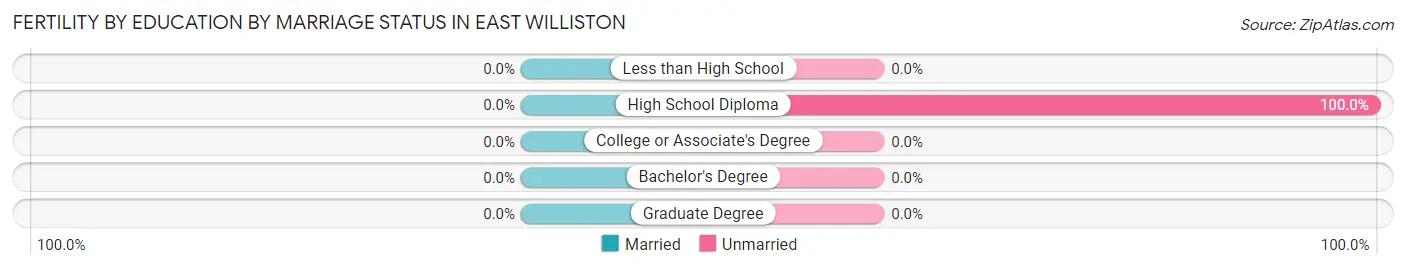
Fertility by Education by Marriage Status in East Williston
| Educational Attainment | Married | Unmarried |
| Less than High School | 0 (0.0%) | 0 (0.0%) |
| High School Diploma | 0 (0.0%) | 54 (100.0%) |
| College or Associate's Degree | 0 (0.0%) | 0 (0.0%) |
| Bachelor's Degree | 0 (0.0%) | 0 (0.0%) |
| Graduate Degree | 0 (0.0%) | 0 (0.0%) |
| Total | 0 (0.0%) | 54 (100.0%) |
Employment Characteristics in East Williston
Employment by Class of Employer in East Williston
Among the 191 employed individuals in East Williston, private company employees (129 | 67.5%), and local government employees (62 | 32.5%) make up the most common classes of employment.
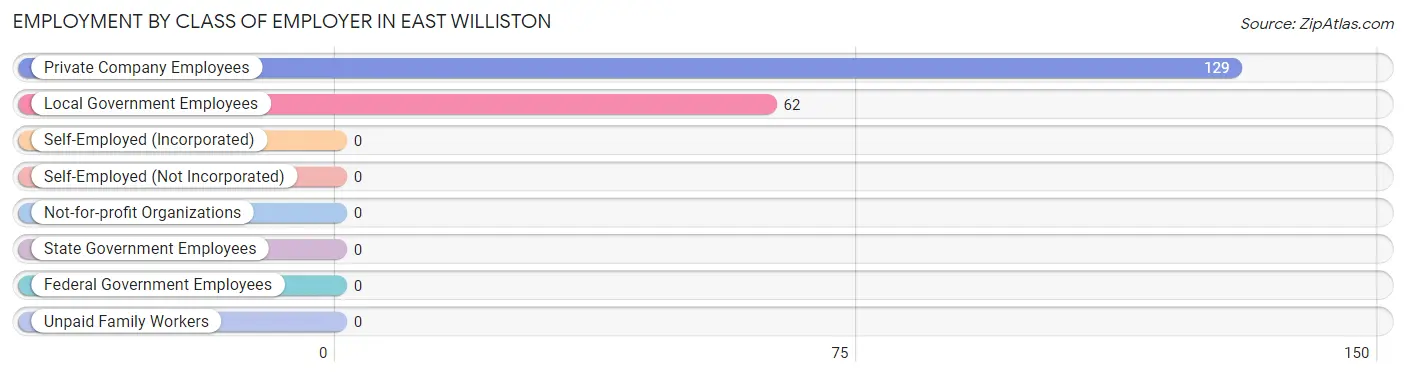
| Employer Class | # Employees | % Employees |
| Private Company Employees | 129 | 67.5% |
| Self-Employed (Incorporated) | 0 | 0.0% |
| Self-Employed (Not Incorporated) | 0 | 0.0% |
| Not-for-profit Organizations | 0 | 0.0% |
| Local Government Employees | 62 | 32.5% |
| State Government Employees | 0 | 0.0% |
| Federal Government Employees | 0 | 0.0% |
| Unpaid Family Workers | 0 | 0.0% |
| Total | 191 | 100.0% |
Employment Status by Age in East Williston
According to the labor force statistics for East Williston, out of the total population over 16 years of age (586), 37.7% or 221 individuals are in the labor force, with 13.6% or 30 of them unemployed. The age group with the highest labor force participation rate is 25 to 29 years, with 100.0% or 67 individuals in the labor force. Within the labor force, the 35 to 44 years age range has the highest percentage of unemployed individuals, with 100.0% or 30 of them being unemployed.
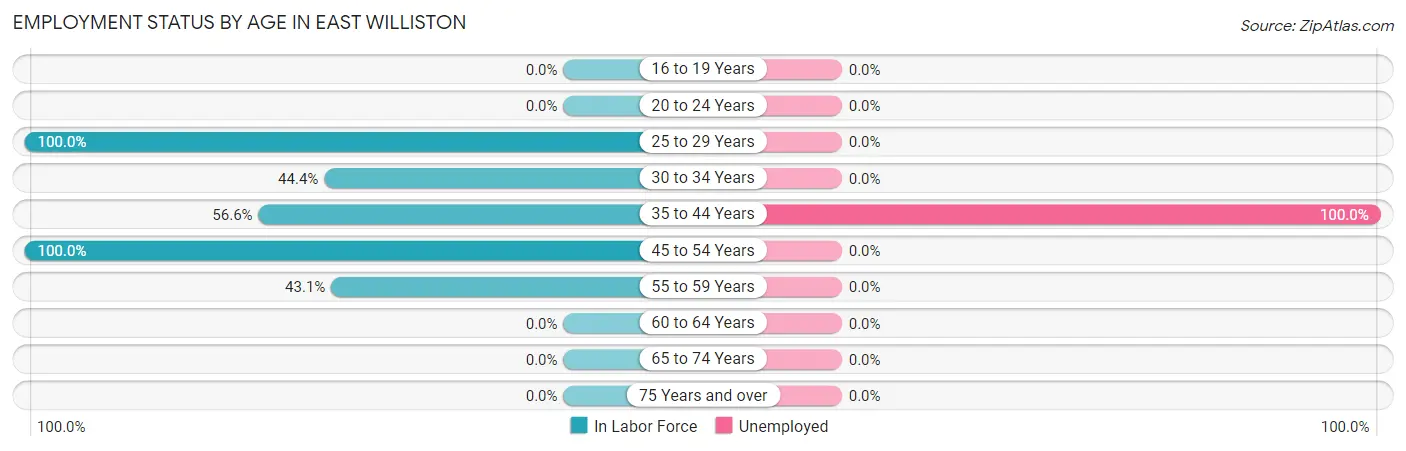
| Age Bracket | In Labor Force | Unemployed |
| 16 to 19 Years | 0 (0.0%) | 0 (0.0%) |
| 20 to 24 Years | 0 (0.0%) | 0 (0.0%) |
| 25 to 29 Years | 67 (100.0%) | 0 (0.0%) |
| 30 to 34 Years | 24 (44.4%) | 0 (0.0%) |
| 35 to 44 Years | 30 (56.6%) | 30 (100.0%) |
| 45 to 54 Years | 34 (100.0%) | 0 (0.0%) |
| 55 to 59 Years | 66 (43.1%) | 0 (0.0%) |
| 60 to 64 Years | 0 (0.0%) | 0 (0.0%) |
| 65 to 74 Years | 0 (0.0%) | 0 (0.0%) |
| 75 Years and over | 0 (0.0%) | 0 (0.0%) |
| Total | 221 (37.7%) | 30 (13.6%) |
Employment Status by Educational Attainment in East Williston
According to labor force statistics for East Williston, 57.3% of individuals (221) out of the total population between 25 and 64 years of age (386) are in the labor force, with 13.6% or 30 of them being unemployed. The group with the highest labor force participation rate are those with the educational attainment of bachelor's degree or higher, with 100.0% or 4 individuals in the labor force. Within the labor force, individuals with less than high school education have the highest percentage of unemployment, with 63.8% or 30 of them being unemployed.
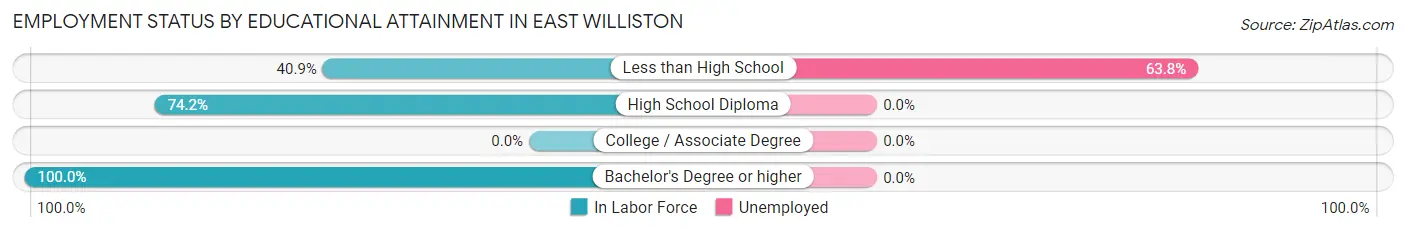
| Educational Attainment | In Labor Force | Unemployed |
| Less than High School | 47 (40.9%) | 73 (63.8%) |
| High School Diploma | 170 (74.2%) | 0 (0.0%) |
| College / Associate Degree | 0 (0.0%) | 0 (0.0%) |
| Bachelor's Degree or higher | 4 (100.0%) | 0 (0.0%) |
| Total | 221 (57.3%) | 52 (13.6%) |
Employment Occupations by Sex in East Williston
Management, Business, Science and Arts Occupations
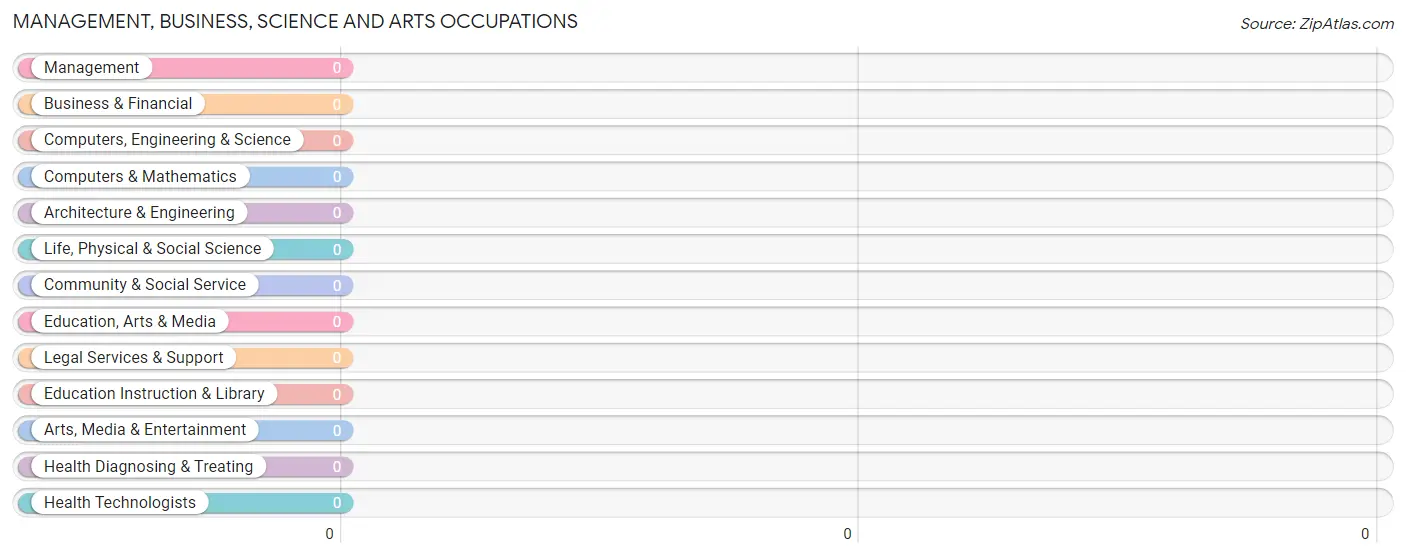
Management, Business, Science and Arts Occupations by Sex
| Occupation | Male | Female |
| Management | 0 (0.0%) | 0 (0.0%) |
| Business & Financial | 0 (0.0%) | 0 (0.0%) |
| Computers, Engineering & Science | 0 (0.0%) | 0 (0.0%) |
| Computers & Mathematics | 0 (0.0%) | 0 (0.0%) |
| Architecture & Engineering | 0 (0.0%) | 0 (0.0%) |
| Life, Physical & Social Science | 0 (0.0%) | 0 (0.0%) |
| Community & Social Service | 0 (0.0%) | 0 (0.0%) |
| Education, Arts & Media | 0 (0.0%) | 0 (0.0%) |
| Legal Services & Support | 0 (0.0%) | 0 (0.0%) |
| Education Instruction & Library | 0 (0.0%) | 0 (0.0%) |
| Arts, Media & Entertainment | 0 (0.0%) | 0 (0.0%) |
| Health Diagnosing & Treating | 0 (0.0%) | 0 (0.0%) |
| Health Technologists | 0 (0.0%) | 0 (0.0%) |
| Total (Category) | 0 (0.0%) | 0 (0.0%) |
| Total (Overall) | 90 (47.1%) | 101 (52.9%) |
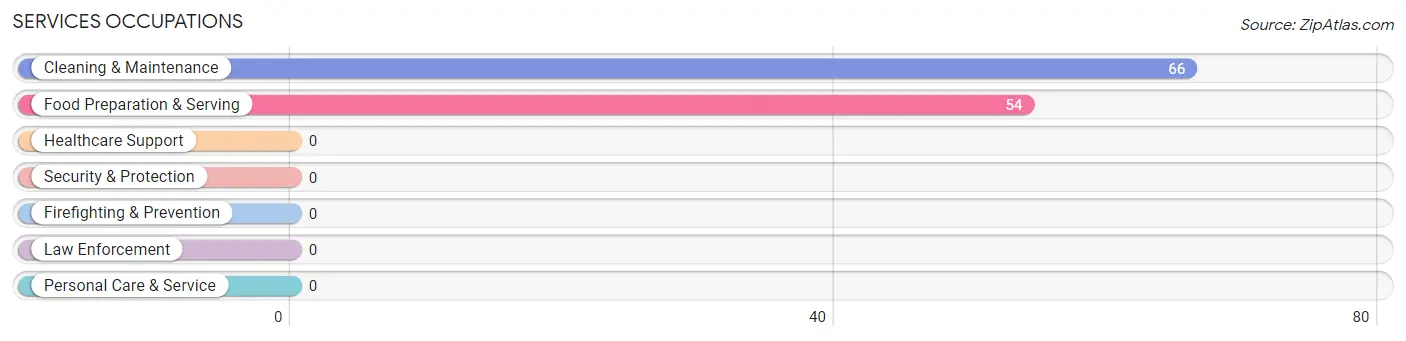
Services Occupations
The most common Services occupations in East Williston are Cleaning & Maintenance (66 | 34.5%), and Food Preparation & Serving (54 | 28.3%).
Services Occupations by Sex
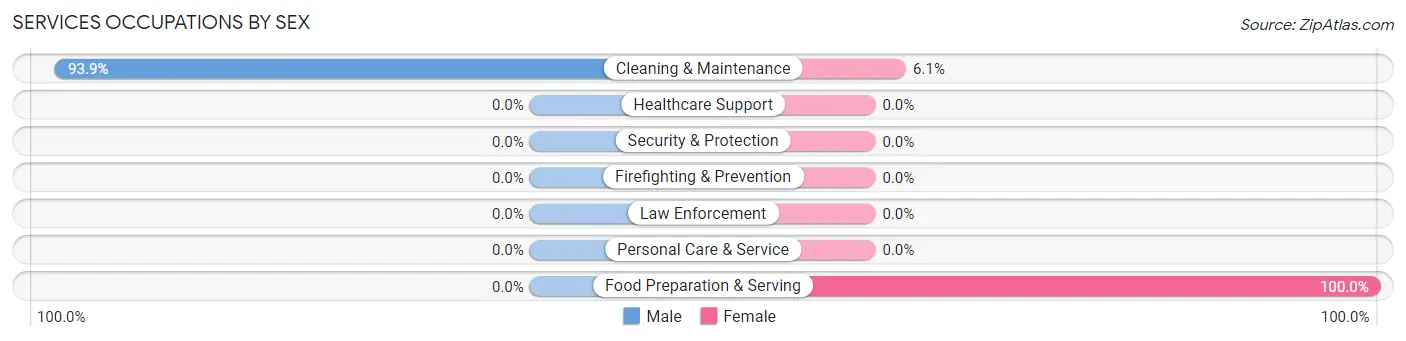
| Occupation | Male | Female |
| Healthcare Support | 0 (0.0%) | 0 (0.0%) |
| Security & Protection | 0 (0.0%) | 0 (0.0%) |
| Firefighting & Prevention | 0 (0.0%) | 0 (0.0%) |
| Law Enforcement | 0 (0.0%) | 0 (0.0%) |
| Food Preparation & Serving | 0 (0.0%) | 54 (100.0%) |
| Cleaning & Maintenance | 62 (93.9%) | 4 (6.1%) |
| Personal Care & Service | 0 (0.0%) | 0 (0.0%) |
| Total (Category) | 62 (51.7%) | 58 (48.3%) |
| Total (Overall) | 90 (47.1%) | 101 (52.9%) |
Sales and Office Occupations
The most common Sales and Office occupations in East Williston are Sales & Related (13 | 6.8%), and Office & Administration (4 | 2.1%).
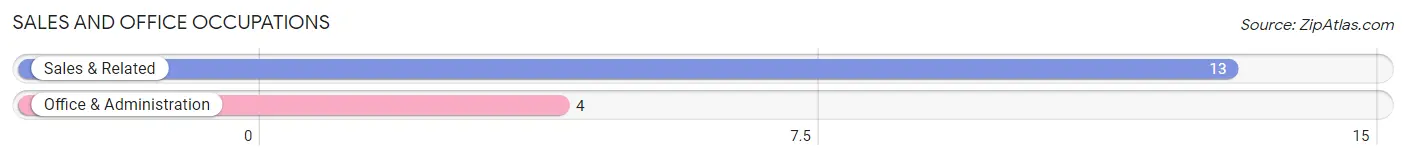
Sales and Office Occupations by Sex

| Occupation | Male | Female |
| Sales & Related | 0 (0.0%) | 13 (100.0%) |
| Office & Administration | 4 (100.0%) | 0 (0.0%) |
| Total (Category) | 4 (23.5%) | 13 (76.5%) |
| Total (Overall) | 90 (47.1%) | 101 (52.9%) |
Natural Resources, Construction and Maintenance Occupations
The most common Natural Resources, Construction and Maintenance occupations in East Williston are , and Construction & Extraction (24 | 12.6%).
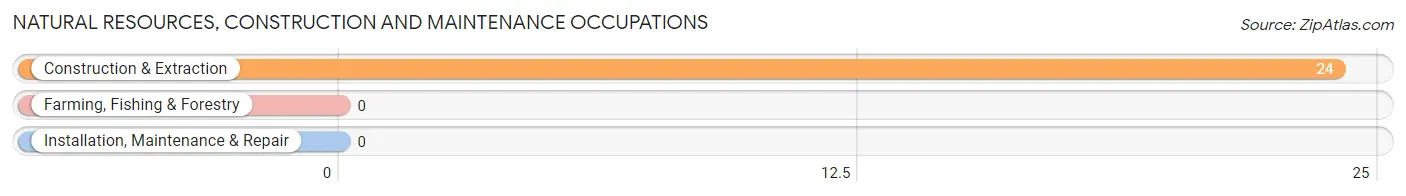
Natural Resources, Construction and Maintenance Occupations by Sex
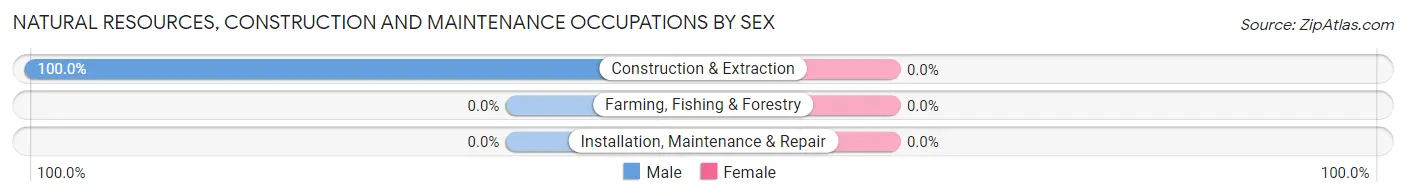
| Occupation | Male | Female |
| Farming, Fishing & Forestry | 0 (0.0%) | 0 (0.0%) |
| Construction & Extraction | 24 (100.0%) | 0 (0.0%) |
| Installation, Maintenance & Repair | 0 (0.0%) | 0 (0.0%) |
| Total (Category) | 24 (100.0%) | 0 (0.0%) |
| Total (Overall) | 90 (47.1%) | 101 (52.9%) |
Production, Transportation and Moving Occupations
The most common Production, Transportation and Moving occupations in East Williston are , and Production (30 | 15.7%).
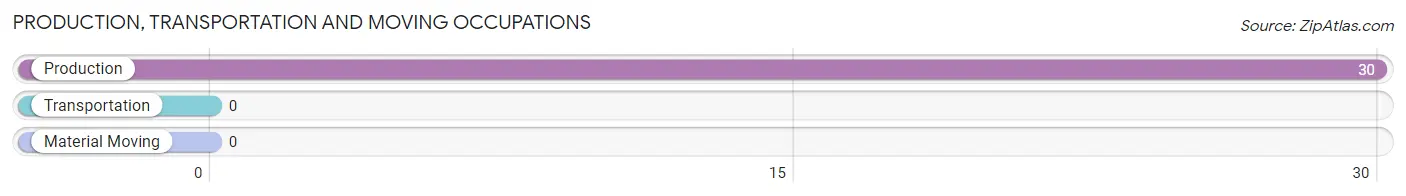
Production, Transportation and Moving Occupations by Sex
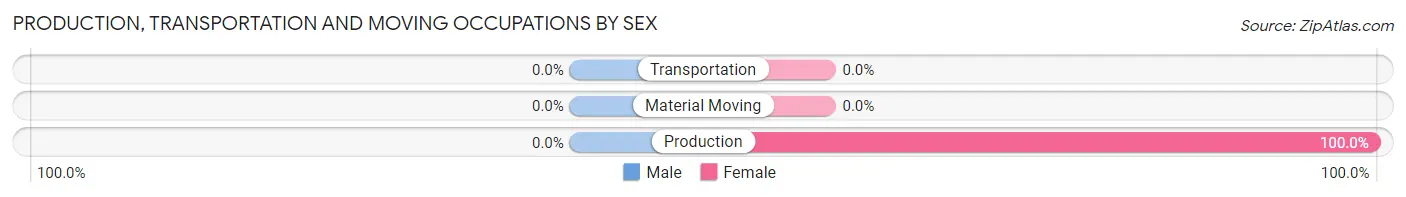
| Occupation | Male | Female |
| Production | 0 (0.0%) | 30 (100.0%) |
| Transportation | 0 (0.0%) | 0 (0.0%) |
| Material Moving | 0 (0.0%) | 0 (0.0%) |
| Total (Category) | 0 (0.0%) | 30 (100.0%) |
| Total (Overall) | 90 (47.1%) | 101 (52.9%) |
Employment Industries by Sex in East Williston
Employment Industries in East Williston
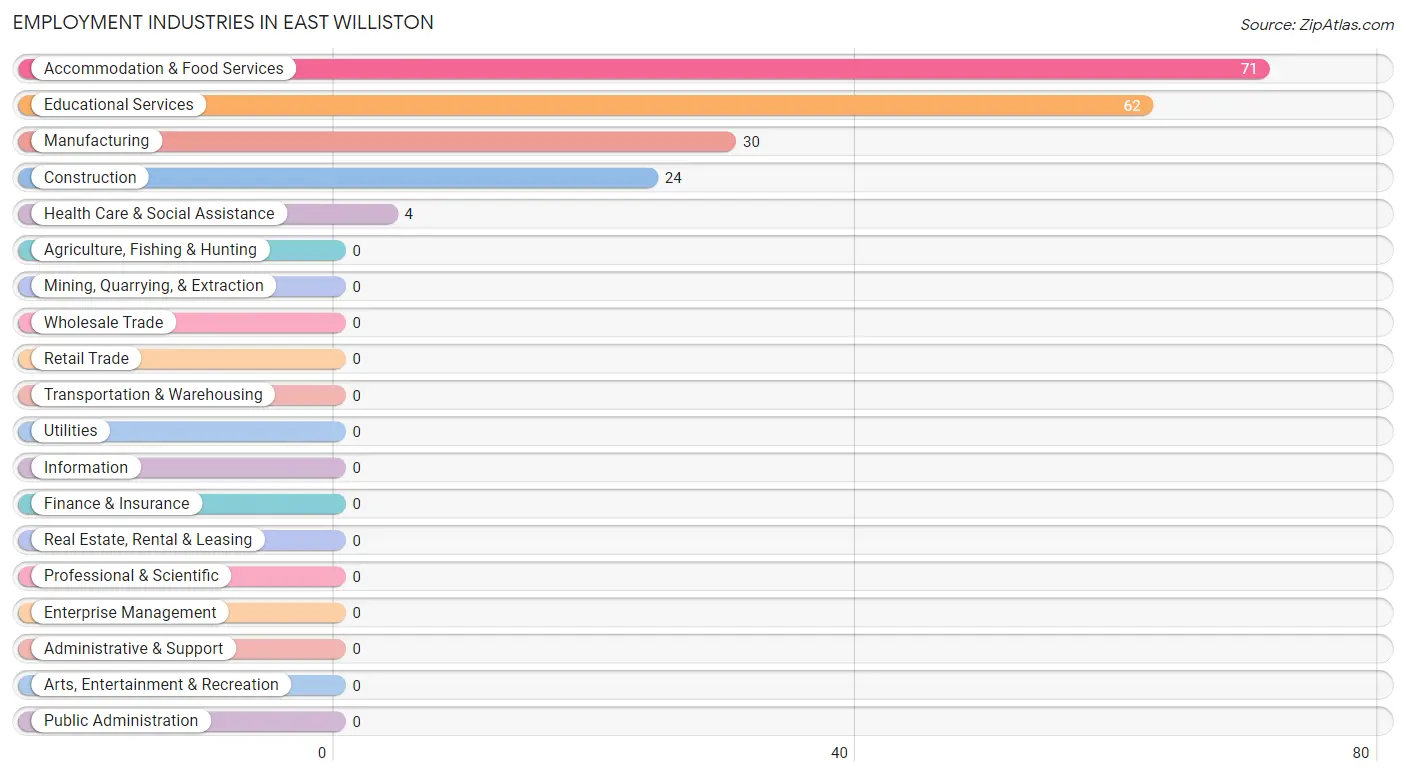
The major employment industries in East Williston include Accommodation & Food Services (71 | 37.2%), Educational Services (62 | 32.5%), Manufacturing (30 | 15.7%), Construction (24 | 12.6%), and Health Care & Social Assistance (4 | 2.1%).
Employment Industries by Sex in East Williston
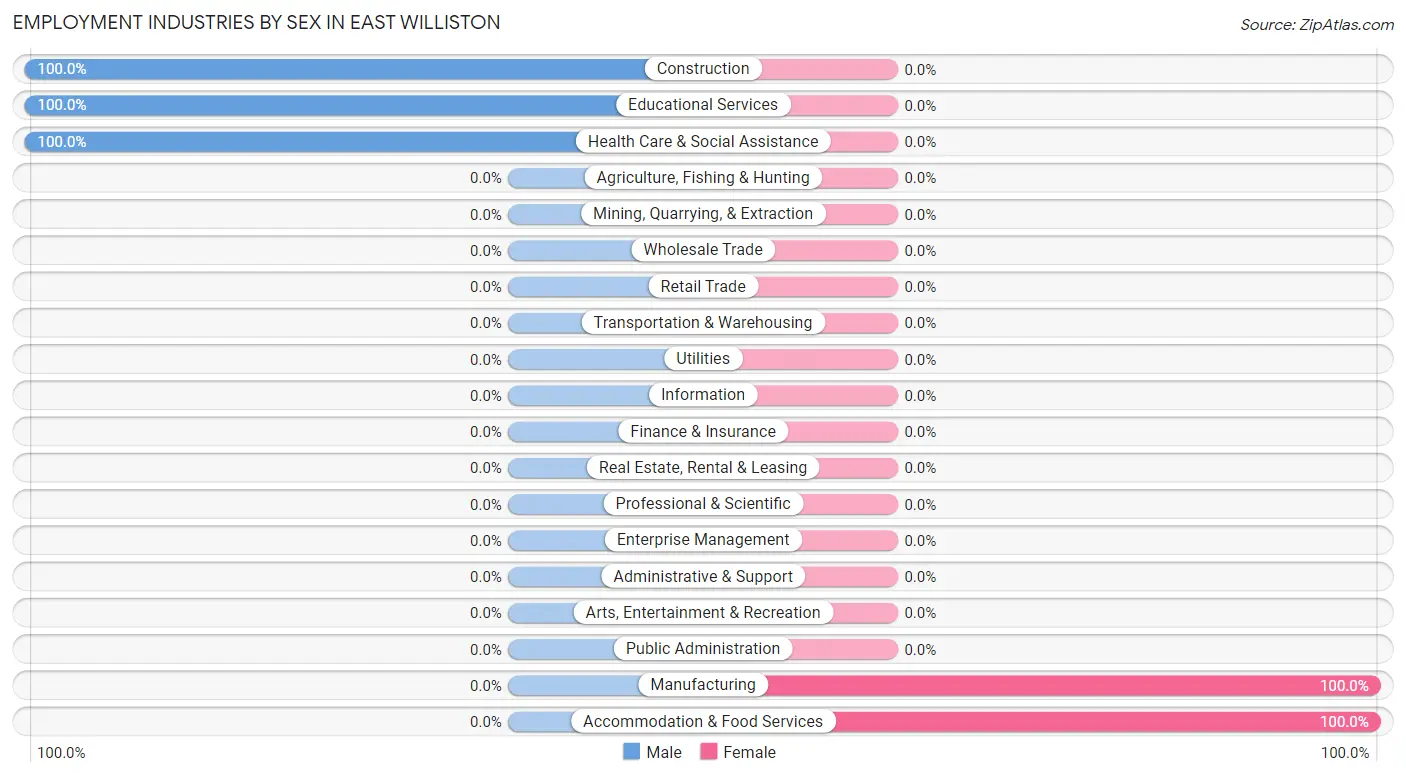
The East Williston industries that see more men than women are Construction (100.0%), Educational Services (100.0%), and Health Care & Social Assistance (100.0%), whereas the industries that tend to have a higher number of women are Manufacturing (100.0%), and Accommodation & Food Services (100.0%).
| Industry | Male | Female |
| Agriculture, Fishing & Hunting | 0 (0.0%) | 0 (0.0%) |
| Mining, Quarrying, & Extraction | 0 (0.0%) | 0 (0.0%) |
| Construction | 24 (100.0%) | 0 (0.0%) |
| Manufacturing | 0 (0.0%) | 30 (100.0%) |
| Wholesale Trade | 0 (0.0%) | 0 (0.0%) |
| Retail Trade | 0 (0.0%) | 0 (0.0%) |
| Transportation & Warehousing | 0 (0.0%) | 0 (0.0%) |
| Utilities | 0 (0.0%) | 0 (0.0%) |
| Information | 0 (0.0%) | 0 (0.0%) |
| Finance & Insurance | 0 (0.0%) | 0 (0.0%) |
| Real Estate, Rental & Leasing | 0 (0.0%) | 0 (0.0%) |
| Professional & Scientific | 0 (0.0%) | 0 (0.0%) |
| Enterprise Management | 0 (0.0%) | 0 (0.0%) |
| Administrative & Support | 0 (0.0%) | 0 (0.0%) |
| Educational Services | 62 (100.0%) | 0 (0.0%) |
| Health Care & Social Assistance | 4 (100.0%) | 0 (0.0%) |
| Arts, Entertainment & Recreation | 0 (0.0%) | 0 (0.0%) |
| Accommodation & Food Services | 0 (0.0%) | 71 (100.0%) |
| Public Administration | 0 (0.0%) | 0 (0.0%) |
| Total | 90 (47.1%) | 101 (52.9%) |
Education in East Williston
School Enrollment in East Williston
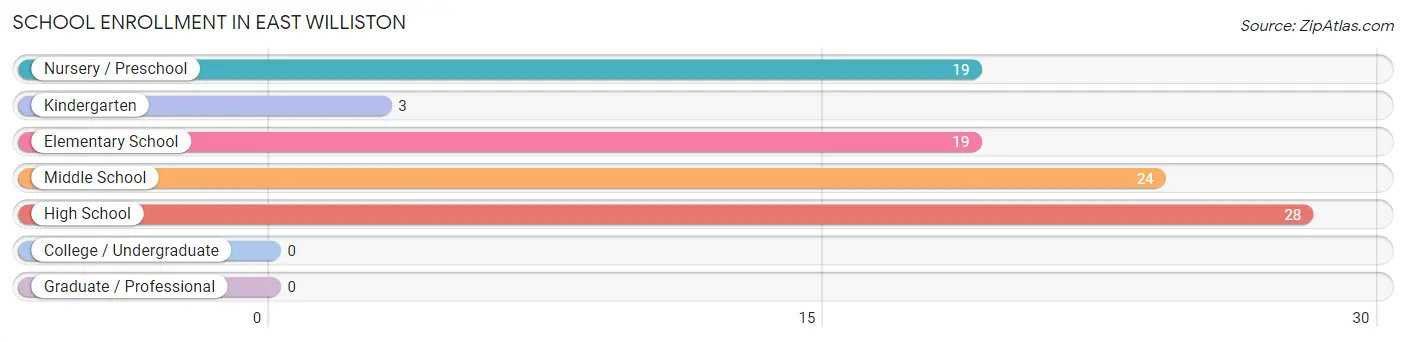
The most common levels of schooling among the 93 students in East Williston are high school (28 | 30.1%), middle school (24 | 25.8%), and nursery / preschool (19 | 20.4%).
| School Level | # Students | % Students |
| Nursery / Preschool | 19 | 20.4% |
| Kindergarten | 3 | 3.2% |
| Elementary School | 19 | 20.4% |
| Middle School | 24 | 25.8% |
| High School | 28 | 30.1% |
| College / Undergraduate | 0 | 0.0% |
| Graduate / Professional | 0 | 0.0% |
| Total | 93 | 100.0% |
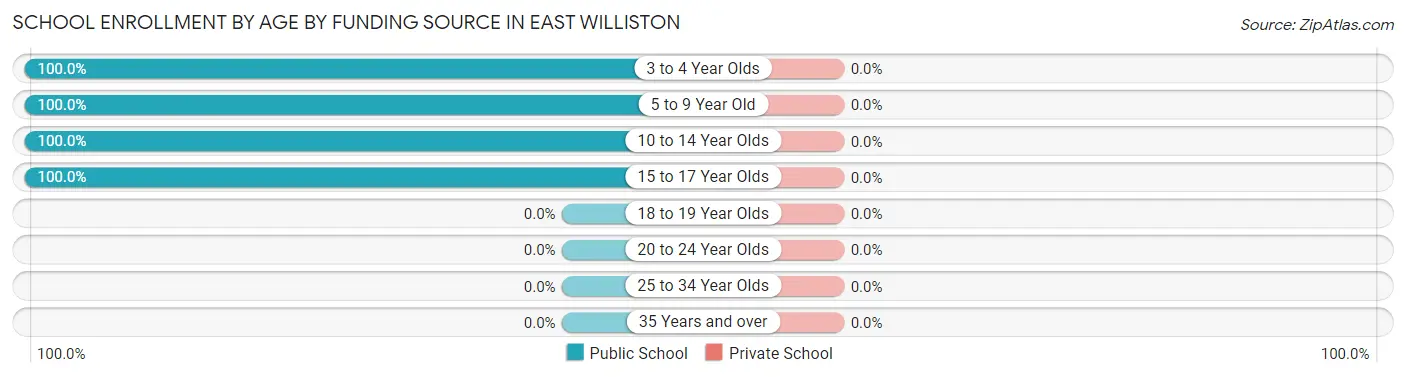
School Enrollment by Age by Funding Source in East Williston
| Age Bracket | Public School | Private School |
| 3 to 4 Year Olds | 22 (100.0%) | 0 (0.0%) |
| 5 to 9 Year Old | 19 (100.0%) | 0 (0.0%) |
| 10 to 14 Year Olds | 24 (100.0%) | 0 (0.0%) |
| 15 to 17 Year Olds | 28 (100.0%) | 0 (0.0%) |
| 18 to 19 Year Olds | 0 (0.0%) | 0 (0.0%) |
| 20 to 24 Year Olds | 0 (0.0%) | 0 (0.0%) |
| 25 to 34 Year Olds | 0 (0.0%) | 0 (0.0%) |
| 35 Years and over | 0 (0.0%) | 0 (0.0%) |
| Total | 93 (100.0%) | 0 (0.0%) |
Educational Attainment by Field of Study in East Williston
Business (5 | 55.6%), and visual & performing arts (4 | 44.4%) are the most common fields of study among 9 individuals in East Williston who have obtained a bachelor's degree or higher.
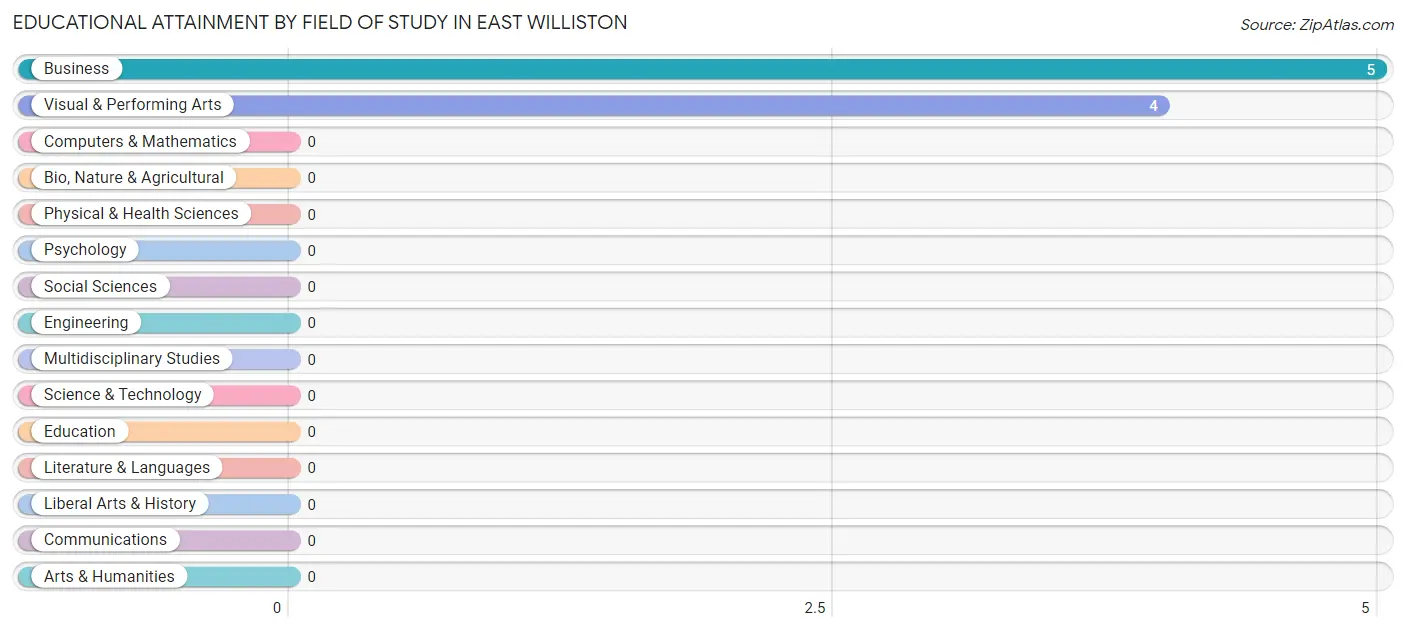
| Field of Study | # Graduates | % Graduates |
| Computers & Mathematics | 0 | 0.0% |
| Bio, Nature & Agricultural | 0 | 0.0% |
| Physical & Health Sciences | 0 | 0.0% |
| Psychology | 0 | 0.0% |
| Social Sciences | 0 | 0.0% |
| Engineering | 0 | 0.0% |
| Multidisciplinary Studies | 0 | 0.0% |
| Science & Technology | 0 | 0.0% |
| Business | 5 | 55.6% |
| Education | 0 | 0.0% |
| Literature & Languages | 0 | 0.0% |
| Liberal Arts & History | 0 | 0.0% |
| Visual & Performing Arts | 4 | 44.4% |
| Communications | 0 | 0.0% |
| Arts & Humanities | 0 | 0.0% |
| Total | 9 | 100.0% |
Transportation & Commute in East Williston
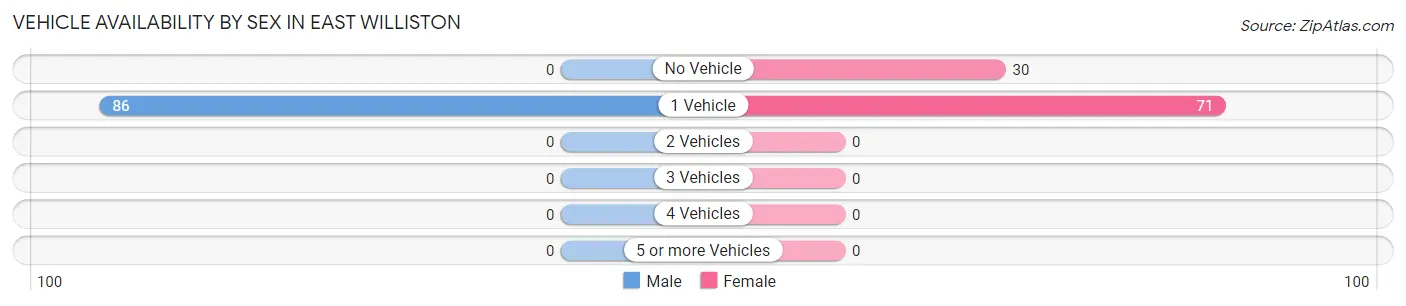
Vehicle Availability by Sex in East Williston
The most prevalent vehicle ownership categories in East Williston are males with 1 vehicle (86, accounting for 100.0%) and females with 1 vehicle (71, making up 85.2%).
| Vehicles Available | Male | Female |
| No Vehicle | 0 (0.0%) | 30 (29.7%) |
| 1 Vehicle | 86 (100.0%) | 71 (70.3%) |
| 2 Vehicles | 0 (0.0%) | 0 (0.0%) |
| 3 Vehicles | 0 (0.0%) | 0 (0.0%) |
| 4 Vehicles | 0 (0.0%) | 0 (0.0%) |
| 5 or more Vehicles | 0 (0.0%) | 0 (0.0%) |
| Total | 86 (100.0%) | 101 (100.0%) |
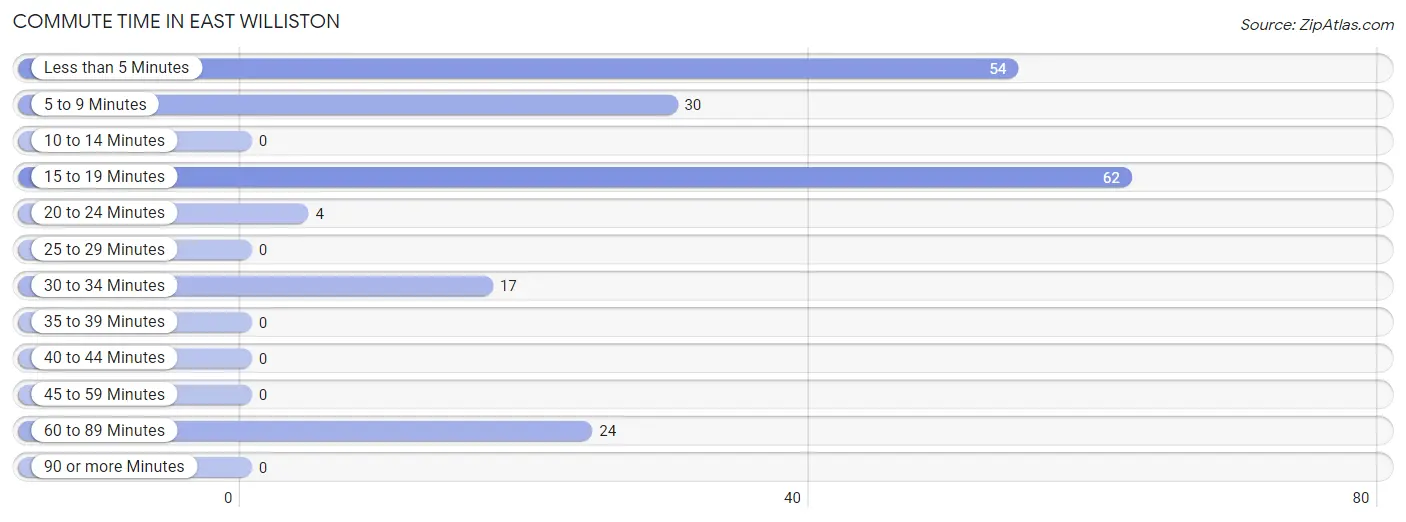
Commute Time in East Williston
The most frequently occuring commute durations in East Williston are 15 to 19 minutes (62 commuters, 32.5%), less than 5 minutes (54 commuters, 28.3%), and 5 to 9 minutes (30 commuters, 15.7%).
| Commute Time | # Commuters | % Commuters |
| Less than 5 Minutes | 54 | 28.3% |
| 5 to 9 Minutes | 30 | 15.7% |
| 10 to 14 Minutes | 0 | 0.0% |
| 15 to 19 Minutes | 62 | 32.5% |
| 20 to 24 Minutes | 4 | 2.1% |
| 25 to 29 Minutes | 0 | 0.0% |
| 30 to 34 Minutes | 17 | 8.9% |
| 35 to 39 Minutes | 0 | 0.0% |
| 40 to 44 Minutes | 0 | 0.0% |
| 45 to 59 Minutes | 0 | 0.0% |
| 60 to 89 Minutes | 24 | 12.6% |
| 90 or more Minutes | 0 | 0.0% |
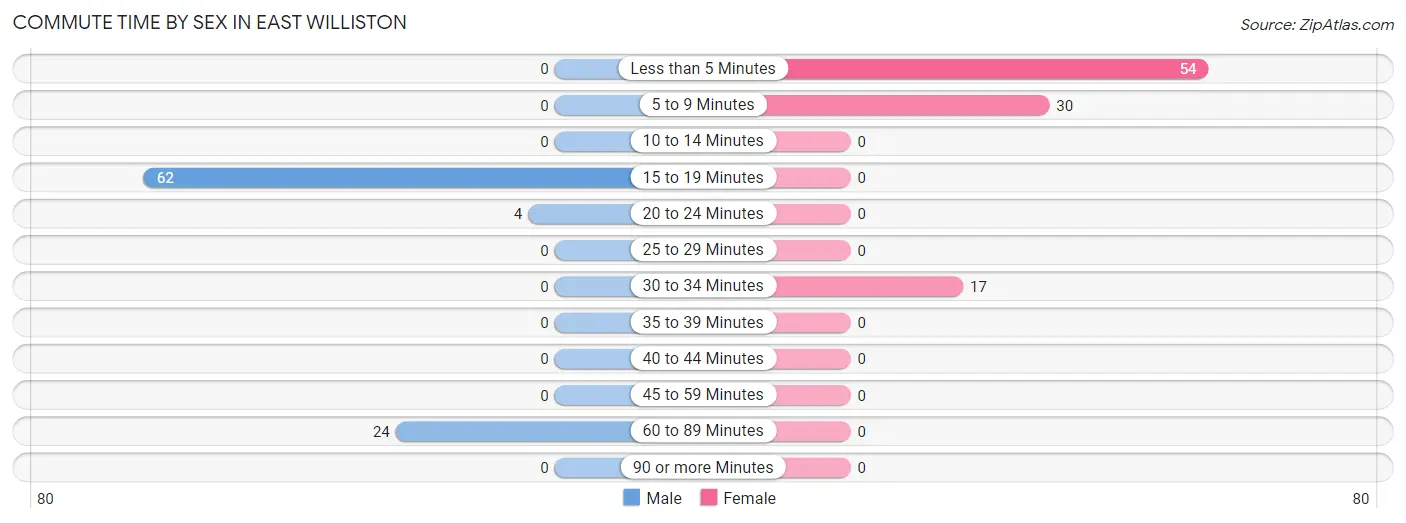
Commute Time by Sex in East Williston
The most common commute times in East Williston are 15 to 19 minutes (62 commuters, 68.9%) for males and less than 5 minutes (54 commuters, 53.5%) for females.
| Commute Time | Male | Female |
| Less than 5 Minutes | 0 (0.0%) | 54 (53.5%) |
| 5 to 9 Minutes | 0 (0.0%) | 30 (29.7%) |
| 10 to 14 Minutes | 0 (0.0%) | 0 (0.0%) |
| 15 to 19 Minutes | 62 (68.9%) | 0 (0.0%) |
| 20 to 24 Minutes | 4 (4.4%) | 0 (0.0%) |
| 25 to 29 Minutes | 0 (0.0%) | 0 (0.0%) |
| 30 to 34 Minutes | 0 (0.0%) | 17 (16.8%) |
| 35 to 39 Minutes | 0 (0.0%) | 0 (0.0%) |
| 40 to 44 Minutes | 0 (0.0%) | 0 (0.0%) |
| 45 to 59 Minutes | 0 (0.0%) | 0 (0.0%) |
| 60 to 89 Minutes | 24 (26.7%) | 0 (0.0%) |
| 90 or more Minutes | 0 (0.0%) | 0 (0.0%) |
Time of Departure to Work by Sex in East Williston
The most frequent times of departure to work in East Williston are 6:30 AM to 6:59 AM (62, 68.9%) for males and 8:00 AM to 8:29 AM (54, 53.5%) for females.
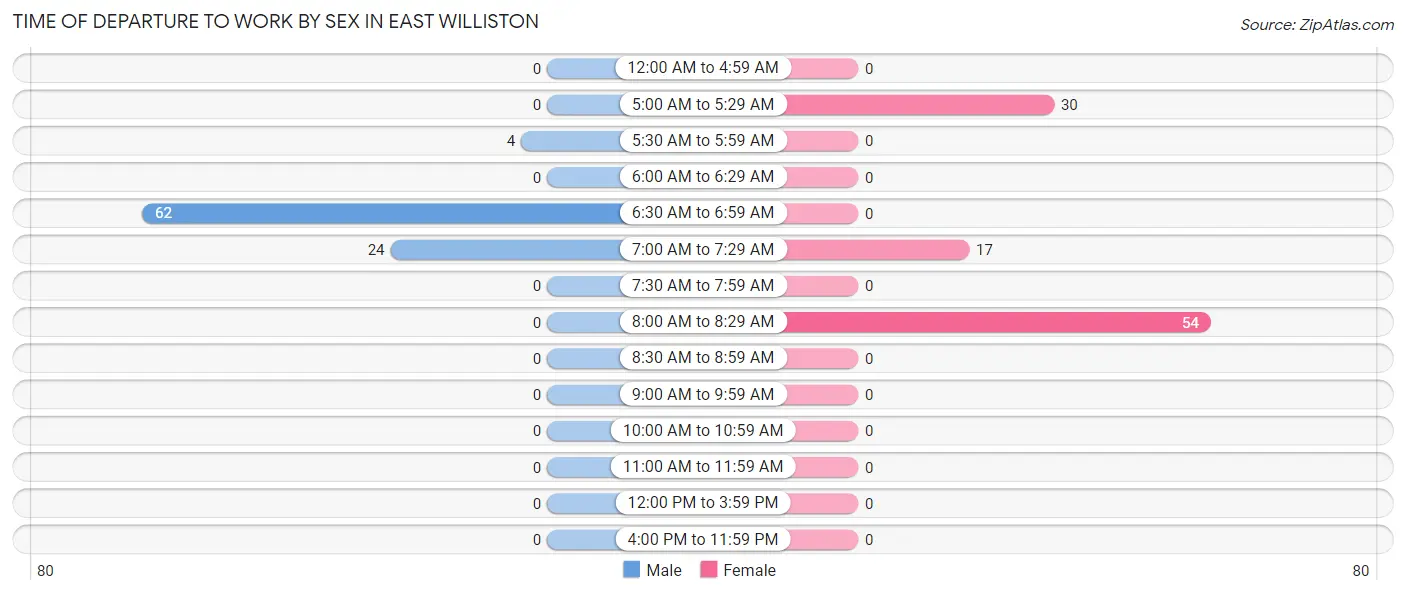
| Time of Departure | Male | Female |
| 12:00 AM to 4:59 AM | 0 (0.0%) | 0 (0.0%) |
| 5:00 AM to 5:29 AM | 0 (0.0%) | 30 (29.7%) |
| 5:30 AM to 5:59 AM | 4 (4.4%) | 0 (0.0%) |
| 6:00 AM to 6:29 AM | 0 (0.0%) | 0 (0.0%) |
| 6:30 AM to 6:59 AM | 62 (68.9%) | 0 (0.0%) |
| 7:00 AM to 7:29 AM | 24 (26.7%) | 17 (16.8%) |
| 7:30 AM to 7:59 AM | 0 (0.0%) | 0 (0.0%) |
| 8:00 AM to 8:29 AM | 0 (0.0%) | 54 (53.5%) |
| 8:30 AM to 8:59 AM | 0 (0.0%) | 0 (0.0%) |
| 9:00 AM to 9:59 AM | 0 (0.0%) | 0 (0.0%) |
| 10:00 AM to 10:59 AM | 0 (0.0%) | 0 (0.0%) |
| 11:00 AM to 11:59 AM | 0 (0.0%) | 0 (0.0%) |
| 12:00 PM to 3:59 PM | 0 (0.0%) | 0 (0.0%) |
| 4:00 PM to 11:59 PM | 0 (0.0%) | 0 (0.0%) |
| Total | 90 (100.0%) | 101 (100.0%) |
Housing Occupancy in East Williston
Occupancy by Ownership in East Williston
Of the total 328 dwellings in East Williston, owner-occupied units account for 104 (31.7%), while renter-occupied units make up 224 (68.3%).
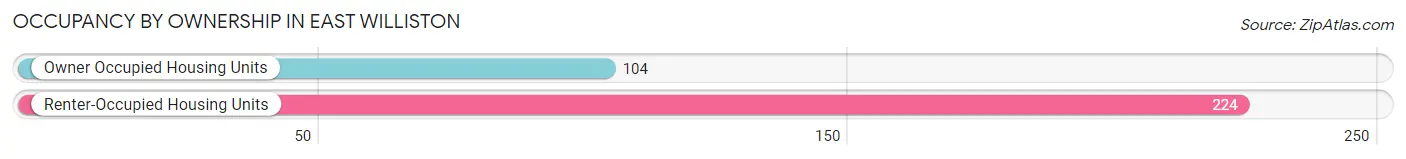
| Occupancy | # Housing Units | % Housing Units |
| Owner Occupied Housing Units | 104 | 31.7% |
| Renter-Occupied Housing Units | 224 | 68.3% |
| Total Occupied Housing Units | 328 | 100.0% |
Occupancy by Household Size in East Williston
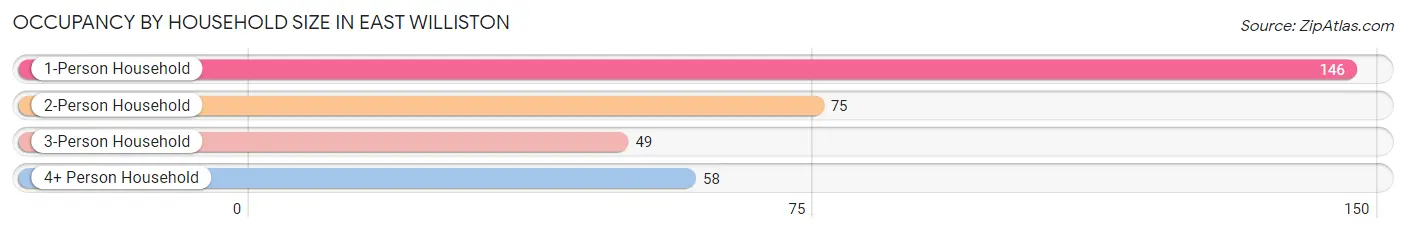
| Household Size | # Housing Units | % Housing Units |
| 1-Person Household | 146 | 44.5% |
| 2-Person Household | 75 | 22.9% |
| 3-Person Household | 49 | 14.9% |
| 4+ Person Household | 58 | 17.7% |
| Total Housing Units | 328 | 100.0% |
Occupancy by Ownership by Household Size in East Williston
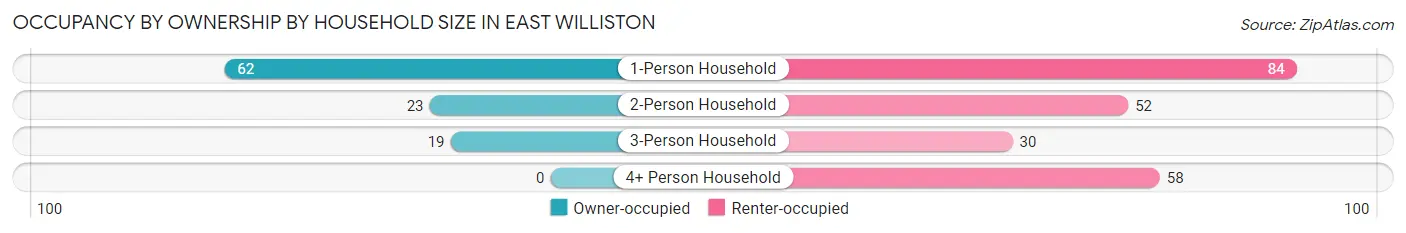
| Household Size | Owner-occupied | Renter-occupied |
| 1-Person Household | 62 (42.5%) | 84 (57.5%) |
| 2-Person Household | 23 (30.7%) | 52 (69.3%) |
| 3-Person Household | 19 (38.8%) | 30 (61.2%) |
| 4+ Person Household | 0 (0.0%) | 58 (100.0%) |
| Total Housing Units | 104 (31.7%) | 224 (68.3%) |
Occupancy by Educational Attainment in East Williston
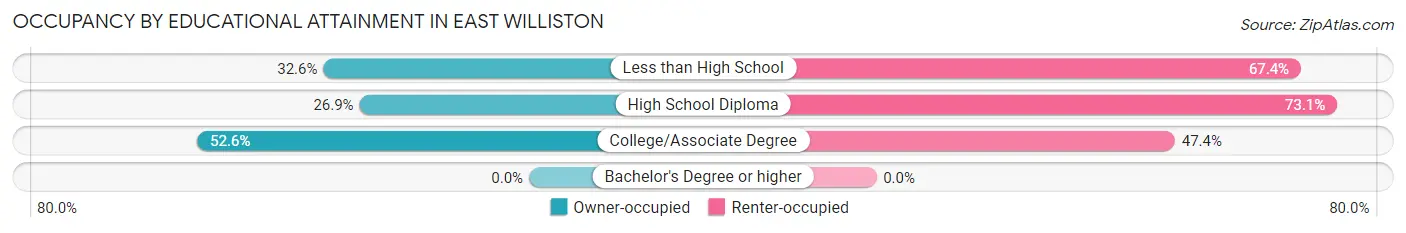
| Household Size | Owner-occupied | Renter-occupied |
| Less than High School | 62 (32.6%) | 128 (67.4%) |
| High School Diploma | 32 (26.9%) | 87 (73.1%) |
| College/Associate Degree | 10 (52.6%) | 9 (47.4%) |
| Bachelor's Degree or higher | 0 (0.0%) | 0 (0.0%) |
Occupancy by Age of Householder in East Williston
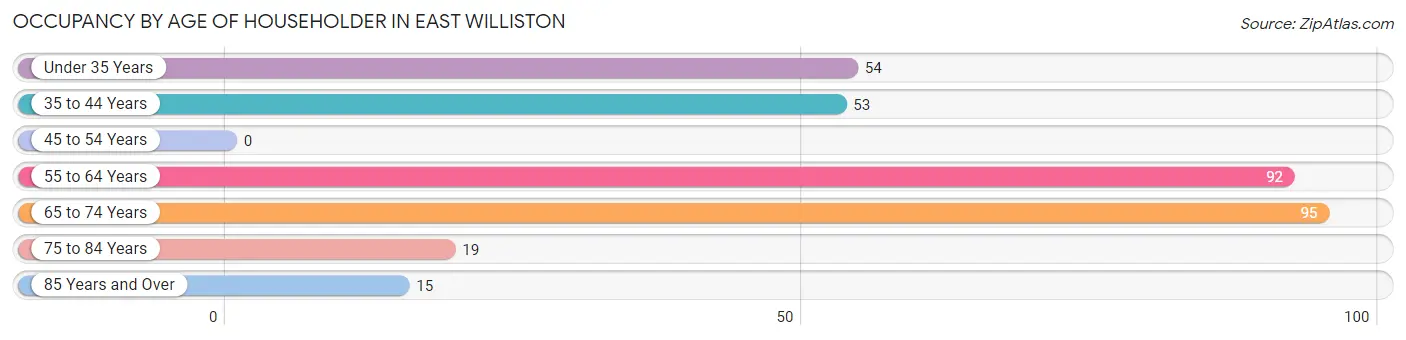
| Age Bracket | # Households | % Households |
| Under 35 Years | 54 | 16.5% |
| 35 to 44 Years | 53 | 16.2% |
| 45 to 54 Years | 0 | 0.0% |
| 55 to 64 Years | 92 | 28.1% |
| 65 to 74 Years | 95 | 29.0% |
| 75 to 84 Years | 19 | 5.8% |
| 85 Years and Over | 15 | 4.6% |
| Total | 328 | 100.0% |
Housing Finances in East Williston
Median Income by Occupancy in East Williston
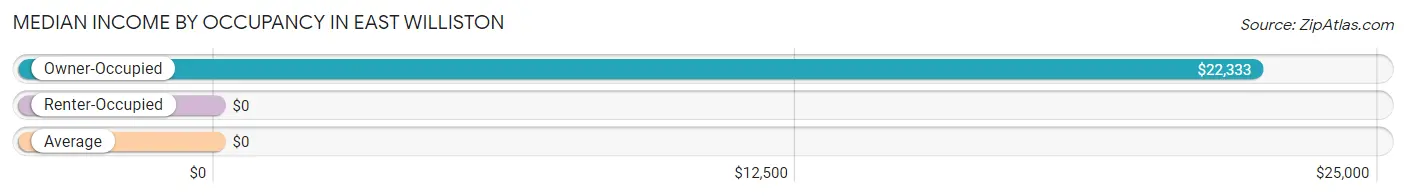
| Occupancy Type | # Households | Median Income |
| Owner-Occupied | 104 (31.7%) | $22,333 |
| Renter-Occupied | 224 (68.3%) | $0 |
| Average | 328 (100.0%) | $0 |
Occupancy by Householder Income Bracket in East Williston
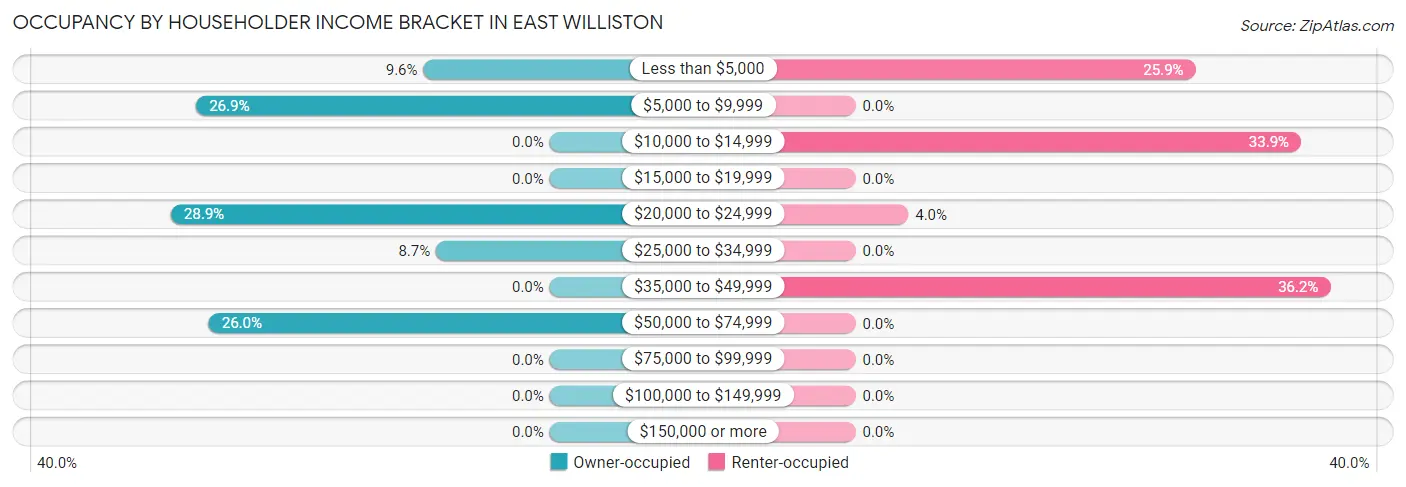
| Income Bracket | Owner-occupied | Renter-occupied |
| Less than $5,000 | 10 (9.6%) | 58 (25.9%) |
| $5,000 to $9,999 | 28 (26.9%) | 0 (0.0%) |
| $10,000 to $14,999 | 0 (0.0%) | 76 (33.9%) |
| $15,000 to $19,999 | 0 (0.0%) | 0 (0.0%) |
| $20,000 to $24,999 | 30 (28.8%) | 9 (4.0%) |
| $25,000 to $34,999 | 9 (8.6%) | 0 (0.0%) |
| $35,000 to $49,999 | 0 (0.0%) | 81 (36.2%) |
| $50,000 to $74,999 | 27 (26.0%) | 0 (0.0%) |
| $75,000 to $99,999 | 0 (0.0%) | 0 (0.0%) |
| $100,000 to $149,999 | 0 (0.0%) | 0 (0.0%) |
| $150,000 or more | 0 (0.0%) | 0 (0.0%) |
| Total | 104 (100.0%) | 224 (100.0%) |
Monthly Housing Cost Tiers in East Williston
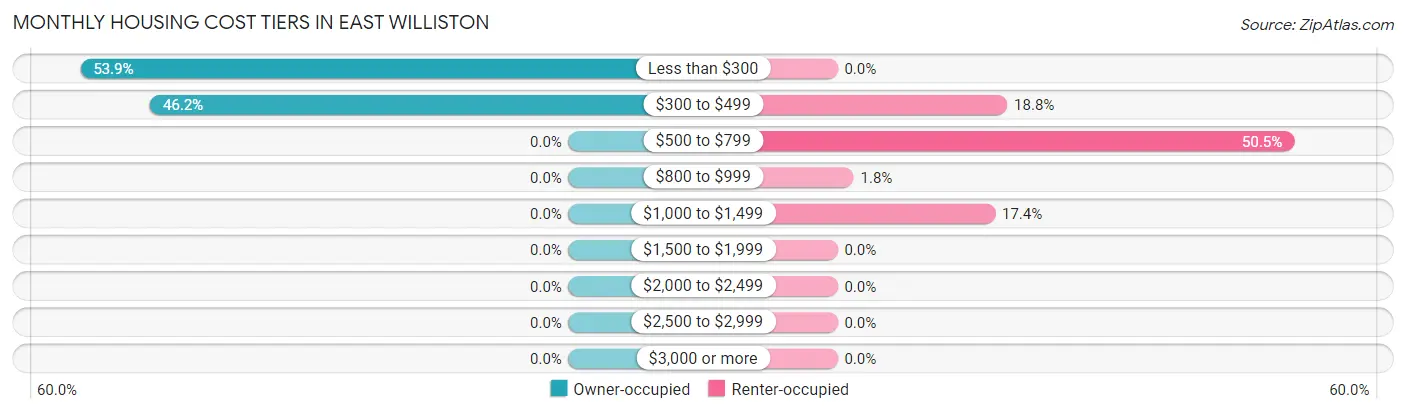
| Monthly Cost | Owner-occupied | Renter-occupied |
| Less than $300 | 56 (53.8%) | 0 (0.0%) |
| $300 to $499 | 48 (46.2%) | 42 (18.8%) |
| $500 to $799 | 0 (0.0%) | 113 (50.4%) |
| $800 to $999 | 0 (0.0%) | 4 (1.8%) |
| $1,000 to $1,499 | 0 (0.0%) | 39 (17.4%) |
| $1,500 to $1,999 | 0 (0.0%) | 0 (0.0%) |
| $2,000 to $2,499 | 0 (0.0%) | 0 (0.0%) |
| $2,500 to $2,999 | 0 (0.0%) | 0 (0.0%) |
| $3,000 or more | 0 (0.0%) | 0 (0.0%) |
| Total | 104 (100.0%) | 224 (100.0%) |
Physical Housing Characteristics in East Williston
Housing Structures in East Williston
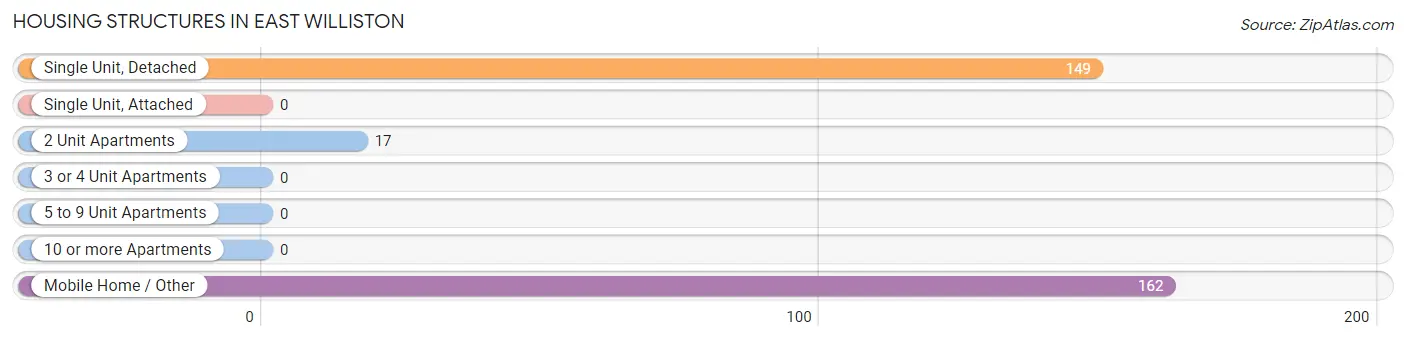
| Structure Type | # Housing Units | % Housing Units |
| Single Unit, Detached | 149 | 45.4% |
| Single Unit, Attached | 0 | 0.0% |
| 2 Unit Apartments | 17 | 5.2% |
| 3 or 4 Unit Apartments | 0 | 0.0% |
| 5 to 9 Unit Apartments | 0 | 0.0% |
| 10 or more Apartments | 0 | 0.0% |
| Mobile Home / Other | 162 | 49.4% |
| Total | 328 | 100.0% |
Housing Structures by Occupancy in East Williston
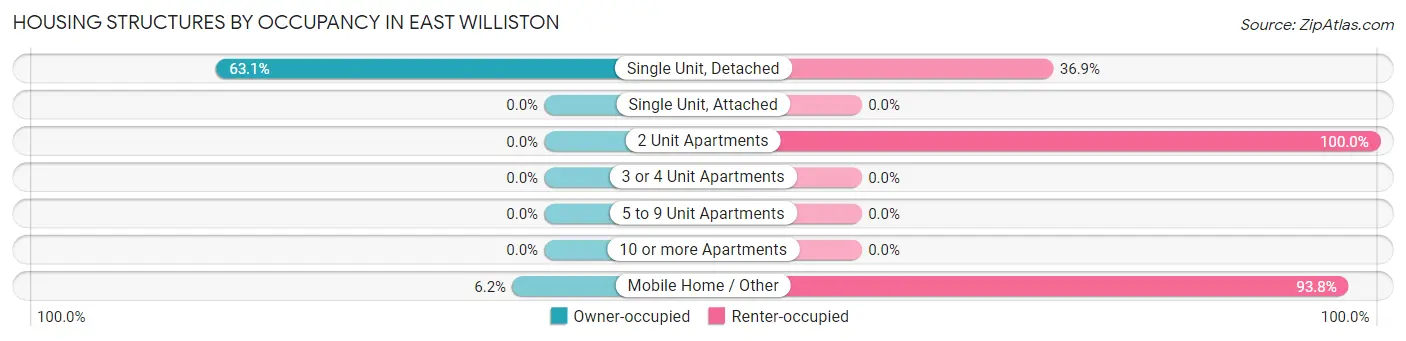
| Structure Type | Owner-occupied | Renter-occupied |
| Single Unit, Detached | 94 (63.1%) | 55 (36.9%) |
| Single Unit, Attached | 0 (0.0%) | 0 (0.0%) |
| 2 Unit Apartments | 0 (0.0%) | 17 (100.0%) |
| 3 or 4 Unit Apartments | 0 (0.0%) | 0 (0.0%) |
| 5 to 9 Unit Apartments | 0 (0.0%) | 0 (0.0%) |
| 10 or more Apartments | 0 (0.0%) | 0 (0.0%) |
| Mobile Home / Other | 10 (6.2%) | 152 (93.8%) |
| Total | 104 (31.7%) | 224 (68.3%) |
Housing Structures by Number of Rooms in East Williston
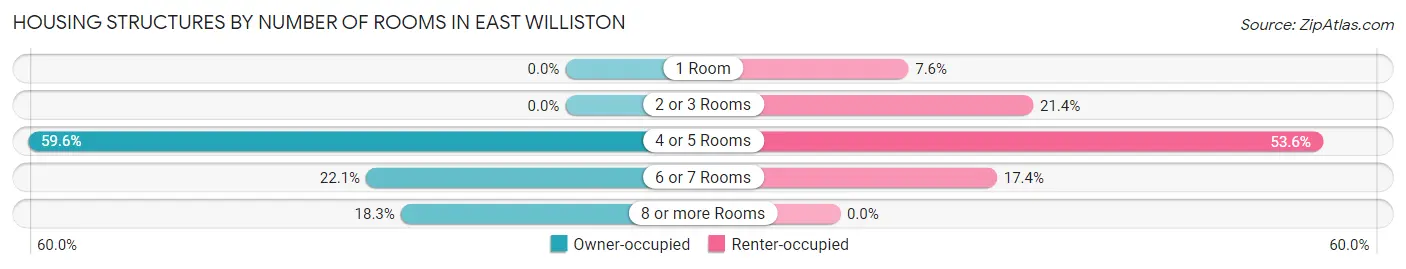
| Number of Rooms | Owner-occupied | Renter-occupied |
| 1 Room | 0 (0.0%) | 17 (7.6%) |
| 2 or 3 Rooms | 0 (0.0%) | 48 (21.4%) |
| 4 or 5 Rooms | 62 (59.6%) | 120 (53.6%) |
| 6 or 7 Rooms | 23 (22.1%) | 39 (17.4%) |
| 8 or more Rooms | 19 (18.3%) | 0 (0.0%) |
| Total | 104 (100.0%) | 224 (100.0%) |
Housing Structure by Heating Type in East Williston
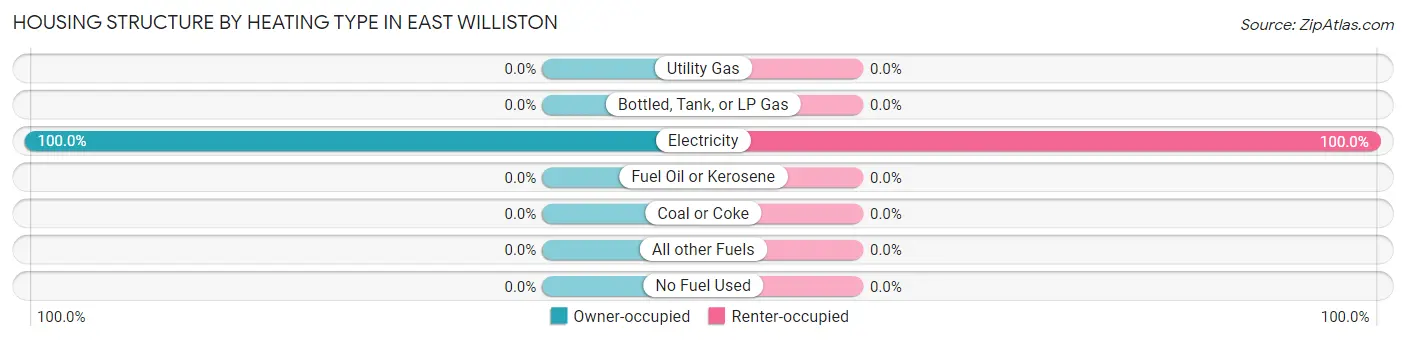
| Heating Type | Owner-occupied | Renter-occupied |
| Utility Gas | 0 (0.0%) | 0 (0.0%) |
| Bottled, Tank, or LP Gas | 0 (0.0%) | 0 (0.0%) |
| Electricity | 104 (100.0%) | 224 (100.0%) |
| Fuel Oil or Kerosene | 0 (0.0%) | 0 (0.0%) |
| Coal or Coke | 0 (0.0%) | 0 (0.0%) |
| All other Fuels | 0 (0.0%) | 0 (0.0%) |
| No Fuel Used | 0 (0.0%) | 0 (0.0%) |
| Total | 104 (100.0%) | 224 (100.0%) |
Household Vehicle Usage in East Williston
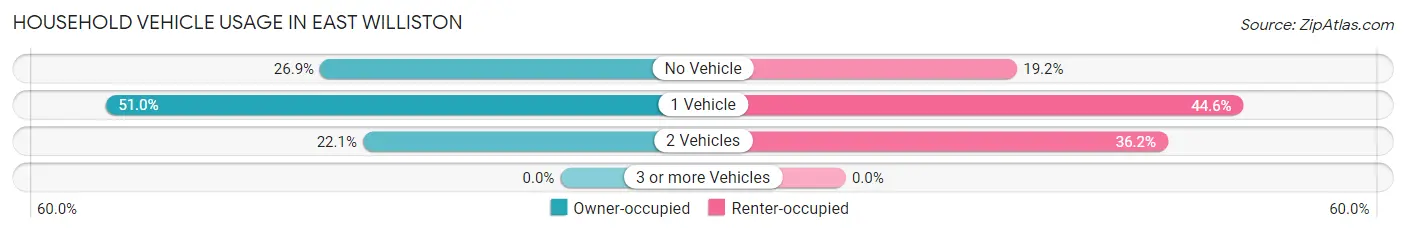
| Vehicles per Household | Owner-occupied | Renter-occupied |
| No Vehicle | 28 (26.9%) | 43 (19.2%) |
| 1 Vehicle | 53 (51.0%) | 100 (44.6%) |
| 2 Vehicles | 23 (22.1%) | 81 (36.2%) |
| 3 or more Vehicles | 0 (0.0%) | 0 (0.0%) |
| Total | 104 (100.0%) | 224 (100.0%) |
Real Estate & Mortgages in East Williston
Real Estate and Mortgage Overview in East Williston
| Characteristic | Without Mortgage | With Mortgage |
| Housing Units | 104 | 0 |
| Median Property Value | - | - |
| Median Household Income | $22,333 | $0 |
| Monthly Housing Costs | $243 | $0 |
| Real Estate Taxes | - | - |
Property Value by Mortgage Status in East Williston
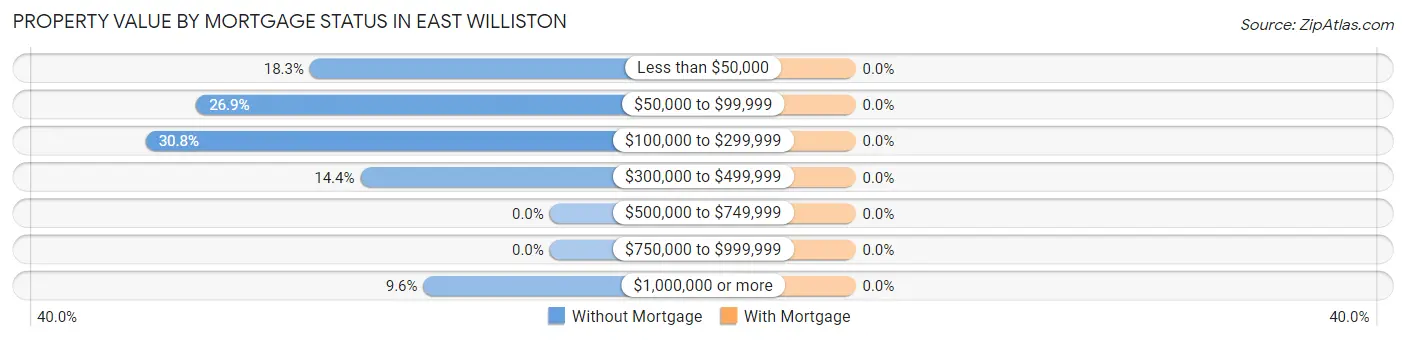
| Property Value | Without Mortgage | With Mortgage |
| Less than $50,000 | 19 (18.3%) | 0 (0.0%) |
| $50,000 to $99,999 | 28 (26.9%) | 0 (0.0%) |
| $100,000 to $299,999 | 32 (30.8%) | 0 (0.0%) |
| $300,000 to $499,999 | 15 (14.4%) | 0 (0.0%) |
| $500,000 to $749,999 | 0 (0.0%) | 0 (0.0%) |
| $750,000 to $999,999 | 0 (0.0%) | 0 (0.0%) |
| $1,000,000 or more | 10 (9.6%) | 0 (0.0%) |
| Total | 104 (100.0%) | 0 (0.0%) |
Household Income by Mortgage Status in East Williston
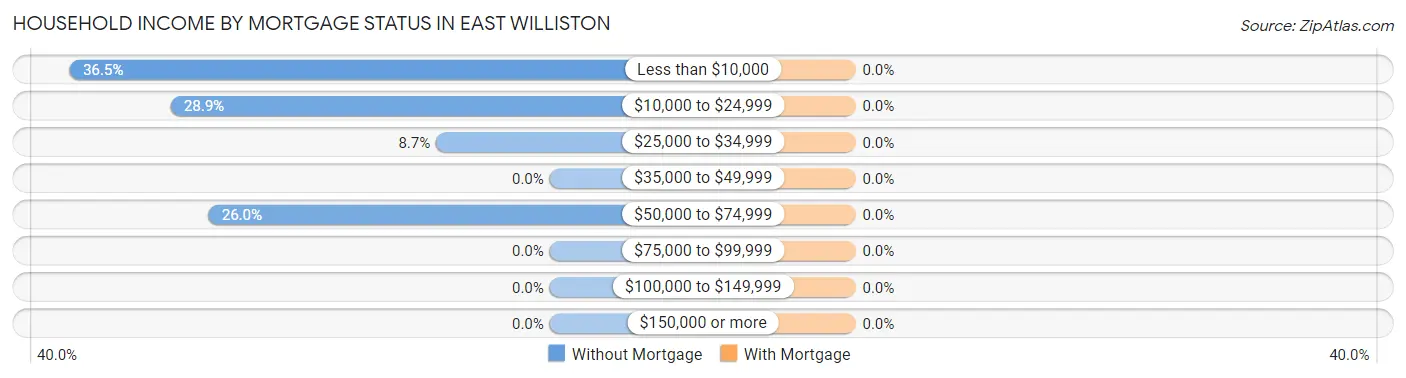
| Household Income | Without Mortgage | With Mortgage |
| Less than $10,000 | 38 (36.5%) | 0 (0.0%) |
| $10,000 to $24,999 | 30 (28.8%) | 0 (0.0%) |
| $25,000 to $34,999 | 9 (8.6%) | 0 (0.0%) |
| $35,000 to $49,999 | 0 (0.0%) | 0 (0.0%) |
| $50,000 to $74,999 | 27 (26.0%) | 0 (0.0%) |
| $75,000 to $99,999 | 0 (0.0%) | 0 (0.0%) |
| $100,000 to $149,999 | 0 (0.0%) | 0 (0.0%) |
| $150,000 or more | 0 (0.0%) | 0 (0.0%) |
| Total | 104 (100.0%) | 0 (0.0%) |
Property Value to Household Income Ratio in East Williston
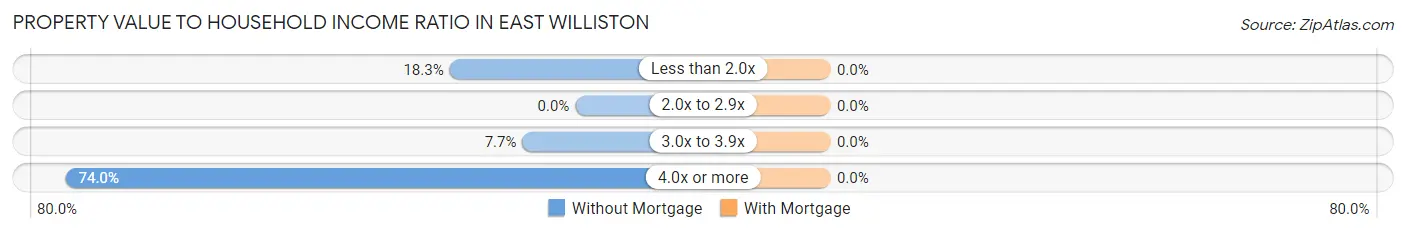
| Value-to-Income Ratio | Without Mortgage | With Mortgage |
| Less than 2.0x | 19 (18.3%) | 0 (0.0%) |
| 2.0x to 2.9x | 0 (0.0%) | 0 (0.0%) |
| 3.0x to 3.9x | 8 (7.7%) | 0 (0.0%) |
| 4.0x or more | 77 (74.0%) | 0 (0.0%) |
| Total | 104 (100.0%) | 0 (0.0%) |
Real Estate Taxes by Mortgage Status in East Williston
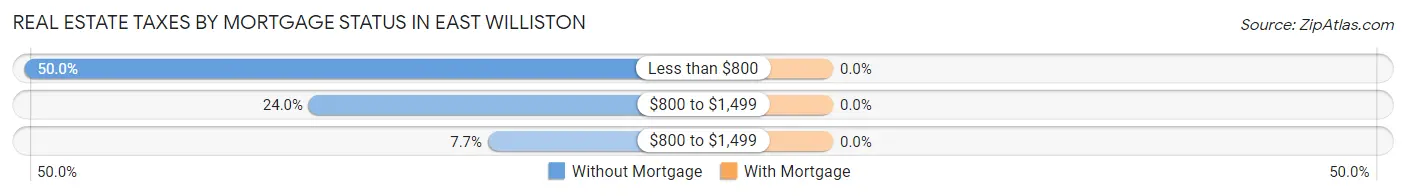
| Property Taxes | Without Mortgage | With Mortgage |
| Less than $800 | 52 (50.0%) | 0 (0.0%) |
| $800 to $1,499 | 25 (24.0%) | 0 (0.0%) |
| $800 to $1,499 | 8 (7.7%) | 0 (0.0%) |
| Total | 104 (100.0%) | 0 (0.0%) |
Health & Disability in East Williston
Health Insurance Coverage by Age in East Williston
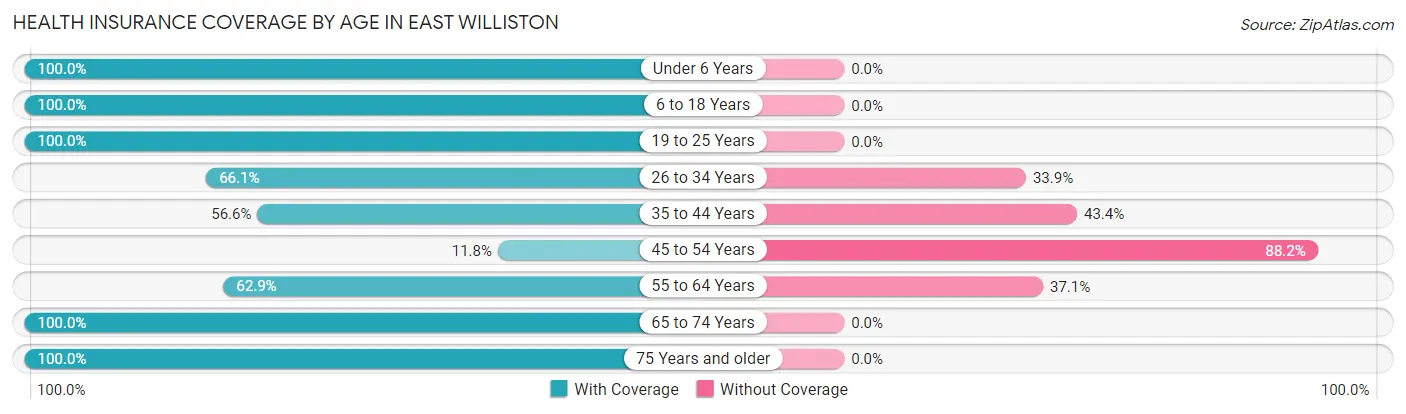
| Age Bracket | With Coverage | Without Coverage |
| Under 6 Years | 45 (100.0%) | 0 (0.0%) |
| 6 to 18 Years | 71 (100.0%) | 0 (0.0%) |
| 19 to 25 Years | 5 (100.0%) | 0 (0.0%) |
| 26 to 34 Years | 80 (66.1%) | 41 (33.9%) |
| 35 to 44 Years | 30 (56.6%) | 23 (43.4%) |
| 45 to 54 Years | 4 (11.8%) | 30 (88.2%) |
| 55 to 64 Years | 112 (62.9%) | 66 (37.1%) |
| 65 to 74 Years | 114 (100.0%) | 0 (0.0%) |
| 75 Years and older | 53 (100.0%) | 0 (0.0%) |
| Total | 514 (76.3%) | 160 (23.7%) |
Health Insurance Coverage by Citizenship Status in East Williston
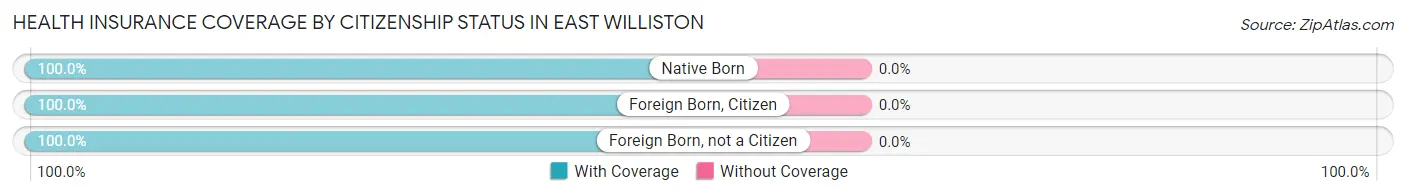
| Citizenship Status | With Coverage | Without Coverage |
| Native Born | 45 (100.0%) | 0 (0.0%) |
| Foreign Born, Citizen | 71 (100.0%) | 0 (0.0%) |
| Foreign Born, not a Citizen | 5 (100.0%) | 0 (0.0%) |
Health Insurance Coverage by Household Income in East Williston
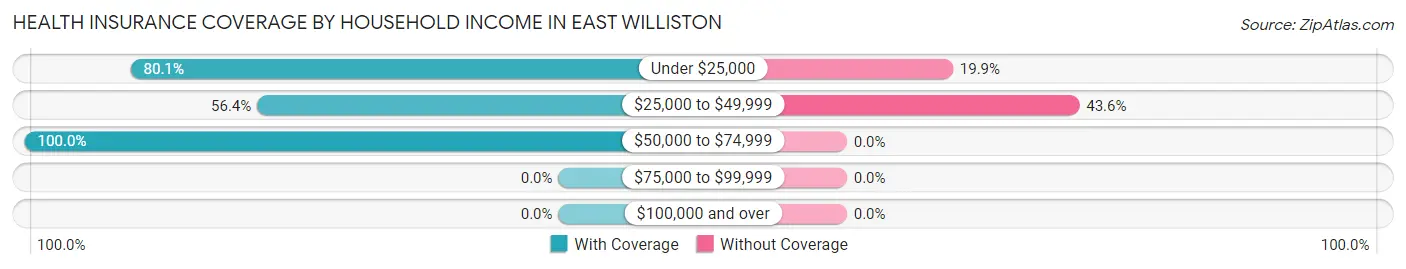
| Household Income | With Coverage | Without Coverage |
| Under $25,000 | 250 (80.1%) | 62 (19.9%) |
| $25,000 to $49,999 | 127 (56.4%) | 98 (43.6%) |
| $50,000 to $74,999 | 123 (100.0%) | 0 (0.0%) |
| $75,000 to $99,999 | 0 (0.0%) | 0 (0.0%) |
| $100,000 and over | 0 (0.0%) | 0 (0.0%) |
Public vs Private Health Insurance Coverage by Age in East Williston
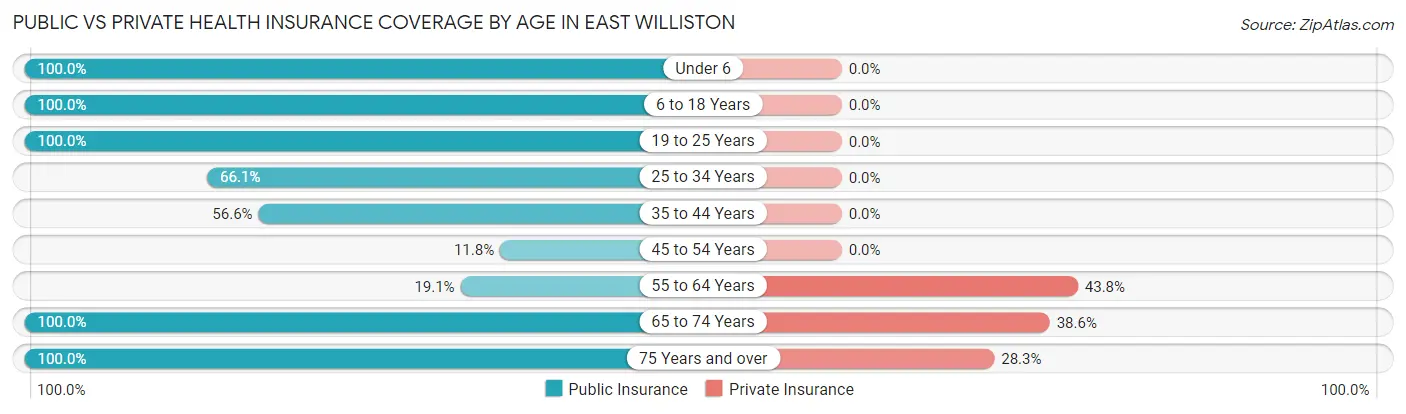
| Age Bracket | Public Insurance | Private Insurance |
| Under 6 | 45 (100.0%) | 0 (0.0%) |
| 6 to 18 Years | 71 (100.0%) | 0 (0.0%) |
| 19 to 25 Years | 5 (100.0%) | 0 (0.0%) |
| 25 to 34 Years | 80 (66.1%) | 0 (0.0%) |
| 35 to 44 Years | 30 (56.6%) | 0 (0.0%) |
| 45 to 54 Years | 4 (11.8%) | 0 (0.0%) |
| 55 to 64 Years | 34 (19.1%) | 78 (43.8%) |
| 65 to 74 Years | 114 (100.0%) | 44 (38.6%) |
| 75 Years and over | 53 (100.0%) | 15 (28.3%) |
| Total | 436 (64.7%) | 137 (20.3%) |
Disability Status by Sex by Age in East Williston
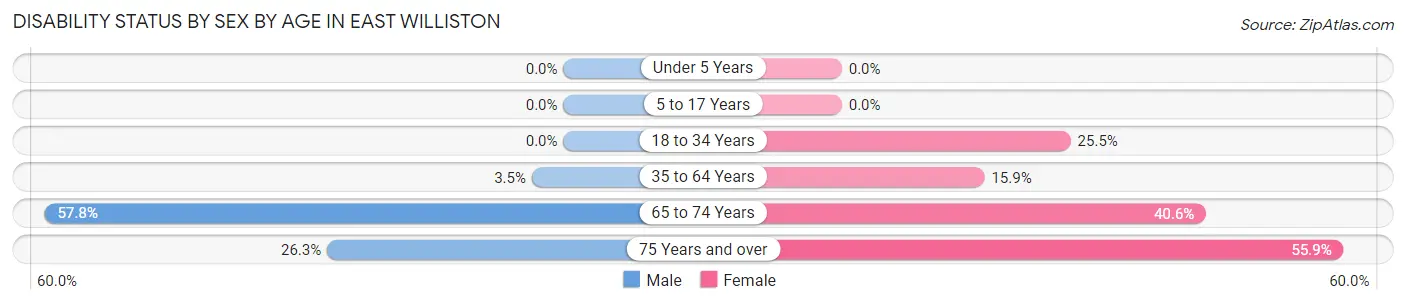
| Age Bracket | Male | Female |
| Under 5 Years | 0 (0.0%) | 0 (0.0%) |
| 5 to 17 Years | 0 (0.0%) | 0 (0.0%) |
| 18 to 34 Years | 0 (0.0%) | 26 (25.5%) |
| 35 to 64 Years | 4 (3.5%) | 24 (15.9%) |
| 65 to 74 Years | 26 (57.8%) | 28 (40.6%) |
| 75 Years and over | 5 (26.3%) | 19 (55.9%) |
Disability Class by Sex by Age in East Williston
Disability Class: Hearing Difficulty
| Age Bracket | Male | Female |
| Under 5 Years | 0 (0.0%) | 0 (0.0%) |
| 5 to 17 Years | 0 (0.0%) | 0 (0.0%) |
| 18 to 34 Years | 0 (0.0%) | 0 (0.0%) |
| 35 to 64 Years | 0 (0.0%) | 0 (0.0%) |
| 65 to 74 Years | 0 (0.0%) | 0 (0.0%) |
| 75 Years and over | 0 (0.0%) | 0 (0.0%) |
Disability Class: Vision Difficulty
| Age Bracket | Male | Female |
| Under 5 Years | 0 (0.0%) | 0 (0.0%) |
| 5 to 17 Years | 0 (0.0%) | 0 (0.0%) |
| 18 to 34 Years | 0 (0.0%) | 0 (0.0%) |
| 35 to 64 Years | 0 (0.0%) | 0 (0.0%) |
| 65 to 74 Years | 0 (0.0%) | 0 (0.0%) |
| 75 Years and over | 0 (0.0%) | 0 (0.0%) |
Disability Class: Cognitive Difficulty
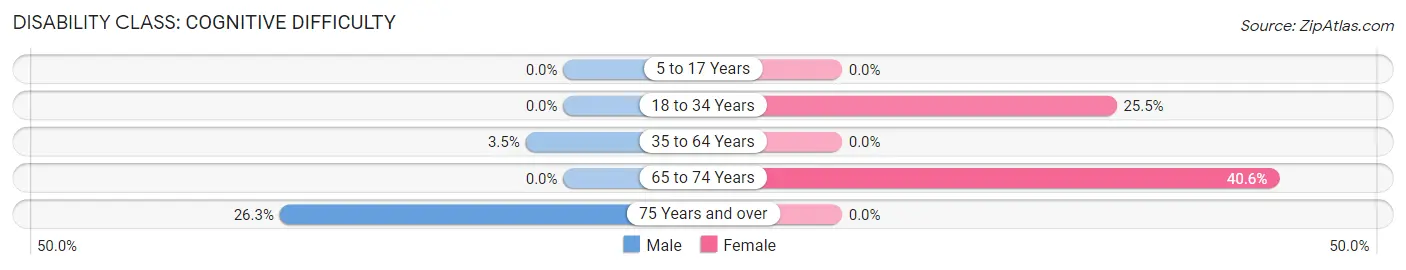
| Age Bracket | Male | Female |
| 5 to 17 Years | 0 (0.0%) | 0 (0.0%) |
| 18 to 34 Years | 0 (0.0%) | 26 (25.5%) |
| 35 to 64 Years | 4 (3.5%) | 0 (0.0%) |
| 65 to 74 Years | 0 (0.0%) | 28 (40.6%) |
| 75 Years and over | 5 (26.3%) | 0 (0.0%) |
Disability Class: Ambulatory Difficulty
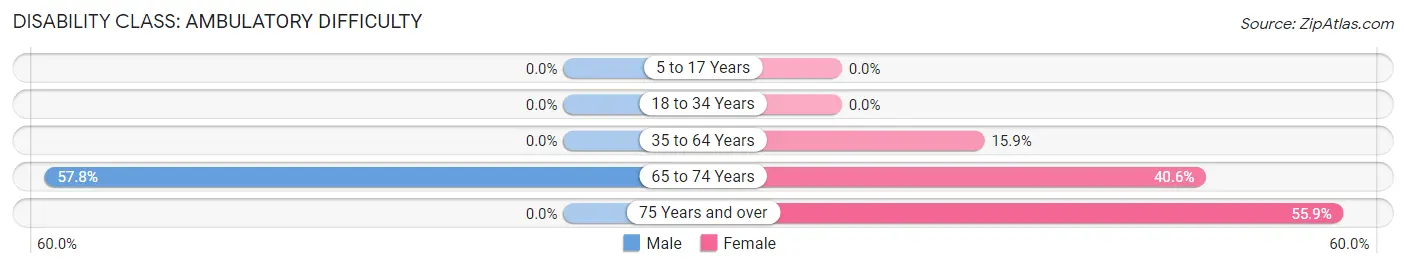
| Age Bracket | Male | Female |
| 5 to 17 Years | 0 (0.0%) | 0 (0.0%) |
| 18 to 34 Years | 0 (0.0%) | 0 (0.0%) |
| 35 to 64 Years | 0 (0.0%) | 24 (15.9%) |
| 65 to 74 Years | 26 (57.8%) | 28 (40.6%) |
| 75 Years and over | 0 (0.0%) | 19 (55.9%) |
Disability Class: Self-Care Difficulty
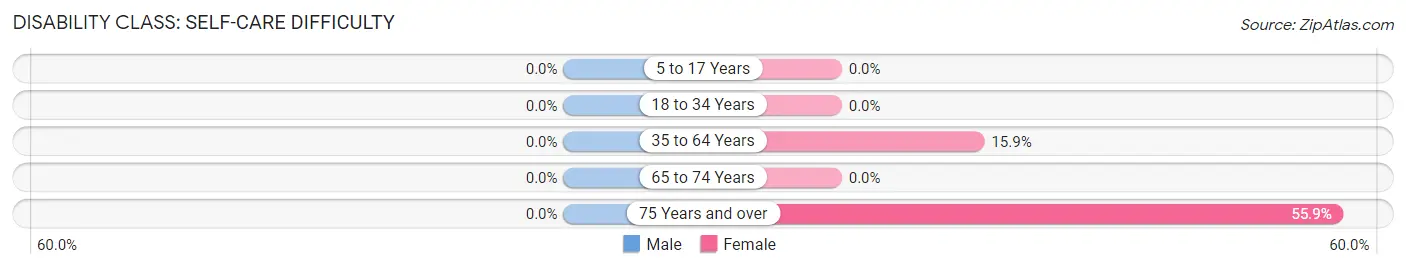
| Age Bracket | Male | Female |
| 5 to 17 Years | 0 (0.0%) | 0 (0.0%) |
| 18 to 34 Years | 0 (0.0%) | 0 (0.0%) |
| 35 to 64 Years | 0 (0.0%) | 24 (15.9%) |
| 65 to 74 Years | 0 (0.0%) | 0 (0.0%) |
| 75 Years and over | 0 (0.0%) | 19 (55.9%) |
Technology Access in East Williston
Computing Device Access in East Williston
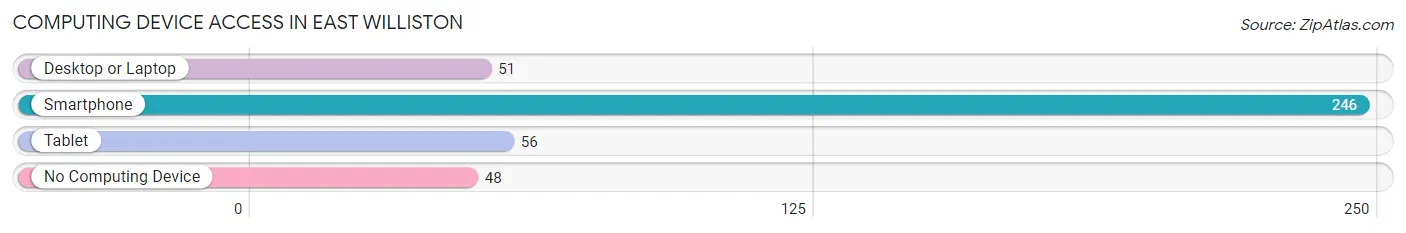
| Device Type | # Households | % Households |
| Desktop or Laptop | 51 | 15.5% |
| Smartphone | 246 | 75.0% |
| Tablet | 56 | 17.1% |
| No Computing Device | 48 | 14.6% |
| Total | 328 | 100.0% |
Internet Access in East Williston
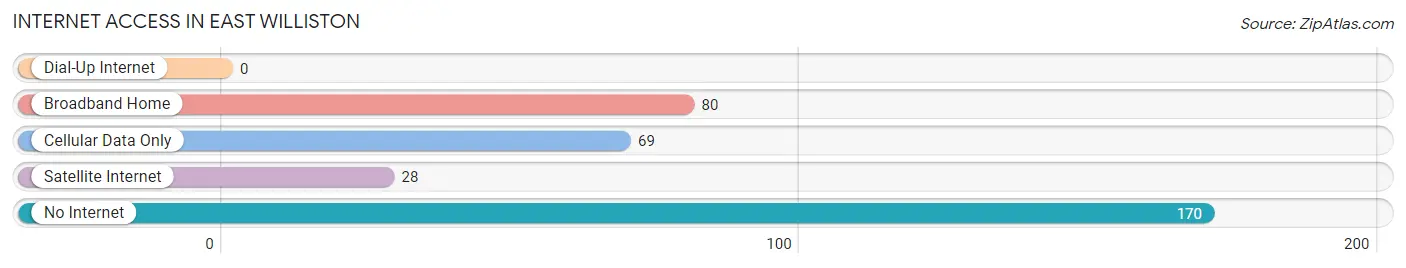
| Internet Type | # Households | % Households |
| Dial-Up Internet | 0 | 0.0% |
| Broadband Home | 80 | 24.4% |
| Cellular Data Only | 69 | 21.0% |
| Satellite Internet | 28 | 8.5% |
| No Internet | 170 | 51.8% |
| Total | 328 | 100.0% |
East Williston Summary
Williston is a small town located in Levy County, Florida. It is situated on the western side of the Suwannee River, about 25 miles west of Gainesville. The town was founded in 1858 and was named after Colonel William Williston, a prominent local landowner. The town was incorporated in 1887 and has a population of approximately 2,500 people.
History
Williston was founded in 1858 by Colonel William Williston, a prominent local landowner. The town was named after him and was incorporated in 1887. The town was originally a farming community, but it soon became a center for the timber industry. The town was also home to a number of sawmills and turpentine stills.
In the early 1900s, Williston began to experience a period of growth and development. The town was connected to the railroad in 1906, which allowed for the transportation of goods and services. This helped to spur the growth of the town and the surrounding area.
In the 1920s, Williston experienced a period of economic prosperity. The town was home to a number of businesses, including a bank, a hotel, a movie theater, and a number of stores. The town also had a number of churches and schools.
In the 1950s, Williston experienced a period of decline. The timber industry began to decline and the town began to experience a period of economic stagnation. The town was also affected by the Great Depression and World War II.
Geography
Williston is located in Levy County, Florida. It is situated on the western side of the Suwannee River, about 25 miles west of Gainesville. The town is located in a rural area and is surrounded by farmland and forests. The town is located at an elevation of about 100 feet above sea level.
The climate in Williston is humid subtropical, with hot, humid summers and mild winters. The average temperature in the summer is around 90 degrees Fahrenheit, while the average temperature in the winter is around 60 degrees Fahrenheit.
Economy
Williston’s economy is largely based on agriculture and timber. The town is home to a number of farms, which produce a variety of crops, including corn, soybeans, and cotton. The town is also home to a number of timber companies, which harvest timber from the surrounding forests.
The town is also home to a number of businesses, including restaurants, stores, and hotels. The town is also home to a number of manufacturing companies, which produce a variety of products, including furniture, clothing, and electronics.
Demographics
As of the 2010 census, Williston had a population of 2,500 people. The racial makeup of the town was 75.2% White, 17.2% African American, 0.4% Native American, 0.4% Asian, 0.2% Pacific Islander, and 6.6% from other races. The median household income in Williston was $30,000, and the median family income was $35,000.
Williston is a small town with a rich history and a diverse population. The town is home to a number of businesses and industries, and it is a great place to live and work. The town is also home to a number of churches and schools, which provide a great education for the town’s children.
Common Questions
What is Per Capita Income in East Williston?
Per Capita income in East Williston is $13,011.
What is the Median Family Income in East Williston?
Median Family Income in East Williston is $21,627.
What is Income or Wage Gap in East Williston?
Income or Wage Gap in East Williston is 24.5%.
Women in East Williston earn 75.5 cents for every dollar earned by a man.
What is Family Income Deficit in East Williston?
Family Income Deficit in East Williston is $8,821.
Families that are below poverty line in East Williston earn $8,821 less on average than the poverty threshold level.
What is Inequality or Gini Index in East Williston?
Inequality or Gini Index in East Williston is 0.48.
What is the Total Population of East Williston?
Total Population of East Williston is 674.
What is the Total Male Population of East Williston?
Total Male Population of East Williston is 253.
What is the Total Female Population of East Williston?
Total Female Population of East Williston is 421.
What is the Ratio of Males per 100 Females in East Williston?
There are 60.10 Males per 100 Females in East Williston.
What is the Ratio of Females per 100 Males in East Williston?
There are 166.40 Females per 100 Males in East Williston.
What is the Median Population Age in East Williston?
Median Population Age in East Williston is 55.2 Years.
What is the Average Family Size in East Williston
Average Family Size in East Williston is 2.7 People.
What is the Average Household Size in East Williston
Average Household Size in East Williston is 2.0 People.
How Large is the Labor Force in East Williston?
There are 221 People in the Labor Forcein in East Williston.
What is the Percentage of People in the Labor Force in East Williston?
37.7% of People are in the Labor Force in East Williston.
What is the Unemployment Rate in East Williston?
Unemployment Rate in East Williston is 13.6%.