Zip Codes with the Highest Percentage of Population Employed in Food Preparation & Serving in Spring Hill, FL
RELATED REPORTS & OPTIONS
Food Preparation & Serving
Spring Hill
Compare Zip Codes
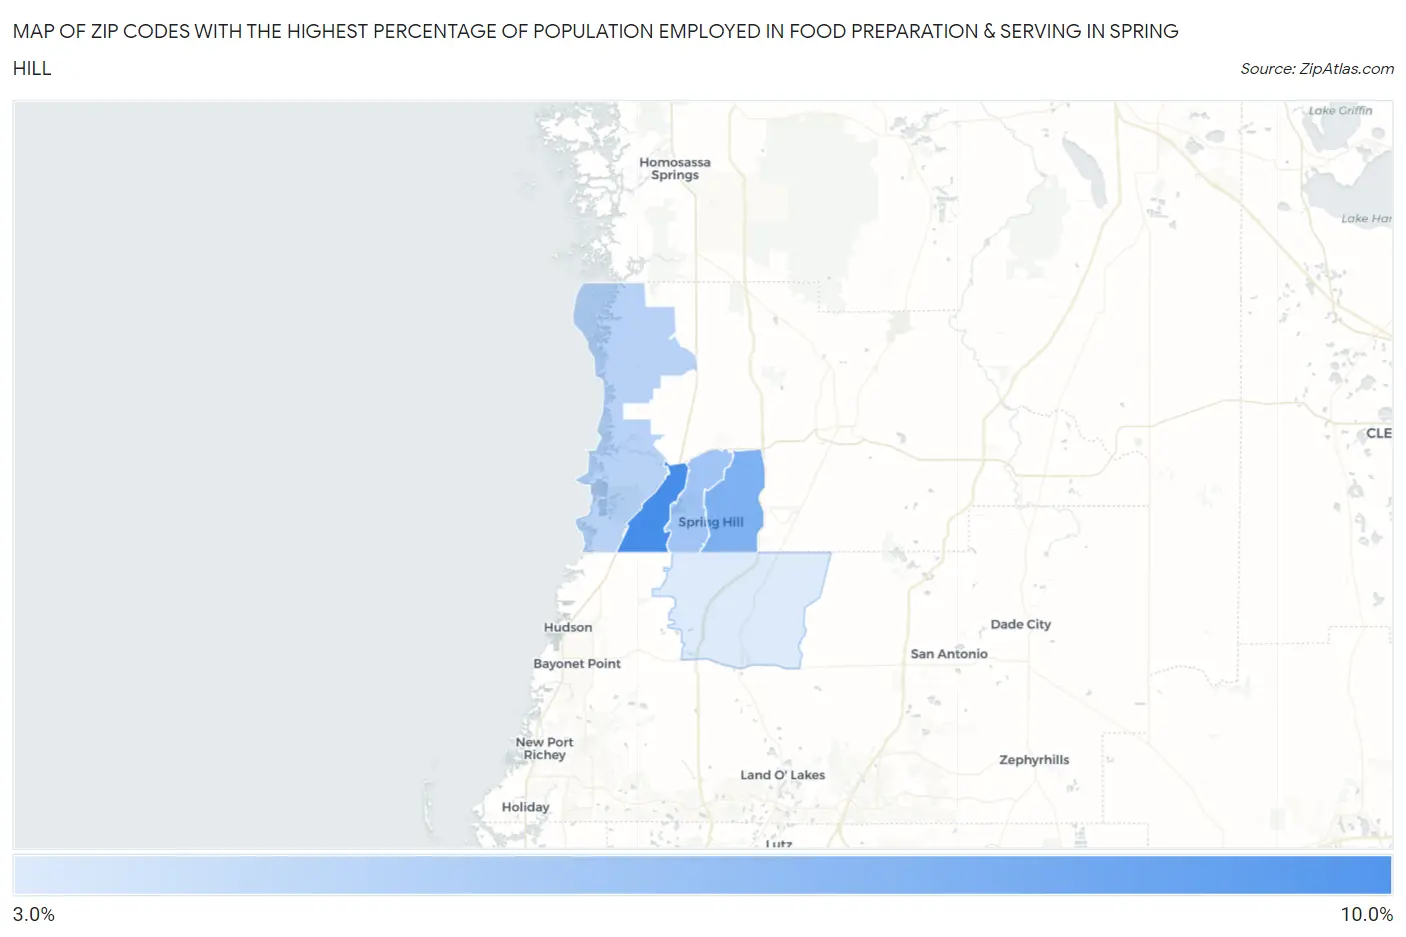
Map of Zip Codes with the Highest Percentage of Population Employed in Food Preparation & Serving in Spring Hill
3.9%
8.2%
Zip Codes with the Highest Percentage of Population Employed in Food Preparation & Serving in Spring Hill, FL
| Zip Code | % Employed | vs State | vs National | |
| 1. | 34606 | 8.2% | 6.1%(+2.06)#187 | 5.3%(+2.86)#4,511 |
| 2. | 34609 | 6.6% | 6.1%(+0.480)#377 | 5.3%(+1.28)#7,675 |
| 3. | 34608 | 5.6% | 6.1%(-0.483)#517 | 5.3%(+0.321)#10,678 |
| 4. | 34607 | 4.9% | 6.1%(-1.18)#612 | 5.3%(-0.378)#13,308 |
| 5. | 34610 | 3.9% | 6.1%(-2.18)#735 | 5.3%(-1.37)#17,482 |
1
Common Questions
What are the Top 3 Zip Codes with the Highest Percentage of Population Employed in Food Preparation & Serving in Spring Hill, FL?
Top 3 Zip Codes with the Highest Percentage of Population Employed in Food Preparation & Serving in Spring Hill, FL are:
What zip code has the Highest Percentage of Population Employed in Food Preparation & Serving in Spring Hill, FL?
34606 has the Highest Percentage of Population Employed in Food Preparation & Serving in Spring Hill, FL with 8.2%.
What is the Percentage of Population Employed in Food Preparation & Serving in Spring Hill, FL?
Percentage of Population Employed in Food Preparation & Serving in Spring Hill is 6.7%.
What is the Percentage of Population Employed in Food Preparation & Serving in Florida?
Percentage of Population Employed in Food Preparation & Serving in Florida is 6.1%.
What is the Percentage of Population Employed in Food Preparation & Serving in the United States?
Percentage of Population Employed in Food Preparation & Serving in the United States is 5.3%.