Trilby, FL Map & Demographics
Trilby Map
Trilby Overview
$28,964
PER CAPITA INCOME
$85,663
AVG FAMILY INCOME
31.2%
WAGE / INCOME GAP [ % ]
68.8¢/ $1
WAGE / INCOME GAP [ $ ]
0.27
INEQUALITY / GINI INDEX
329
TOTAL POPULATION
211
MALE POPULATION
118
FEMALE POPULATION
178.81
MALES / 100 FEMALES
55.92
FEMALES / 100 MALES
32.3
MEDIAN AGE
2.9
AVG FAMILY SIZE
2.3
AVG HOUSEHOLD SIZE
228
LABOR FORCE [ PEOPLE ]
82.9%
PERCENT IN LABOR FORCE
Income in Trilby
Income Overview in Trilby
| Characteristic | Number | Measure |
| Per Capita Income | 329 | $28,964 |
| Median Family Income | 98 | $85,663 |
| Mean Family Income | 98 | $75,532 |
| Median Household Income | 144 | $0 |
| Mean Household Income | 144 | $61,288 |
| Income Deficit | 98 | $0 |
| Wage / Income Gap (%) | 329 | 31.17% |
| Wage / Income Gap ($) | 329 | 68.83¢ per $1 |
| Gini / Inequality Index | 329 | 0.27 |
Earnings by Sex in Trilby
Average Earnings in Trilby are $31,582, $44,292 for men and $30,485 for women, a difference of 31.2%.
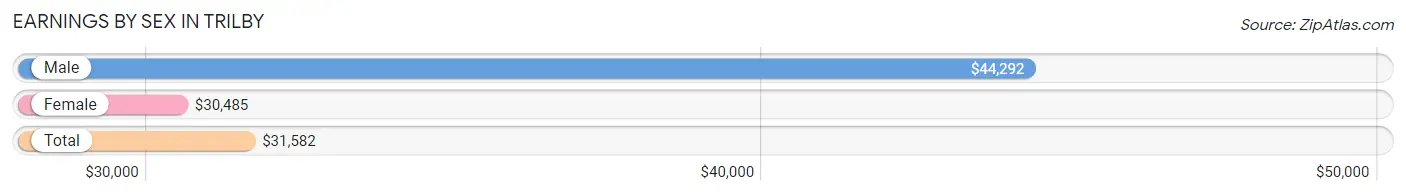
| Sex | Number | Average Earnings |
| Male | 135 (59.2%) | $44,292 |
| Female | 93 (40.8%) | $30,485 |
| Total | 228 (100.0%) | $31,582 |
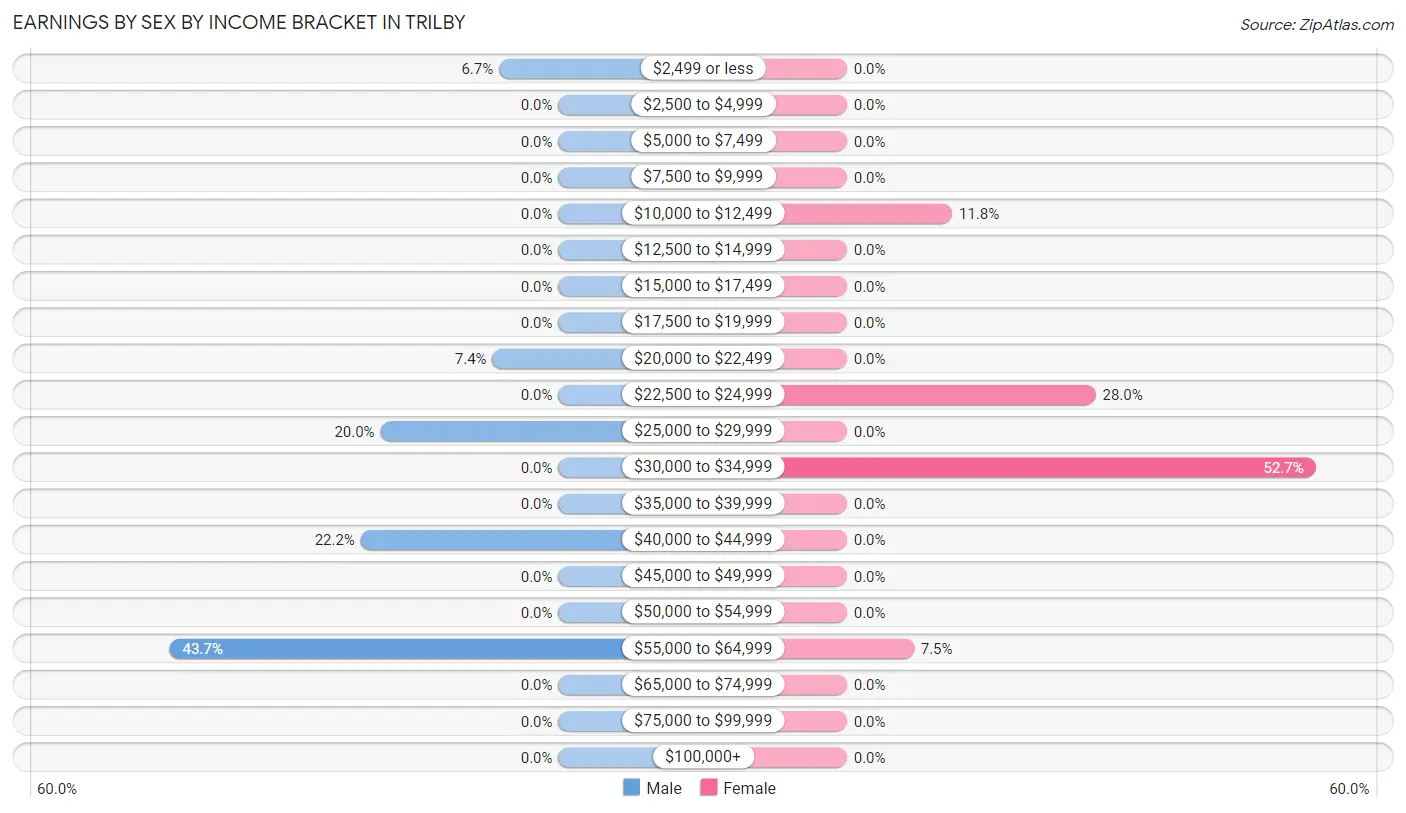
Earnings by Sex by Income Bracket in Trilby
The most common earnings brackets in Trilby are $55,000 to $64,999 for men (59 | 43.7%) and $30,000 to $34,999 for women (49 | 52.7%).
| Income | Male | Female |
| $2,499 or less | 9 (6.7%) | 0 (0.0%) |
| $2,500 to $4,999 | 0 (0.0%) | 0 (0.0%) |
| $5,000 to $7,499 | 0 (0.0%) | 0 (0.0%) |
| $7,500 to $9,999 | 0 (0.0%) | 0 (0.0%) |
| $10,000 to $12,499 | 0 (0.0%) | 11 (11.8%) |
| $12,500 to $14,999 | 0 (0.0%) | 0 (0.0%) |
| $15,000 to $17,499 | 0 (0.0%) | 0 (0.0%) |
| $17,500 to $19,999 | 0 (0.0%) | 0 (0.0%) |
| $20,000 to $22,499 | 10 (7.4%) | 0 (0.0%) |
| $22,500 to $24,999 | 0 (0.0%) | 26 (28.0%) |
| $25,000 to $29,999 | 27 (20.0%) | 0 (0.0%) |
| $30,000 to $34,999 | 0 (0.0%) | 49 (52.7%) |
| $35,000 to $39,999 | 0 (0.0%) | 0 (0.0%) |
| $40,000 to $44,999 | 30 (22.2%) | 0 (0.0%) |
| $45,000 to $49,999 | 0 (0.0%) | 0 (0.0%) |
| $50,000 to $54,999 | 0 (0.0%) | 0 (0.0%) |
| $55,000 to $64,999 | 59 (43.7%) | 7 (7.5%) |
| $65,000 to $74,999 | 0 (0.0%) | 0 (0.0%) |
| $75,000 to $99,999 | 0 (0.0%) | 0 (0.0%) |
| $100,000+ | 0 (0.0%) | 0 (0.0%) |
| Total | 135 (100.0%) | 93 (100.0%) |
Earnings by Sex by Educational Attainment in Trilby
| Educational Attainment | Male Income | Female Income |
| Less than High School | - | - |
| High School Diploma | - | - |
| College or Associate's Degree | - | - |
| Bachelor's Degree | - | - |
| Graduate Degree | - | - |
| Total | $55,403 | $30,485 |
Family Income in Trilby
Family Income Brackets in Trilby
According to the Trilby family income data, there are 49 families falling into the $75,000 to $99,999 income range, which is the most common income bracket and makes up 50.0% of all families.
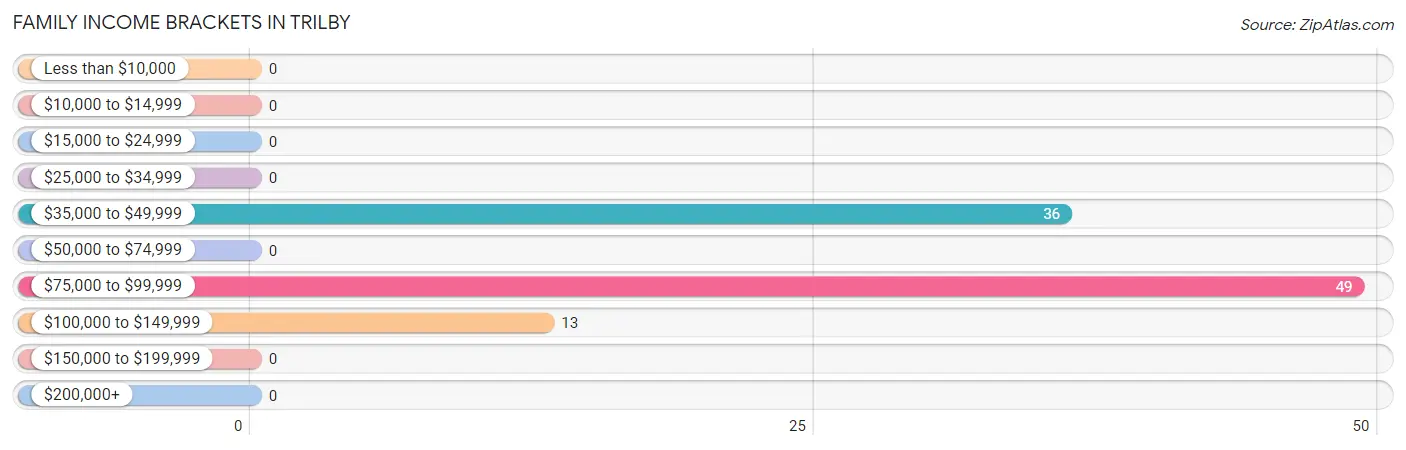
| Income Bracket | # Families | % Families |
| Less than $10,000 | 0 | 0.0% |
| $10,000 to $14,999 | 0 | 0.0% |
| $15,000 to $24,999 | 0 | 0.0% |
| $25,000 to $34,999 | 0 | 0.0% |
| $35,000 to $49,999 | 36 | 36.7% |
| $50,000 to $74,999 | 0 | 0.0% |
| $75,000 to $99,999 | 49 | 50.0% |
| $100,000 to $149,999 | 13 | 13.3% |
| $150,000 to $199,999 | 0 | 0.0% |
| $200,000+ | 0 | 0.0% |
Family Income by Famaliy Size in Trilby
2-person families (42 | 42.9%) account for the highest median family income in Trilby with $48,558 per family, while 2-person families (42 | 42.9%) have the highest median income of $24,279 per family member.
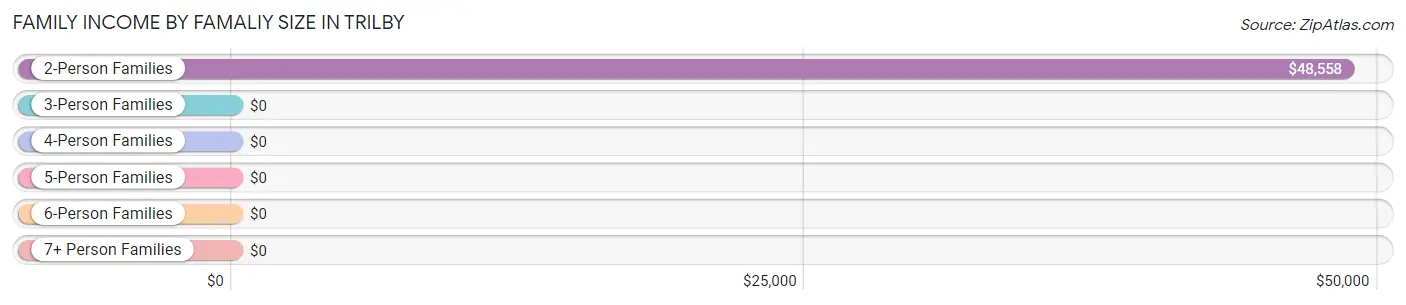
| Income Bracket | # Families | Median Income |
| 2-Person Families | 42 (42.9%) | $48,558 |
| 3-Person Families | 49 (50.0%) | $0 |
| 4-Person Families | 0 (0.0%) | $0 |
| 5-Person Families | 7 (7.1%) | $0 |
| 6-Person Families | 0 (0.0%) | $0 |
| 7+ Person Families | 0 (0.0%) | $0 |
| Total | 98 (100.0%) | $85,663 |
Family Income by Number of Earners in Trilby
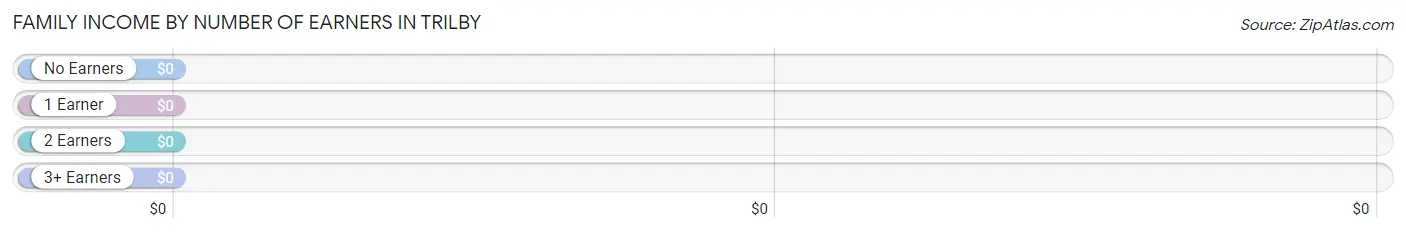
| Number of Earners | # Families | Median Income |
| No Earners | 6 (6.1%) | $0 |
| 1 Earner | 10 (10.2%) | $0 |
| 2 Earners | 75 (76.5%) | $0 |
| 3+ Earners | 7 (7.1%) | $0 |
| Total | 98 (100.0%) | $85,663 |
Household Income in Trilby
Household Income Brackets in Trilby
With 66 households falling in the category, the $35,000 to $49,999 income range is the most frequent in Trilby, accounting for 45.8% of all households.
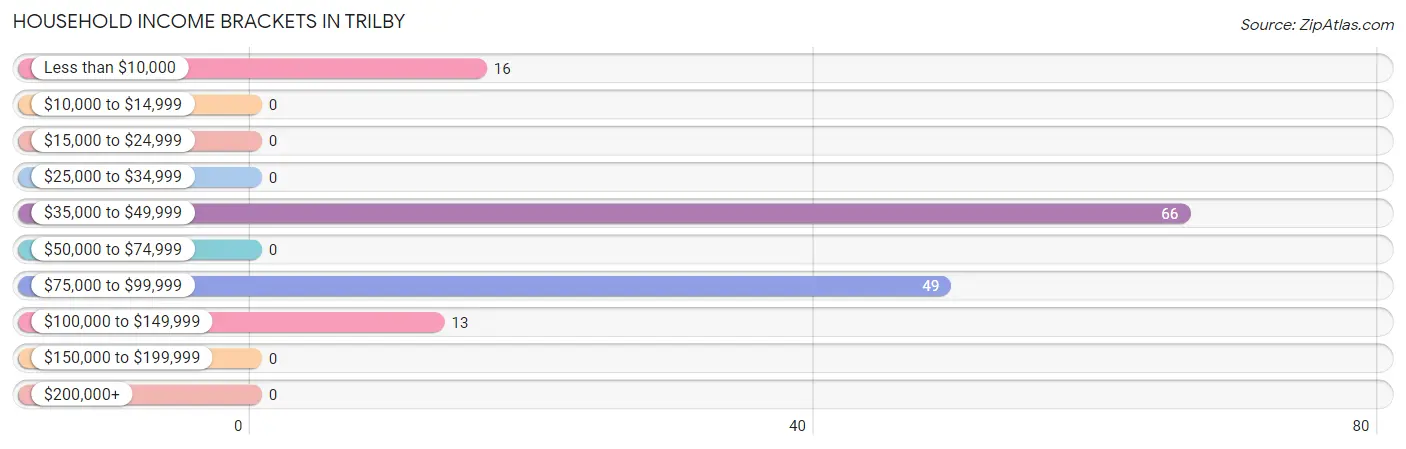
| Income Bracket | # Households | % Households |
| Less than $10,000 | 16 | 11.1% |
| $10,000 to $14,999 | 0 | 0.0% |
| $15,000 to $24,999 | 0 | 0.0% |
| $25,000 to $34,999 | 0 | 0.0% |
| $35,000 to $49,999 | 66 | 45.8% |
| $50,000 to $74,999 | 0 | 0.0% |
| $75,000 to $99,999 | 49 | 34.0% |
| $100,000 to $149,999 | 13 | 9.0% |
| $150,000 to $199,999 | 0 | 0.0% |
| $200,000+ | 0 | 0.0% |
Household Income by Householder Age in Trilby
The median household income in Trilby is $0, with the highest median household income of $44,167 found in the 45 to 64 years age bracket for the primary householder. A total of 72 households (50.0%) fall into this category.
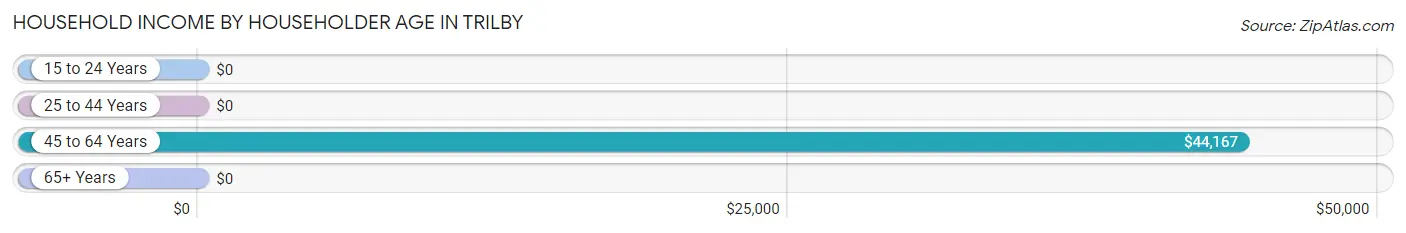
| Income Bracket | # Households | Median Income |
| 15 to 24 Years | 0 (0.0%) | $0 |
| 25 to 44 Years | 49 (34.0%) | $0 |
| 45 to 64 Years | 72 (50.0%) | $44,167 |
| 65+ Years | 23 (16.0%) | $0 |
| Total | 144 (100.0%) | $0 |
Poverty in Trilby
Income Below Poverty by Sex and Age in Trilby
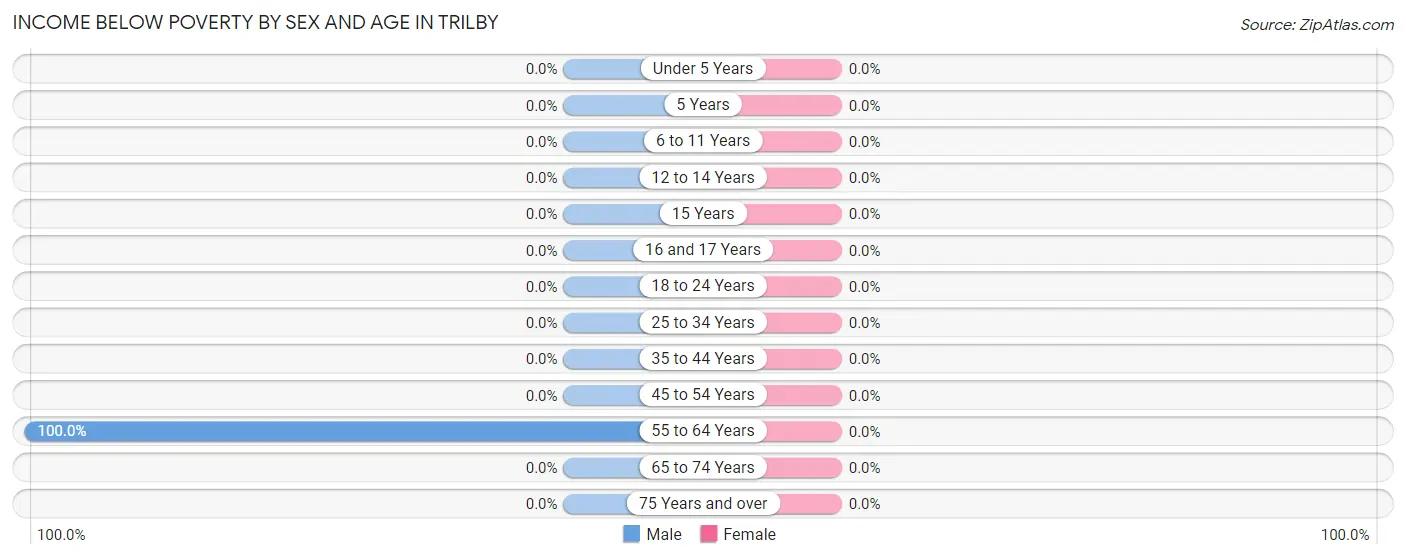
| Age Bracket | Male | Female |
| Under 5 Years | 0 (0.0%) | 0 (0.0%) |
| 5 Years | 0 (0.0%) | 0 (0.0%) |
| 6 to 11 Years | 0 (0.0%) | 0 (0.0%) |
| 12 to 14 Years | 0 (0.0%) | 0 (0.0%) |
| 15 Years | 0 (0.0%) | 0 (0.0%) |
| 16 and 17 Years | 0 (0.0%) | 0 (0.0%) |
| 18 to 24 Years | 0 (0.0%) | 0 (0.0%) |
| 25 to 34 Years | 0 (0.0%) | 0 (0.0%) |
| 35 to 44 Years | 0 (0.0%) | 0 (0.0%) |
| 45 to 54 Years | 0 (0.0%) | 0 (0.0%) |
| 55 to 64 Years | 16 (100.0%) | 0 (0.0%) |
| 65 to 74 Years | 0 (0.0%) | 0 (0.0%) |
| 75 Years and over | 0 (0.0%) | 0 (0.0%) |
| Total | 16 (7.6%) | 0 (0.0%) |
Income Above Poverty by Sex and Age in Trilby
According to the poverty statistics in Trilby, males aged 6 to 11 years and females aged under 5 years are the age groups that are most secure financially, with 100.0% of males and 100.0% of females in these age groups living above the poverty line.
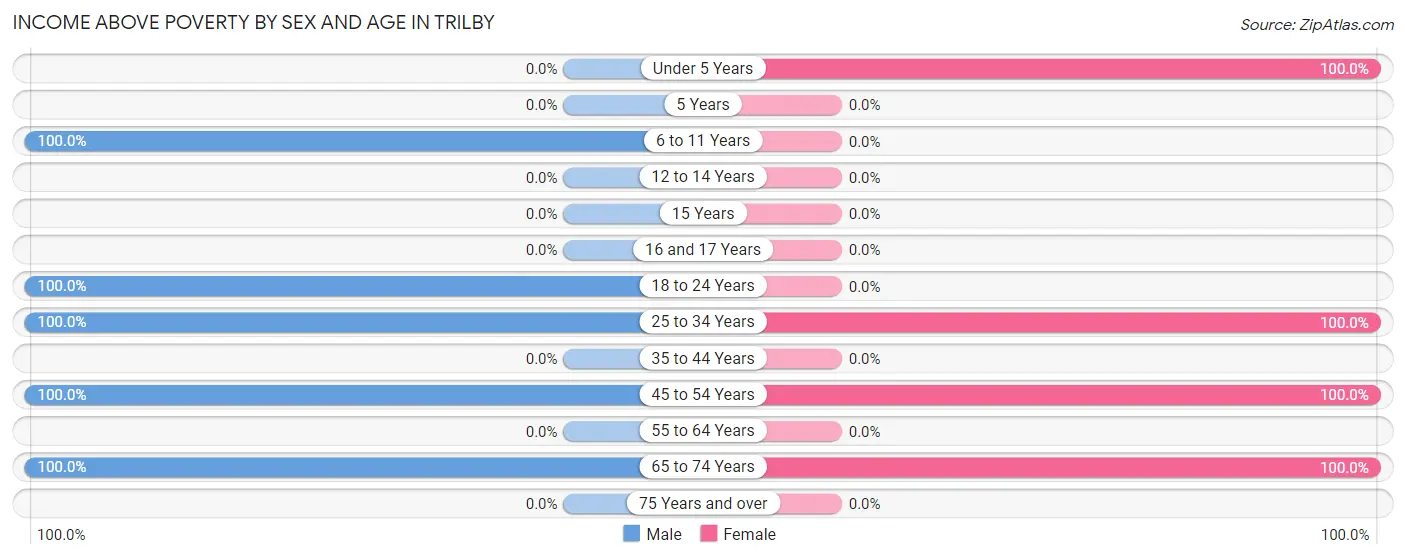
| Age Bracket | Male | Female |
| Under 5 Years | 0 (0.0%) | 8 (100.0%) |
| 5 Years | 0 (0.0%) | 0 (0.0%) |
| 6 to 11 Years | 46 (100.0%) | 0 (0.0%) |
| 12 to 14 Years | 0 (0.0%) | 0 (0.0%) |
| 15 Years | 0 (0.0%) | 0 (0.0%) |
| 16 and 17 Years | 0 (0.0%) | 0 (0.0%) |
| 18 to 24 Years | 44 (100.0%) | 0 (0.0%) |
| 25 to 34 Years | 59 (100.0%) | 49 (100.0%) |
| 35 to 44 Years | 0 (0.0%) | 0 (0.0%) |
| 45 to 54 Years | 30 (100.0%) | 37 (100.0%) |
| 55 to 64 Years | 0 (0.0%) | 0 (0.0%) |
| 65 to 74 Years | 16 (100.0%) | 24 (100.0%) |
| 75 Years and over | 0 (0.0%) | 0 (0.0%) |
| Total | 195 (92.4%) | 118 (100.0%) |
Income Below Poverty Among Married-Couple Families in Trilby
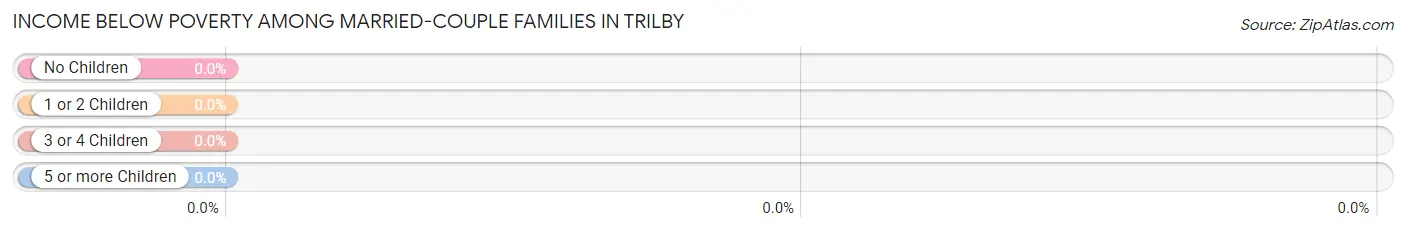
| Children | Above Poverty | Below Poverty |
| No Children | 16 (100.0%) | 0 (0.0%) |
| 1 or 2 Children | 49 (100.0%) | 0 (0.0%) |
| 3 or 4 Children | 0 (0.0%) | 0 (0.0%) |
| 5 or more Children | 0 (0.0%) | 0 (0.0%) |
| Total | 65 (100.0%) | 0 (0.0%) |
Income Below Poverty Among Single-Parent Households in Trilby
| Children | Single Father | Single Mother |
| No Children | 0 (0.0%) | 0 (0.0%) |
| 1 or 2 Children | 0 (0.0%) | 0 (0.0%) |
| 3 or 4 Children | 0 (0.0%) | 0 (0.0%) |
| 5 or more Children | 0 (0.0%) | 0 (0.0%) |
| Total | 0 (0.0%) | 0 (0.0%) |
Income Below Poverty Among Married-Couple vs Single-Parent Households in Trilby
| Children | Married-Couple Families | Single-Parent Households |
| No Children | 0 (0.0%) | 0 (0.0%) |
| 1 or 2 Children | 0 (0.0%) | 0 (0.0%) |
| 3 or 4 Children | 0 (0.0%) | 0 (0.0%) |
| 5 or more Children | 0 (0.0%) | 0 (0.0%) |
| Total | 0 (0.0%) | 0 (0.0%) |
Race in Trilby
The most populous races in Trilby are Asian (154 | 46.8%), White / Caucasian (101 | 30.7%), and Black / African American (46 | 14.0%).
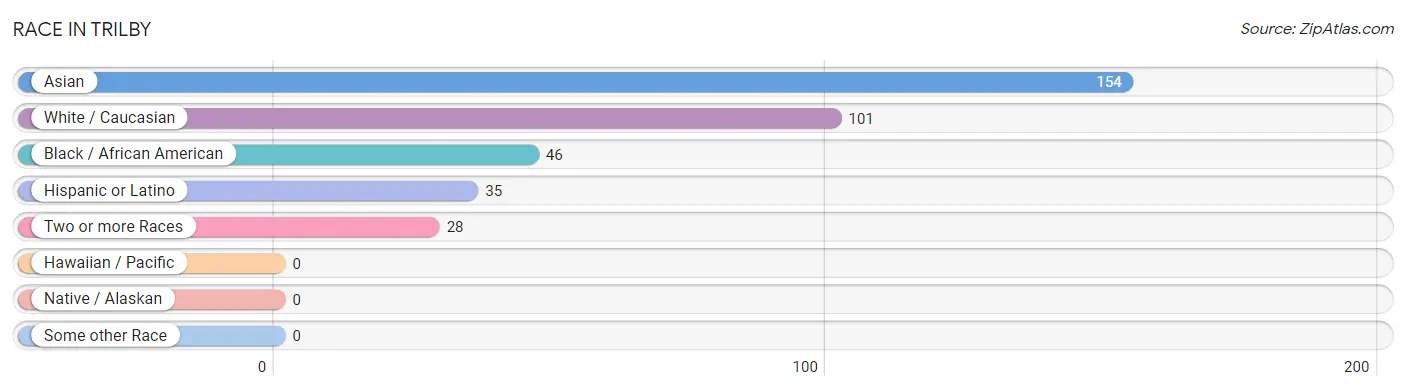
| Race | # Population | % Population |
| Asian | 154 | 46.8% |
| Black / African American | 46 | 14.0% |
| Hawaiian / Pacific | 0 | 0.0% |
| Hispanic or Latino | 35 | 10.6% |
| Native / Alaskan | 0 | 0.0% |
| White / Caucasian | 101 | 30.7% |
| Two or more Races | 28 | 8.5% |
| Some other Race | 0 | 0.0% |
| Total | 329 | 100.0% |
Ancestry in Trilby
The most populous ancestries reported in Trilby are Indian (Asian) (154 | 46.8%), English (53 | 16.1%), Cuban (35 | 10.6%), German (17 | 5.2%), and Polish (10 | 3.0%), together accounting for 81.8% of all Trilby residents.
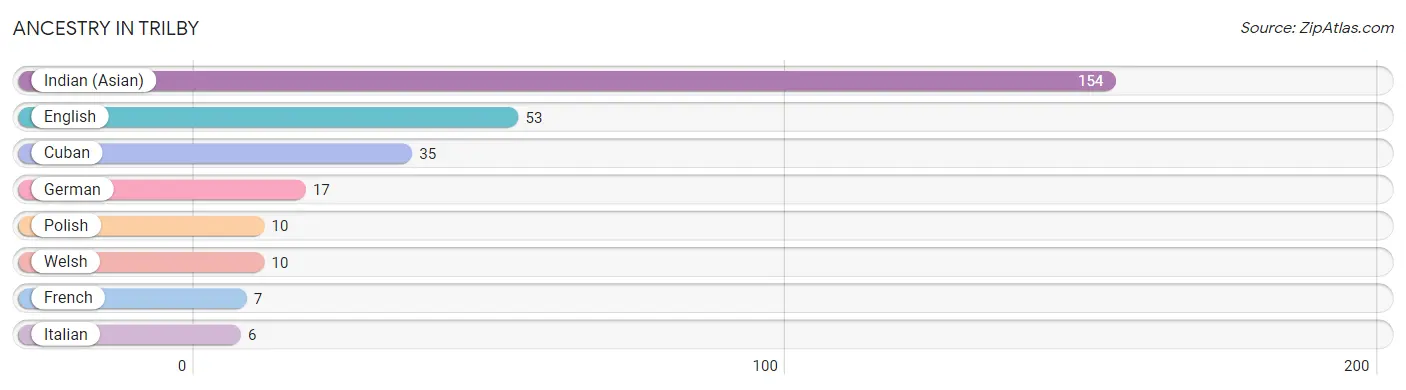
| Ancestry | # Population | % Population |
| Cuban | 35 | 10.6% |
| English | 53 | 16.1% |
| French | 7 | 2.1% |
| German | 17 | 5.2% |
| Indian (Asian) | 154 | 46.8% |
| Italian | 6 | 1.8% |
| Polish | 10 | 3.0% |
| Welsh | 10 | 3.0% | View All 8 Rows |
Immigrants in Trilby
The most numerous immigrant groups reported in Trilby came from Asia (108 | 32.8%), China (108 | 32.8%), Eastern Asia (108 | 32.8%), Caribbean (7 | 2.1%), and Cuba (7 | 2.1%), together accounting for 102.8% of all Trilby residents.
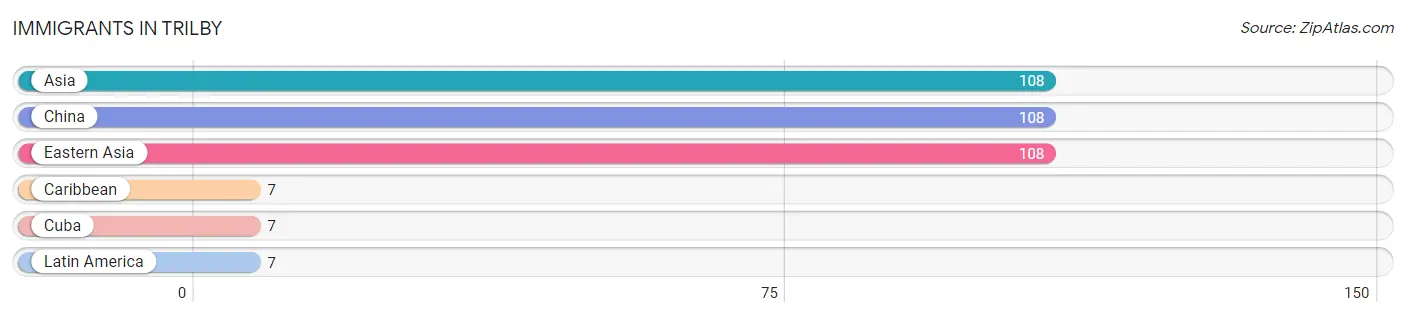
| Immigration Origin | # Population | % Population |
| Asia | 108 | 32.8% |
| Caribbean | 7 | 2.1% |
| China | 108 | 32.8% |
| Cuba | 7 | 2.1% |
| Eastern Asia | 108 | 32.8% |
| Latin America | 7 | 2.1% | View All 6 Rows |
Sex and Age in Trilby
Sex and Age in Trilby
The most populous age groups in Trilby are 30 to 34 Years (59 | 28.0%) for men and 30 to 34 Years (49 | 41.5%) for women.
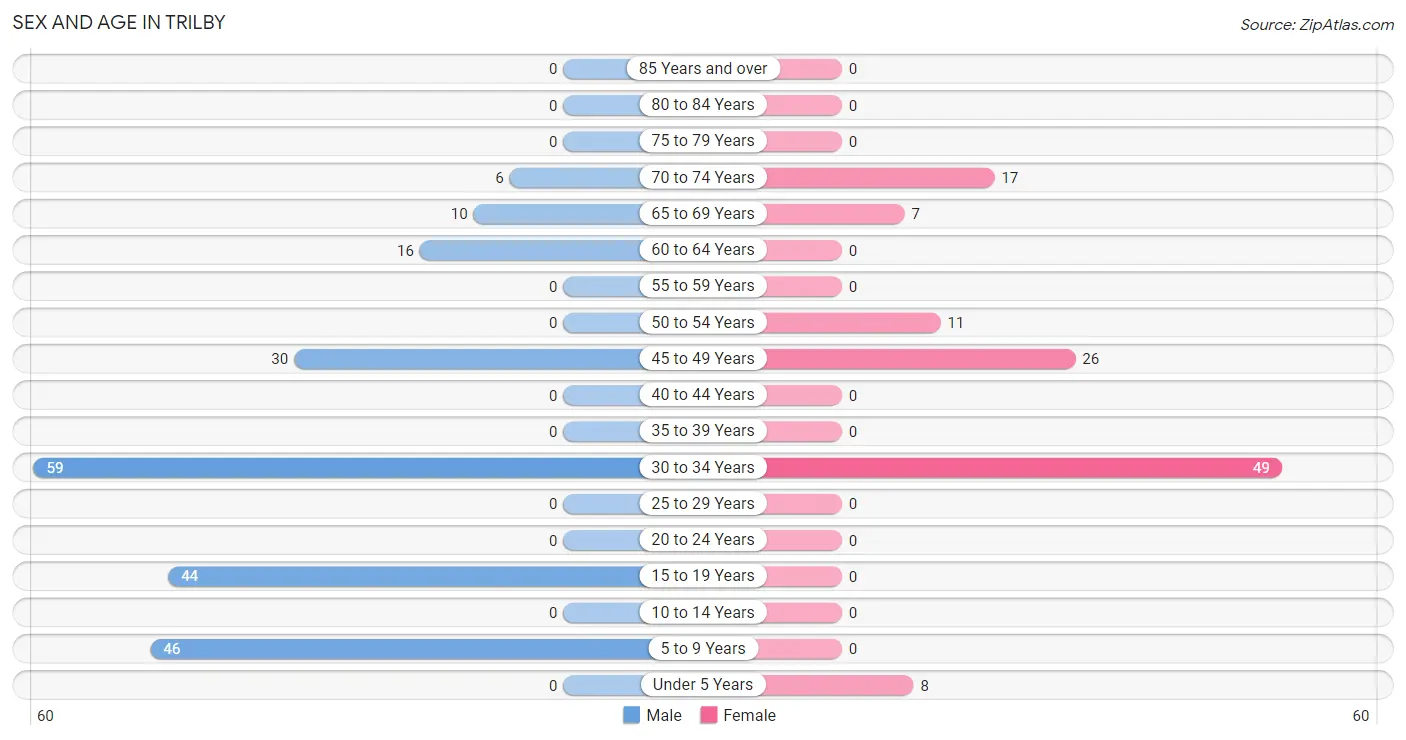
| Age Bracket | Male | Female |
| Under 5 Years | 0 (0.0%) | 8 (6.8%) |
| 5 to 9 Years | 46 (21.8%) | 0 (0.0%) |
| 10 to 14 Years | 0 (0.0%) | 0 (0.0%) |
| 15 to 19 Years | 44 (20.8%) | 0 (0.0%) |
| 20 to 24 Years | 0 (0.0%) | 0 (0.0%) |
| 25 to 29 Years | 0 (0.0%) | 0 (0.0%) |
| 30 to 34 Years | 59 (28.0%) | 49 (41.5%) |
| 35 to 39 Years | 0 (0.0%) | 0 (0.0%) |
| 40 to 44 Years | 0 (0.0%) | 0 (0.0%) |
| 45 to 49 Years | 30 (14.2%) | 26 (22.0%) |
| 50 to 54 Years | 0 (0.0%) | 11 (9.3%) |
| 55 to 59 Years | 0 (0.0%) | 0 (0.0%) |
| 60 to 64 Years | 16 (7.6%) | 0 (0.0%) |
| 65 to 69 Years | 10 (4.7%) | 7 (5.9%) |
| 70 to 74 Years | 6 (2.8%) | 17 (14.4%) |
| 75 to 79 Years | 0 (0.0%) | 0 (0.0%) |
| 80 to 84 Years | 0 (0.0%) | 0 (0.0%) |
| 85 Years and over | 0 (0.0%) | 0 (0.0%) |
| Total | 211 (100.0%) | 118 (100.0%) |
Families and Households in Trilby
Median Family Size in Trilby
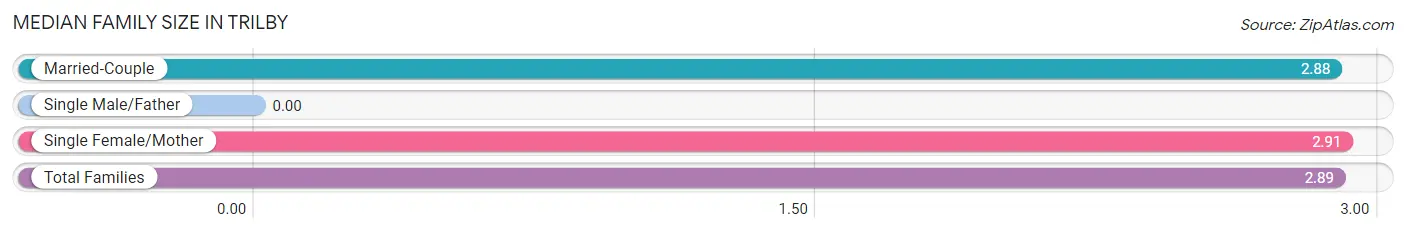
| Family Type | # Families | Family Size |
| Married-Couple | 65 (66.3%) | 2.88 |
| Single Male/Father | 0 (0.0%) | - |
| Single Female/Mother | 33 (33.7%) | 2.91 |
| Total Families | 98 (100.0%) | 2.89 |
Median Household Size in Trilby
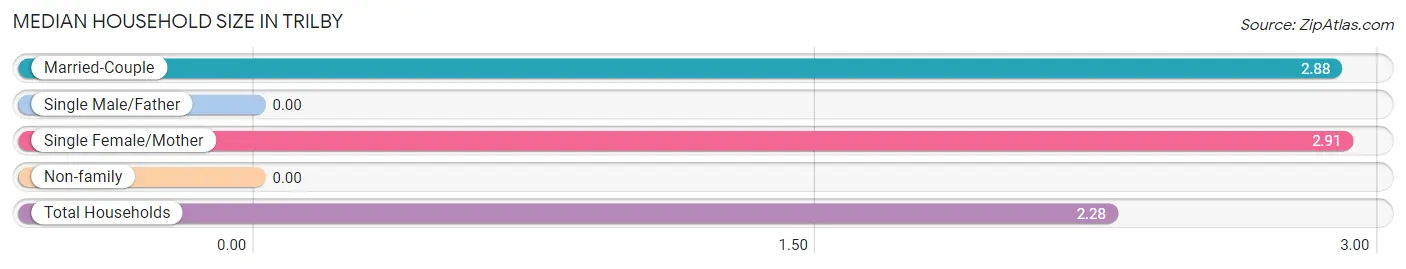
| Household Type | # Households | Household Size |
| Married-Couple | 65 (45.1%) | 2.88 |
| Single Male/Father | 0 (0.0%) | - |
| Single Female/Mother | 33 (22.9%) | 2.91 |
| Non-family | 46 (31.9%) | - |
| Total Households | 144 (100.0%) | 2.28 |
Household Size by Marriage Status in Trilby
Out of a total of 144 households in Trilby, 98 (68.1%) are family households, while 46 (31.9%) are nonfamily households. The most numerous type of family households are 3-person households, comprising 49, and the most common type of nonfamily households are 1-person households, comprising 46.
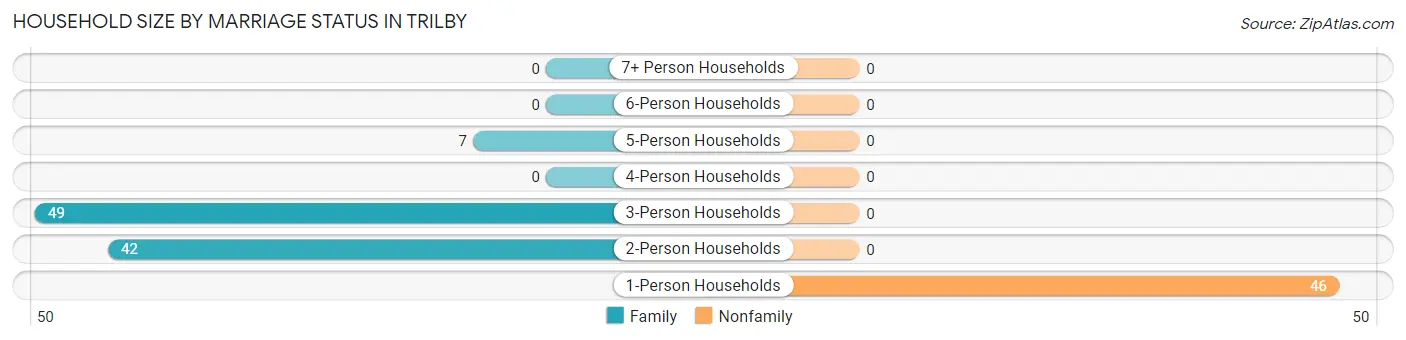
| Household Size | Family Households | Nonfamily Households |
| 1-Person Households | - | 46 (31.9%) |
| 2-Person Households | 42 (29.2%) | 0 (0.0%) |
| 3-Person Households | 49 (34.0%) | 0 (0.0%) |
| 4-Person Households | 0 (0.0%) | 0 (0.0%) |
| 5-Person Households | 7 (4.9%) | 0 (0.0%) |
| 6-Person Households | 0 (0.0%) | 0 (0.0%) |
| 7+ Person Households | 0 (0.0%) | 0 (0.0%) |
| Total | 98 (68.1%) | 46 (31.9%) |
Female Fertility in Trilby
Fertility by Age in Trilby
| Age Bracket | Women with Births | Births / 1,000 Women |
| 15 to 19 years | 0 (0.0%) | 0.0 |
| 20 to 34 years | 0 (0.0%) | 0.0 |
| 35 to 50 years | 0 (0.0%) | 0.0 |
| Total | 0 (0.0%) | 0.0 |
Fertility by Age by Marriage Status in Trilby
| Age Bracket | Married | Unmarried |
| 15 to 19 years | 0 (0.0%) | 0 (0.0%) |
| 20 to 34 years | 0 (0.0%) | 0 (0.0%) |
| 35 to 50 years | 0 (0.0%) | 0 (0.0%) |
| Total | 0 (0.0%) | 0 (0.0%) |
Fertility by Education in Trilby
| Educational Attainment | Women with Births | Births / 1,000 Women |
| Less than High School | 0 (0.0%) | 0.0 |
| High School Diploma | 0 (0.0%) | 0.0 |
| College or Associate's Degree | 0 (0.0%) | 0.0 |
| Bachelor's Degree | 0 (0.0%) | 0.0 |
| Graduate Degree | 0 (0.0%) | 0.0 |
| Total | 0 (0.0%) | 0.0 |
Fertility by Education by Marriage Status in Trilby
| Educational Attainment | Married | Unmarried |
| Less than High School | 0 (0.0%) | 0 (0.0%) |
| High School Diploma | 0 (0.0%) | 0 (0.0%) |
| College or Associate's Degree | 0 (0.0%) | 0 (0.0%) |
| Bachelor's Degree | 0 (0.0%) | 0 (0.0%) |
| Graduate Degree | 0 (0.0%) | 0 (0.0%) |
| Total | 0 (0.0%) | 0 (0.0%) |
Employment Characteristics in Trilby
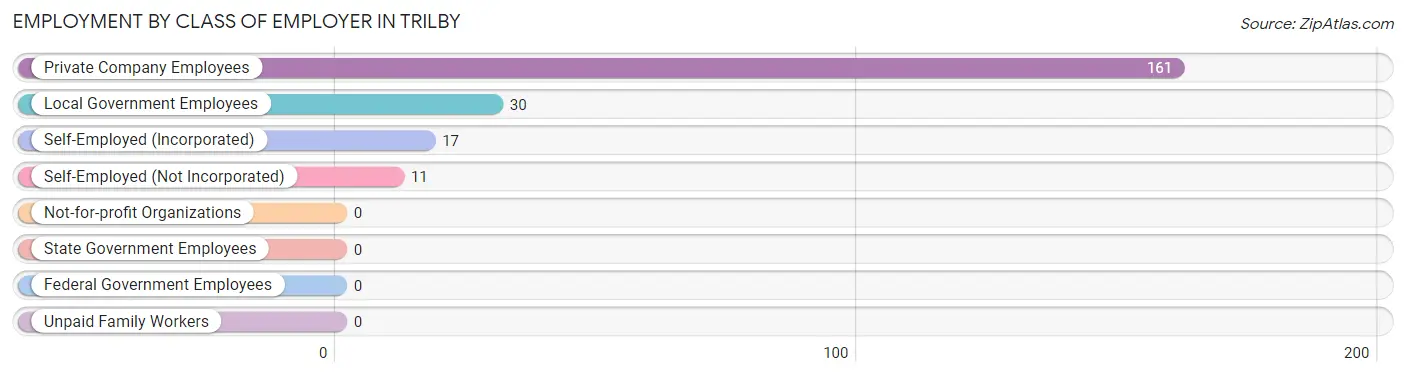
Employment by Class of Employer in Trilby
Among the 219 employed individuals in Trilby, private company employees (161 | 73.5%), local government employees (30 | 13.7%), and self-employed (incorporated) (17 | 7.8%) make up the most common classes of employment.
| Employer Class | # Employees | % Employees |
| Private Company Employees | 161 | 73.5% |
| Self-Employed (Incorporated) | 17 | 7.8% |
| Self-Employed (Not Incorporated) | 11 | 5.0% |
| Not-for-profit Organizations | 0 | 0.0% |
| Local Government Employees | 30 | 13.7% |
| State Government Employees | 0 | 0.0% |
| Federal Government Employees | 0 | 0.0% |
| Unpaid Family Workers | 0 | 0.0% |
| Total | 219 | 100.0% |
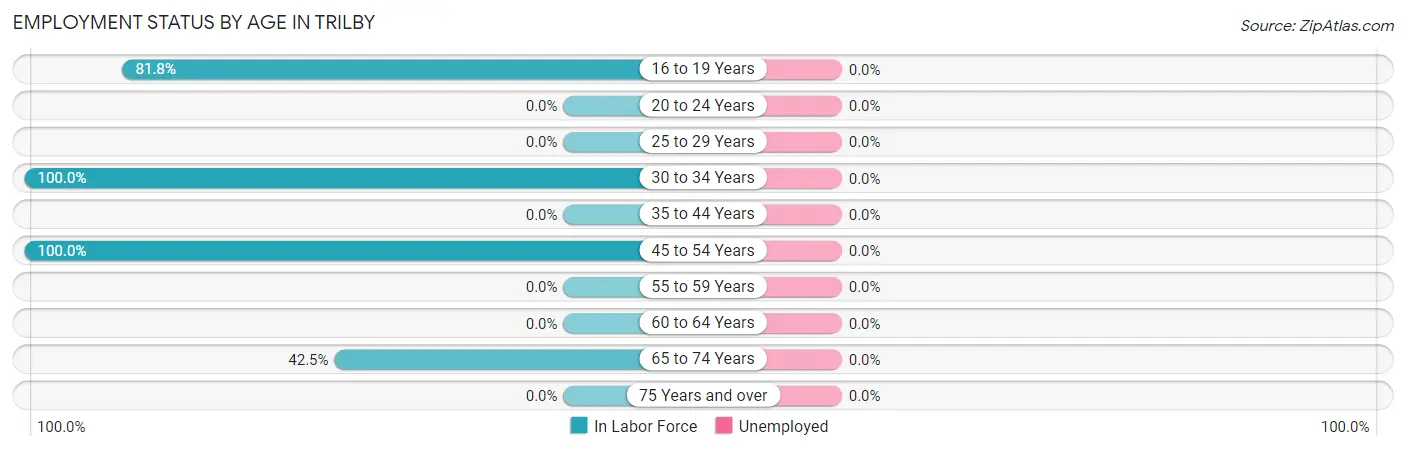
Employment Status by Age in Trilby
| Age Bracket | In Labor Force | Unemployed |
| 16 to 19 Years | 36 (81.8%) | 0 (0.0%) |
| 20 to 24 Years | 0 (0.0%) | 0 (0.0%) |
| 25 to 29 Years | 0 (0.0%) | 0 (0.0%) |
| 30 to 34 Years | 108 (100.0%) | 0 (0.0%) |
| 35 to 44 Years | 0 (0.0%) | 0 (0.0%) |
| 45 to 54 Years | 67 (100.0%) | 0 (0.0%) |
| 55 to 59 Years | 0 (0.0%) | 0 (0.0%) |
| 60 to 64 Years | 0 (0.0%) | 0 (0.0%) |
| 65 to 74 Years | 17 (42.5%) | 0 (0.0%) |
| 75 Years and over | 0 (0.0%) | 0 (0.0%) |
| Total | 228 (82.9%) | 0 (0.0%) |
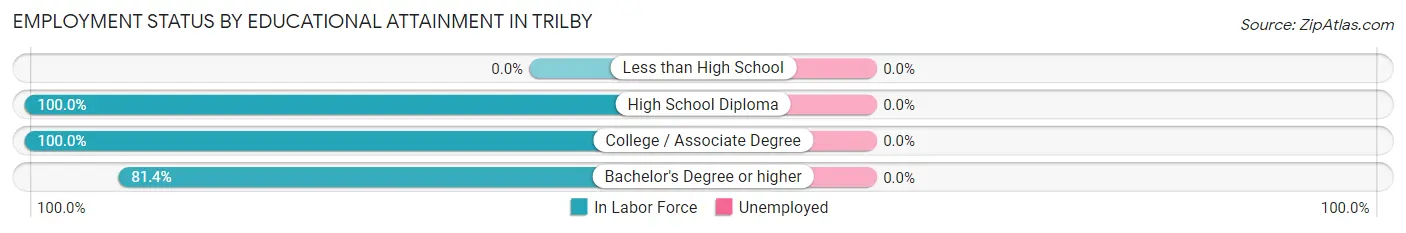
Employment Status by Educational Attainment in Trilby
| Educational Attainment | In Labor Force | Unemployed |
| Less than High School | 0 (0.0%) | 0 (0.0%) |
| High School Diploma | 56 (100.0%) | 0 (0.0%) |
| College / Associate Degree | 49 (100.0%) | 0 (0.0%) |
| Bachelor's Degree or higher | 70 (81.4%) | 0 (0.0%) |
| Total | 175 (91.6%) | 0 (0.0%) |
Employment Occupations by Sex in Trilby
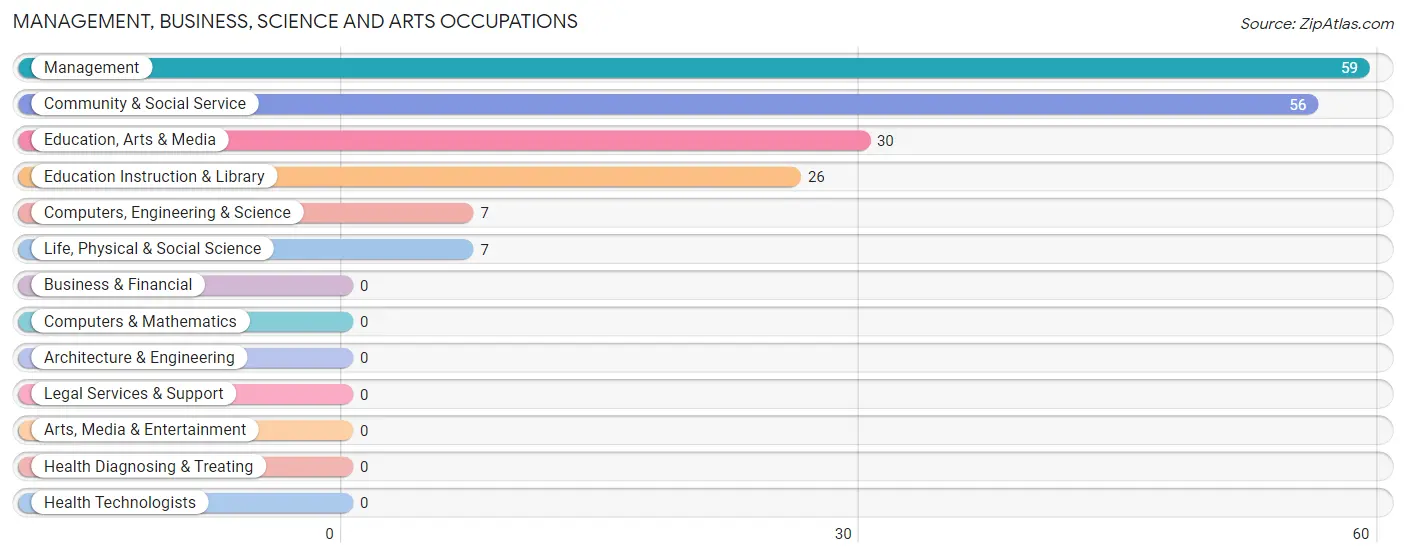
Management, Business, Science and Arts Occupations
The most common Management, Business, Science and Arts occupations in Trilby are Management (59 | 25.9%), Community & Social Service (56 | 24.6%), Education, Arts & Media (30 | 13.2%), Education Instruction & Library (26 | 11.4%), and Computers, Engineering & Science (7 | 3.1%).
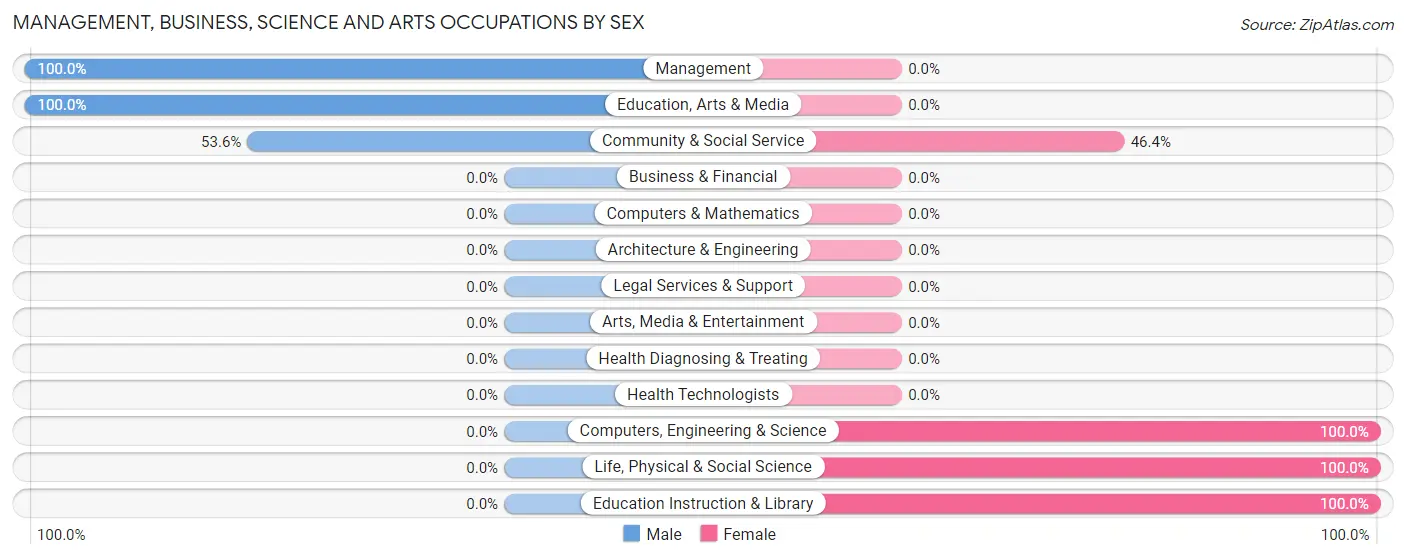
Management, Business, Science and Arts Occupations by Sex
Within the Management, Business, Science and Arts occupations in Trilby, the most male-oriented occupations are Management (100.0%), Education, Arts & Media (100.0%), and Community & Social Service (53.6%), while the most female-oriented occupations are Computers, Engineering & Science (100.0%), Life, Physical & Social Science (100.0%), and Education Instruction & Library (100.0%).
| Occupation | Male | Female |
| Management | 59 (100.0%) | 0 (0.0%) |
| Business & Financial | 0 (0.0%) | 0 (0.0%) |
| Computers, Engineering & Science | 0 (0.0%) | 7 (100.0%) |
| Computers & Mathematics | 0 (0.0%) | 0 (0.0%) |
| Architecture & Engineering | 0 (0.0%) | 0 (0.0%) |
| Life, Physical & Social Science | 0 (0.0%) | 7 (100.0%) |
| Community & Social Service | 30 (53.6%) | 26 (46.4%) |
| Education, Arts & Media | 30 (100.0%) | 0 (0.0%) |
| Legal Services & Support | 0 (0.0%) | 0 (0.0%) |
| Education Instruction & Library | 0 (0.0%) | 26 (100.0%) |
| Arts, Media & Entertainment | 0 (0.0%) | 0 (0.0%) |
| Health Diagnosing & Treating | 0 (0.0%) | 0 (0.0%) |
| Health Technologists | 0 (0.0%) | 0 (0.0%) |
| Total (Category) | 89 (73.0%) | 33 (27.1%) |
| Total (Overall) | 135 (59.2%) | 93 (40.8%) |
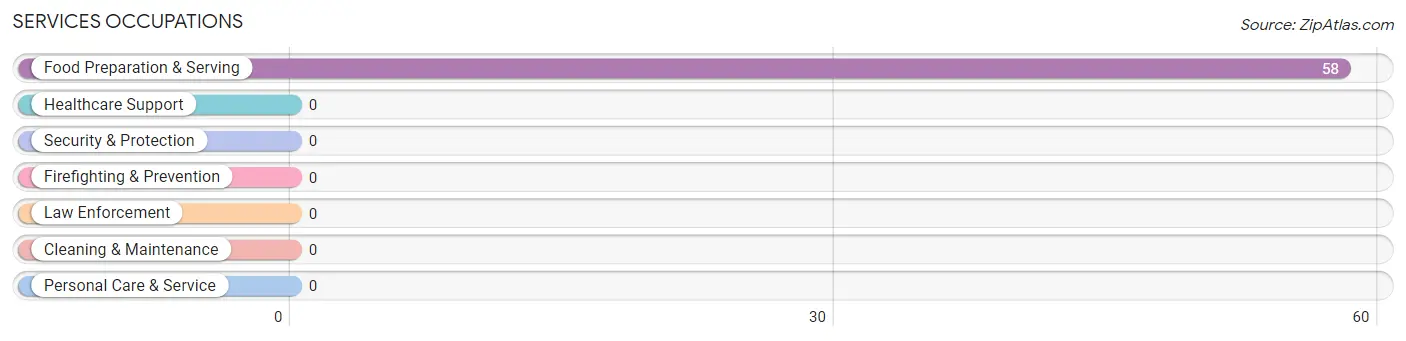
Services Occupations
The most common Services occupations in Trilby are , and Food Preparation & Serving (58 | 25.4%).
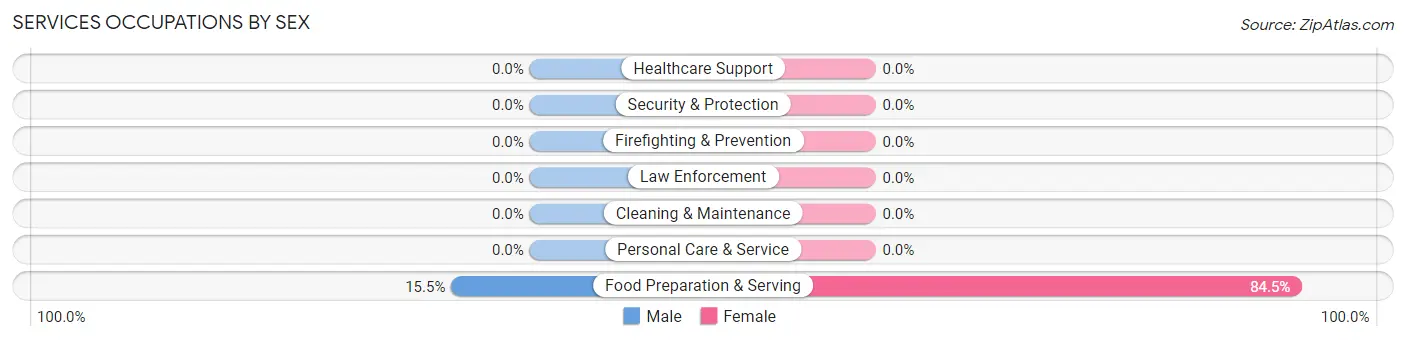
Services Occupations by Sex
| Occupation | Male | Female |
| Healthcare Support | 0 (0.0%) | 0 (0.0%) |
| Security & Protection | 0 (0.0%) | 0 (0.0%) |
| Firefighting & Prevention | 0 (0.0%) | 0 (0.0%) |
| Law Enforcement | 0 (0.0%) | 0 (0.0%) |
| Food Preparation & Serving | 9 (15.5%) | 49 (84.5%) |
| Cleaning & Maintenance | 0 (0.0%) | 0 (0.0%) |
| Personal Care & Service | 0 (0.0%) | 0 (0.0%) |
| Total (Category) | 9 (15.5%) | 49 (84.5%) |
| Total (Overall) | 135 (59.2%) | 93 (40.8%) |
Sales and Office Occupations
The most common Sales and Office occupations in Trilby are , and Office & Administration (11 | 4.8%).
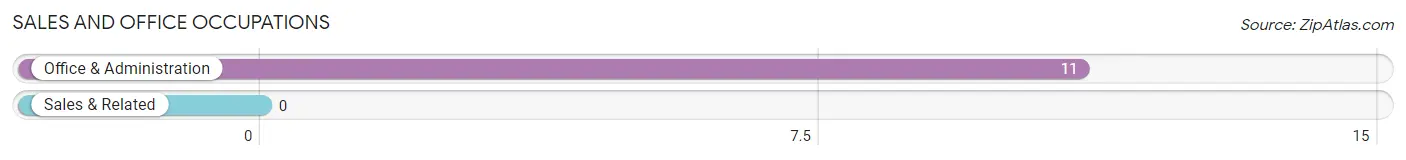
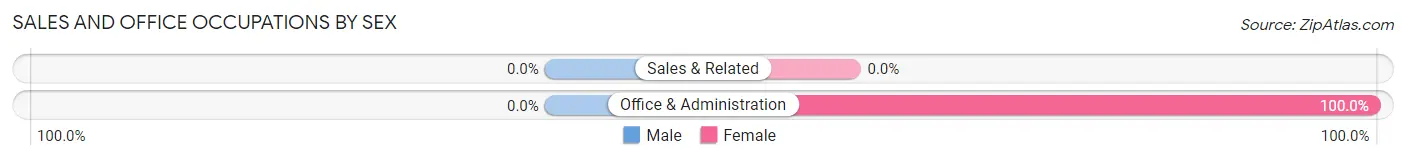
Sales and Office Occupations by Sex
| Occupation | Male | Female |
| Sales & Related | 0 (0.0%) | 0 (0.0%) |
| Office & Administration | 0 (0.0%) | 11 (100.0%) |
| Total (Category) | 0 (0.0%) | 11 (100.0%) |
| Total (Overall) | 135 (59.2%) | 93 (40.8%) |
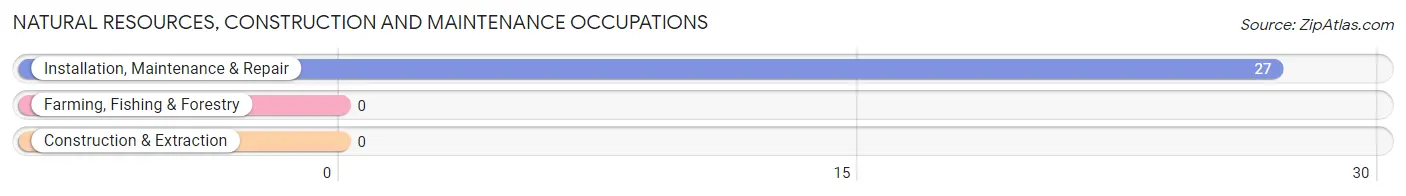
Natural Resources, Construction and Maintenance Occupations
The most common Natural Resources, Construction and Maintenance occupations in Trilby are , and Installation, Maintenance & Repair (27 | 11.8%).
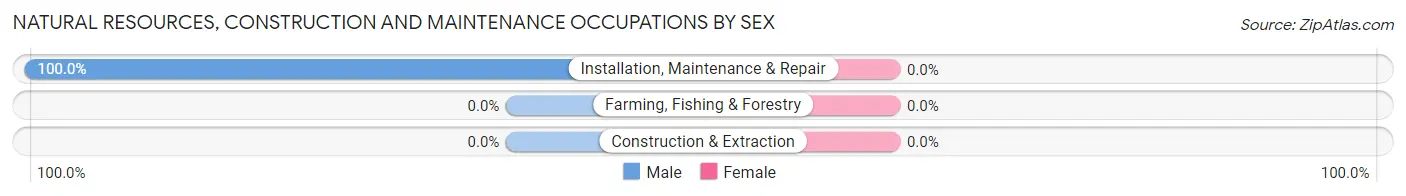
Natural Resources, Construction and Maintenance Occupations by Sex
| Occupation | Male | Female |
| Farming, Fishing & Forestry | 0 (0.0%) | 0 (0.0%) |
| Construction & Extraction | 0 (0.0%) | 0 (0.0%) |
| Installation, Maintenance & Repair | 27 (100.0%) | 0 (0.0%) |
| Total (Category) | 27 (100.0%) | 0 (0.0%) |
| Total (Overall) | 135 (59.2%) | 93 (40.8%) |
Production, Transportation and Moving Occupations
The most common Production, Transportation and Moving occupations in Trilby are , and Material Moving (10 | 4.4%).
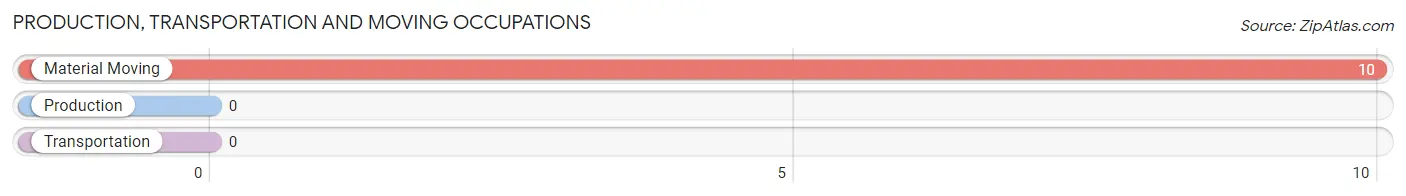
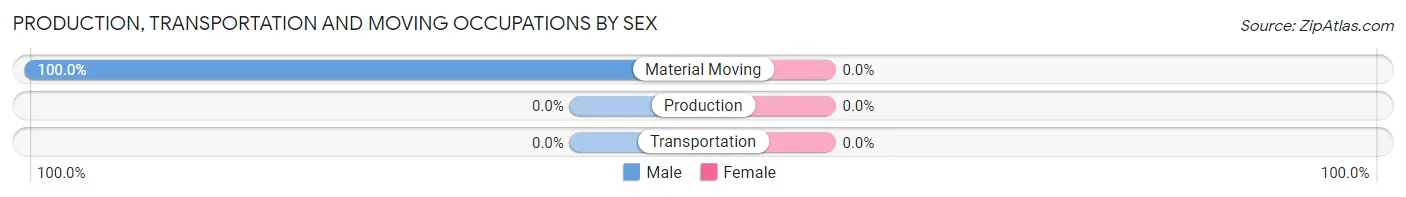
Production, Transportation and Moving Occupations by Sex
| Occupation | Male | Female |
| Production | 0 (0.0%) | 0 (0.0%) |
| Transportation | 0 (0.0%) | 0 (0.0%) |
| Material Moving | 10 (100.0%) | 0 (0.0%) |
| Total (Category) | 10 (100.0%) | 0 (0.0%) |
| Total (Overall) | 135 (59.2%) | 93 (40.8%) |
Employment Industries by Sex in Trilby
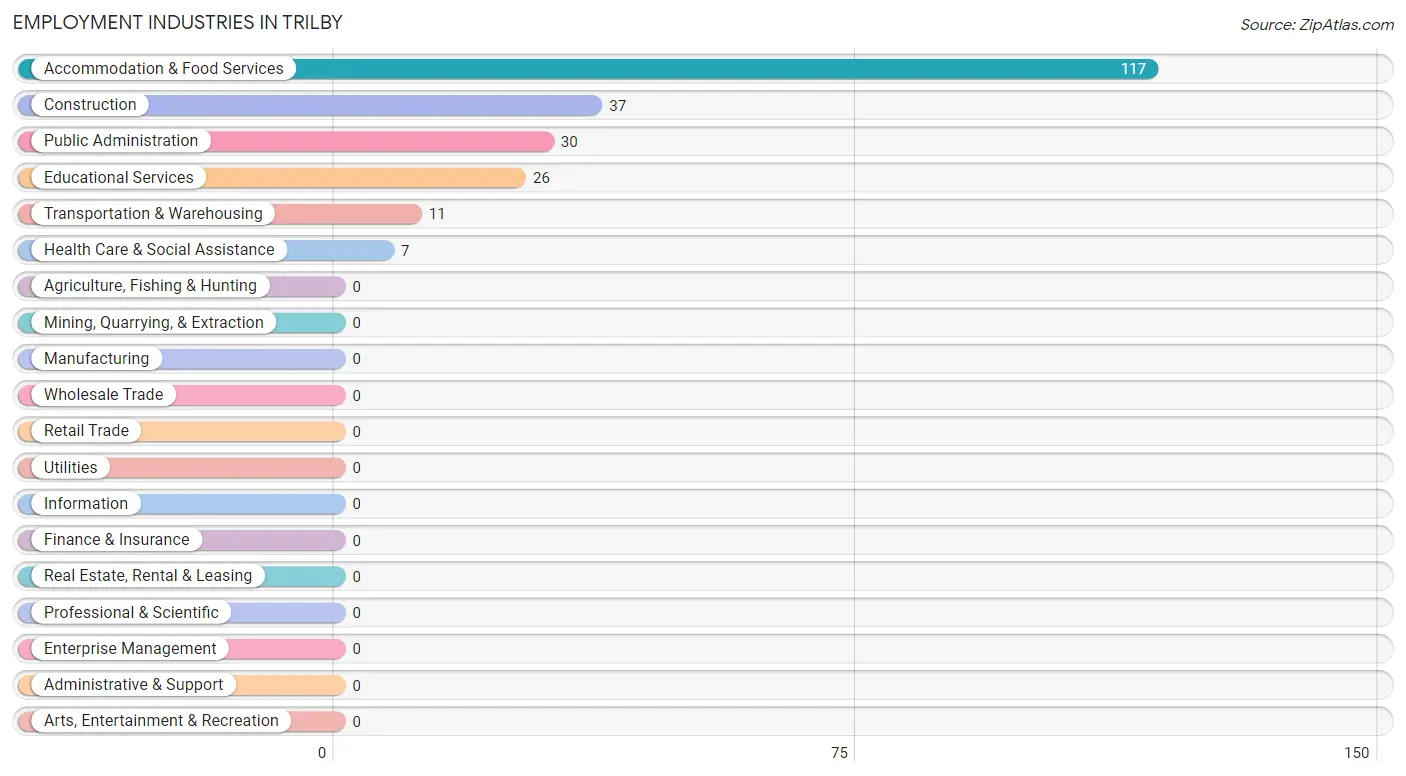
Employment Industries in Trilby
The major employment industries in Trilby include Accommodation & Food Services (117 | 51.3%), Construction (37 | 16.2%), Public Administration (30 | 13.2%), Educational Services (26 | 11.4%), and Transportation & Warehousing (11 | 4.8%).
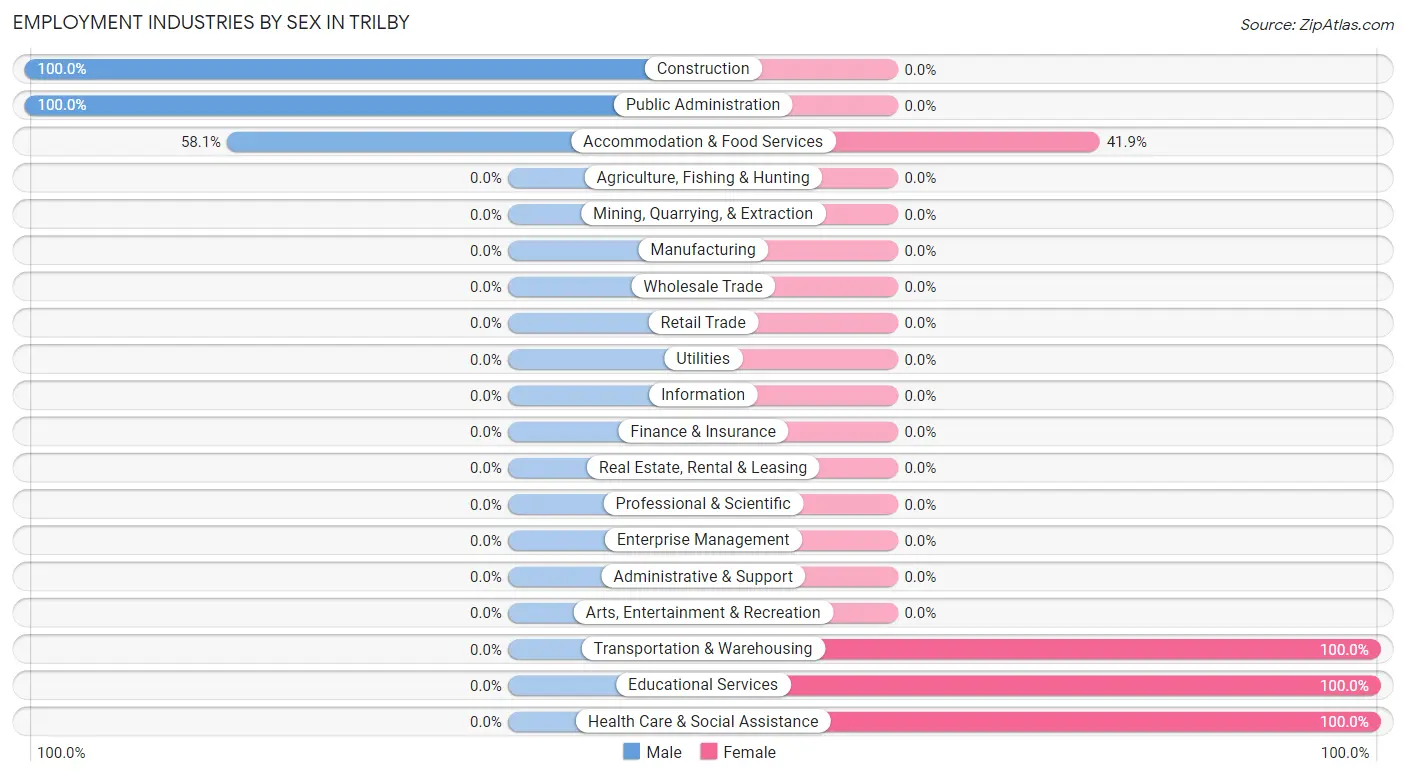
Employment Industries by Sex in Trilby
The Trilby industries that see more men than women are Construction (100.0%), Public Administration (100.0%), and Accommodation & Food Services (58.1%), whereas the industries that tend to have a higher number of women are Transportation & Warehousing (100.0%), Educational Services (100.0%), and Health Care & Social Assistance (100.0%).
| Industry | Male | Female |
| Agriculture, Fishing & Hunting | 0 (0.0%) | 0 (0.0%) |
| Mining, Quarrying, & Extraction | 0 (0.0%) | 0 (0.0%) |
| Construction | 37 (100.0%) | 0 (0.0%) |
| Manufacturing | 0 (0.0%) | 0 (0.0%) |
| Wholesale Trade | 0 (0.0%) | 0 (0.0%) |
| Retail Trade | 0 (0.0%) | 0 (0.0%) |
| Transportation & Warehousing | 0 (0.0%) | 11 (100.0%) |
| Utilities | 0 (0.0%) | 0 (0.0%) |
| Information | 0 (0.0%) | 0 (0.0%) |
| Finance & Insurance | 0 (0.0%) | 0 (0.0%) |
| Real Estate, Rental & Leasing | 0 (0.0%) | 0 (0.0%) |
| Professional & Scientific | 0 (0.0%) | 0 (0.0%) |
| Enterprise Management | 0 (0.0%) | 0 (0.0%) |
| Administrative & Support | 0 (0.0%) | 0 (0.0%) |
| Educational Services | 0 (0.0%) | 26 (100.0%) |
| Health Care & Social Assistance | 0 (0.0%) | 7 (100.0%) |
| Arts, Entertainment & Recreation | 0 (0.0%) | 0 (0.0%) |
| Accommodation & Food Services | 68 (58.1%) | 49 (41.9%) |
| Public Administration | 30 (100.0%) | 0 (0.0%) |
| Total | 135 (59.2%) | 93 (40.8%) |
Education in Trilby
School Enrollment in Trilby
The most common levels of schooling among the 63 students in Trilby are kindergarten (46 | 73.0%), and high school (17 | 27.0%).
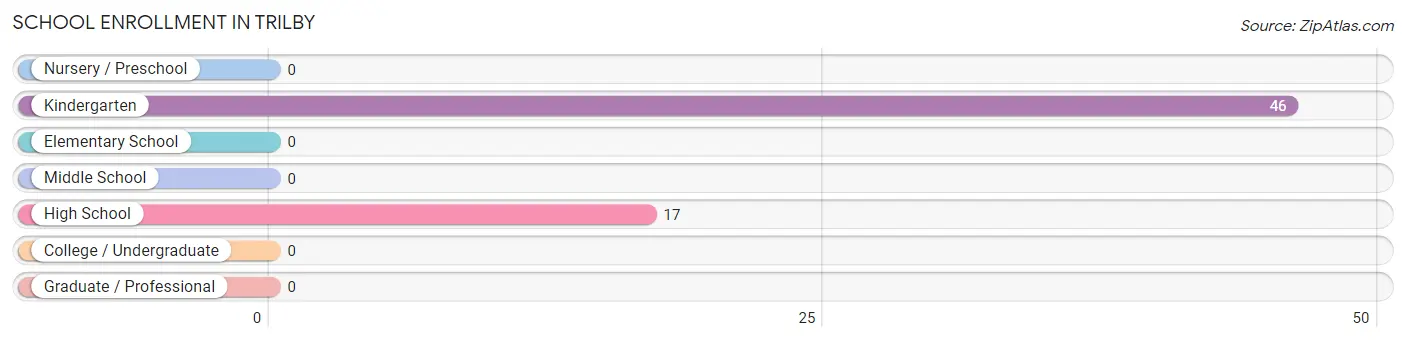
| School Level | # Students | % Students |
| Nursery / Preschool | 0 | 0.0% |
| Kindergarten | 46 | 73.0% |
| Elementary School | 0 | 0.0% |
| Middle School | 0 | 0.0% |
| High School | 17 | 27.0% |
| College / Undergraduate | 0 | 0.0% |
| Graduate / Professional | 0 | 0.0% |
| Total | 63 | 100.0% |
School Enrollment by Age by Funding Source in Trilby
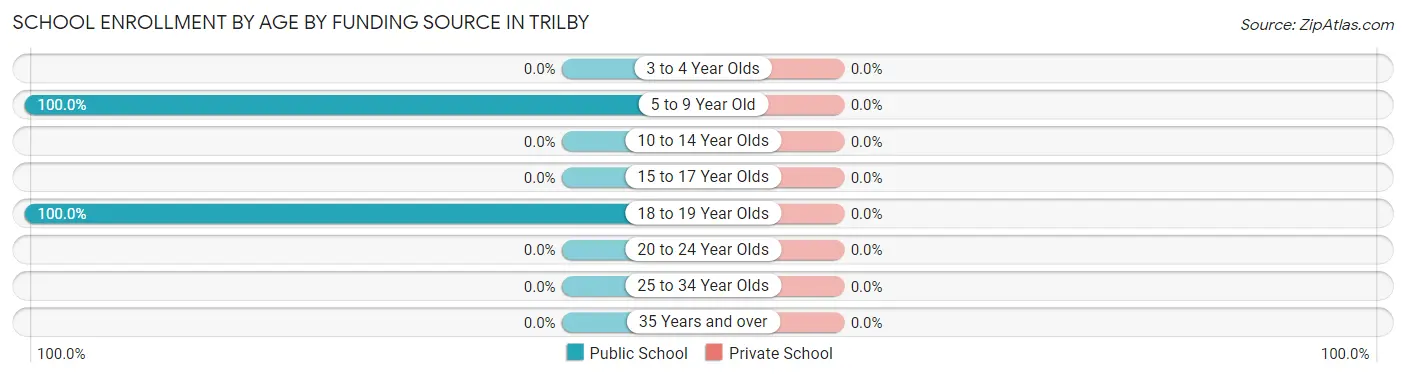
| Age Bracket | Public School | Private School |
| 3 to 4 Year Olds | 0 (0.0%) | 0 (0.0%) |
| 5 to 9 Year Old | 46 (100.0%) | 0 (0.0%) |
| 10 to 14 Year Olds | 0 (0.0%) | 0 (0.0%) |
| 15 to 17 Year Olds | 0 (0.0%) | 0 (0.0%) |
| 18 to 19 Year Olds | 17 (100.0%) | 0 (0.0%) |
| 20 to 24 Year Olds | 0 (0.0%) | 0 (0.0%) |
| 25 to 34 Year Olds | 0 (0.0%) | 0 (0.0%) |
| 35 Years and over | 0 (0.0%) | 0 (0.0%) |
| Total | 63 (100.0%) | 0 (0.0%) |
Educational Attainment by Field of Study in Trilby
Business (65 | 65.7%), science & technology (16 | 16.2%), arts & humanities (11 | 11.1%), and psychology (7 | 7.1%) are the most common fields of study among 99 individuals in Trilby who have obtained a bachelor's degree or higher.
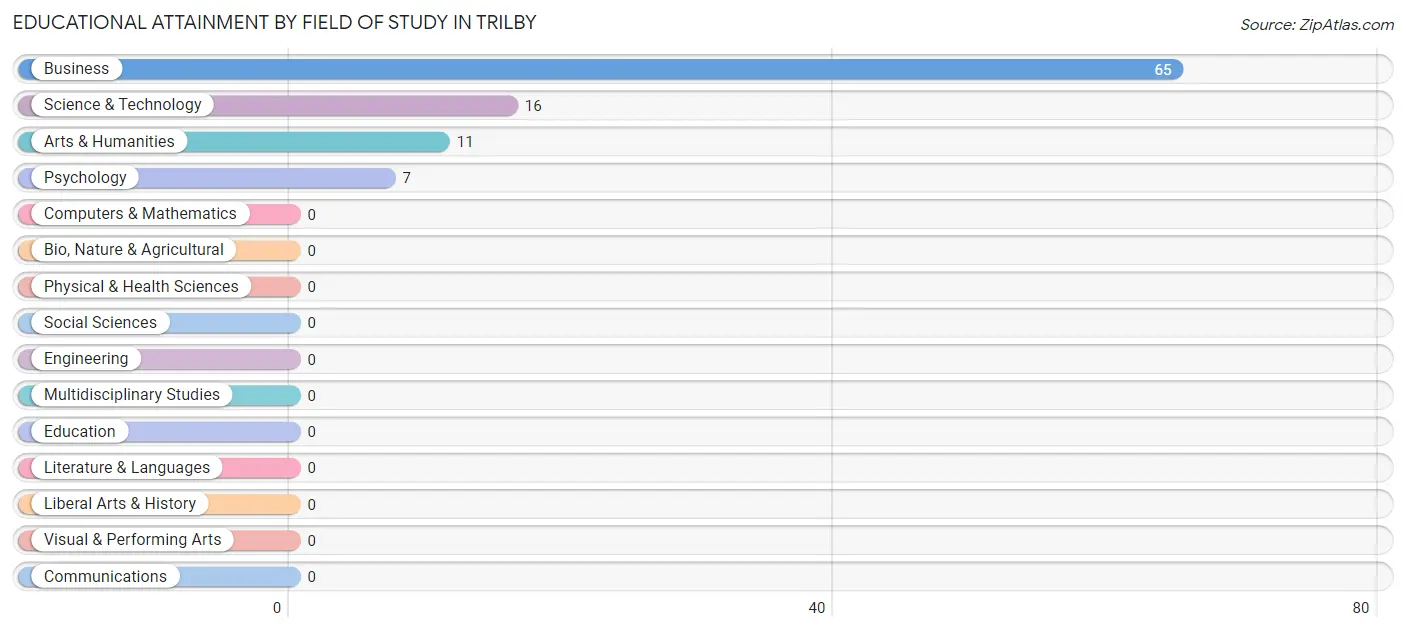
| Field of Study | # Graduates | % Graduates |
| Computers & Mathematics | 0 | 0.0% |
| Bio, Nature & Agricultural | 0 | 0.0% |
| Physical & Health Sciences | 0 | 0.0% |
| Psychology | 7 | 7.1% |
| Social Sciences | 0 | 0.0% |
| Engineering | 0 | 0.0% |
| Multidisciplinary Studies | 0 | 0.0% |
| Science & Technology | 16 | 16.2% |
| Business | 65 | 65.7% |
| Education | 0 | 0.0% |
| Literature & Languages | 0 | 0.0% |
| Liberal Arts & History | 0 | 0.0% |
| Visual & Performing Arts | 0 | 0.0% |
| Communications | 0 | 0.0% |
| Arts & Humanities | 11 | 11.1% |
| Total | 99 | 100.0% |
Transportation & Commute in Trilby
Vehicle Availability by Sex in Trilby
The most prevalent vehicle ownership categories in Trilby are males with 2 vehicles (69, accounting for 54.8%) and females with 2 vehicles (67, making up 74.2%).
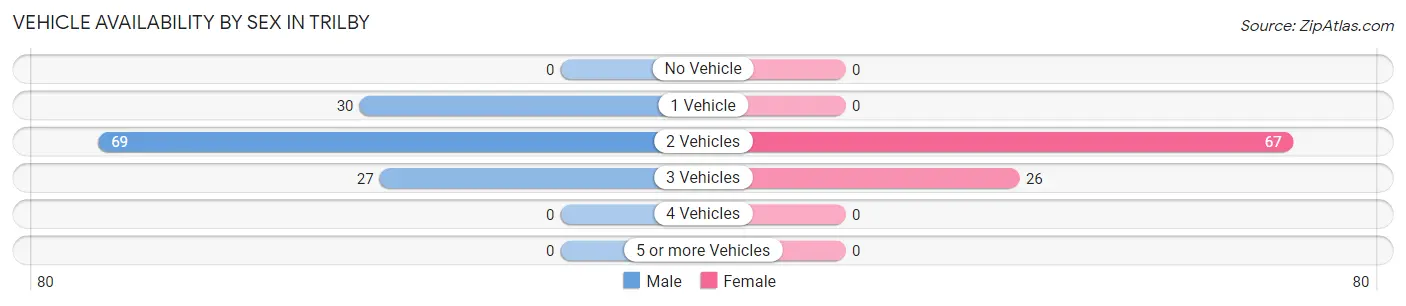
| Vehicles Available | Male | Female |
| No Vehicle | 0 (0.0%) | 0 (0.0%) |
| 1 Vehicle | 30 (23.8%) | 0 (0.0%) |
| 2 Vehicles | 69 (54.8%) | 67 (72.0%) |
| 3 Vehicles | 27 (21.4%) | 26 (28.0%) |
| 4 Vehicles | 0 (0.0%) | 0 (0.0%) |
| 5 or more Vehicles | 0 (0.0%) | 0 (0.0%) |
| Total | 126 (100.0%) | 93 (100.0%) |
Commute Time in Trilby
The most frequently occuring commute durations in Trilby are 10 to 14 minutes (30 commuters, 27.0%), 15 to 19 minutes (27 commuters, 24.3%), and 40 to 44 minutes (26 commuters, 23.4%).
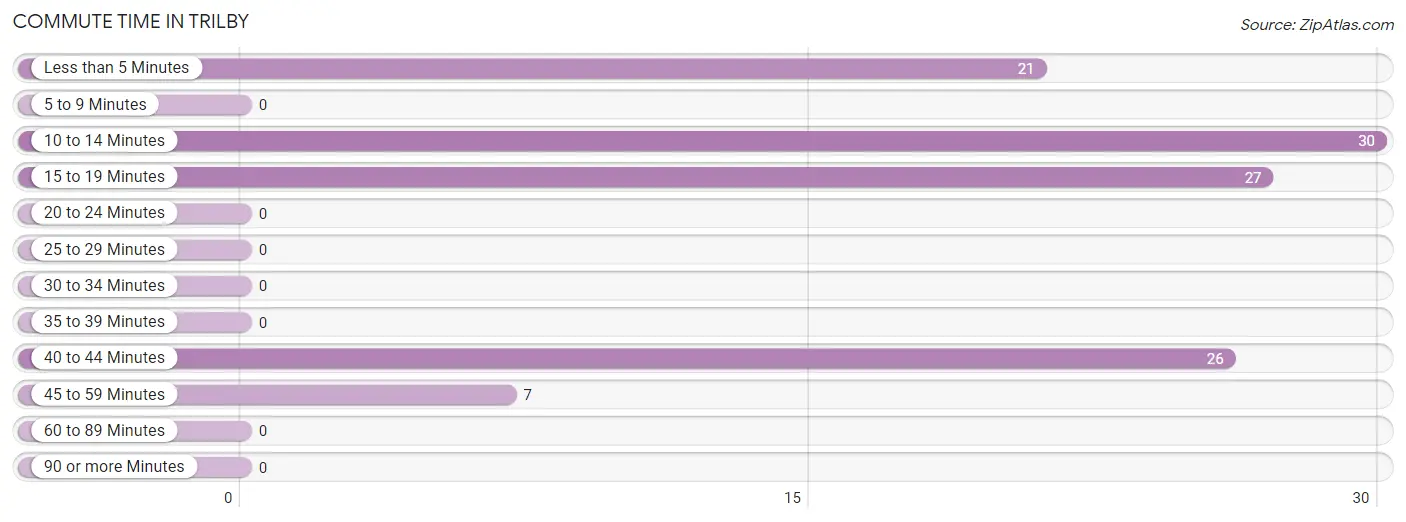
| Commute Time | # Commuters | % Commuters |
| Less than 5 Minutes | 21 | 18.9% |
| 5 to 9 Minutes | 0 | 0.0% |
| 10 to 14 Minutes | 30 | 27.0% |
| 15 to 19 Minutes | 27 | 24.3% |
| 20 to 24 Minutes | 0 | 0.0% |
| 25 to 29 Minutes | 0 | 0.0% |
| 30 to 34 Minutes | 0 | 0.0% |
| 35 to 39 Minutes | 0 | 0.0% |
| 40 to 44 Minutes | 26 | 23.4% |
| 45 to 59 Minutes | 7 | 6.3% |
| 60 to 89 Minutes | 0 | 0.0% |
| 90 or more Minutes | 0 | 0.0% |
Commute Time by Sex in Trilby
The most common commute times in Trilby are 10 to 14 minutes (30 commuters, 44.8%) for males and 40 to 44 minutes (26 commuters, 59.1%) for females.
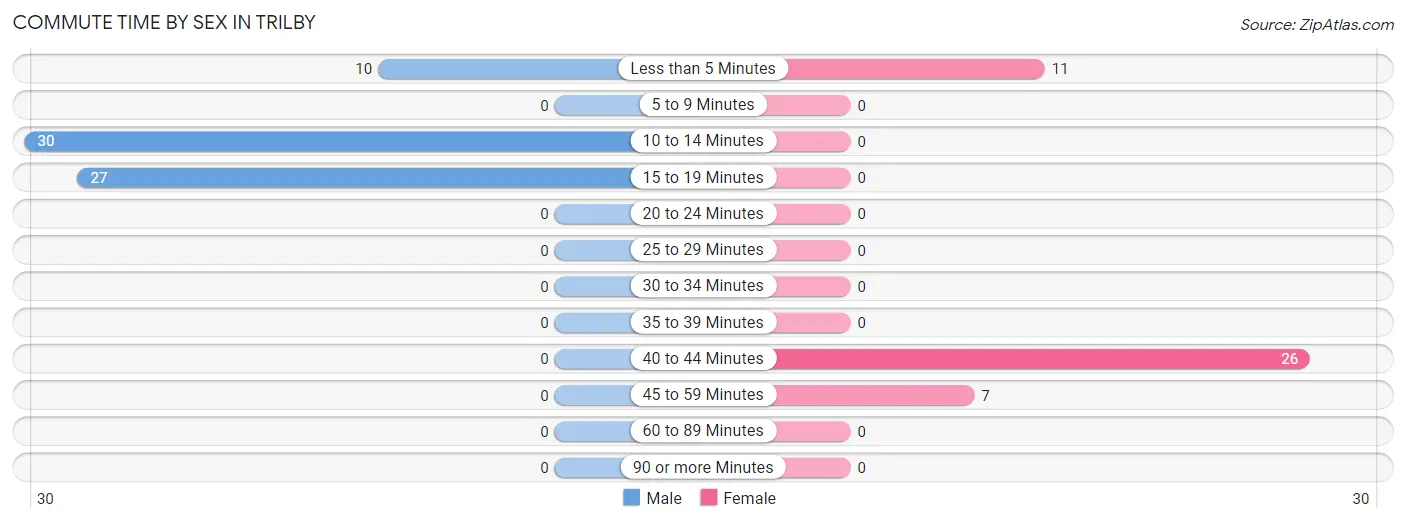
| Commute Time | Male | Female |
| Less than 5 Minutes | 10 (14.9%) | 11 (25.0%) |
| 5 to 9 Minutes | 0 (0.0%) | 0 (0.0%) |
| 10 to 14 Minutes | 30 (44.8%) | 0 (0.0%) |
| 15 to 19 Minutes | 27 (40.3%) | 0 (0.0%) |
| 20 to 24 Minutes | 0 (0.0%) | 0 (0.0%) |
| 25 to 29 Minutes | 0 (0.0%) | 0 (0.0%) |
| 30 to 34 Minutes | 0 (0.0%) | 0 (0.0%) |
| 35 to 39 Minutes | 0 (0.0%) | 0 (0.0%) |
| 40 to 44 Minutes | 0 (0.0%) | 26 (59.1%) |
| 45 to 59 Minutes | 0 (0.0%) | 7 (15.9%) |
| 60 to 89 Minutes | 0 (0.0%) | 0 (0.0%) |
| 90 or more Minutes | 0 (0.0%) | 0 (0.0%) |
Time of Departure to Work by Sex in Trilby
The most frequent times of departure to work in Trilby are 4:00 PM to 11:59 PM (30, 44.8%) for males and 5:30 AM to 5:59 AM (26, 59.1%) for females.
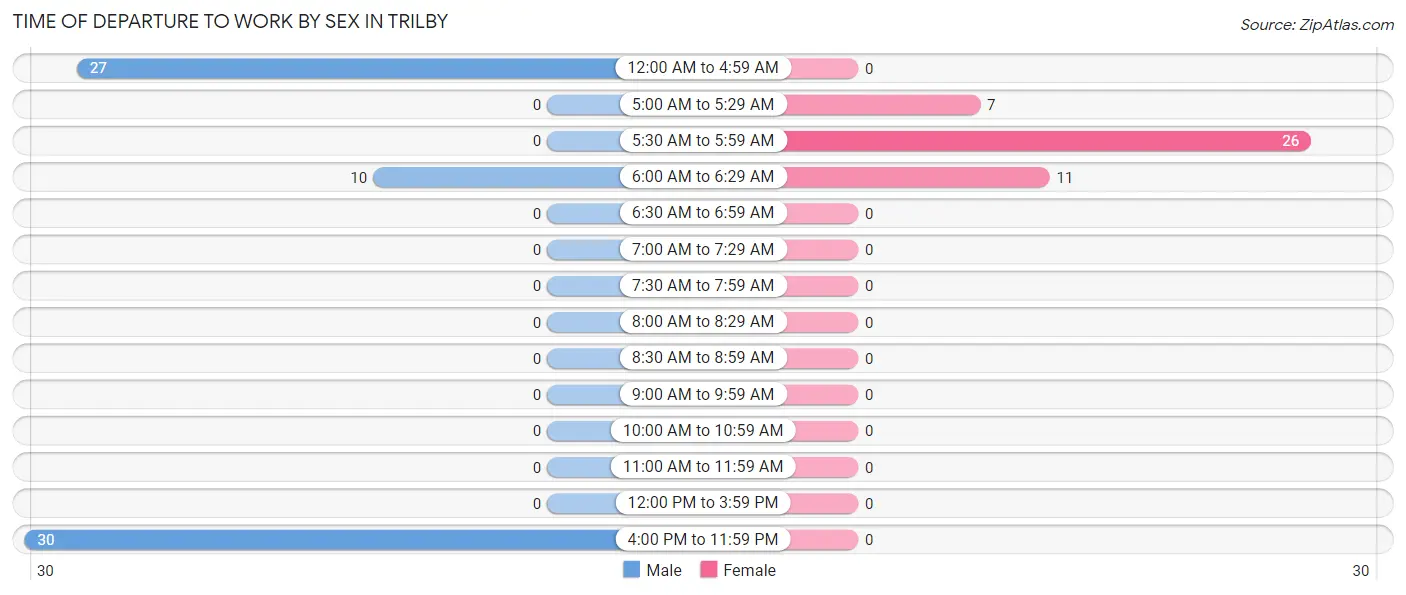
| Time of Departure | Male | Female |
| 12:00 AM to 4:59 AM | 27 (40.3%) | 0 (0.0%) |
| 5:00 AM to 5:29 AM | 0 (0.0%) | 7 (15.9%) |
| 5:30 AM to 5:59 AM | 0 (0.0%) | 26 (59.1%) |
| 6:00 AM to 6:29 AM | 10 (14.9%) | 11 (25.0%) |
| 6:30 AM to 6:59 AM | 0 (0.0%) | 0 (0.0%) |
| 7:00 AM to 7:29 AM | 0 (0.0%) | 0 (0.0%) |
| 7:30 AM to 7:59 AM | 0 (0.0%) | 0 (0.0%) |
| 8:00 AM to 8:29 AM | 0 (0.0%) | 0 (0.0%) |
| 8:30 AM to 8:59 AM | 0 (0.0%) | 0 (0.0%) |
| 9:00 AM to 9:59 AM | 0 (0.0%) | 0 (0.0%) |
| 10:00 AM to 10:59 AM | 0 (0.0%) | 0 (0.0%) |
| 11:00 AM to 11:59 AM | 0 (0.0%) | 0 (0.0%) |
| 12:00 PM to 3:59 PM | 0 (0.0%) | 0 (0.0%) |
| 4:00 PM to 11:59 PM | 30 (44.8%) | 0 (0.0%) |
| Total | 67 (100.0%) | 44 (100.0%) |
Housing Occupancy in Trilby
Occupancy by Ownership in Trilby
Of the total 144 dwellings in Trilby, owner-occupied units account for 95 (66.0%), while renter-occupied units make up 49 (34.0%).
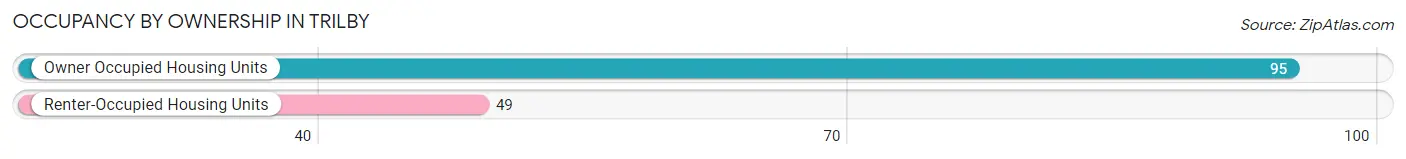
| Occupancy | # Housing Units | % Housing Units |
| Owner Occupied Housing Units | 95 | 66.0% |
| Renter-Occupied Housing Units | 49 | 34.0% |
| Total Occupied Housing Units | 144 | 100.0% |
Occupancy by Household Size in Trilby
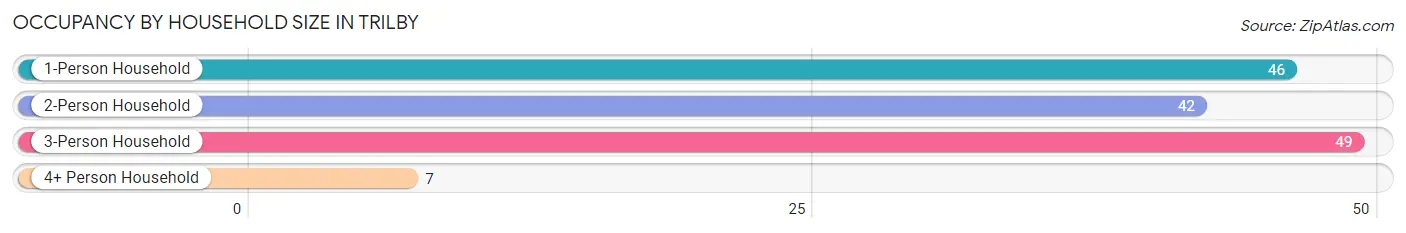
| Household Size | # Housing Units | % Housing Units |
| 1-Person Household | 46 | 31.9% |
| 2-Person Household | 42 | 29.2% |
| 3-Person Household | 49 | 34.0% |
| 4+ Person Household | 7 | 4.9% |
| Total Housing Units | 144 | 100.0% |
Occupancy by Ownership by Household Size in Trilby
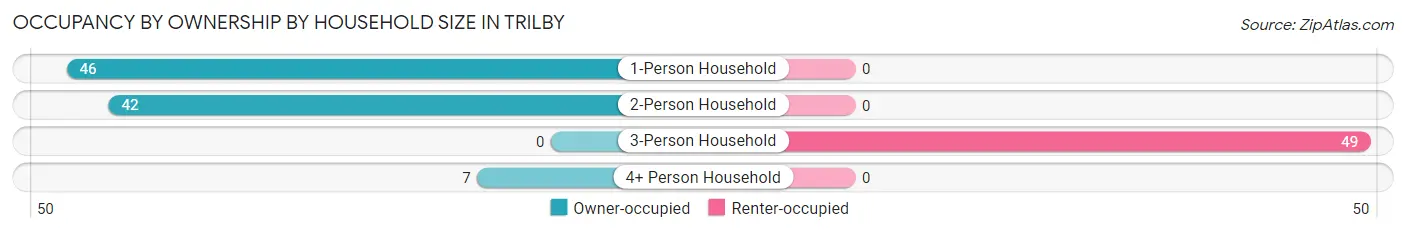
| Household Size | Owner-occupied | Renter-occupied |
| 1-Person Household | 46 (100.0%) | 0 (0.0%) |
| 2-Person Household | 42 (100.0%) | 0 (0.0%) |
| 3-Person Household | 0 (0.0%) | 49 (100.0%) |
| 4+ Person Household | 7 (100.0%) | 0 (0.0%) |
| Total Housing Units | 95 (66.0%) | 49 (34.0%) |
Occupancy by Educational Attainment in Trilby
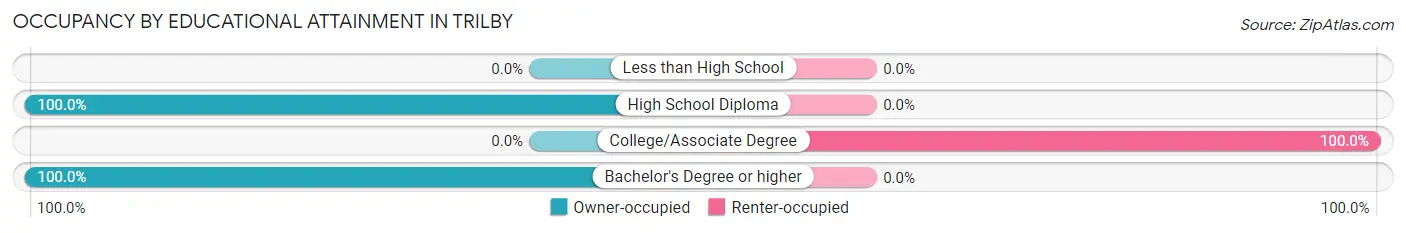
| Household Size | Owner-occupied | Renter-occupied |
| Less than High School | 0 (0.0%) | 0 (0.0%) |
| High School Diploma | 66 (100.0%) | 0 (0.0%) |
| College/Associate Degree | 0 (0.0%) | 49 (100.0%) |
| Bachelor's Degree or higher | 29 (100.0%) | 0 (0.0%) |
Occupancy by Age of Householder in Trilby
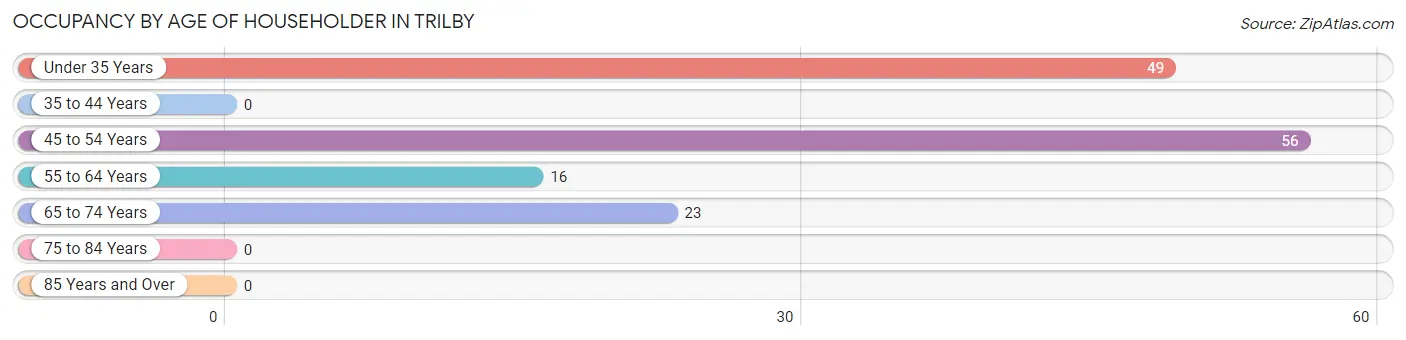
| Age Bracket | # Households | % Households |
| Under 35 Years | 49 | 34.0% |
| 35 to 44 Years | 0 | 0.0% |
| 45 to 54 Years | 56 | 38.9% |
| 55 to 64 Years | 16 | 11.1% |
| 65 to 74 Years | 23 | 16.0% |
| 75 to 84 Years | 0 | 0.0% |
| 85 Years and Over | 0 | 0.0% |
| Total | 144 | 100.0% |
Housing Finances in Trilby
Median Income by Occupancy in Trilby
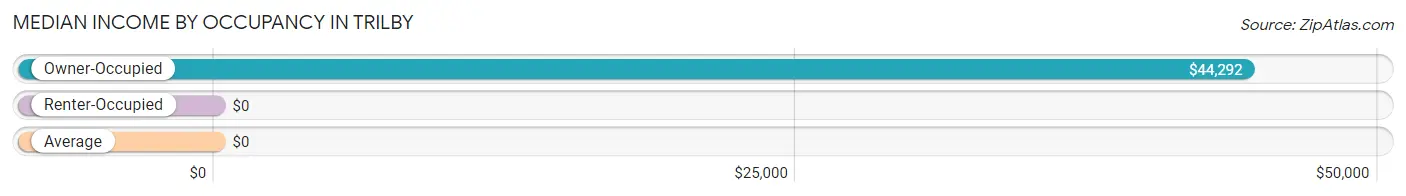
| Occupancy Type | # Households | Median Income |
| Owner-Occupied | 95 (66.0%) | $44,292 |
| Renter-Occupied | 49 (34.0%) | $0 |
| Average | 144 (100.0%) | $0 |
Occupancy by Householder Income Bracket in Trilby
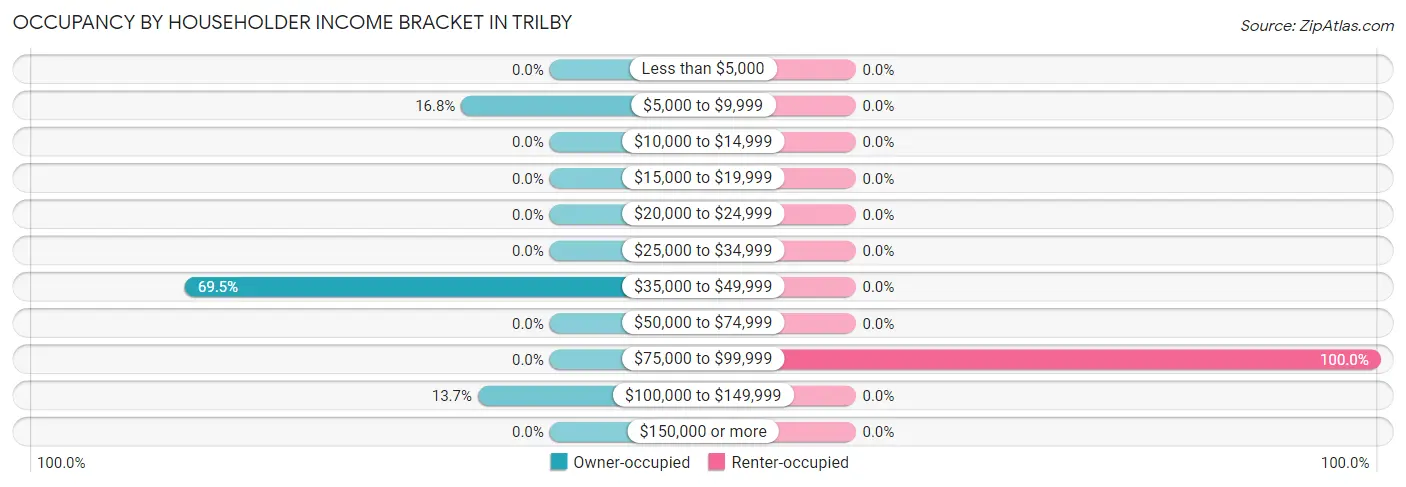
| Income Bracket | Owner-occupied | Renter-occupied |
| Less than $5,000 | 0 (0.0%) | 0 (0.0%) |
| $5,000 to $9,999 | 16 (16.8%) | 0 (0.0%) |
| $10,000 to $14,999 | 0 (0.0%) | 0 (0.0%) |
| $15,000 to $19,999 | 0 (0.0%) | 0 (0.0%) |
| $20,000 to $24,999 | 0 (0.0%) | 0 (0.0%) |
| $25,000 to $34,999 | 0 (0.0%) | 0 (0.0%) |
| $35,000 to $49,999 | 66 (69.5%) | 0 (0.0%) |
| $50,000 to $74,999 | 0 (0.0%) | 0 (0.0%) |
| $75,000 to $99,999 | 0 (0.0%) | 49 (100.0%) |
| $100,000 to $149,999 | 13 (13.7%) | 0 (0.0%) |
| $150,000 or more | 0 (0.0%) | 0 (0.0%) |
| Total | 95 (100.0%) | 49 (100.0%) |
Monthly Housing Cost Tiers in Trilby
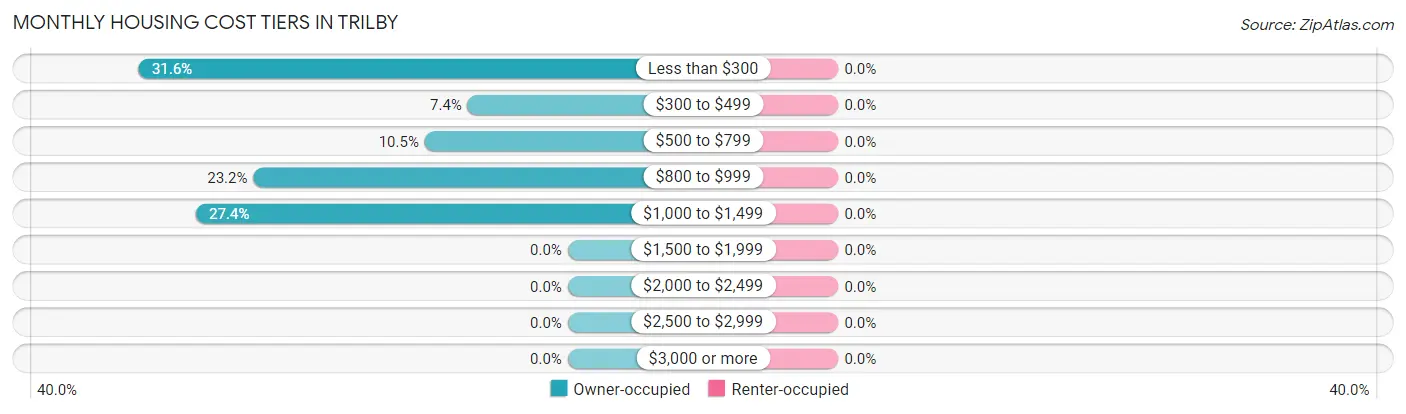
| Monthly Cost | Owner-occupied | Renter-occupied |
| Less than $300 | 30 (31.6%) | 0 (0.0%) |
| $300 to $499 | 7 (7.4%) | 0 (0.0%) |
| $500 to $799 | 10 (10.5%) | 0 (0.0%) |
| $800 to $999 | 22 (23.2%) | 0 (0.0%) |
| $1,000 to $1,499 | 26 (27.4%) | 0 (0.0%) |
| $1,500 to $1,999 | 0 (0.0%) | 0 (0.0%) |
| $2,000 to $2,499 | 0 (0.0%) | 0 (0.0%) |
| $2,500 to $2,999 | 0 (0.0%) | 0 (0.0%) |
| $3,000 or more | 0 (0.0%) | 0 (0.0%) |
| Total | 95 (100.0%) | 49 (100.0%) |
Physical Housing Characteristics in Trilby
Housing Structures in Trilby
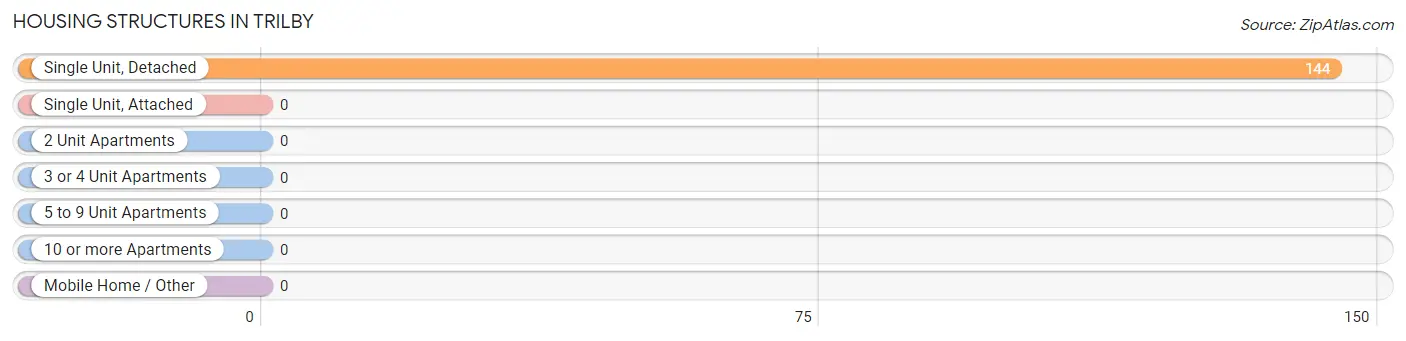
| Structure Type | # Housing Units | % Housing Units |
| Single Unit, Detached | 144 | 100.0% |
| Single Unit, Attached | 0 | 0.0% |
| 2 Unit Apartments | 0 | 0.0% |
| 3 or 4 Unit Apartments | 0 | 0.0% |
| 5 to 9 Unit Apartments | 0 | 0.0% |
| 10 or more Apartments | 0 | 0.0% |
| Mobile Home / Other | 0 | 0.0% |
| Total | 144 | 100.0% |
Housing Structures by Occupancy in Trilby
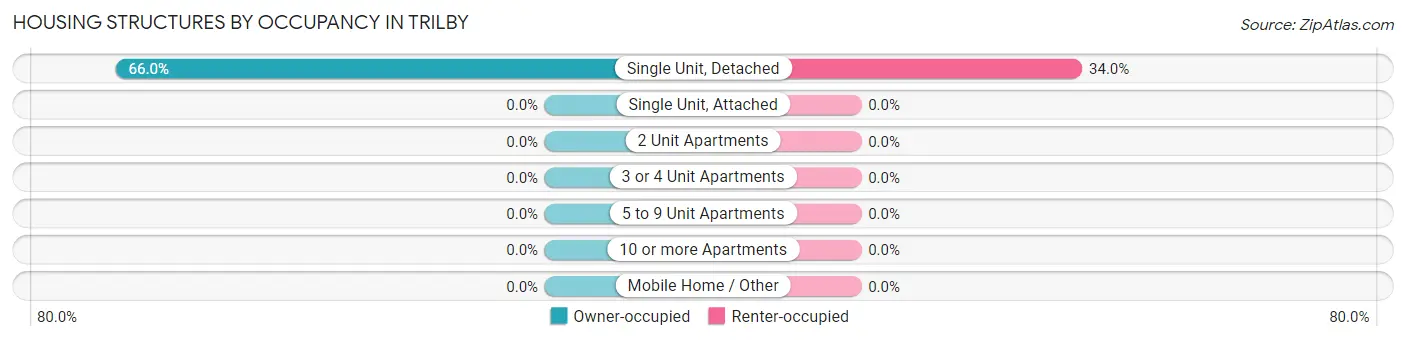
| Structure Type | Owner-occupied | Renter-occupied |
| Single Unit, Detached | 95 (66.0%) | 49 (34.0%) |
| Single Unit, Attached | 0 (0.0%) | 0 (0.0%) |
| 2 Unit Apartments | 0 (0.0%) | 0 (0.0%) |
| 3 or 4 Unit Apartments | 0 (0.0%) | 0 (0.0%) |
| 5 to 9 Unit Apartments | 0 (0.0%) | 0 (0.0%) |
| 10 or more Apartments | 0 (0.0%) | 0 (0.0%) |
| Mobile Home / Other | 0 (0.0%) | 0 (0.0%) |
| Total | 95 (66.0%) | 49 (34.0%) |
Housing Structures by Number of Rooms in Trilby
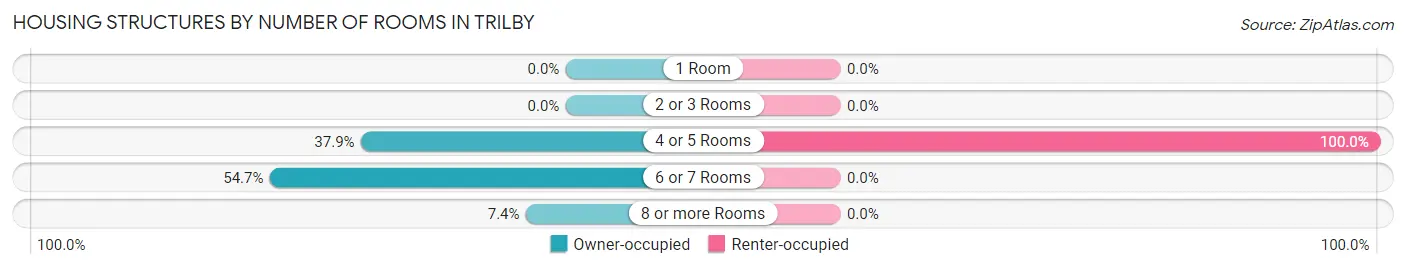
| Number of Rooms | Owner-occupied | Renter-occupied |
| 1 Room | 0 (0.0%) | 0 (0.0%) |
| 2 or 3 Rooms | 0 (0.0%) | 0 (0.0%) |
| 4 or 5 Rooms | 36 (37.9%) | 49 (100.0%) |
| 6 or 7 Rooms | 52 (54.7%) | 0 (0.0%) |
| 8 or more Rooms | 7 (7.4%) | 0 (0.0%) |
| Total | 95 (100.0%) | 49 (100.0%) |
Housing Structure by Heating Type in Trilby
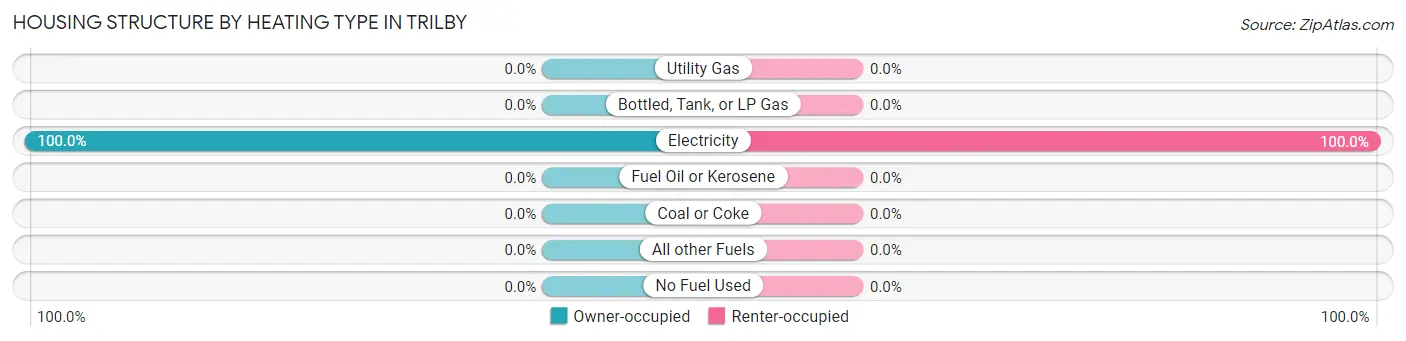
| Heating Type | Owner-occupied | Renter-occupied |
| Utility Gas | 0 (0.0%) | 0 (0.0%) |
| Bottled, Tank, or LP Gas | 0 (0.0%) | 0 (0.0%) |
| Electricity | 95 (100.0%) | 49 (100.0%) |
| Fuel Oil or Kerosene | 0 (0.0%) | 0 (0.0%) |
| Coal or Coke | 0 (0.0%) | 0 (0.0%) |
| All other Fuels | 0 (0.0%) | 0 (0.0%) |
| No Fuel Used | 0 (0.0%) | 0 (0.0%) |
| Total | 95 (100.0%) | 49 (100.0%) |
Household Vehicle Usage in Trilby
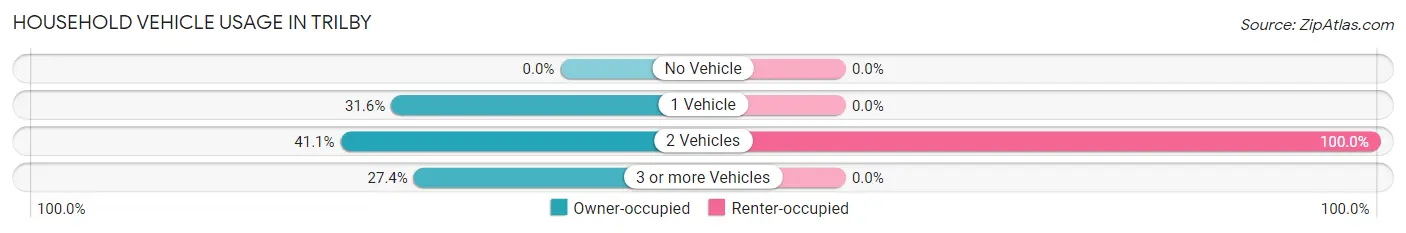
| Vehicles per Household | Owner-occupied | Renter-occupied |
| No Vehicle | 0 (0.0%) | 0 (0.0%) |
| 1 Vehicle | 30 (31.6%) | 0 (0.0%) |
| 2 Vehicles | 39 (41.0%) | 49 (100.0%) |
| 3 or more Vehicles | 26 (27.4%) | 0 (0.0%) |
| Total | 95 (100.0%) | 49 (100.0%) |
Real Estate & Mortgages in Trilby
Real Estate and Mortgage Overview in Trilby
| Characteristic | Without Mortgage | With Mortgage |
| Housing Units | 69 | 26 |
| Median Property Value | - | - |
| Median Household Income | $43,208 | $0 |
| Monthly Housing Costs | - | - |
| Real Estate Taxes | - | - |
Property Value by Mortgage Status in Trilby
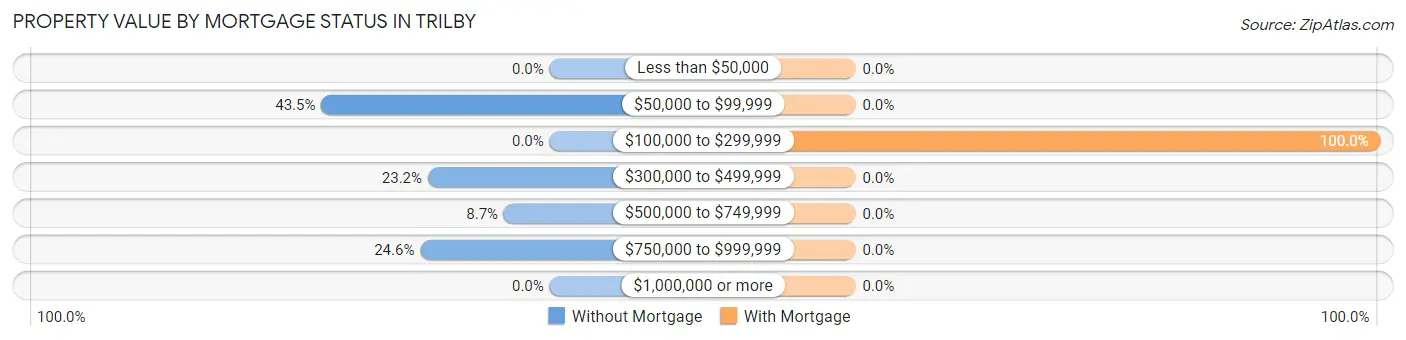
| Property Value | Without Mortgage | With Mortgage |
| Less than $50,000 | 0 (0.0%) | 0 (0.0%) |
| $50,000 to $99,999 | 30 (43.5%) | 0 (0.0%) |
| $100,000 to $299,999 | 0 (0.0%) | 26 (100.0%) |
| $300,000 to $499,999 | 16 (23.2%) | 0 (0.0%) |
| $500,000 to $749,999 | 6 (8.7%) | 0 (0.0%) |
| $750,000 to $999,999 | 17 (24.6%) | 0 (0.0%) |
| $1,000,000 or more | 0 (0.0%) | 0 (0.0%) |
| Total | 69 (100.0%) | 26 (100.0%) |
Household Income by Mortgage Status in Trilby
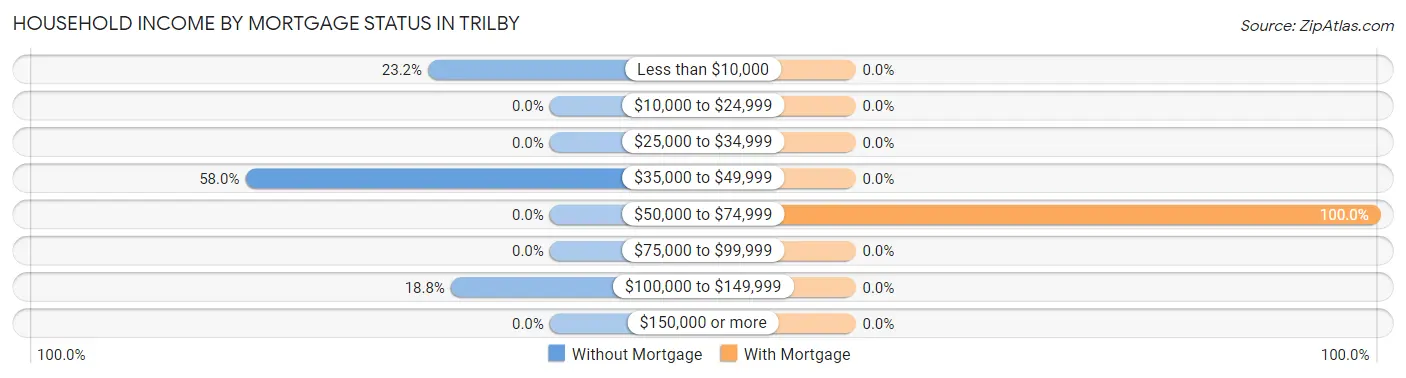
| Household Income | Without Mortgage | With Mortgage |
| Less than $10,000 | 16 (23.2%) | 0 (0.0%) |
| $10,000 to $24,999 | 0 (0.0%) | 0 (0.0%) |
| $25,000 to $34,999 | 0 (0.0%) | 0 (0.0%) |
| $35,000 to $49,999 | 40 (58.0%) | 0 (0.0%) |
| $50,000 to $74,999 | 0 (0.0%) | 26 (100.0%) |
| $75,000 to $99,999 | 0 (0.0%) | 0 (0.0%) |
| $100,000 to $149,999 | 13 (18.8%) | 0 (0.0%) |
| $150,000 or more | 0 (0.0%) | 0 (0.0%) |
| Total | 69 (100.0%) | 26 (100.0%) |
Property Value to Household Income Ratio in Trilby
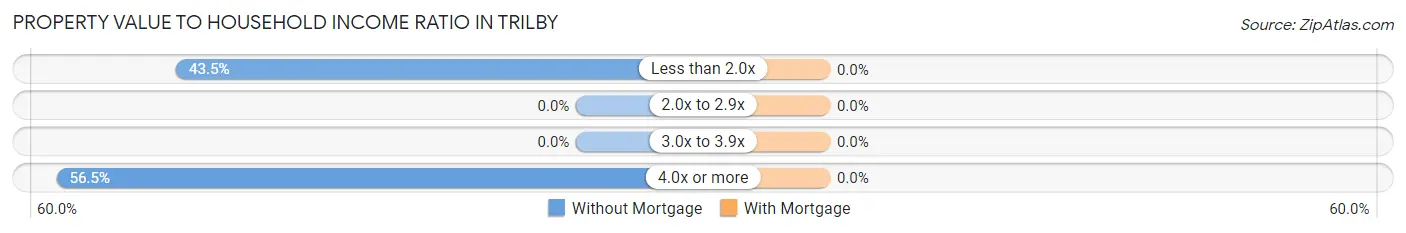
| Value-to-Income Ratio | Without Mortgage | With Mortgage |
| Less than 2.0x | 30 (43.5%) | 0 (0.0%) |
| 2.0x to 2.9x | 0 (0.0%) | 0 (0.0%) |
| 3.0x to 3.9x | 0 (0.0%) | 0 (0.0%) |
| 4.0x or more | 39 (56.5%) | 0 (0.0%) |
| Total | 69 (100.0%) | 26 (100.0%) |
Real Estate Taxes by Mortgage Status in Trilby
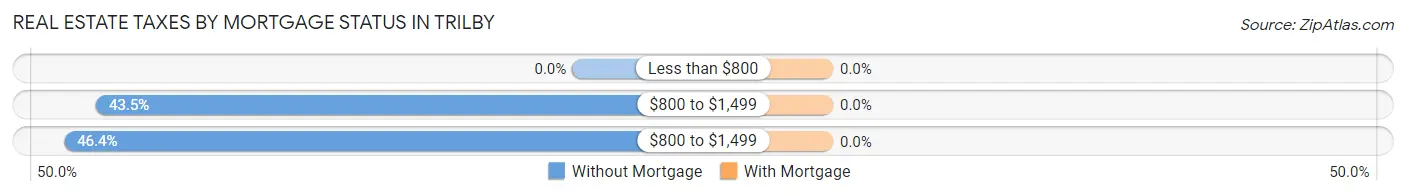
| Property Taxes | Without Mortgage | With Mortgage |
| Less than $800 | 0 (0.0%) | 0 (0.0%) |
| $800 to $1,499 | 30 (43.5%) | 0 (0.0%) |
| $800 to $1,499 | 32 (46.4%) | 0 (0.0%) |
| Total | 69 (100.0%) | 26 (100.0%) |
Health & Disability in Trilby
Health Insurance Coverage by Age in Trilby
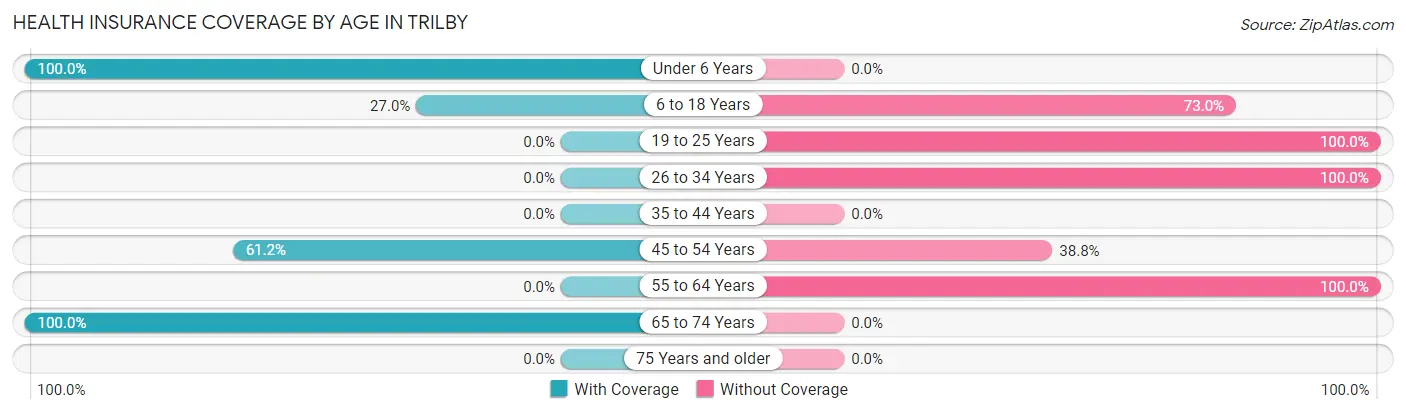
| Age Bracket | With Coverage | Without Coverage |
| Under 6 Years | 8 (100.0%) | 0 (0.0%) |
| 6 to 18 Years | 17 (27.0%) | 46 (73.0%) |
| 19 to 25 Years | 0 (0.0%) | 27 (100.0%) |
| 26 to 34 Years | 0 (0.0%) | 108 (100.0%) |
| 35 to 44 Years | 0 (0.0%) | 0 (0.0%) |
| 45 to 54 Years | 41 (61.2%) | 26 (38.8%) |
| 55 to 64 Years | 0 (0.0%) | 16 (100.0%) |
| 65 to 74 Years | 40 (100.0%) | 0 (0.0%) |
| 75 Years and older | 0 (0.0%) | 0 (0.0%) |
| Total | 106 (32.2%) | 223 (67.8%) |
Health Insurance Coverage by Citizenship Status in Trilby
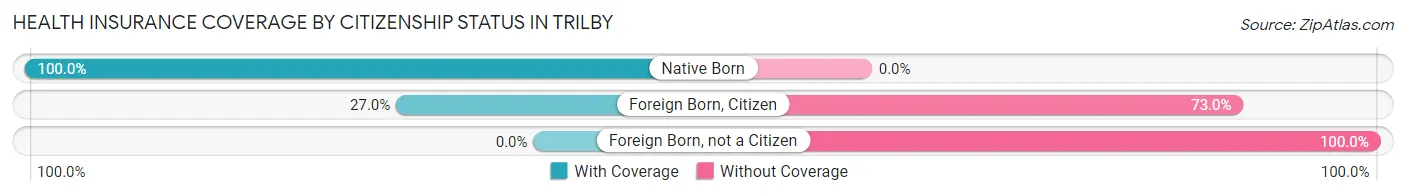
| Citizenship Status | With Coverage | Without Coverage |
| Native Born | 8 (100.0%) | 0 (0.0%) |
| Foreign Born, Citizen | 17 (27.0%) | 46 (73.0%) |
| Foreign Born, not a Citizen | 0 (0.0%) | 27 (100.0%) |
Health Insurance Coverage by Household Income in Trilby
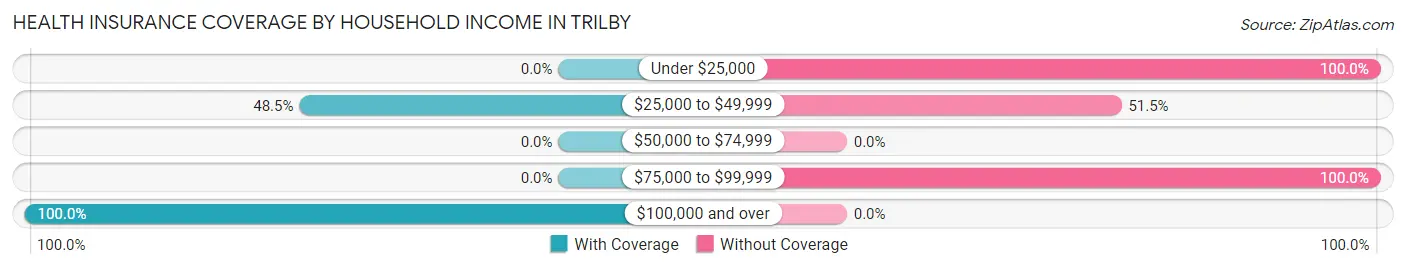
| Household Income | With Coverage | Without Coverage |
| Under $25,000 | 0 (0.0%) | 16 (100.0%) |
| $25,000 to $49,999 | 50 (48.5%) | 53 (51.5%) |
| $50,000 to $74,999 | 0 (0.0%) | 0 (0.0%) |
| $75,000 to $99,999 | 0 (0.0%) | 154 (100.0%) |
| $100,000 and over | 56 (100.0%) | 0 (0.0%) |
Public vs Private Health Insurance Coverage by Age in Trilby
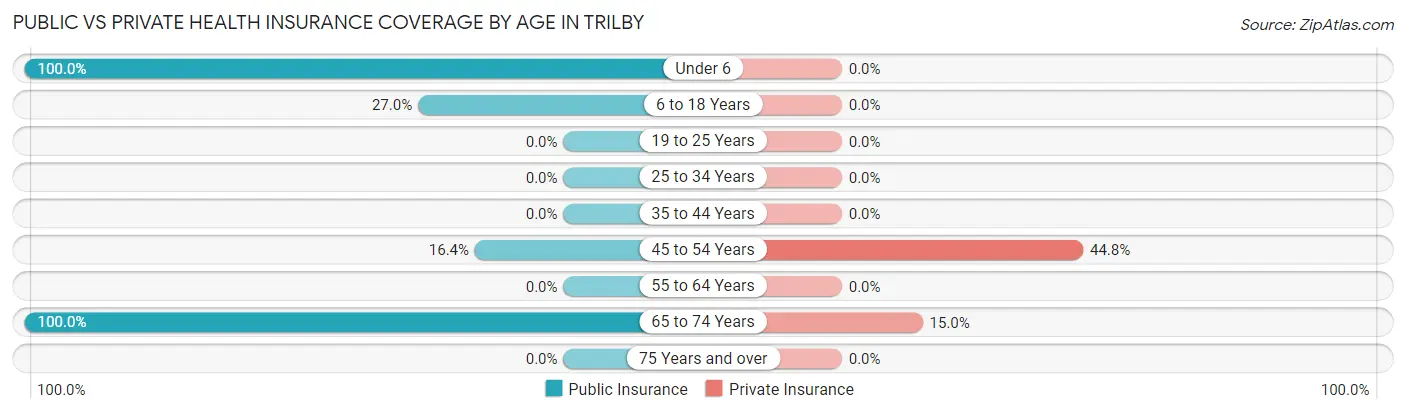
| Age Bracket | Public Insurance | Private Insurance |
| Under 6 | 8 (100.0%) | 0 (0.0%) |
| 6 to 18 Years | 17 (27.0%) | 0 (0.0%) |
| 19 to 25 Years | 0 (0.0%) | 0 (0.0%) |
| 25 to 34 Years | 0 (0.0%) | 0 (0.0%) |
| 35 to 44 Years | 0 (0.0%) | 0 (0.0%) |
| 45 to 54 Years | 11 (16.4%) | 30 (44.8%) |
| 55 to 64 Years | 0 (0.0%) | 0 (0.0%) |
| 65 to 74 Years | 40 (100.0%) | 6 (15.0%) |
| 75 Years and over | 0 (0.0%) | 0 (0.0%) |
| Total | 76 (23.1%) | 36 (10.9%) |
Disability Status by Sex by Age in Trilby
| Age Bracket | Male | Female |
| Under 5 Years | 0 (0.0%) | 0 (0.0%) |
| 5 to 17 Years | 0 (0.0%) | 0 (0.0%) |
| 18 to 34 Years | 0 (0.0%) | 0 (0.0%) |
| 35 to 64 Years | 0 (0.0%) | 0 (0.0%) |
| 65 to 74 Years | 0 (0.0%) | 0 (0.0%) |
| 75 Years and over | 0 (0.0%) | 0 (0.0%) |
Disability Class by Sex by Age in Trilby
Disability Class: Hearing Difficulty
| Age Bracket | Male | Female |
| Under 5 Years | 0 (0.0%) | 0 (0.0%) |
| 5 to 17 Years | 0 (0.0%) | 0 (0.0%) |
| 18 to 34 Years | 0 (0.0%) | 0 (0.0%) |
| 35 to 64 Years | 0 (0.0%) | 0 (0.0%) |
| 65 to 74 Years | 0 (0.0%) | 0 (0.0%) |
| 75 Years and over | 0 (0.0%) | 0 (0.0%) |
Disability Class: Vision Difficulty
| Age Bracket | Male | Female |
| Under 5 Years | 0 (0.0%) | 0 (0.0%) |
| 5 to 17 Years | 0 (0.0%) | 0 (0.0%) |
| 18 to 34 Years | 0 (0.0%) | 0 (0.0%) |
| 35 to 64 Years | 0 (0.0%) | 0 (0.0%) |
| 65 to 74 Years | 0 (0.0%) | 0 (0.0%) |
| 75 Years and over | 0 (0.0%) | 0 (0.0%) |
Disability Class: Cognitive Difficulty
| Age Bracket | Male | Female |
| 5 to 17 Years | 0 (0.0%) | 0 (0.0%) |
| 18 to 34 Years | 0 (0.0%) | 0 (0.0%) |
| 35 to 64 Years | 0 (0.0%) | 0 (0.0%) |
| 65 to 74 Years | 0 (0.0%) | 0 (0.0%) |
| 75 Years and over | 0 (0.0%) | 0 (0.0%) |
Disability Class: Ambulatory Difficulty
| Age Bracket | Male | Female |
| 5 to 17 Years | 0 (0.0%) | 0 (0.0%) |
| 18 to 34 Years | 0 (0.0%) | 0 (0.0%) |
| 35 to 64 Years | 0 (0.0%) | 0 (0.0%) |
| 65 to 74 Years | 0 (0.0%) | 0 (0.0%) |
| 75 Years and over | 0 (0.0%) | 0 (0.0%) |
Disability Class: Self-Care Difficulty
| Age Bracket | Male | Female |
| 5 to 17 Years | 0 (0.0%) | 0 (0.0%) |
| 18 to 34 Years | 0 (0.0%) | 0 (0.0%) |
| 35 to 64 Years | 0 (0.0%) | 0 (0.0%) |
| 65 to 74 Years | 0 (0.0%) | 0 (0.0%) |
| 75 Years and over | 0 (0.0%) | 0 (0.0%) |
Technology Access in Trilby
Computing Device Access in Trilby
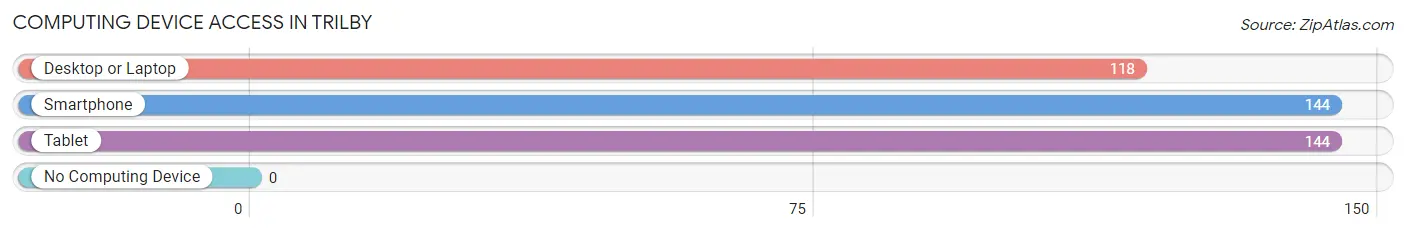
| Device Type | # Households | % Households |
| Desktop or Laptop | 118 | 81.9% |
| Smartphone | 144 | 100.0% |
| Tablet | 144 | 100.0% |
| No Computing Device | 0 | 0.0% |
| Total | 144 | 100.0% |
Internet Access in Trilby
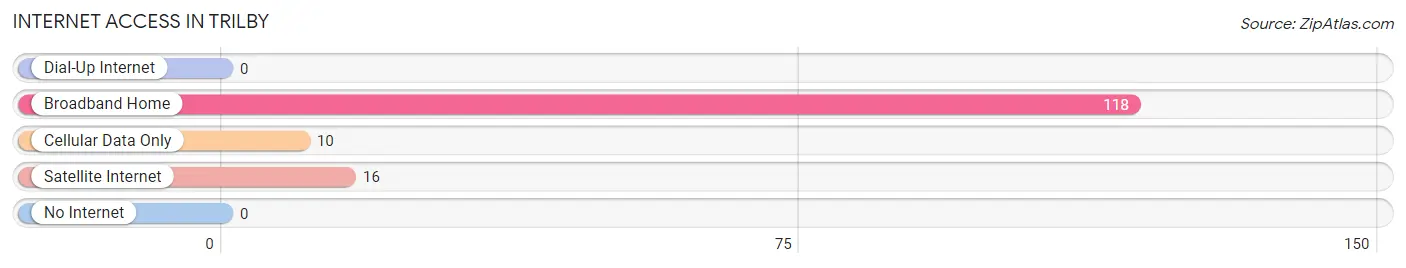
| Internet Type | # Households | % Households |
| Dial-Up Internet | 0 | 0.0% |
| Broadband Home | 118 | 81.9% |
| Cellular Data Only | 10 | 6.9% |
| Satellite Internet | 16 | 11.1% |
| No Internet | 0 | 0.0% |
| Total | 144 | 100.0% |
Trilby Summary
Trilby is a small unincorporated community located in Pasco County, Florida. It is situated about 25 miles northeast of Tampa and is part of the Tampa-St. Petersburg-Clearwater Metropolitan Statistical Area. The population of Trilby was estimated to be 1,845 in 2019.
History
Trilby was founded in 1883 by a group of settlers from Georgia. The town was named after the novel Trilby by George du Maurier, which was popular at the time. The town was originally a farming community, with citrus and vegetables being the main crops. In the early 1900s, the town began to grow as the railroad was extended to the area. This allowed for the transportation of goods and people to and from the town.
In the 1920s, Trilby began to experience a population boom as people moved to the area for the mild climate and the availability of jobs. The town was incorporated in 1925 and the first mayor was elected in 1926.
Geography
Trilby is located in Pasco County, Florida. It is situated about 25 miles northeast of Tampa and is part of the Tampa-St. Petersburg-Clearwater Metropolitan Statistical Area. The town is located on the western edge of the Green Swamp, a large wetland area that is home to a variety of wildlife. The town is bordered by the Withlacoochee River to the north and the Hillsborough River to the south.
The town has a total area of 4.2 square miles, all of which is land. The terrain is mostly flat, with some rolling hills. The average elevation is about 50 feet above sea level.
Economy
Trilby’s economy is largely based on agriculture and tourism. The town is home to several farms that produce citrus, vegetables, and other crops. The town is also home to several tourist attractions, including the Trilby Historical Museum and the Trilby Wildlife Refuge.
The town is also home to several small businesses, including restaurants, shops, and other services. The town is also home to a few light industrial businesses.
Demographics
Trilby’s population was estimated to be 1,845 in 2019. The town has a diverse population, with people of various races and ethnicities. The town’s population is mostly white (77.3%), followed by Hispanic or Latino (14.2%), African American (4.2%), and Asian (2.2%).
The median household income in Trilby is $41,944, which is lower than the national average of $60,293. The median home value is $128,400, which is lower than the national average of $231,200. The town has a poverty rate of 16.2%, which is higher than the national average of 11.8%.
Common Questions
What is Per Capita Income in Trilby?
Per Capita income in Trilby is $28,964.
What is the Median Family Income in Trilby?
Median Family Income in Trilby is $85,663.
What is Income or Wage Gap in Trilby?
Income or Wage Gap in Trilby is 31.2%.
Women in Trilby earn 68.8 cents for every dollar earned by a man.
What is Inequality or Gini Index in Trilby?
Inequality or Gini Index in Trilby is 0.27.
What is the Total Population of Trilby?
Total Population of Trilby is 329.
What is the Total Male Population of Trilby?
Total Male Population of Trilby is 211.
What is the Total Female Population of Trilby?
Total Female Population of Trilby is 118.
What is the Ratio of Males per 100 Females in Trilby?
There are 178.81 Males per 100 Females in Trilby.
What is the Ratio of Females per 100 Males in Trilby?
There are 55.92 Females per 100 Males in Trilby.
What is the Median Population Age in Trilby?
Median Population Age in Trilby is 32.3 Years.
What is the Average Family Size in Trilby
Average Family Size in Trilby is 2.9 People.
What is the Average Household Size in Trilby
Average Household Size in Trilby is 2.3 People.
How Large is the Labor Force in Trilby?
There are 228 People in the Labor Forcein in Trilby.
What is the Percentage of People in the Labor Force in Trilby?
82.9% of People are in the Labor Force in Trilby.