Zip Codes with the Highest Percentage of Population Employed in Food Preparation & Serving in Winter Haven, FL
RELATED REPORTS & OPTIONS
Food Preparation & Serving
Winter Haven
Compare Zip Codes
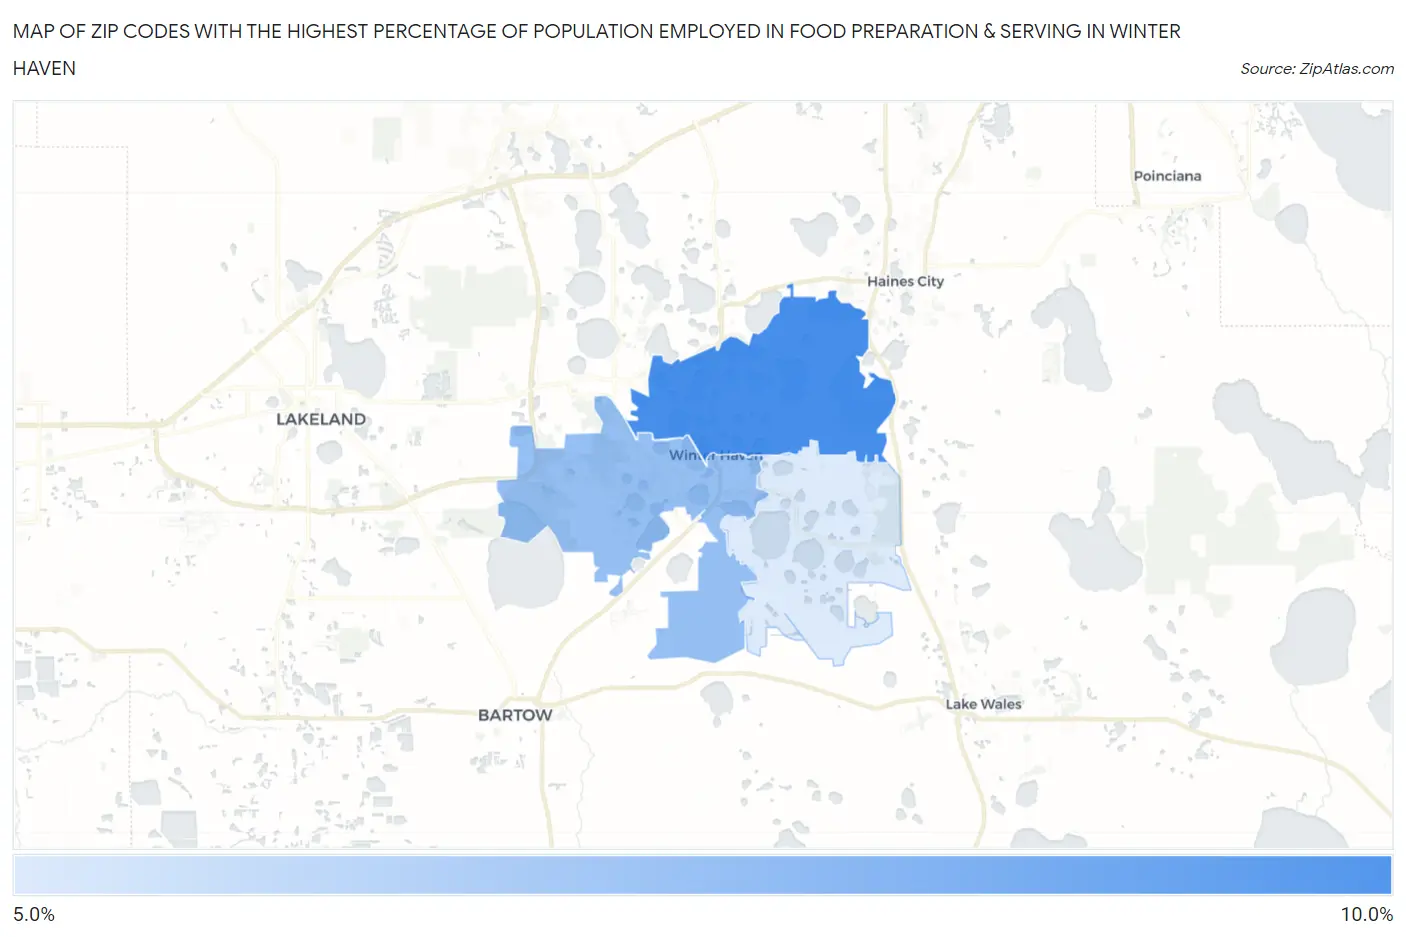
Map of Zip Codes with the Highest Percentage of Population Employed in Food Preparation & Serving in Winter Haven
5.0%
8.8%
Zip Codes with the Highest Percentage of Population Employed in Food Preparation & Serving in Winter Haven, FL
| Zip Code | % Employed | vs State | vs National | |
| 1. | 33881 | 8.8% | 6.1%(+2.69)#146 | 5.3%(+3.50)#3,747 |
| 2. | 33880 | 6.8% | 6.1%(+0.716)#344 | 5.3%(+1.52)#7,051 |
| 3. | 33884 | 5.0% | 6.1%(-1.05)#594 | 5.3%(-0.246)#12,783 |
1
Common Questions
What are the Top Zip Codes with the Highest Percentage of Population Employed in Food Preparation & Serving in Winter Haven, FL?
Top Zip Codes with the Highest Percentage of Population Employed in Food Preparation & Serving in Winter Haven, FL are:
What zip code has the Highest Percentage of Population Employed in Food Preparation & Serving in Winter Haven, FL?
33881 has the Highest Percentage of Population Employed in Food Preparation & Serving in Winter Haven, FL with 8.8%.
What is the Percentage of Population Employed in Food Preparation & Serving in Winter Haven, FL?
Percentage of Population Employed in Food Preparation & Serving in Winter Haven is 6.5%.
What is the Percentage of Population Employed in Food Preparation & Serving in Florida?
Percentage of Population Employed in Food Preparation & Serving in Florida is 6.1%.
What is the Percentage of Population Employed in Food Preparation & Serving in the United States?
Percentage of Population Employed in Food Preparation & Serving in the United States is 5.3%.