Solana, FL Map & Demographics
Solana Map
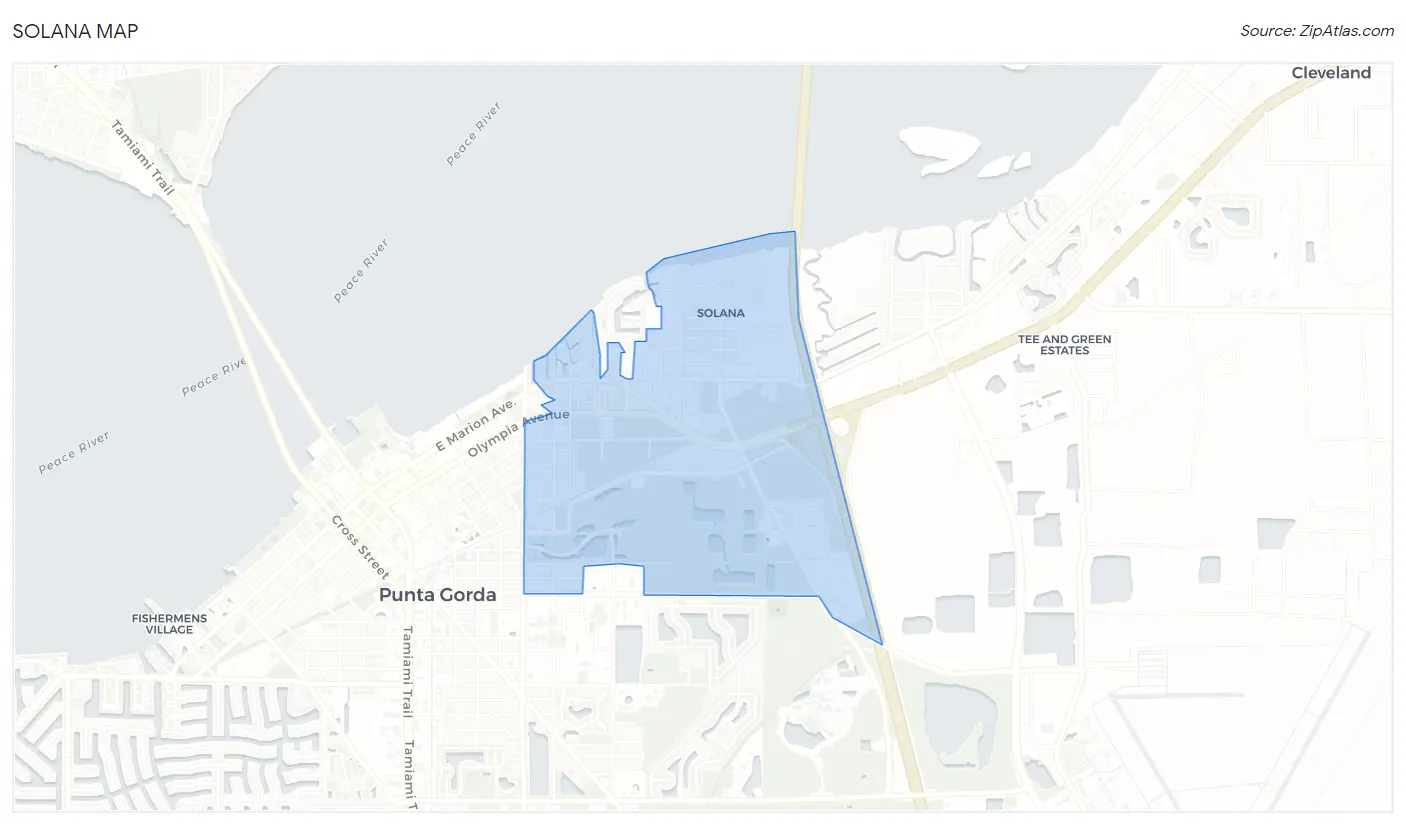
Solana Overview
$18,324
PER CAPITA INCOME
$38,167
AVG HOUSEHOLD INCOME
29.1%
WAGE / INCOME GAP [ % ]
70.9¢/ $1
WAGE / INCOME GAP [ $ ]
0.37
INEQUALITY / GINI INDEX
1,062
TOTAL POPULATION
571
MALE POPULATION
491
FEMALE POPULATION
116.29
MALES / 100 FEMALES
85.99
FEMALES / 100 MALES
25.8
MEDIAN AGE
3.9
AVG FAMILY SIZE
2.6
AVG HOUSEHOLD SIZE
393
LABOR FORCE [ PEOPLE ]
46.3%
PERCENT IN LABOR FORCE
3.6%
UNEMPLOYMENT RATE
Income in Solana
Income Overview in Solana
| Characteristic | Number | Measure |
| Per Capita Income | 1,062 | $18,324 |
| Median Family Income | 224 | $0 |
| Mean Family Income | 224 | $53,895 |
| Median Household Income | 404 | $38,167 |
| Mean Household Income | 404 | $47,497 |
| Income Deficit | 224 | $0 |
| Wage / Income Gap (%) | 1,062 | 29.11% |
| Wage / Income Gap ($) | 1,062 | 70.89¢ per $1 |
| Gini / Inequality Index | 1,062 | 0.37 |
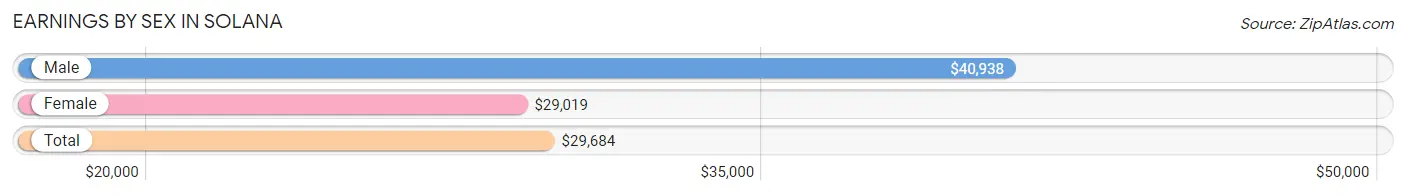
Earnings by Sex in Solana
Average Earnings in Solana are $29,684, $40,938 for men and $29,019 for women, a difference of 29.1%.
| Sex | Number | Average Earnings |
| Male | 142 (34.5%) | $40,938 |
| Female | 270 (65.5%) | $29,019 |
| Total | 412 (100.0%) | $29,684 |
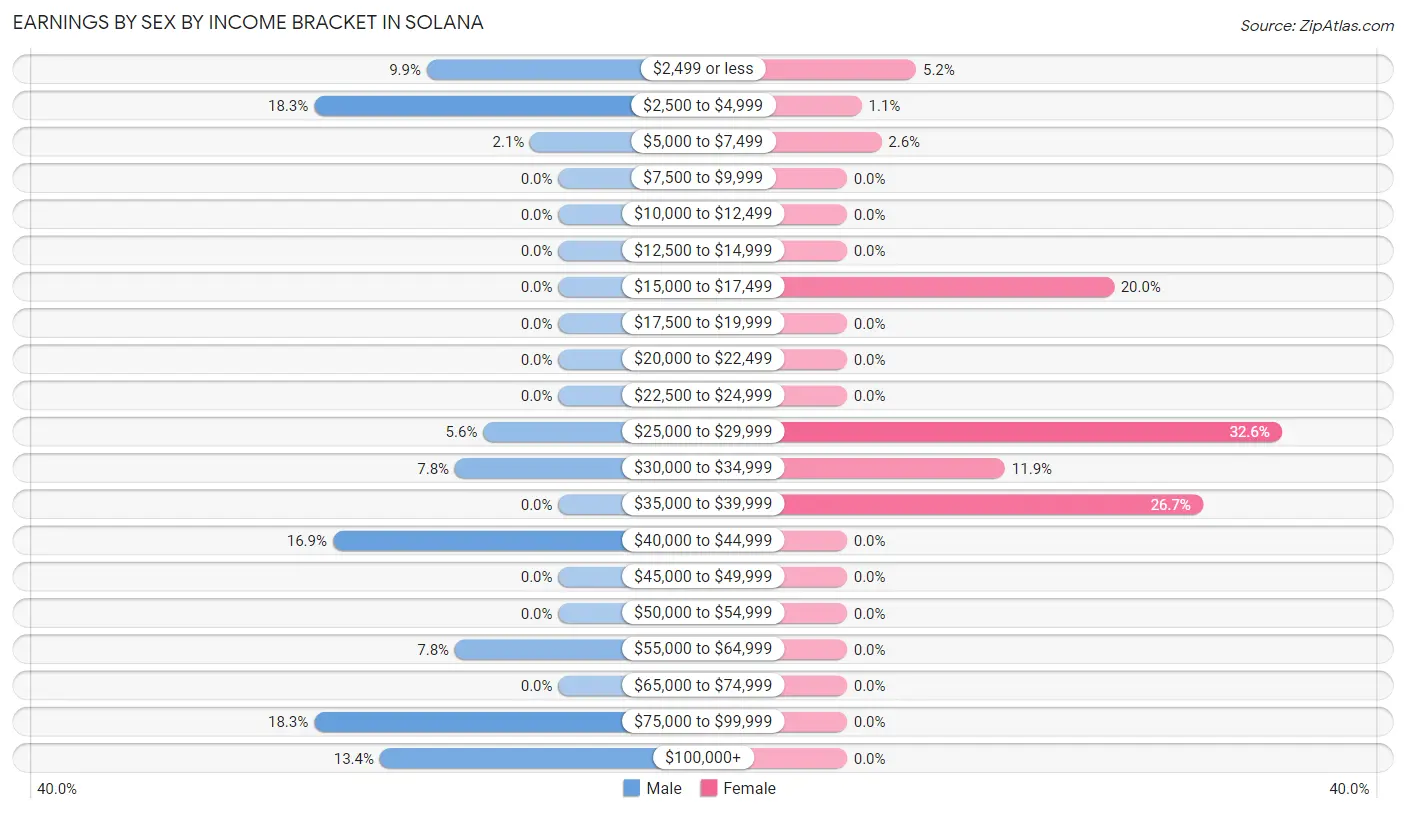
Earnings by Sex by Income Bracket in Solana
The most common earnings brackets in Solana are $2,500 to $4,999 for men (26 | 18.3%) and $25,000 to $29,999 for women (88 | 32.6%).
| Income | Male | Female |
| $2,499 or less | 14 (9.9%) | 14 (5.2%) |
| $2,500 to $4,999 | 26 (18.3%) | 3 (1.1%) |
| $5,000 to $7,499 | 3 (2.1%) | 7 (2.6%) |
| $7,500 to $9,999 | 0 (0.0%) | 0 (0.0%) |
| $10,000 to $12,499 | 0 (0.0%) | 0 (0.0%) |
| $12,500 to $14,999 | 0 (0.0%) | 0 (0.0%) |
| $15,000 to $17,499 | 0 (0.0%) | 54 (20.0%) |
| $17,500 to $19,999 | 0 (0.0%) | 0 (0.0%) |
| $20,000 to $22,499 | 0 (0.0%) | 0 (0.0%) |
| $22,500 to $24,999 | 0 (0.0%) | 0 (0.0%) |
| $25,000 to $29,999 | 8 (5.6%) | 88 (32.6%) |
| $30,000 to $34,999 | 11 (7.7%) | 32 (11.8%) |
| $35,000 to $39,999 | 0 (0.0%) | 72 (26.7%) |
| $40,000 to $44,999 | 24 (16.9%) | 0 (0.0%) |
| $45,000 to $49,999 | 0 (0.0%) | 0 (0.0%) |
| $50,000 to $54,999 | 0 (0.0%) | 0 (0.0%) |
| $55,000 to $64,999 | 11 (7.7%) | 0 (0.0%) |
| $65,000 to $74,999 | 0 (0.0%) | 0 (0.0%) |
| $75,000 to $99,999 | 26 (18.3%) | 0 (0.0%) |
| $100,000+ | 19 (13.4%) | 0 (0.0%) |
| Total | 142 (100.0%) | 270 (100.0%) |
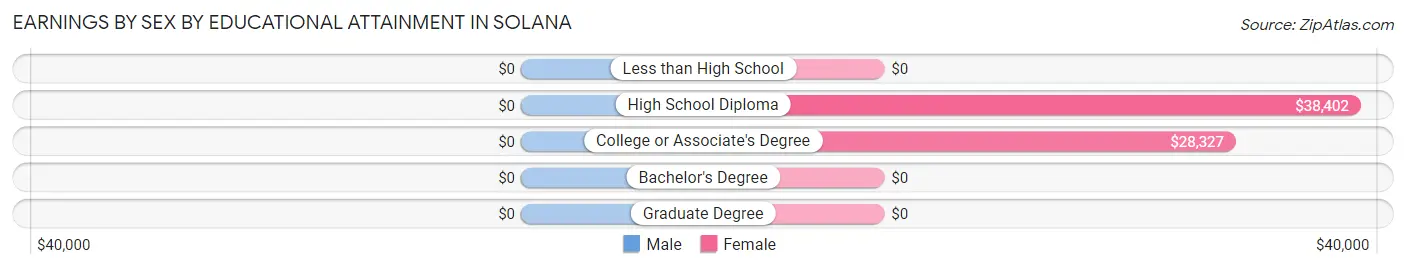
Earnings by Sex by Educational Attainment in Solana
| Educational Attainment | Male Income | Female Income |
| Less than High School | - | - |
| High School Diploma | - | - |
| College or Associate's Degree | - | - |
| Bachelor's Degree | - | - |
| Graduate Degree | - | - |
| Total | $41,667 | $29,019 |
Family Income in Solana
Family Income Brackets in Solana
According to the Solana family income data, there are 69 families falling into the $25,000 to $34,999 income range, which is the most common income bracket and makes up 30.8% of all families.
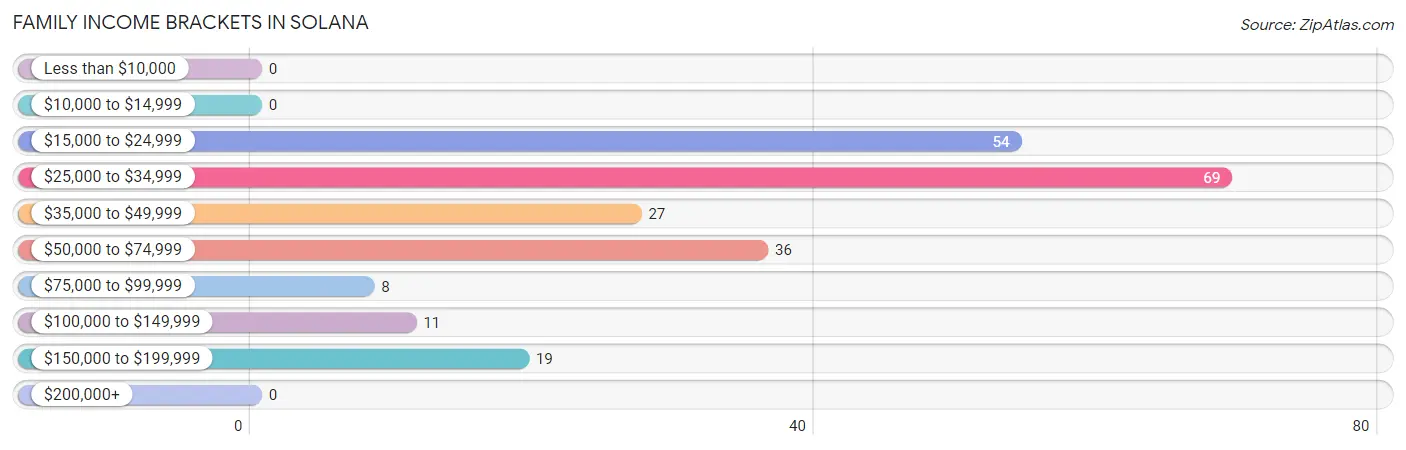
| Income Bracket | # Families | % Families |
| Less than $10,000 | 0 | 0.0% |
| $10,000 to $14,999 | 0 | 0.0% |
| $15,000 to $24,999 | 54 | 24.1% |
| $25,000 to $34,999 | 69 | 30.8% |
| $35,000 to $49,999 | 27 | 12.1% |
| $50,000 to $74,999 | 36 | 16.1% |
| $75,000 to $99,999 | 8 | 3.6% |
| $100,000 to $149,999 | 11 | 4.9% |
| $150,000 to $199,999 | 19 | 8.5% |
| $200,000+ | 0 | 0.0% |
Family Income by Famaliy Size in Solana
2-person families (84 | 37.5%) account for the highest median family income in Solana with $70,870 per family, while 2-person families (84 | 37.5%) have the highest median income of $35,435 per family member.
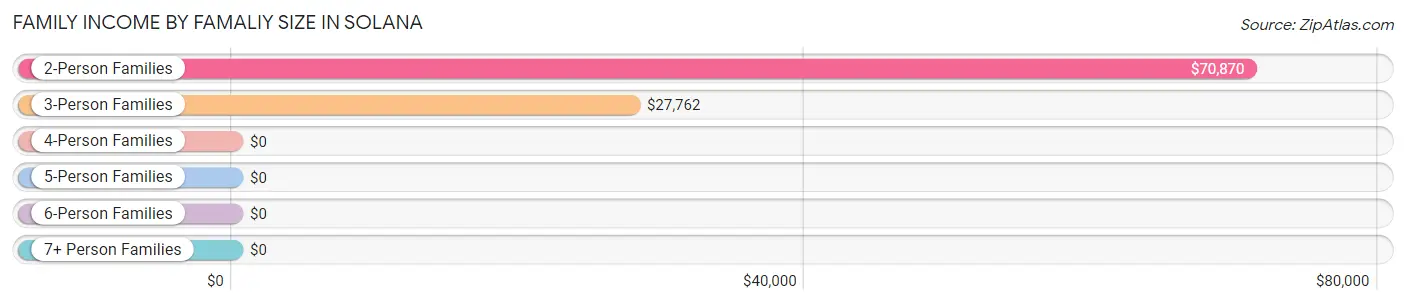
| Income Bracket | # Families | Median Income |
| 2-Person Families | 84 (37.5%) | $70,870 |
| 3-Person Families | 121 (54.0%) | $27,762 |
| 4-Person Families | 0 (0.0%) | $0 |
| 5-Person Families | 11 (4.9%) | $0 |
| 6-Person Families | 8 (3.6%) | $0 |
| 7+ Person Families | 0 (0.0%) | $0 |
| Total | 224 (100.0%) | $0 |
Family Income by Number of Earners in Solana
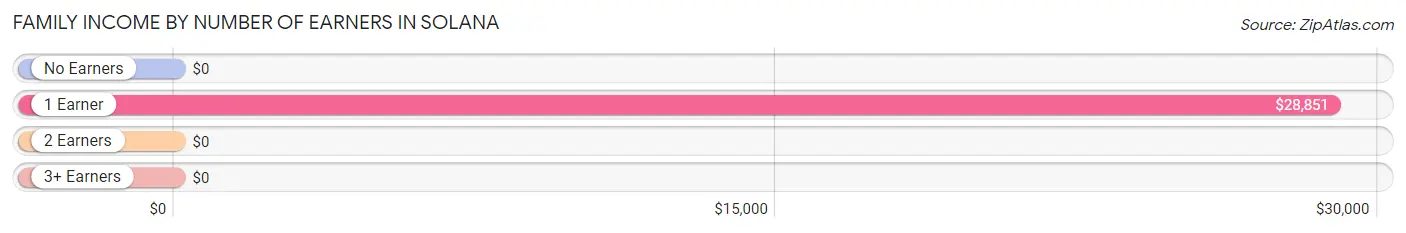
| Number of Earners | # Families | Median Income |
| No Earners | 13 (5.8%) | $0 |
| 1 Earner | 175 (78.1%) | $28,851 |
| 2 Earners | 28 (12.5%) | $0 |
| 3+ Earners | 8 (3.6%) | $0 |
| Total | 224 (100.0%) | $0 |
Household Income in Solana
Household Income Brackets in Solana
With 109 households falling in the category, the $25,000 to $34,999 income range is the most frequent in Solana, accounting for 27.0% of all households.
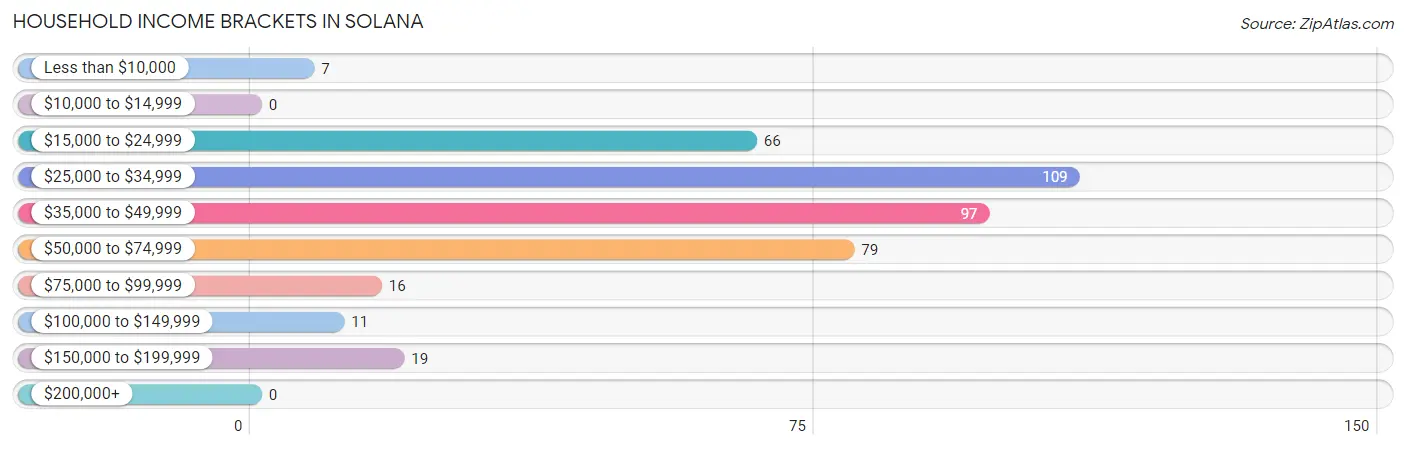
| Income Bracket | # Households | % Households |
| Less than $10,000 | 7 | 1.7% |
| $10,000 to $14,999 | 0 | 0.0% |
| $15,000 to $24,999 | 66 | 16.3% |
| $25,000 to $34,999 | 109 | 27.0% |
| $35,000 to $49,999 | 97 | 24.0% |
| $50,000 to $74,999 | 79 | 19.6% |
| $75,000 to $99,999 | 16 | 4.0% |
| $100,000 to $149,999 | 11 | 2.7% |
| $150,000 to $199,999 | 19 | 4.7% |
| $200,000+ | 0 | 0.0% |
Household Income by Householder Age in Solana
The median household income in Solana is $38,167, with the highest median household income of $42,885 found in the 65+ years age bracket for the primary householder. A total of 132 households (32.7%) fall into this category.
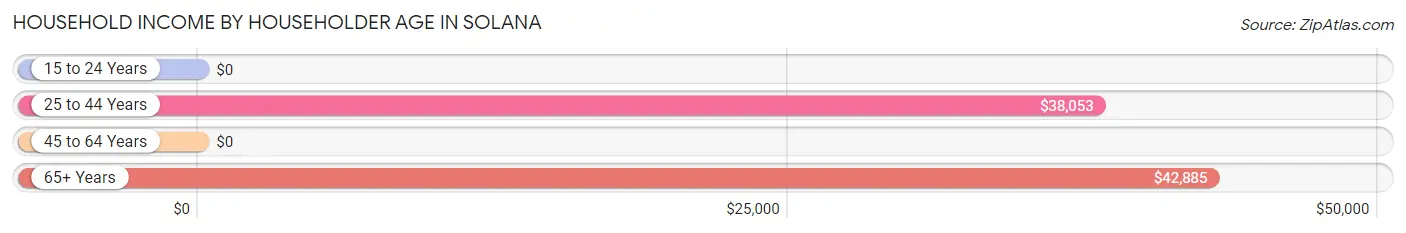
| Income Bracket | # Households | Median Income |
| 15 to 24 Years | 0 (0.0%) | $0 |
| 25 to 44 Years | 149 (36.9%) | $38,053 |
| 45 to 64 Years | 123 (30.4%) | $0 |
| 65+ Years | 132 (32.7%) | $42,885 |
| Total | 404 (100.0%) | $38,167 |
Poverty in Solana
Income Below Poverty by Sex and Age in Solana
With 18.2% poverty level for males and 11.0% for females among the residents of Solana, 6 to 11 year old males and 35 to 44 year old females are the most vulnerable to poverty, with 49 males (100.0%) and 54 females (74.0%) in their respective age groups living below the poverty level.
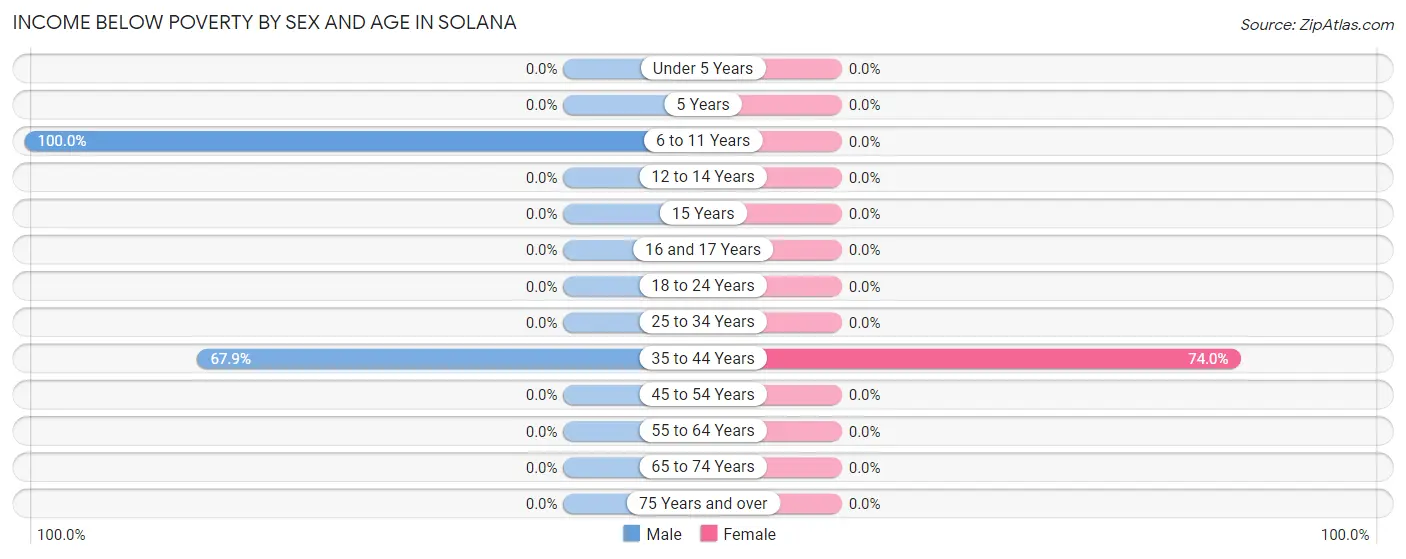
| Age Bracket | Male | Female |
| Under 5 Years | 0 (0.0%) | 0 (0.0%) |
| 5 Years | 0 (0.0%) | 0 (0.0%) |
| 6 to 11 Years | 49 (100.0%) | 0 (0.0%) |
| 12 to 14 Years | 0 (0.0%) | 0 (0.0%) |
| 15 Years | 0 (0.0%) | 0 (0.0%) |
| 16 and 17 Years | 0 (0.0%) | 0 (0.0%) |
| 18 to 24 Years | 0 (0.0%) | 0 (0.0%) |
| 25 to 34 Years | 0 (0.0%) | 0 (0.0%) |
| 35 to 44 Years | 55 (67.9%) | 54 (74.0%) |
| 45 to 54 Years | 0 (0.0%) | 0 (0.0%) |
| 55 to 64 Years | 0 (0.0%) | 0 (0.0%) |
| 65 to 74 Years | 0 (0.0%) | 0 (0.0%) |
| 75 Years and over | 0 (0.0%) | 0 (0.0%) |
| Total | 104 (18.2%) | 54 (11.0%) |
Income Above Poverty by Sex and Age in Solana
According to the poverty statistics in Solana, males aged 12 to 14 years and females aged under 5 years are the age groups that are most secure financially, with 100.0% of males and 100.0% of females in these age groups living above the poverty line.
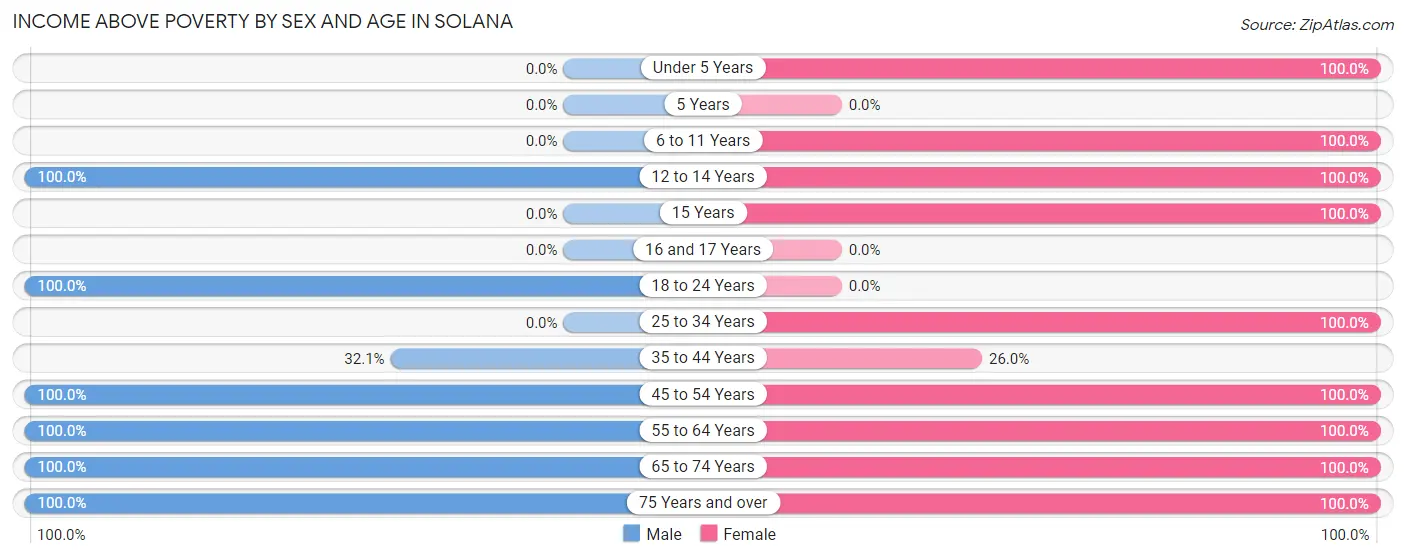
| Age Bracket | Male | Female |
| Under 5 Years | 0 (0.0%) | 12 (100.0%) |
| 5 Years | 0 (0.0%) | 0 (0.0%) |
| 6 to 11 Years | 0 (0.0%) | 24 (100.0%) |
| 12 to 14 Years | 8 (100.0%) | 10 (100.0%) |
| 15 Years | 0 (0.0%) | 111 (100.0%) |
| 16 and 17 Years | 0 (0.0%) | 0 (0.0%) |
| 18 to 24 Years | 269 (100.0%) | 0 (0.0%) |
| 25 to 34 Years | 0 (0.0%) | 61 (100.0%) |
| 35 to 44 Years | 26 (32.1%) | 19 (26.0%) |
| 45 to 54 Years | 48 (100.0%) | 90 (100.0%) |
| 55 to 64 Years | 49 (100.0%) | 21 (100.0%) |
| 65 to 74 Years | 33 (100.0%) | 41 (100.0%) |
| 75 Years and over | 34 (100.0%) | 48 (100.0%) |
| Total | 467 (81.8%) | 437 (89.0%) |
Income Below Poverty Among Married-Couple Families in Solana
The poverty statistics for married-couple families in Solana show that 39.4% or 54 of the total 137 families live below the poverty line. Families with 1 or 2 children have the highest poverty rate of 87.1%, comprising of 54 families. On the other hand, families with no children have the lowest poverty rate of 0.0%, which includes 0 families.
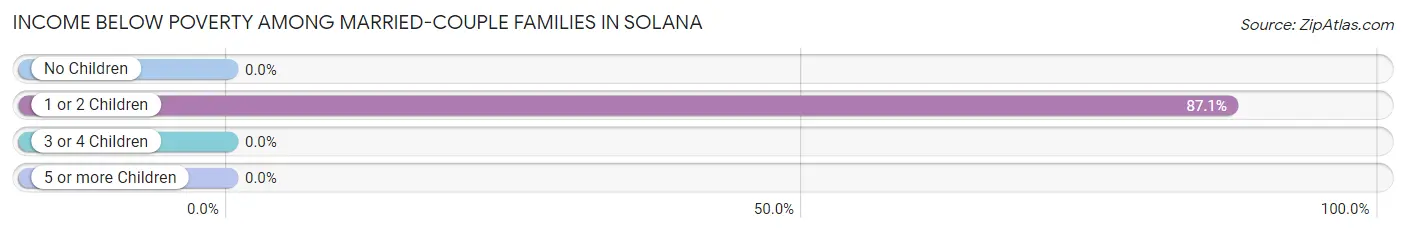
| Children | Above Poverty | Below Poverty |
| No Children | 64 (100.0%) | 0 (0.0%) |
| 1 or 2 Children | 8 (12.9%) | 54 (87.1%) |
| 3 or 4 Children | 11 (100.0%) | 0 (0.0%) |
| 5 or more Children | 0 (0.0%) | 0 (0.0%) |
| Total | 83 (60.6%) | 54 (39.4%) |
Income Below Poverty Among Single-Parent Households in Solana
| Children | Single Father | Single Mother |
| No Children | 0 (0.0%) | 0 (0.0%) |
| 1 or 2 Children | 0 (0.0%) | 0 (0.0%) |
| 3 or 4 Children | 0 (0.0%) | 0 (0.0%) |
| 5 or more Children | 0 (0.0%) | 0 (0.0%) |
| Total | 0 (0.0%) | 0 (0.0%) |
Income Below Poverty Among Married-Couple vs Single-Parent Households in Solana
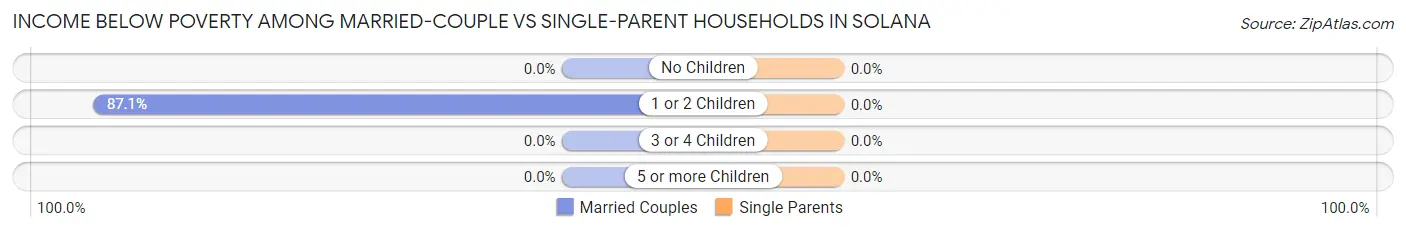
| Children | Married-Couple Families | Single-Parent Households |
| No Children | 0 (0.0%) | 0 (0.0%) |
| 1 or 2 Children | 54 (87.1%) | 0 (0.0%) |
| 3 or 4 Children | 0 (0.0%) | 0 (0.0%) |
| 5 or more Children | 0 (0.0%) | 0 (0.0%) |
| Total | 54 (39.4%) | 0 (0.0%) |
Race in Solana
The most populous races in Solana are White / Caucasian (646 | 60.8%), and Black / African American (416 | 39.2%).
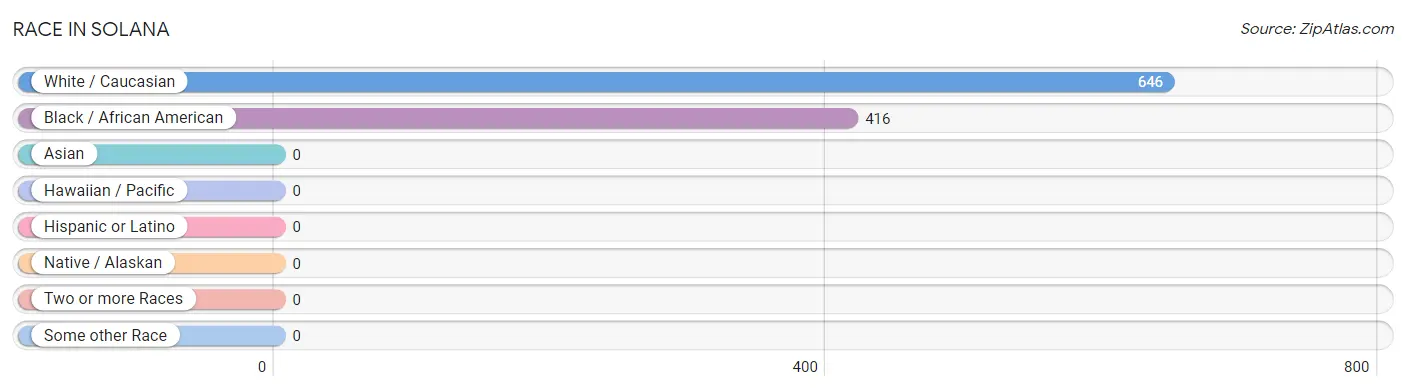
| Race | # Population | % Population |
| Asian | 0 | 0.0% |
| Black / African American | 416 | 39.2% |
| Hawaiian / Pacific | 0 | 0.0% |
| Hispanic or Latino | 0 | 0.0% |
| Native / Alaskan | 0 | 0.0% |
| White / Caucasian | 646 | 60.8% |
| Two or more Races | 0 | 0.0% |
| Some other Race | 0 | 0.0% |
| Total | 1,062 | 100.0% |
Ancestry in Solana
The most populous ancestries reported in Solana are Italian (199 | 18.7%), American (189 | 17.8%), German (144 | 13.6%), Irish (37 | 3.5%), and Swedish (32 | 3.0%), together accounting for 56.6% of all Solana residents.
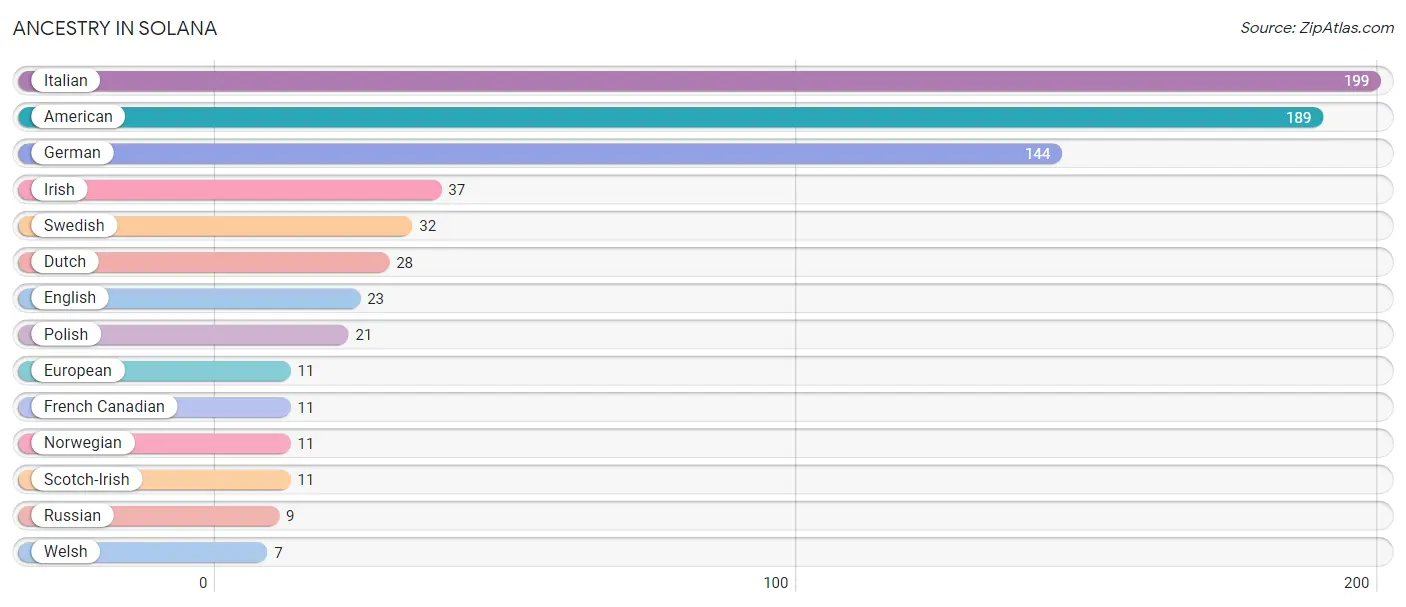
| Ancestry | # Population | % Population |
| American | 189 | 17.8% |
| Dutch | 28 | 2.6% |
| English | 23 | 2.2% |
| European | 11 | 1.0% |
| French Canadian | 11 | 1.0% |
| German | 144 | 13.6% |
| Irish | 37 | 3.5% |
| Italian | 199 | 18.7% |
| Norwegian | 11 | 1.0% |
| Polish | 21 | 2.0% |
| Russian | 9 | 0.9% |
| Scotch-Irish | 11 | 1.0% |
| Swedish | 32 | 3.0% |
| Welsh | 7 | 0.7% | View All 14 Rows |
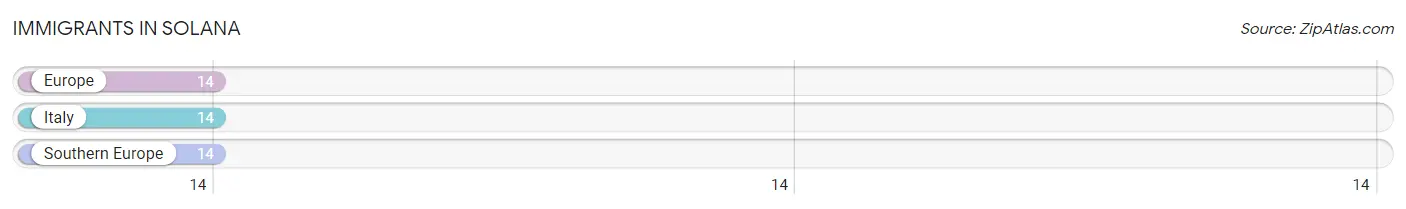
Immigrants in Solana
The most numerous immigrant groups reported in Solana came from Europe (14 | 1.3%), Italy (14 | 1.3%), and Southern Europe (14 | 1.3%), together accounting for 4.0% of all Solana residents.
| Immigration Origin | # Population | % Population |
| Europe | 14 | 1.3% |
| Italy | 14 | 1.3% |
| Southern Europe | 14 | 1.3% | View All 3 Rows |
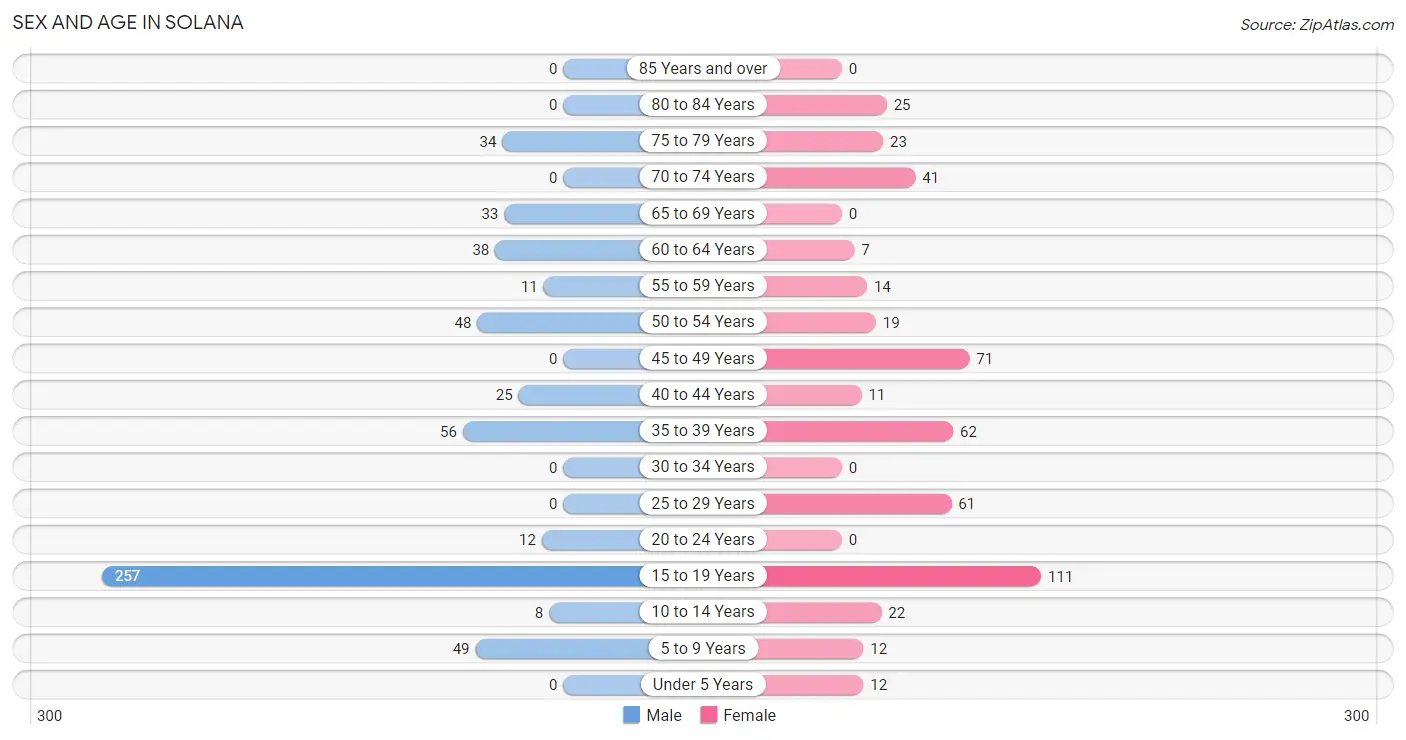
Sex and Age in Solana
Sex and Age in Solana
The most populous age groups in Solana are 15 to 19 Years (257 | 45.0%) for men and 15 to 19 Years (111 | 22.6%) for women.
| Age Bracket | Male | Female |
| Under 5 Years | 0 (0.0%) | 12 (2.4%) |
| 5 to 9 Years | 49 (8.6%) | 12 (2.4%) |
| 10 to 14 Years | 8 (1.4%) | 22 (4.5%) |
| 15 to 19 Years | 257 (45.0%) | 111 (22.6%) |
| 20 to 24 Years | 12 (2.1%) | 0 (0.0%) |
| 25 to 29 Years | 0 (0.0%) | 61 (12.4%) |
| 30 to 34 Years | 0 (0.0%) | 0 (0.0%) |
| 35 to 39 Years | 56 (9.8%) | 62 (12.6%) |
| 40 to 44 Years | 25 (4.4%) | 11 (2.2%) |
| 45 to 49 Years | 0 (0.0%) | 71 (14.5%) |
| 50 to 54 Years | 48 (8.4%) | 19 (3.9%) |
| 55 to 59 Years | 11 (1.9%) | 14 (2.9%) |
| 60 to 64 Years | 38 (6.7%) | 7 (1.4%) |
| 65 to 69 Years | 33 (5.8%) | 0 (0.0%) |
| 70 to 74 Years | 0 (0.0%) | 41 (8.4%) |
| 75 to 79 Years | 34 (5.9%) | 23 (4.7%) |
| 80 to 84 Years | 0 (0.0%) | 25 (5.1%) |
| 85 Years and over | 0 (0.0%) | 0 (0.0%) |
| Total | 571 (100.0%) | 491 (100.0%) |
Families and Households in Solana
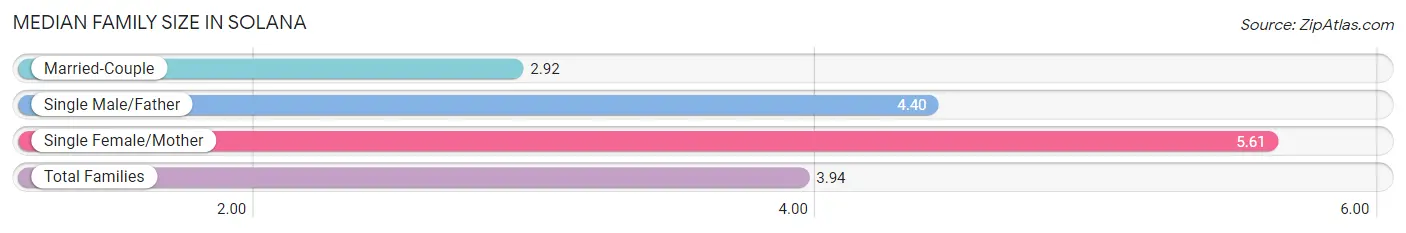
Median Family Size in Solana
The median family size in Solana is 3.94 persons per family, with single female/mother families (82 | 36.6%) accounting for the largest median family size of 5.61 persons per family. On the other hand, married-couple families (137 | 61.2%) represent the smallest median family size with 2.92 persons per family.
| Family Type | # Families | Family Size |
| Married-Couple | 137 (61.2%) | 2.92 |
| Single Male/Father | 5 (2.2%) | 4.40 |
| Single Female/Mother | 82 (36.6%) | 5.61 |
| Total Families | 224 (100.0%) | 3.94 |
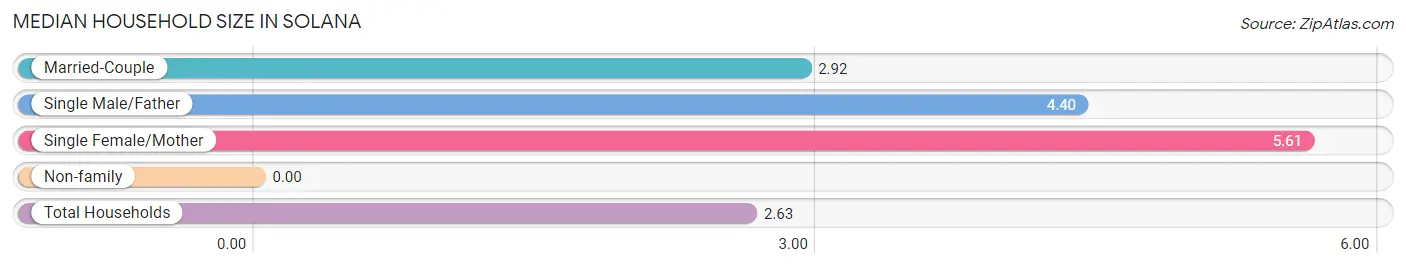
Median Household Size in Solana
| Household Type | # Households | Household Size |
| Married-Couple | 137 (33.9%) | 2.92 |
| Single Male/Father | 5 (1.2%) | 4.40 |
| Single Female/Mother | 82 (20.3%) | 5.61 |
| Non-family | 180 (44.6%) | - |
| Total Households | 404 (100.0%) | 2.63 |
Household Size by Marriage Status in Solana
Out of a total of 404 households in Solana, 224 (55.4%) are family households, while 180 (44.6%) are nonfamily households. The most numerous type of family households are 3-person households, comprising 121, and the most common type of nonfamily households are 1-person households, comprising 180.
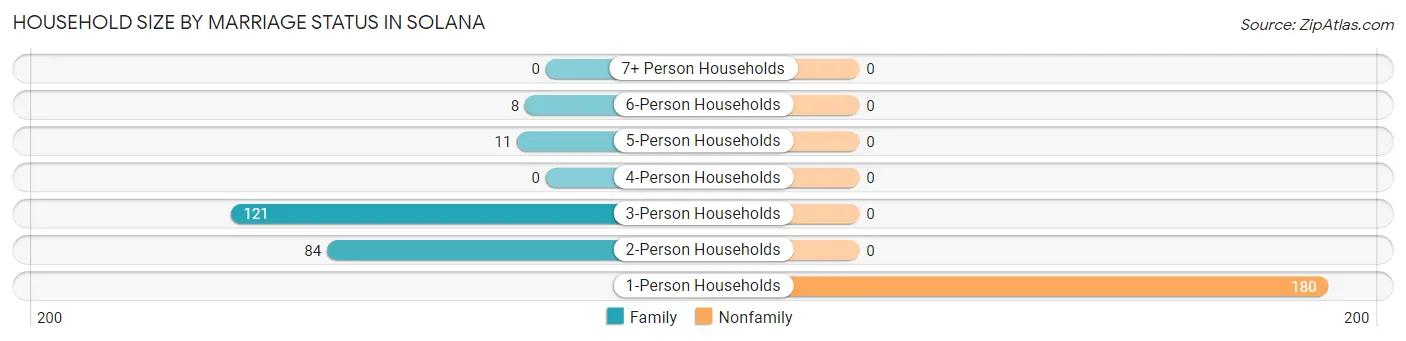
| Household Size | Family Households | Nonfamily Households |
| 1-Person Households | - | 180 (44.6%) |
| 2-Person Households | 84 (20.8%) | 0 (0.0%) |
| 3-Person Households | 121 (29.9%) | 0 (0.0%) |
| 4-Person Households | 0 (0.0%) | 0 (0.0%) |
| 5-Person Households | 11 (2.7%) | 0 (0.0%) |
| 6-Person Households | 8 (2.0%) | 0 (0.0%) |
| 7+ Person Households | 0 (0.0%) | 0 (0.0%) |
| Total | 224 (55.4%) | 180 (44.6%) |
Female Fertility in Solana
Fertility by Age in Solana
| Age Bracket | Women with Births | Births / 1,000 Women |
| 15 to 19 years | 0 (0.0%) | 0.0 |
| 20 to 34 years | 0 (0.0%) | 0.0 |
| 35 to 50 years | 0 (0.0%) | 0.0 |
| Total | 0 (0.0%) | 0.0 |
Fertility by Age by Marriage Status in Solana
| Age Bracket | Married | Unmarried |
| 15 to 19 years | 0 (0.0%) | 0 (0.0%) |
| 20 to 34 years | 0 (0.0%) | 0 (0.0%) |
| 35 to 50 years | 0 (0.0%) | 0 (0.0%) |
| Total | 0 (0.0%) | 0 (0.0%) |
Fertility by Education in Solana
| Educational Attainment | Women with Births | Births / 1,000 Women |
| Less than High School | 0 (0.0%) | 0.0 |
| High School Diploma | 0 (0.0%) | 0.0 |
| College or Associate's Degree | 0 (0.0%) | 0.0 |
| Bachelor's Degree | 0 (0.0%) | 0.0 |
| Graduate Degree | 0 (0.0%) | 0.0 |
| Total | 0 (0.0%) | 0.0 |
Fertility by Education by Marriage Status in Solana

| Educational Attainment | Married | Unmarried |
| Less than High School | 0 (0.0%) | 0 (0.0%) |
| High School Diploma | 0 (0.0%) | 0 (0.0%) |
| College or Associate's Degree | 0 (0.0%) | 0 (0.0%) |
| Bachelor's Degree | 0 (0.0%) | 0 (0.0%) |
| Graduate Degree | 0 (0.0%) | 0 (0.0%) |
| Total | 0 (0.0%) | 0 (0.0%) |
Employment Characteristics in Solana
Employment by Class of Employer in Solana
Among the 379 employed individuals in Solana, private company employees (133 | 35.1%), state government employees (83 | 21.9%), and self-employed (not incorporated) (79 | 20.8%) make up the most common classes of employment.
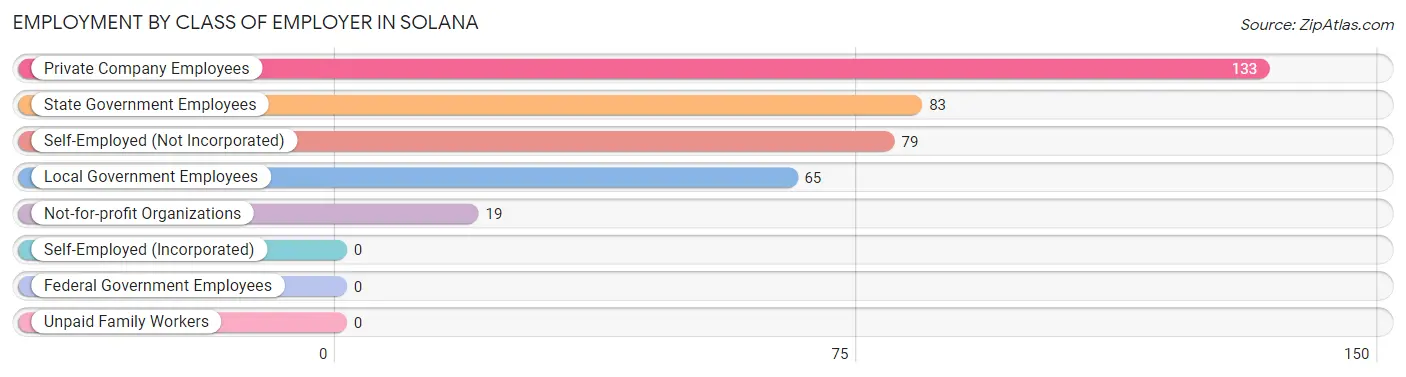
| Employer Class | # Employees | % Employees |
| Private Company Employees | 133 | 35.1% |
| Self-Employed (Incorporated) | 0 | 0.0% |
| Self-Employed (Not Incorporated) | 79 | 20.8% |
| Not-for-profit Organizations | 19 | 5.0% |
| Local Government Employees | 65 | 17.2% |
| State Government Employees | 83 | 21.9% |
| Federal Government Employees | 0 | 0.0% |
| Unpaid Family Workers | 0 | 0.0% |
| Total | 379 | 100.0% |
Employment Status by Age in Solana
According to the labor force statistics for Solana, out of the total population over 16 years of age (848), 46.3% or 393 individuals are in the labor force, with 3.6% or 14 of them unemployed. The age group with the highest labor force participation rate is 25 to 29 years, with 100.0% or 61 individuals in the labor force. Within the labor force, the 65 to 74 years age range has the highest percentage of unemployed individuals, with 25.5% or 14 of them being unemployed.
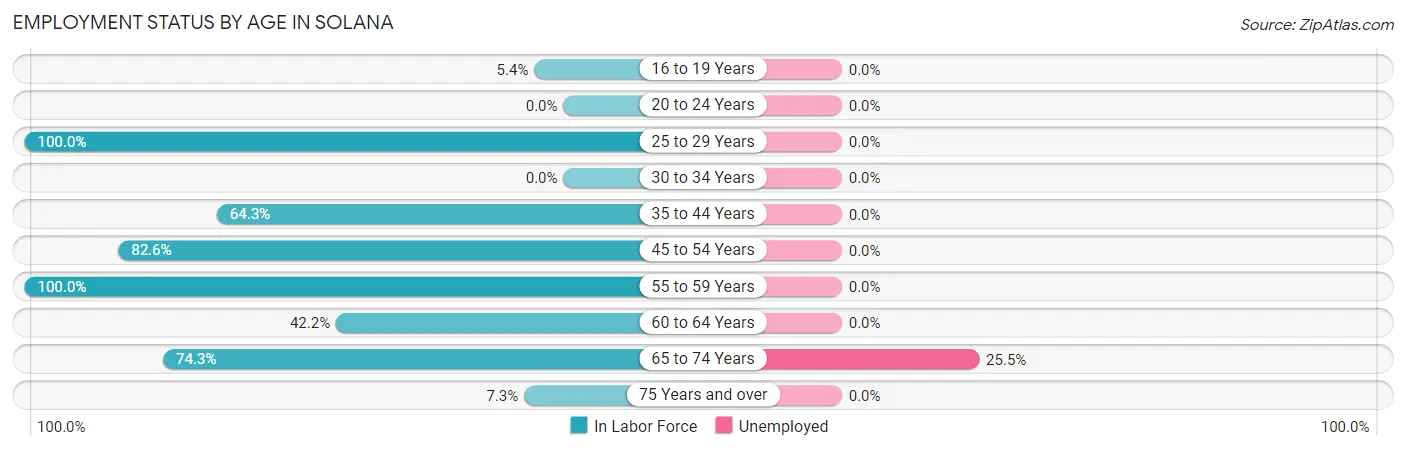
| Age Bracket | In Labor Force | Unemployed |
| 16 to 19 Years | 14 (5.4%) | 0 (0.0%) |
| 20 to 24 Years | 0 (0.0%) | 0 (0.0%) |
| 25 to 29 Years | 61 (100.0%) | 0 (0.0%) |
| 30 to 34 Years | 0 (0.0%) | 0 (0.0%) |
| 35 to 44 Years | 99 (64.3%) | 0 (0.0%) |
| 45 to 54 Years | 114 (82.6%) | 0 (0.0%) |
| 55 to 59 Years | 25 (100.0%) | 0 (0.0%) |
| 60 to 64 Years | 19 (42.2%) | 0 (0.0%) |
| 65 to 74 Years | 55 (74.3%) | 14 (25.5%) |
| 75 Years and over | 6 (7.3%) | 0 (0.0%) |
| Total | 393 (46.3%) | 14 (3.6%) |
Employment Status by Educational Attainment in Solana
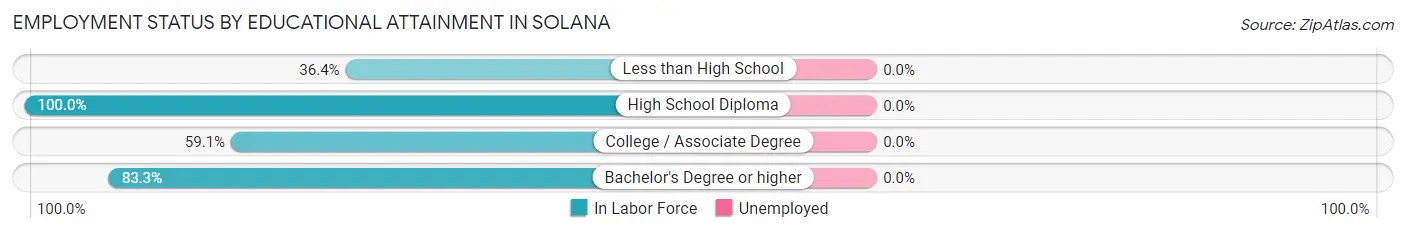
| Educational Attainment | In Labor Force | Unemployed |
| Less than High School | 8 (36.4%) | 0 (0.0%) |
| High School Diploma | 111 (100.0%) | 0 (0.0%) |
| College / Associate Degree | 104 (59.1%) | 0 (0.0%) |
| Bachelor's Degree or higher | 95 (83.3%) | 0 (0.0%) |
| Total | 318 (75.2%) | 0 (0.0%) |
Employment Occupations by Sex in Solana
Management, Business, Science and Arts Occupations
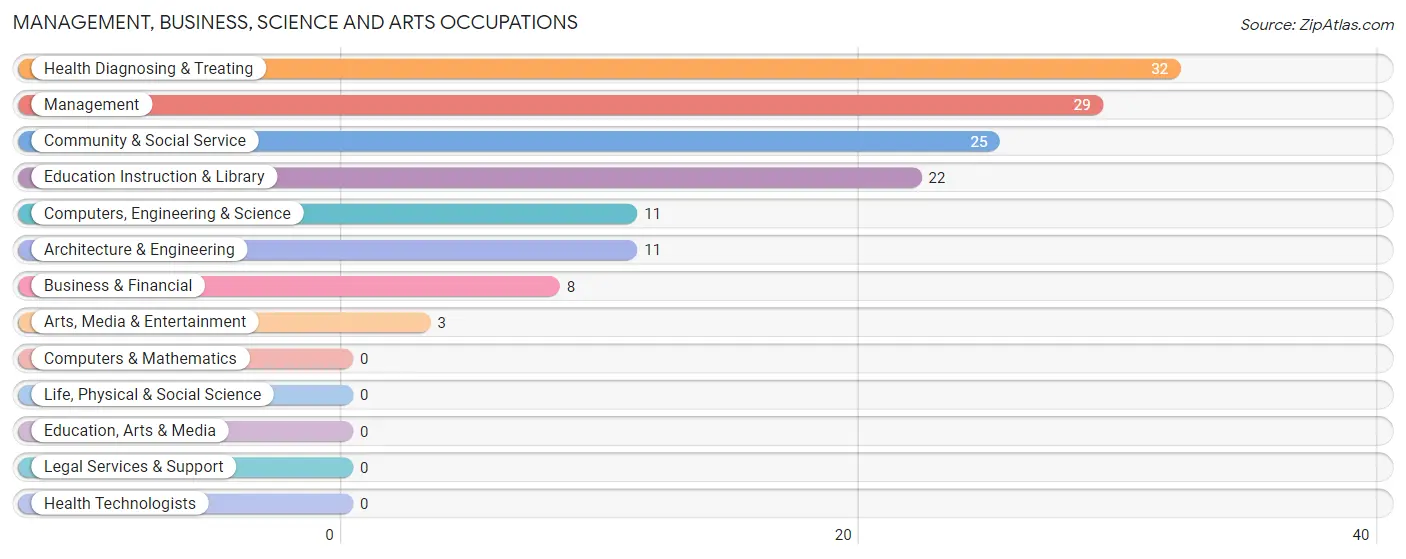
The most common Management, Business, Science and Arts occupations in Solana are Health Diagnosing & Treating (32 | 8.4%), Management (29 | 7.6%), Community & Social Service (25 | 6.6%), Education Instruction & Library (22 | 5.8%), and Computers, Engineering & Science (11 | 2.9%).
Management, Business, Science and Arts Occupations by Sex
Within the Management, Business, Science and Arts occupations in Solana, the most male-oriented occupations are Management (100.0%), Business & Financial (100.0%), and Computers, Engineering & Science (100.0%), while the most female-oriented occupations are Arts, Media & Entertainment (100.0%), Health Diagnosing & Treating (100.0%), and Community & Social Service (56.0%).
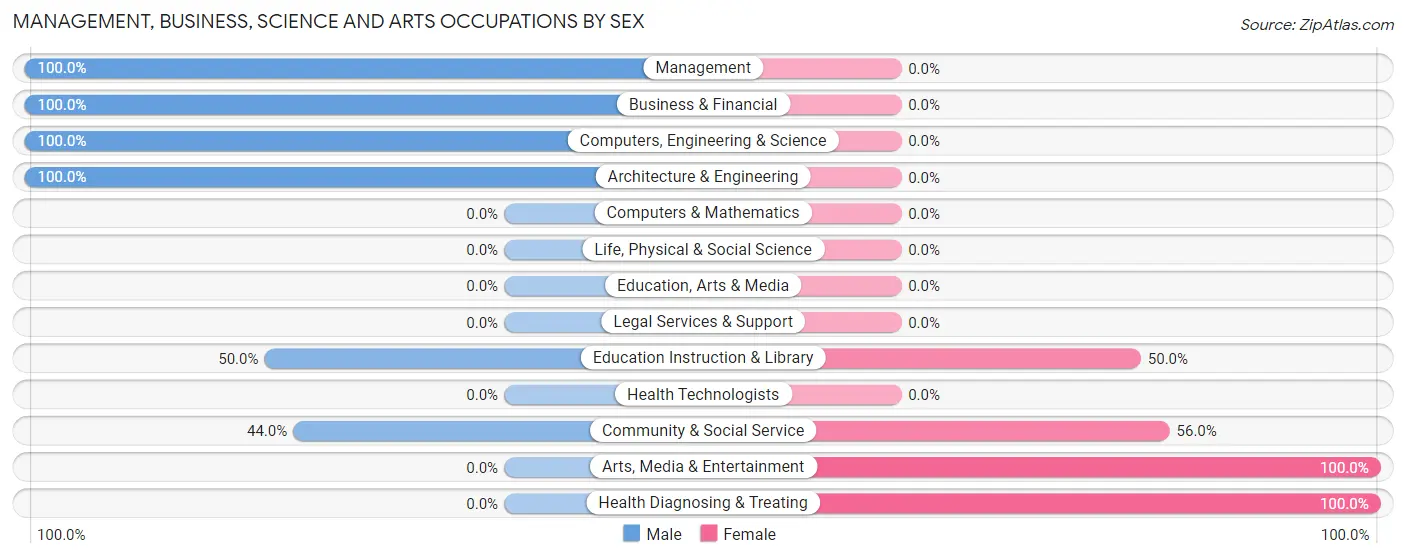
| Occupation | Male | Female |
| Management | 29 (100.0%) | 0 (0.0%) |
| Business & Financial | 8 (100.0%) | 0 (0.0%) |
| Computers, Engineering & Science | 11 (100.0%) | 0 (0.0%) |
| Computers & Mathematics | 0 (0.0%) | 0 (0.0%) |
| Architecture & Engineering | 11 (100.0%) | 0 (0.0%) |
| Life, Physical & Social Science | 0 (0.0%) | 0 (0.0%) |
| Community & Social Service | 11 (44.0%) | 14 (56.0%) |
| Education, Arts & Media | 0 (0.0%) | 0 (0.0%) |
| Legal Services & Support | 0 (0.0%) | 0 (0.0%) |
| Education Instruction & Library | 11 (50.0%) | 11 (50.0%) |
| Arts, Media & Entertainment | 0 (0.0%) | 3 (100.0%) |
| Health Diagnosing & Treating | 0 (0.0%) | 32 (100.0%) |
| Health Technologists | 0 (0.0%) | 0 (0.0%) |
| Total (Category) | 59 (56.2%) | 46 (43.8%) |
| Total (Overall) | 116 (30.6%) | 263 (69.4%) |
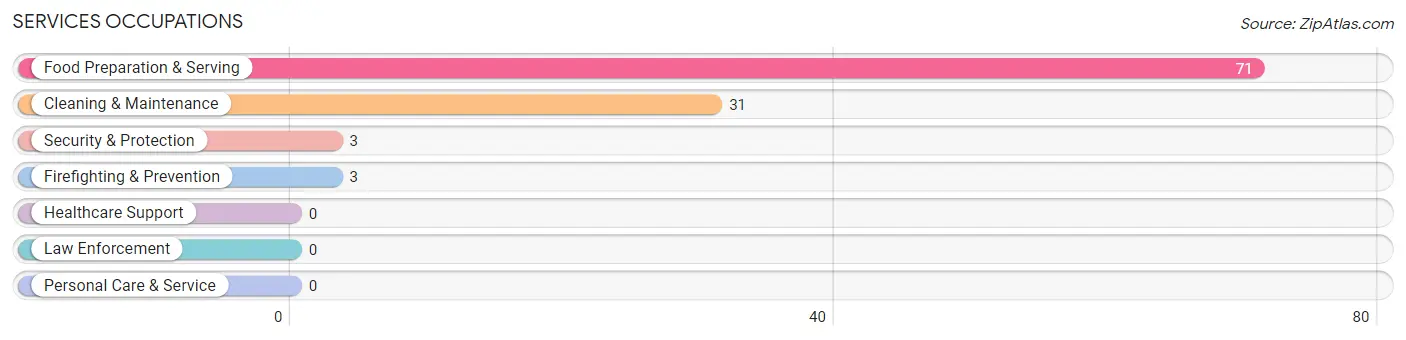
Services Occupations
The most common Services occupations in Solana are Food Preparation & Serving (71 | 18.7%), Cleaning & Maintenance (31 | 8.2%), Security & Protection (3 | 0.8%), and Firefighting & Prevention (3 | 0.8%).
Services Occupations by Sex
Within the Services occupations in Solana, the most male-oriented occupations are Security & Protection (100.0%), Firefighting & Prevention (100.0%), and Cleaning & Maintenance (71.0%), while the most female-oriented occupations are Food Preparation & Serving (100.0%), and Cleaning & Maintenance (29.0%).
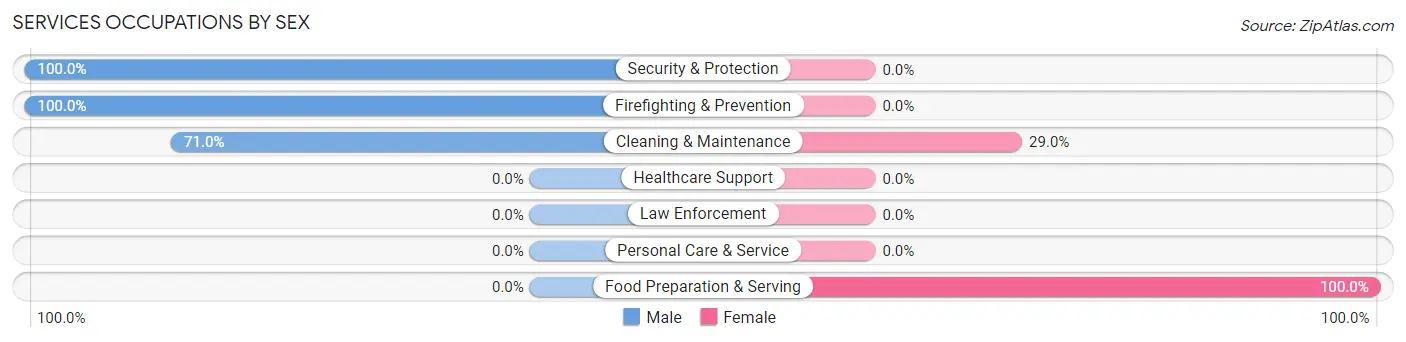
| Occupation | Male | Female |
| Healthcare Support | 0 (0.0%) | 0 (0.0%) |
| Security & Protection | 3 (100.0%) | 0 (0.0%) |
| Firefighting & Prevention | 3 (100.0%) | 0 (0.0%) |
| Law Enforcement | 0 (0.0%) | 0 (0.0%) |
| Food Preparation & Serving | 0 (0.0%) | 71 (100.0%) |
| Cleaning & Maintenance | 22 (71.0%) | 9 (29.0%) |
| Personal Care & Service | 0 (0.0%) | 0 (0.0%) |
| Total (Category) | 25 (23.8%) | 80 (76.2%) |
| Total (Overall) | 116 (30.6%) | 263 (69.4%) |
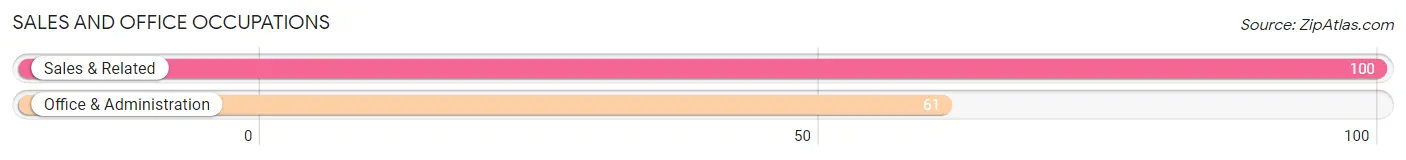
Sales and Office Occupations
The most common Sales and Office occupations in Solana are Sales & Related (100 | 26.4%), and Office & Administration (61 | 16.1%).
Sales and Office Occupations by Sex
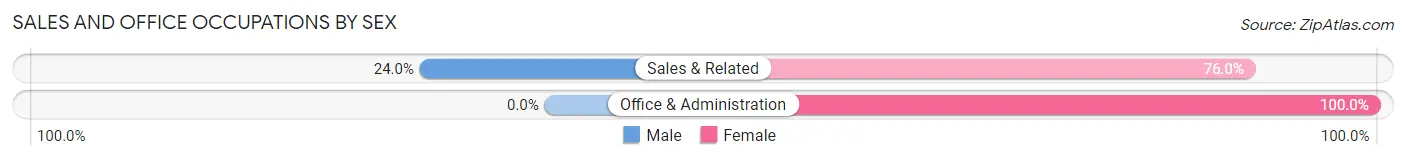
| Occupation | Male | Female |
| Sales & Related | 24 (24.0%) | 76 (76.0%) |
| Office & Administration | 0 (0.0%) | 61 (100.0%) |
| Total (Category) | 24 (14.9%) | 137 (85.1%) |
| Total (Overall) | 116 (30.6%) | 263 (69.4%) |
Natural Resources, Construction and Maintenance Occupations
Natural Resources, Construction and Maintenance Occupations by Sex
| Occupation | Male | Female |
| Farming, Fishing & Forestry | 0 (0.0%) | 0 (0.0%) |
| Construction & Extraction | 0 (0.0%) | 0 (0.0%) |
| Installation, Maintenance & Repair | 0 (0.0%) | 0 (0.0%) |
| Total (Category) | 0 (0.0%) | 0 (0.0%) |
| Total (Overall) | 116 (30.6%) | 263 (69.4%) |
Production, Transportation and Moving Occupations
The most common Production, Transportation and Moving occupations in Solana are , and Transportation (8 | 2.1%).
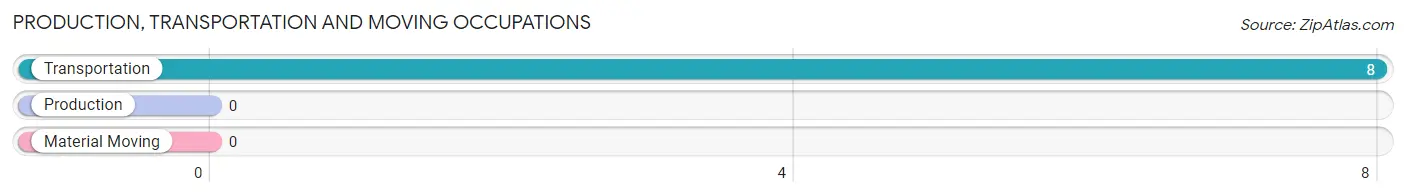
Production, Transportation and Moving Occupations by Sex
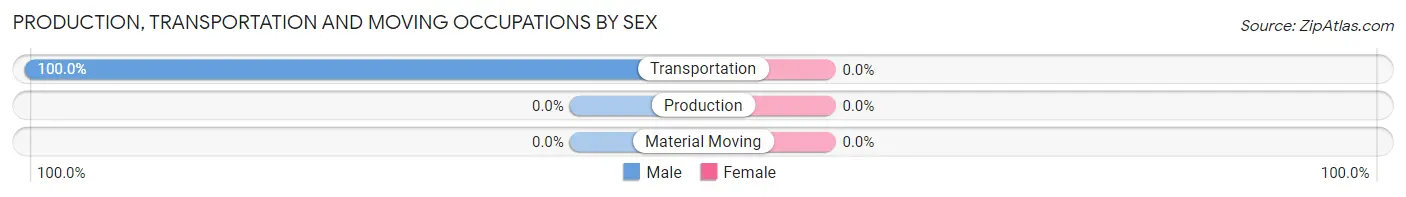
| Occupation | Male | Female |
| Production | 0 (0.0%) | 0 (0.0%) |
| Transportation | 8 (100.0%) | 0 (0.0%) |
| Material Moving | 0 (0.0%) | 0 (0.0%) |
| Total (Category) | 8 (100.0%) | 0 (0.0%) |
| Total (Overall) | 116 (30.6%) | 263 (69.4%) |
Employment Industries by Sex in Solana
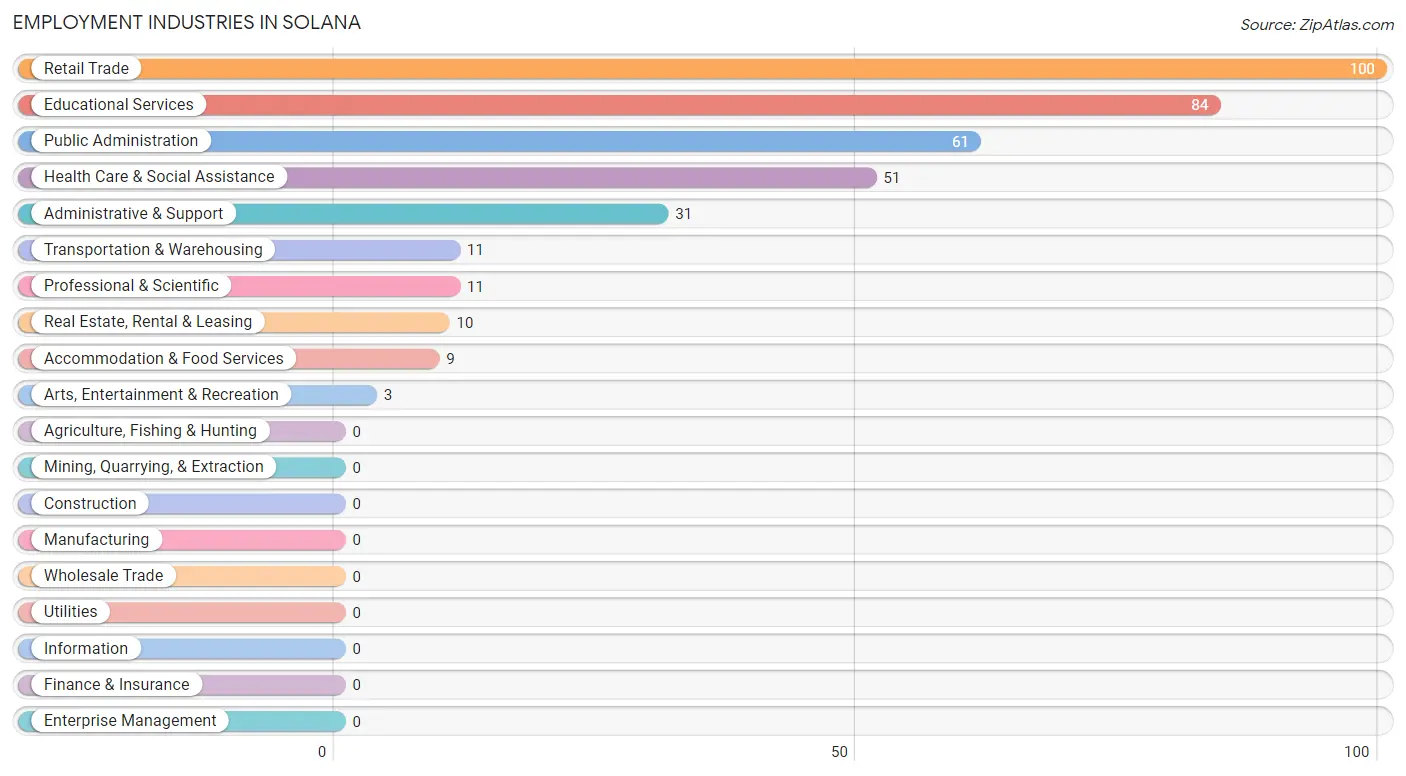
Employment Industries in Solana
The major employment industries in Solana include Retail Trade (100 | 26.4%), Educational Services (84 | 22.2%), Public Administration (61 | 16.1%), Health Care & Social Assistance (51 | 13.5%), and Administrative & Support (31 | 8.2%).
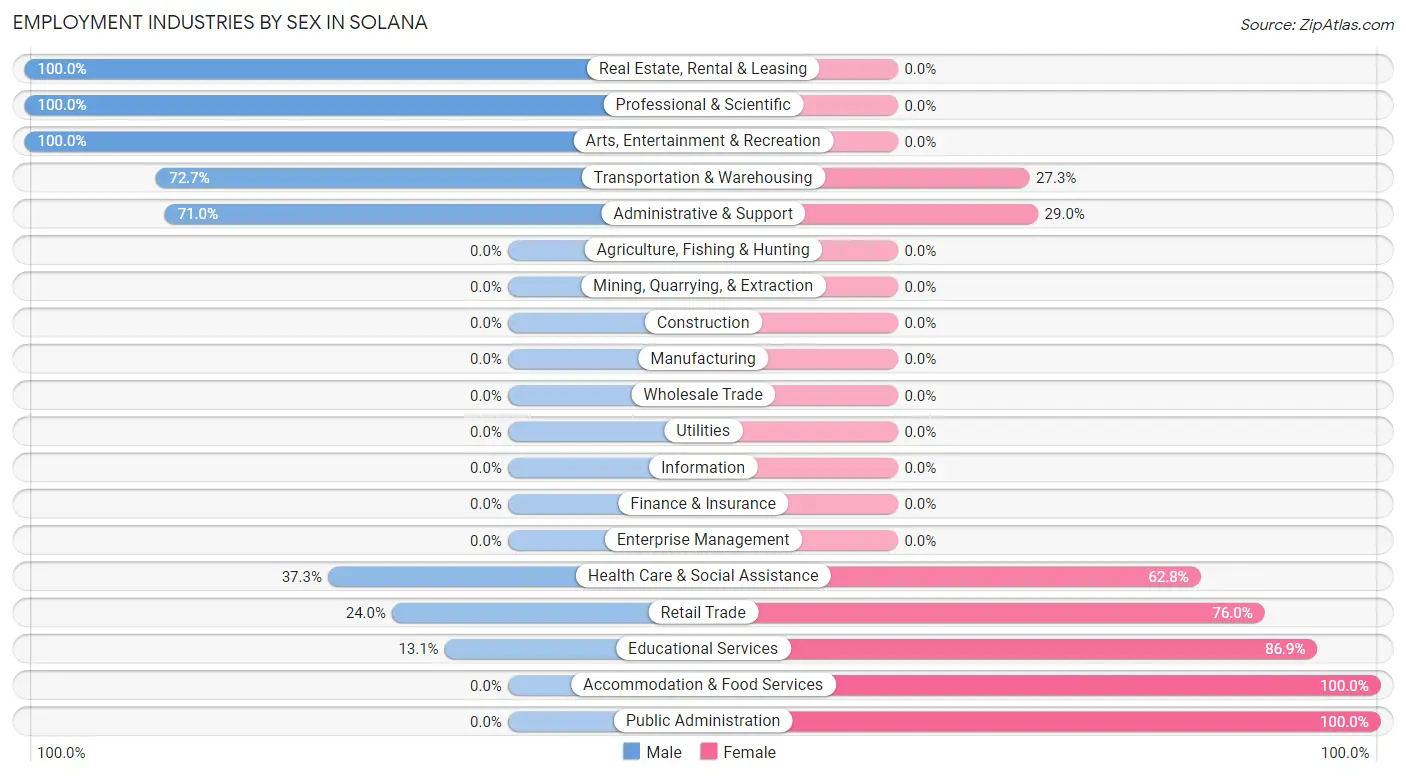
Employment Industries by Sex in Solana
The Solana industries that see more men than women are Real Estate, Rental & Leasing (100.0%), Professional & Scientific (100.0%), and Arts, Entertainment & Recreation (100.0%), whereas the industries that tend to have a higher number of women are Accommodation & Food Services (100.0%), Public Administration (100.0%), and Educational Services (86.9%).
| Industry | Male | Female |
| Agriculture, Fishing & Hunting | 0 (0.0%) | 0 (0.0%) |
| Mining, Quarrying, & Extraction | 0 (0.0%) | 0 (0.0%) |
| Construction | 0 (0.0%) | 0 (0.0%) |
| Manufacturing | 0 (0.0%) | 0 (0.0%) |
| Wholesale Trade | 0 (0.0%) | 0 (0.0%) |
| Retail Trade | 24 (24.0%) | 76 (76.0%) |
| Transportation & Warehousing | 8 (72.7%) | 3 (27.3%) |
| Utilities | 0 (0.0%) | 0 (0.0%) |
| Information | 0 (0.0%) | 0 (0.0%) |
| Finance & Insurance | 0 (0.0%) | 0 (0.0%) |
| Real Estate, Rental & Leasing | 10 (100.0%) | 0 (0.0%) |
| Professional & Scientific | 11 (100.0%) | 0 (0.0%) |
| Enterprise Management | 0 (0.0%) | 0 (0.0%) |
| Administrative & Support | 22 (71.0%) | 9 (29.0%) |
| Educational Services | 11 (13.1%) | 73 (86.9%) |
| Health Care & Social Assistance | 19 (37.2%) | 32 (62.7%) |
| Arts, Entertainment & Recreation | 3 (100.0%) | 0 (0.0%) |
| Accommodation & Food Services | 0 (0.0%) | 9 (100.0%) |
| Public Administration | 0 (0.0%) | 61 (100.0%) |
| Total | 116 (30.6%) | 263 (69.4%) |
Education in Solana
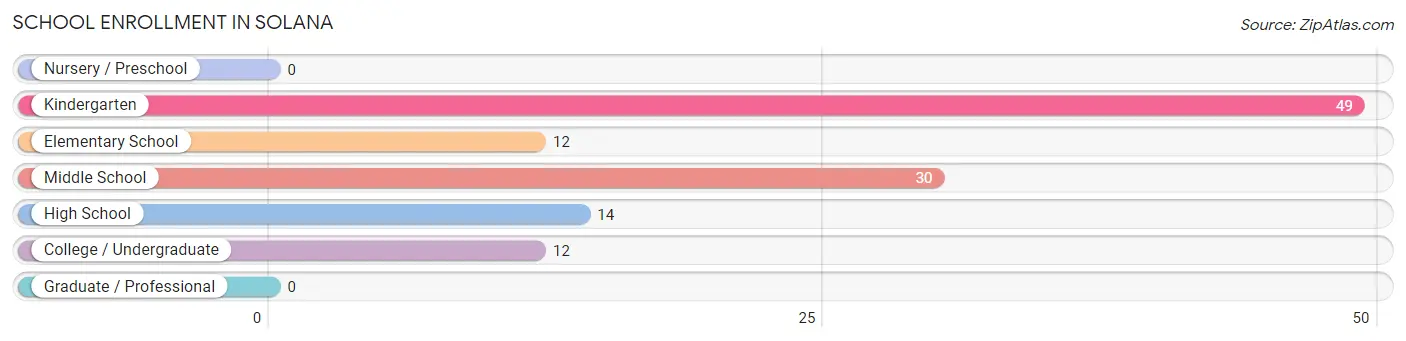
School Enrollment in Solana
The most common levels of schooling among the 117 students in Solana are kindergarten (49 | 41.9%), middle school (30 | 25.6%), and high school (14 | 12.0%).
| School Level | # Students | % Students |
| Nursery / Preschool | 0 | 0.0% |
| Kindergarten | 49 | 41.9% |
| Elementary School | 12 | 10.3% |
| Middle School | 30 | 25.6% |
| High School | 14 | 12.0% |
| College / Undergraduate | 12 | 10.3% |
| Graduate / Professional | 0 | 0.0% |
| Total | 117 | 100.0% |
School Enrollment by Age by Funding Source in Solana
Out of a total of 117 students who are enrolled in schools in Solana, 61 (52.1%) attend a private institution, while the remaining 56 (47.9%) are enrolled in public schools. The age group of 5 to 9 year old has the highest likelihood of being enrolled in private schools, with 49 (80.3% in the age bracket) enrolled. Conversely, the age group of 18 to 19 year olds has the lowest likelihood of being enrolled in a private school, with 14 (100.0% in the age bracket) attending a public institution.
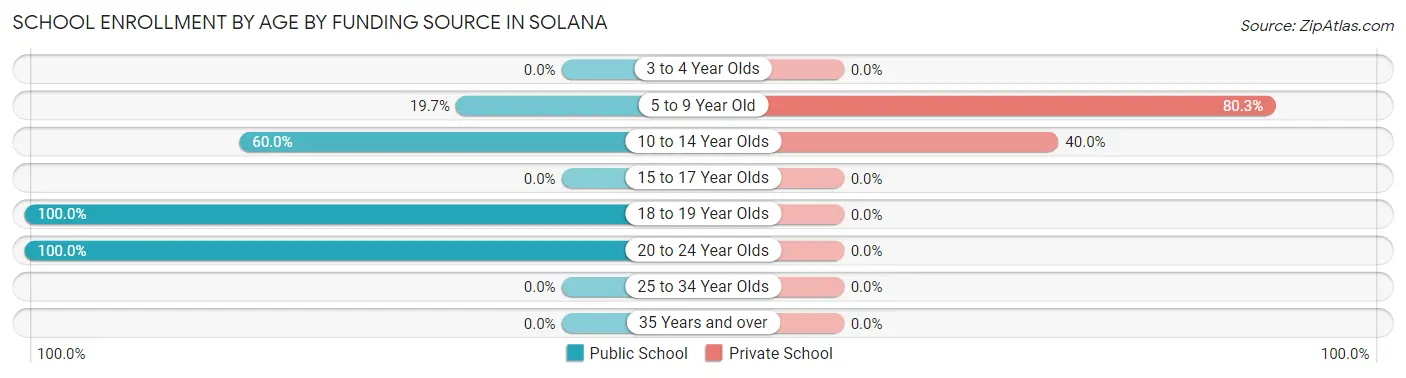
| Age Bracket | Public School | Private School |
| 3 to 4 Year Olds | 0 (0.0%) | 0 (0.0%) |
| 5 to 9 Year Old | 12 (19.7%) | 49 (80.3%) |
| 10 to 14 Year Olds | 18 (60.0%) | 12 (40.0%) |
| 15 to 17 Year Olds | 0 (0.0%) | 0 (0.0%) |
| 18 to 19 Year Olds | 14 (100.0%) | 0 (0.0%) |
| 20 to 24 Year Olds | 12 (100.0%) | 0 (0.0%) |
| 25 to 34 Year Olds | 0 (0.0%) | 0 (0.0%) |
| 35 Years and over | 0 (0.0%) | 0 (0.0%) |
| Total | 56 (47.9%) | 61 (52.1%) |
Educational Attainment by Field of Study in Solana
Physical & health sciences (54 | 37.0%), education (43 | 29.4%), engineering (19 | 13.0%), business (19 | 13.0%), and bio, nature & agricultural (11 | 7.5%) are the most common fields of study among 146 individuals in Solana who have obtained a bachelor's degree or higher.
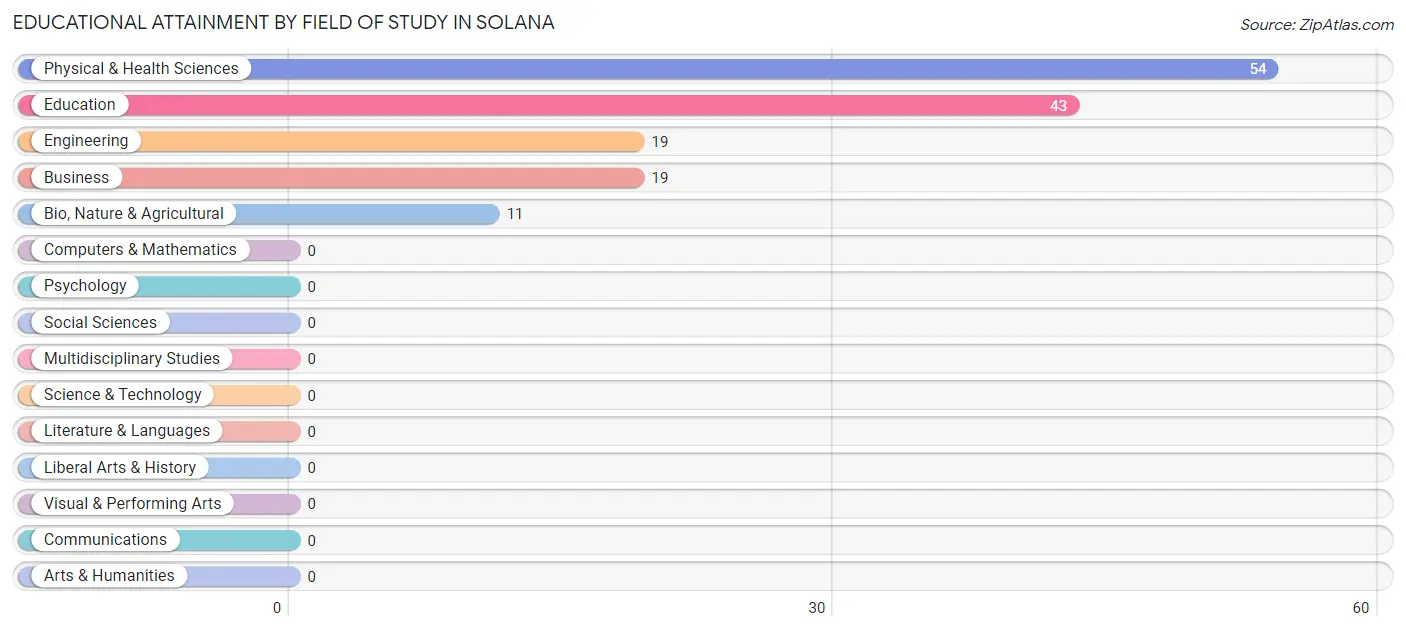
| Field of Study | # Graduates | % Graduates |
| Computers & Mathematics | 0 | 0.0% |
| Bio, Nature & Agricultural | 11 | 7.5% |
| Physical & Health Sciences | 54 | 37.0% |
| Psychology | 0 | 0.0% |
| Social Sciences | 0 | 0.0% |
| Engineering | 19 | 13.0% |
| Multidisciplinary Studies | 0 | 0.0% |
| Science & Technology | 0 | 0.0% |
| Business | 19 | 13.0% |
| Education | 43 | 29.4% |
| Literature & Languages | 0 | 0.0% |
| Liberal Arts & History | 0 | 0.0% |
| Visual & Performing Arts | 0 | 0.0% |
| Communications | 0 | 0.0% |
| Arts & Humanities | 0 | 0.0% |
| Total | 146 | 100.0% |
Transportation & Commute in Solana
Vehicle Availability by Sex in Solana
The most prevalent vehicle ownership categories in Solana are males with 3 vehicles (54, accounting for 46.6%) and females with 3 vehicles (9, making up 20.5%).
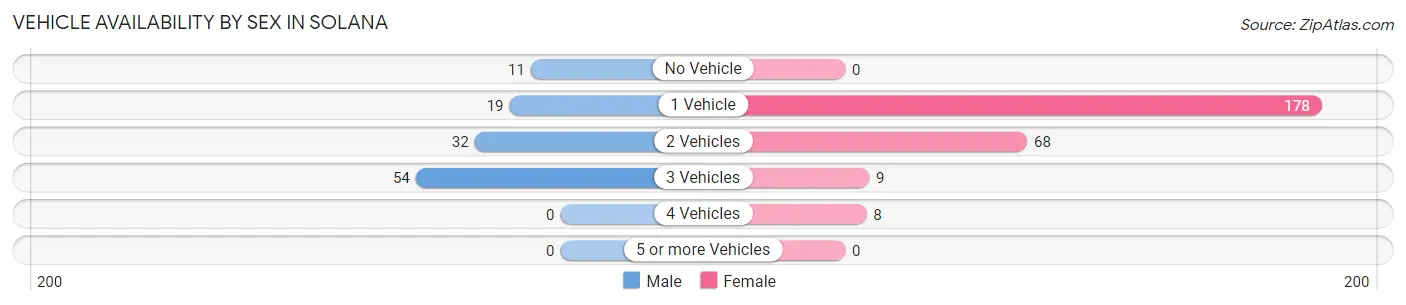
| Vehicles Available | Male | Female |
| No Vehicle | 11 (9.5%) | 0 (0.0%) |
| 1 Vehicle | 19 (16.4%) | 178 (67.7%) |
| 2 Vehicles | 32 (27.6%) | 68 (25.9%) |
| 3 Vehicles | 54 (46.6%) | 9 (3.4%) |
| 4 Vehicles | 0 (0.0%) | 8 (3.0%) |
| 5 or more Vehicles | 0 (0.0%) | 0 (0.0%) |
| Total | 116 (100.0%) | 263 (100.0%) |
Commute Time in Solana
The most frequently occuring commute durations in Solana are 10 to 14 minutes (108 commuters, 31.0%), 45 to 59 minutes (65 commuters, 18.7%), and less than 5 minutes (54 commuters, 15.5%).
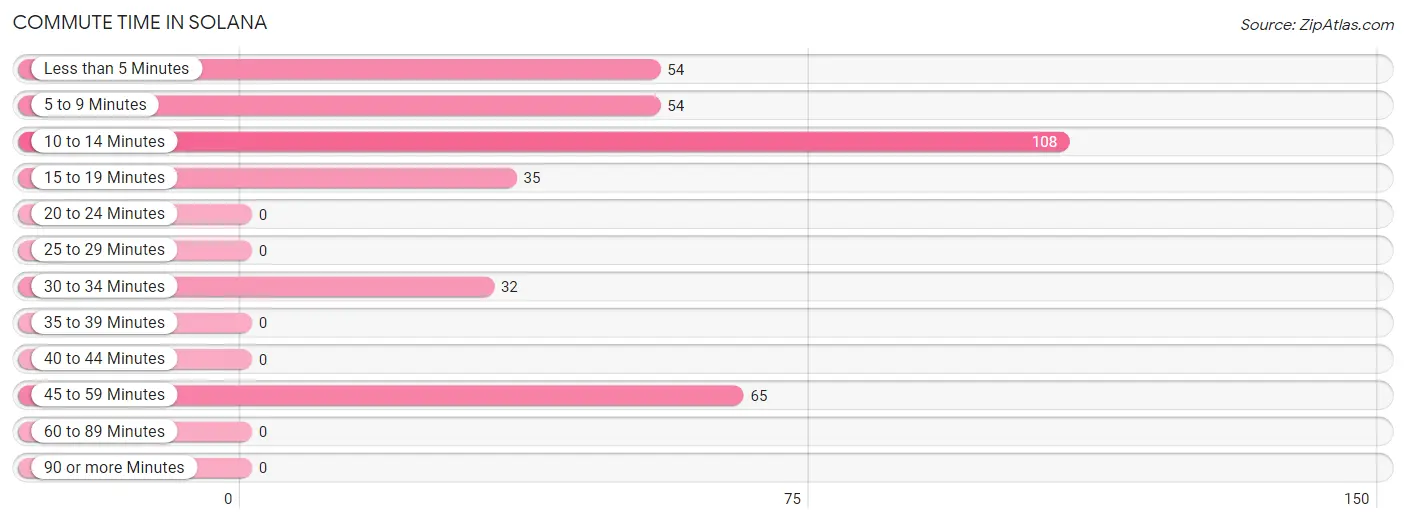
| Commute Time | # Commuters | % Commuters |
| Less than 5 Minutes | 54 | 15.5% |
| 5 to 9 Minutes | 54 | 15.5% |
| 10 to 14 Minutes | 108 | 31.0% |
| 15 to 19 Minutes | 35 | 10.1% |
| 20 to 24 Minutes | 0 | 0.0% |
| 25 to 29 Minutes | 0 | 0.0% |
| 30 to 34 Minutes | 32 | 9.2% |
| 35 to 39 Minutes | 0 | 0.0% |
| 40 to 44 Minutes | 0 | 0.0% |
| 45 to 59 Minutes | 65 | 18.7% |
| 60 to 89 Minutes | 0 | 0.0% |
| 90 or more Minutes | 0 | 0.0% |
Commute Time by Sex in Solana
The most common commute times in Solana are 5 to 9 minutes (43 commuters, 45.7%) for males and 10 to 14 minutes (92 commuters, 36.2%) for females.
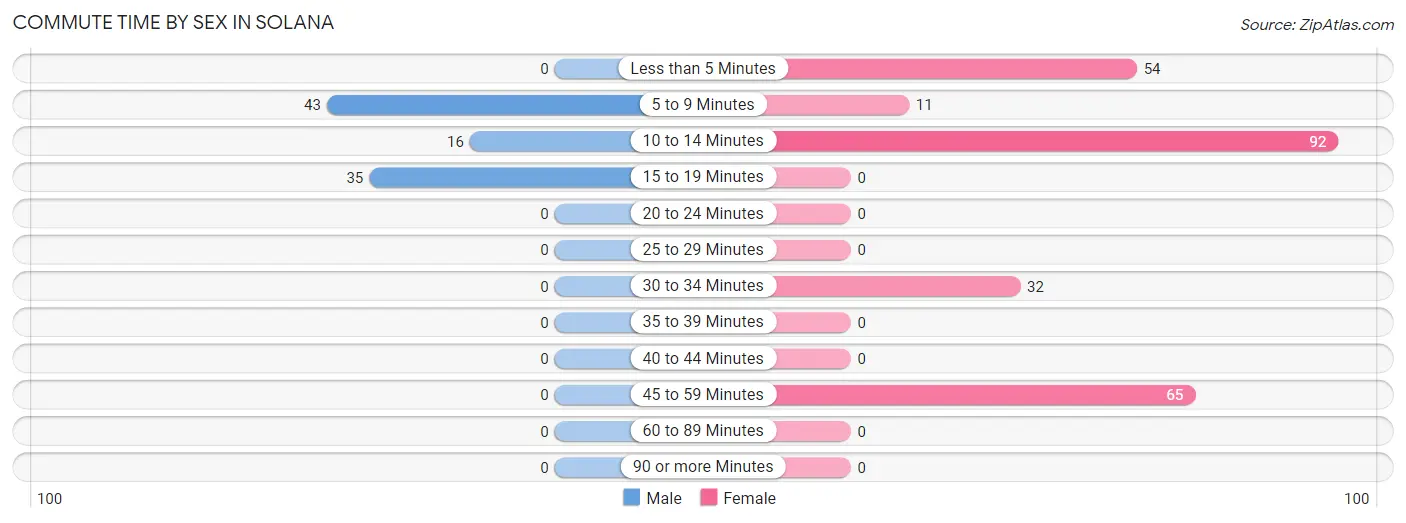
| Commute Time | Male | Female |
| Less than 5 Minutes | 0 (0.0%) | 54 (21.3%) |
| 5 to 9 Minutes | 43 (45.7%) | 11 (4.3%) |
| 10 to 14 Minutes | 16 (17.0%) | 92 (36.2%) |
| 15 to 19 Minutes | 35 (37.2%) | 0 (0.0%) |
| 20 to 24 Minutes | 0 (0.0%) | 0 (0.0%) |
| 25 to 29 Minutes | 0 (0.0%) | 0 (0.0%) |
| 30 to 34 Minutes | 0 (0.0%) | 32 (12.6%) |
| 35 to 39 Minutes | 0 (0.0%) | 0 (0.0%) |
| 40 to 44 Minutes | 0 (0.0%) | 0 (0.0%) |
| 45 to 59 Minutes | 0 (0.0%) | 65 (25.6%) |
| 60 to 89 Minutes | 0 (0.0%) | 0 (0.0%) |
| 90 or more Minutes | 0 (0.0%) | 0 (0.0%) |
Time of Departure to Work by Sex in Solana
The most frequent times of departure to work in Solana are 10:00 AM to 10:59 AM (24, 25.5%) for males and 6:30 AM to 6:59 AM (106, 41.7%) for females.
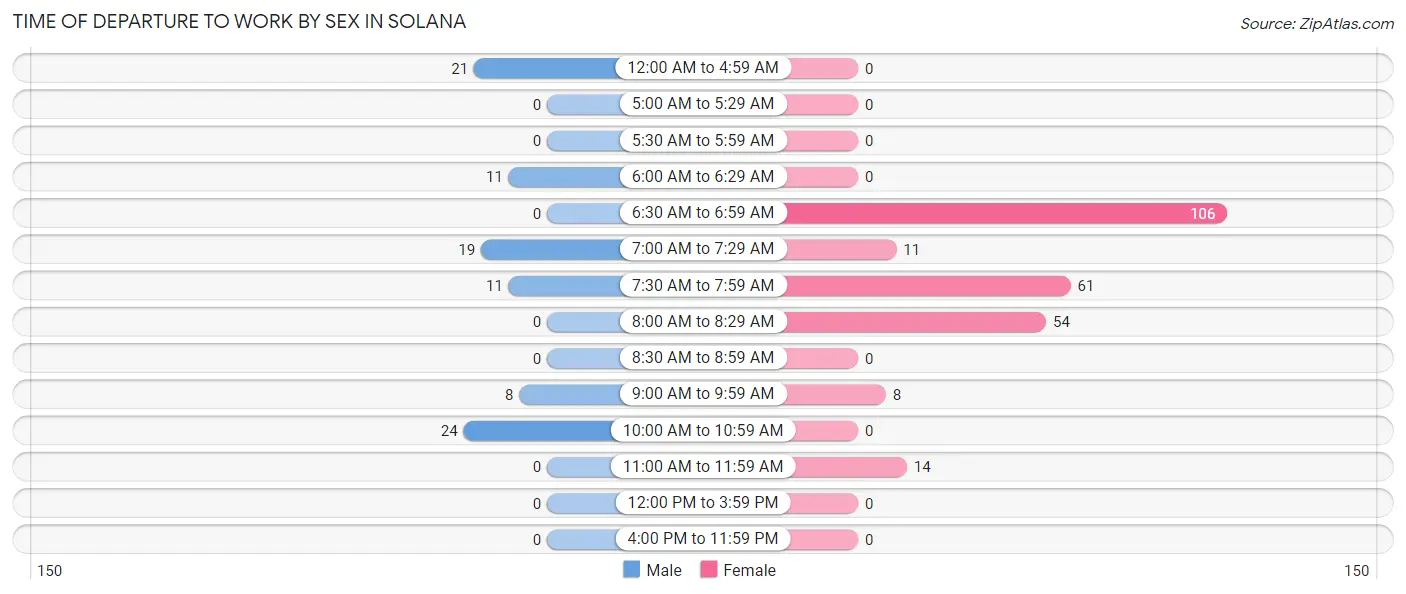
| Time of Departure | Male | Female |
| 12:00 AM to 4:59 AM | 21 (22.3%) | 0 (0.0%) |
| 5:00 AM to 5:29 AM | 0 (0.0%) | 0 (0.0%) |
| 5:30 AM to 5:59 AM | 0 (0.0%) | 0 (0.0%) |
| 6:00 AM to 6:29 AM | 11 (11.7%) | 0 (0.0%) |
| 6:30 AM to 6:59 AM | 0 (0.0%) | 106 (41.7%) |
| 7:00 AM to 7:29 AM | 19 (20.2%) | 11 (4.3%) |
| 7:30 AM to 7:59 AM | 11 (11.7%) | 61 (24.0%) |
| 8:00 AM to 8:29 AM | 0 (0.0%) | 54 (21.3%) |
| 8:30 AM to 8:59 AM | 0 (0.0%) | 0 (0.0%) |
| 9:00 AM to 9:59 AM | 8 (8.5%) | 8 (3.2%) |
| 10:00 AM to 10:59 AM | 24 (25.5%) | 0 (0.0%) |
| 11:00 AM to 11:59 AM | 0 (0.0%) | 14 (5.5%) |
| 12:00 PM to 3:59 PM | 0 (0.0%) | 0 (0.0%) |
| 4:00 PM to 11:59 PM | 0 (0.0%) | 0 (0.0%) |
| Total | 94 (100.0%) | 254 (100.0%) |
Housing Occupancy in Solana
Occupancy by Ownership in Solana
Of the total 404 dwellings in Solana, owner-occupied units account for 294 (72.8%), while renter-occupied units make up 110 (27.2%).
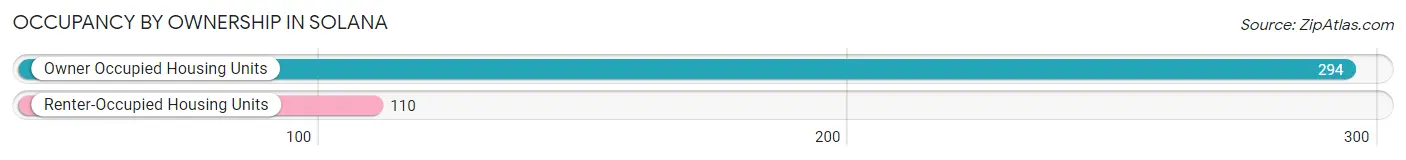
| Occupancy | # Housing Units | % Housing Units |
| Owner Occupied Housing Units | 294 | 72.8% |
| Renter-Occupied Housing Units | 110 | 27.2% |
| Total Occupied Housing Units | 404 | 100.0% |
Occupancy by Household Size in Solana
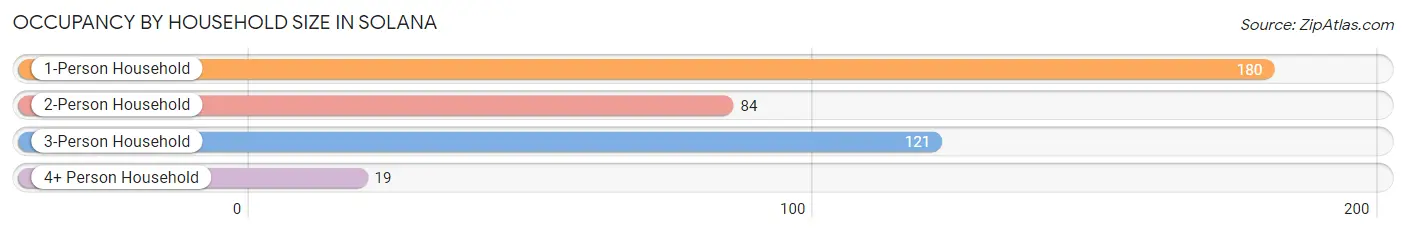
| Household Size | # Housing Units | % Housing Units |
| 1-Person Household | 180 | 44.6% |
| 2-Person Household | 84 | 20.8% |
| 3-Person Household | 121 | 29.9% |
| 4+ Person Household | 19 | 4.7% |
| Total Housing Units | 404 | 100.0% |
Occupancy by Ownership by Household Size in Solana
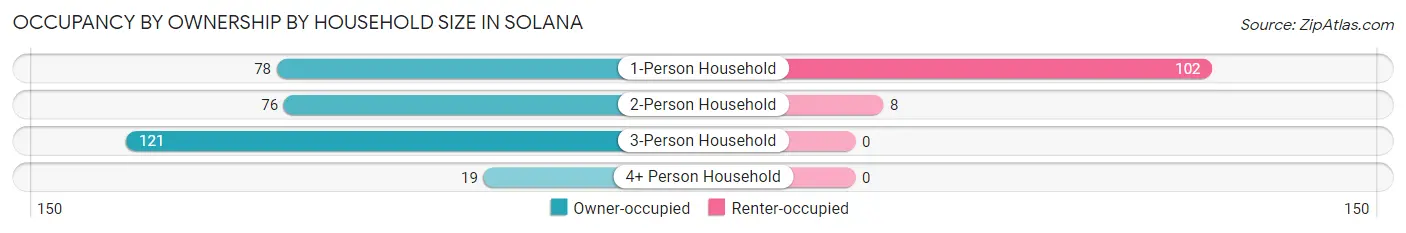
| Household Size | Owner-occupied | Renter-occupied |
| 1-Person Household | 78 (43.3%) | 102 (56.7%) |
| 2-Person Household | 76 (90.5%) | 8 (9.5%) |
| 3-Person Household | 121 (100.0%) | 0 (0.0%) |
| 4+ Person Household | 19 (100.0%) | 0 (0.0%) |
| Total Housing Units | 294 (72.8%) | 110 (27.2%) |
Occupancy by Educational Attainment in Solana
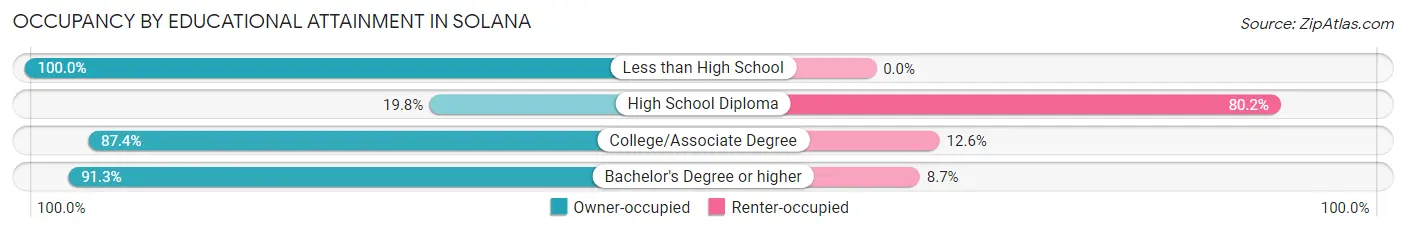
| Household Size | Owner-occupied | Renter-occupied |
| Less than High School | 33 (100.0%) | 0 (0.0%) |
| High School Diploma | 20 (19.8%) | 81 (80.2%) |
| College/Associate Degree | 125 (87.4%) | 18 (12.6%) |
| Bachelor's Degree or higher | 116 (91.3%) | 11 (8.7%) |
Occupancy by Age of Householder in Solana
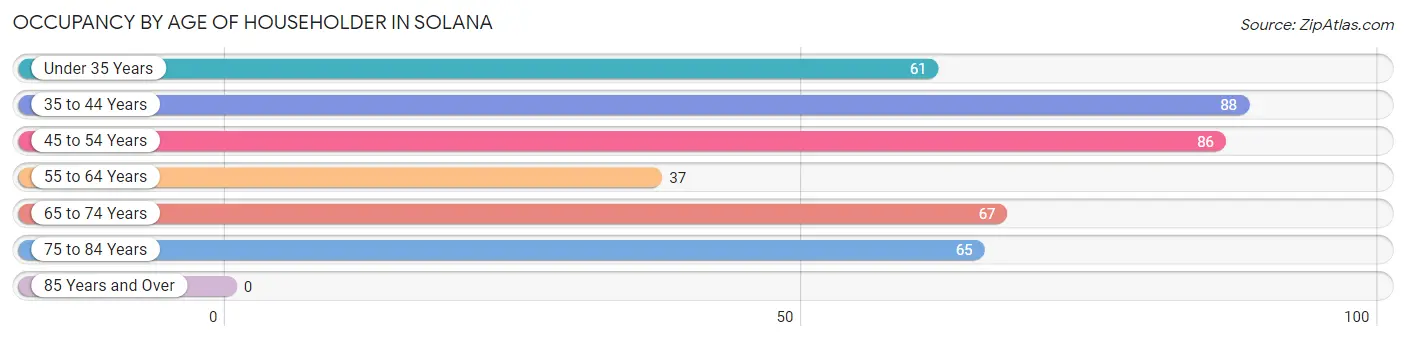
| Age Bracket | # Households | % Households |
| Under 35 Years | 61 | 15.1% |
| 35 to 44 Years | 88 | 21.8% |
| 45 to 54 Years | 86 | 21.3% |
| 55 to 64 Years | 37 | 9.2% |
| 65 to 74 Years | 67 | 16.6% |
| 75 to 84 Years | 65 | 16.1% |
| 85 Years and Over | 0 | 0.0% |
| Total | 404 | 100.0% |
Housing Finances in Solana
Median Income by Occupancy in Solana
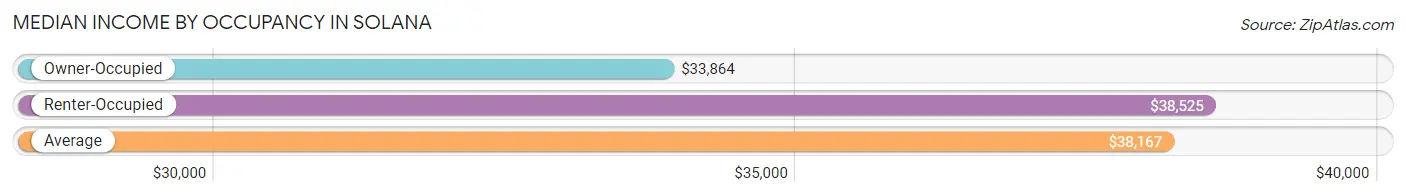
| Occupancy Type | # Households | Median Income |
| Owner-Occupied | 294 (72.8%) | $33,864 |
| Renter-Occupied | 110 (27.2%) | $38,525 |
| Average | 404 (100.0%) | $38,167 |
Occupancy by Householder Income Bracket in Solana
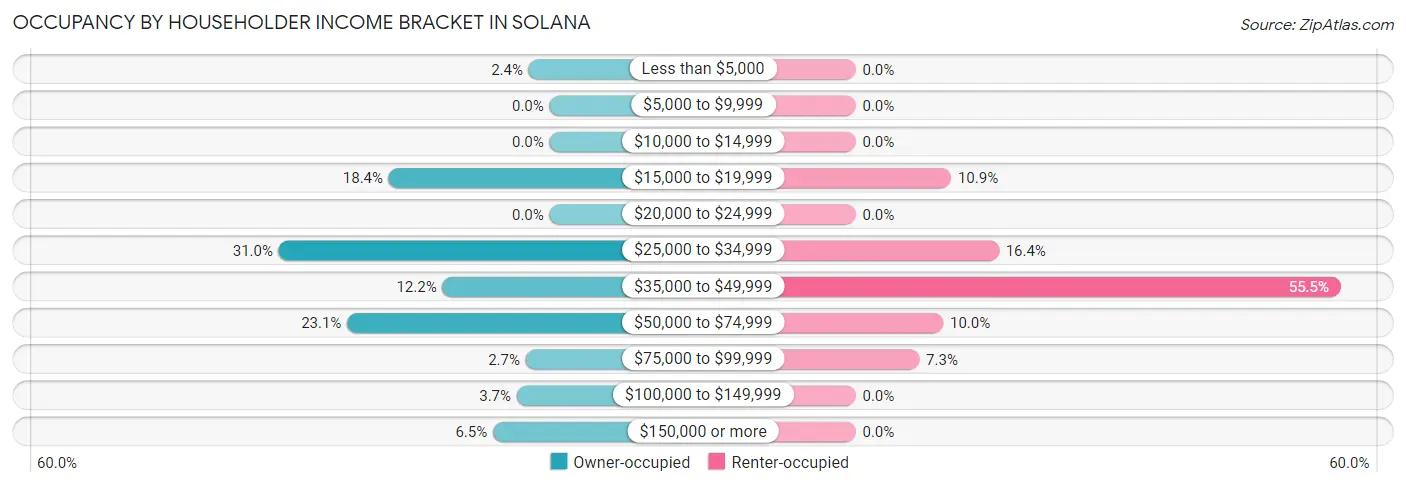
| Income Bracket | Owner-occupied | Renter-occupied |
| Less than $5,000 | 7 (2.4%) | 0 (0.0%) |
| $5,000 to $9,999 | 0 (0.0%) | 0 (0.0%) |
| $10,000 to $14,999 | 0 (0.0%) | 0 (0.0%) |
| $15,000 to $19,999 | 54 (18.4%) | 12 (10.9%) |
| $20,000 to $24,999 | 0 (0.0%) | 0 (0.0%) |
| $25,000 to $34,999 | 91 (30.9%) | 18 (16.4%) |
| $35,000 to $49,999 | 36 (12.2%) | 61 (55.4%) |
| $50,000 to $74,999 | 68 (23.1%) | 11 (10.0%) |
| $75,000 to $99,999 | 8 (2.7%) | 8 (7.3%) |
| $100,000 to $149,999 | 11 (3.7%) | 0 (0.0%) |
| $150,000 or more | 19 (6.5%) | 0 (0.0%) |
| Total | 294 (100.0%) | 110 (100.0%) |
Monthly Housing Cost Tiers in Solana
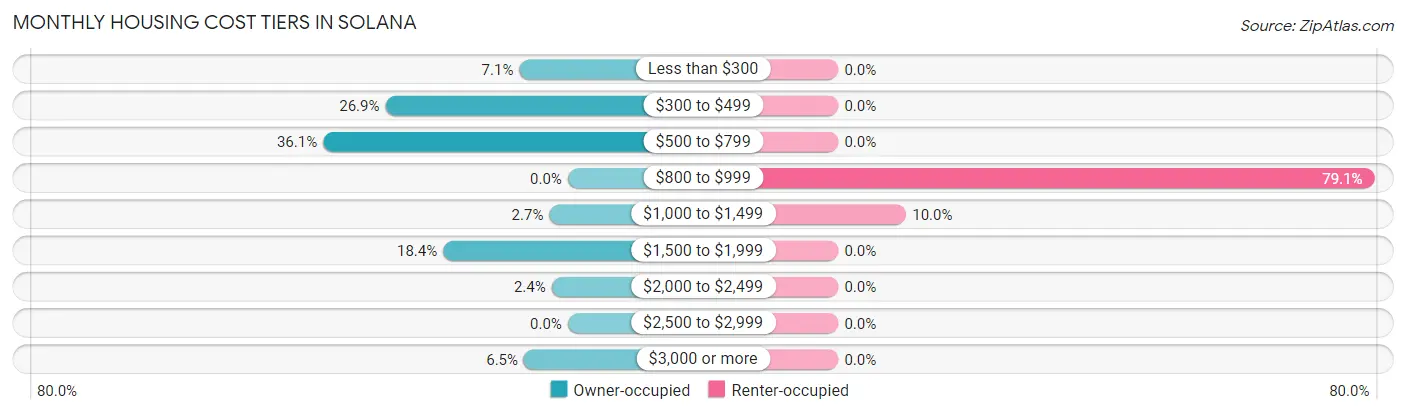
| Monthly Cost | Owner-occupied | Renter-occupied |
| Less than $300 | 21 (7.1%) | 0 (0.0%) |
| $300 to $499 | 79 (26.9%) | 0 (0.0%) |
| $500 to $799 | 106 (36.0%) | 0 (0.0%) |
| $800 to $999 | 0 (0.0%) | 87 (79.1%) |
| $1,000 to $1,499 | 8 (2.7%) | 11 (10.0%) |
| $1,500 to $1,999 | 54 (18.4%) | 0 (0.0%) |
| $2,000 to $2,499 | 7 (2.4%) | 0 (0.0%) |
| $2,500 to $2,999 | 0 (0.0%) | 0 (0.0%) |
| $3,000 or more | 19 (6.5%) | 0 (0.0%) |
| Total | 294 (100.0%) | 110 (100.0%) |
Physical Housing Characteristics in Solana
Housing Structures in Solana
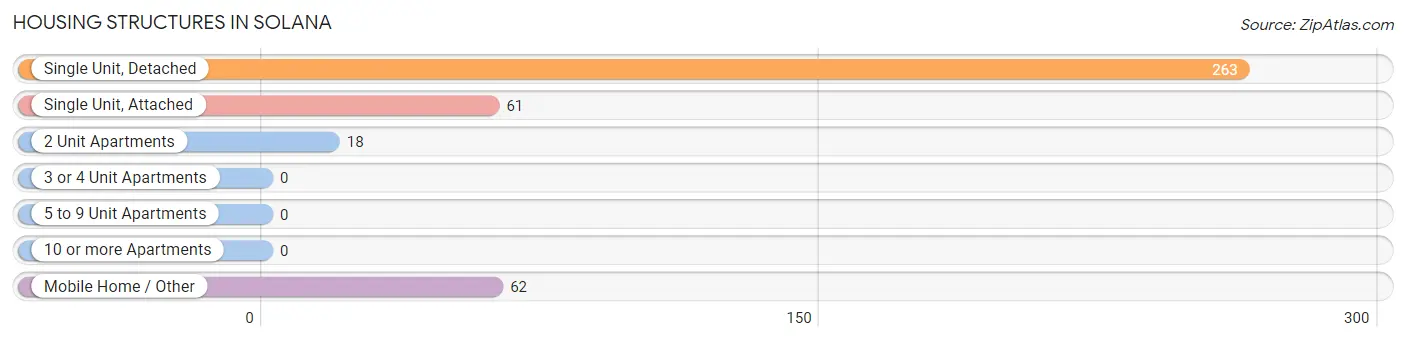
| Structure Type | # Housing Units | % Housing Units |
| Single Unit, Detached | 263 | 65.1% |
| Single Unit, Attached | 61 | 15.1% |
| 2 Unit Apartments | 18 | 4.5% |
| 3 or 4 Unit Apartments | 0 | 0.0% |
| 5 to 9 Unit Apartments | 0 | 0.0% |
| 10 or more Apartments | 0 | 0.0% |
| Mobile Home / Other | 62 | 15.3% |
| Total | 404 | 100.0% |
Housing Structures by Occupancy in Solana
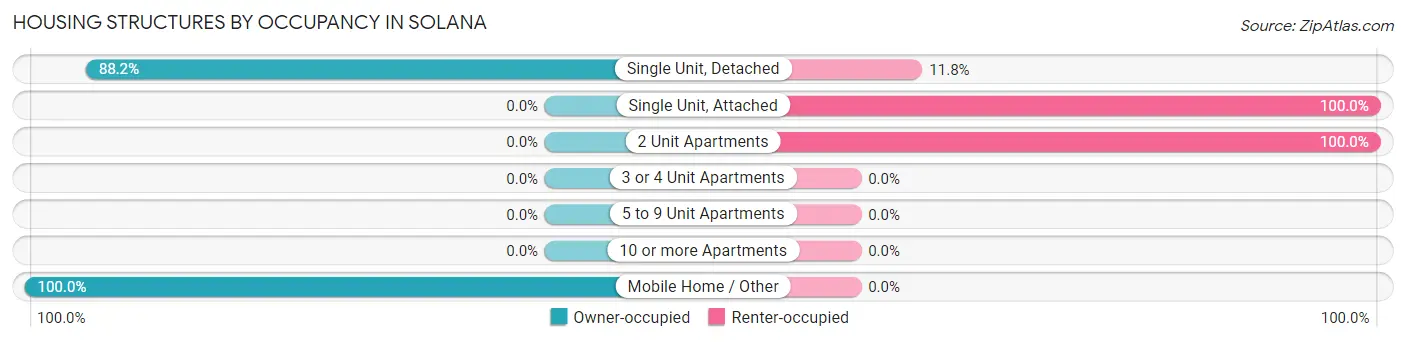
| Structure Type | Owner-occupied | Renter-occupied |
| Single Unit, Detached | 232 (88.2%) | 31 (11.8%) |
| Single Unit, Attached | 0 (0.0%) | 61 (100.0%) |
| 2 Unit Apartments | 0 (0.0%) | 18 (100.0%) |
| 3 or 4 Unit Apartments | 0 (0.0%) | 0 (0.0%) |
| 5 to 9 Unit Apartments | 0 (0.0%) | 0 (0.0%) |
| 10 or more Apartments | 0 (0.0%) | 0 (0.0%) |
| Mobile Home / Other | 62 (100.0%) | 0 (0.0%) |
| Total | 294 (72.8%) | 110 (27.2%) |
Housing Structures by Number of Rooms in Solana
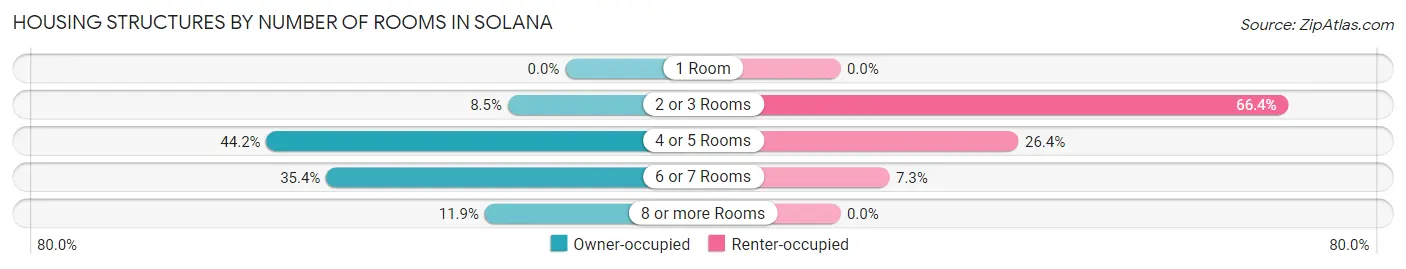
| Number of Rooms | Owner-occupied | Renter-occupied |
| 1 Room | 0 (0.0%) | 0 (0.0%) |
| 2 or 3 Rooms | 25 (8.5%) | 73 (66.4%) |
| 4 or 5 Rooms | 130 (44.2%) | 29 (26.4%) |
| 6 or 7 Rooms | 104 (35.4%) | 8 (7.3%) |
| 8 or more Rooms | 35 (11.9%) | 0 (0.0%) |
| Total | 294 (100.0%) | 110 (100.0%) |
Housing Structure by Heating Type in Solana
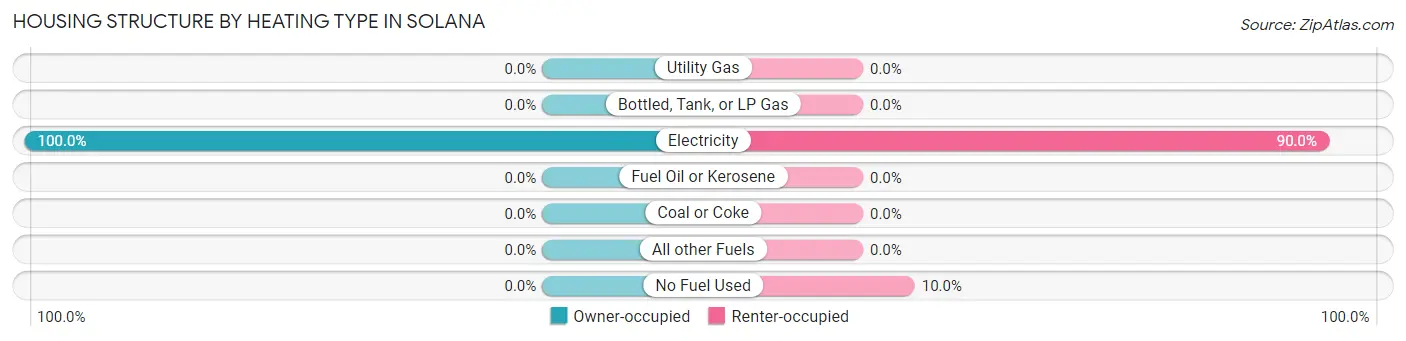
| Heating Type | Owner-occupied | Renter-occupied |
| Utility Gas | 0 (0.0%) | 0 (0.0%) |
| Bottled, Tank, or LP Gas | 0 (0.0%) | 0 (0.0%) |
| Electricity | 294 (100.0%) | 99 (90.0%) |
| Fuel Oil or Kerosene | 0 (0.0%) | 0 (0.0%) |
| Coal or Coke | 0 (0.0%) | 0 (0.0%) |
| All other Fuels | 0 (0.0%) | 0 (0.0%) |
| No Fuel Used | 0 (0.0%) | 11 (10.0%) |
| Total | 294 (100.0%) | 110 (100.0%) |
Household Vehicle Usage in Solana
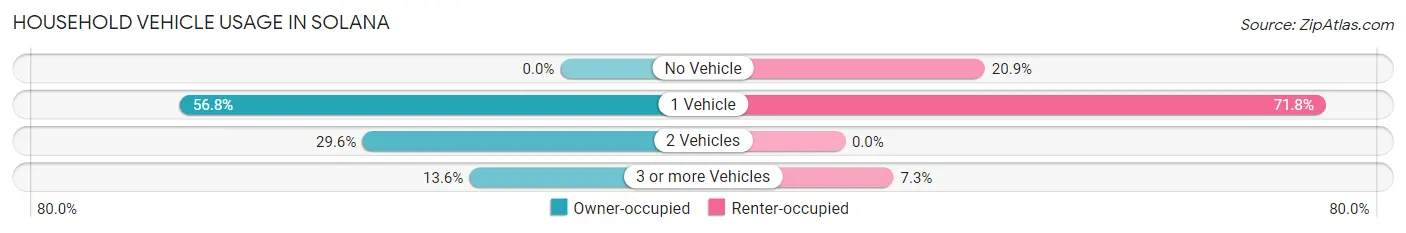
| Vehicles per Household | Owner-occupied | Renter-occupied |
| No Vehicle | 0 (0.0%) | 23 (20.9%) |
| 1 Vehicle | 167 (56.8%) | 79 (71.8%) |
| 2 Vehicles | 87 (29.6%) | 0 (0.0%) |
| 3 or more Vehicles | 40 (13.6%) | 8 (7.3%) |
| Total | 294 (100.0%) | 110 (100.0%) |
Real Estate & Mortgages in Solana
Real Estate and Mortgage Overview in Solana
| Characteristic | Without Mortgage | With Mortgage |
| Housing Units | 181 | 113 |
| Median Property Value | $177,000 | $138,300 |
| Median Household Income | $39,375 | $19 |
| Monthly Housing Costs | $488 | $19 |
| Real Estate Taxes | - | - |
Property Value by Mortgage Status in Solana
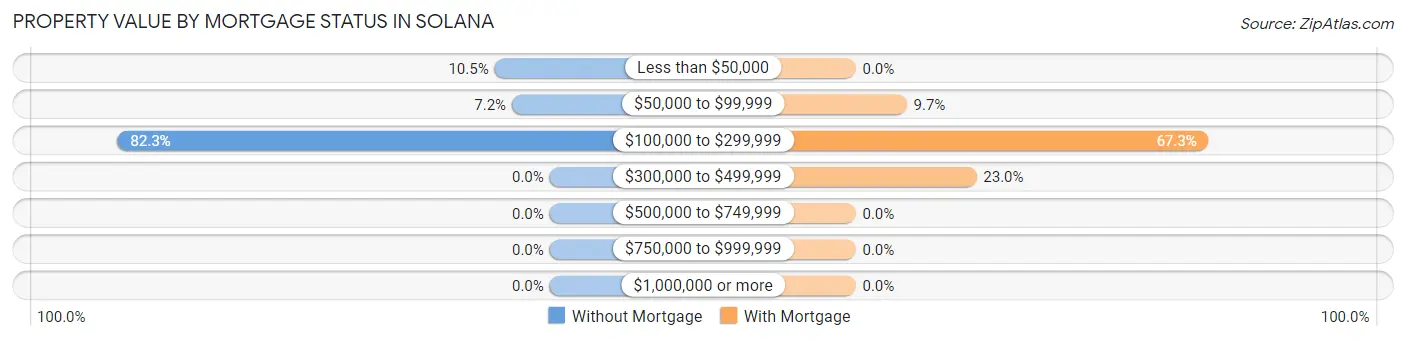
| Property Value | Without Mortgage | With Mortgage |
| Less than $50,000 | 19 (10.5%) | 0 (0.0%) |
| $50,000 to $99,999 | 13 (7.2%) | 11 (9.7%) |
| $100,000 to $299,999 | 149 (82.3%) | 76 (67.3%) |
| $300,000 to $499,999 | 0 (0.0%) | 26 (23.0%) |
| $500,000 to $749,999 | 0 (0.0%) | 0 (0.0%) |
| $750,000 to $999,999 | 0 (0.0%) | 0 (0.0%) |
| $1,000,000 or more | 0 (0.0%) | 0 (0.0%) |
| Total | 181 (100.0%) | 113 (100.0%) |
Household Income by Mortgage Status in Solana
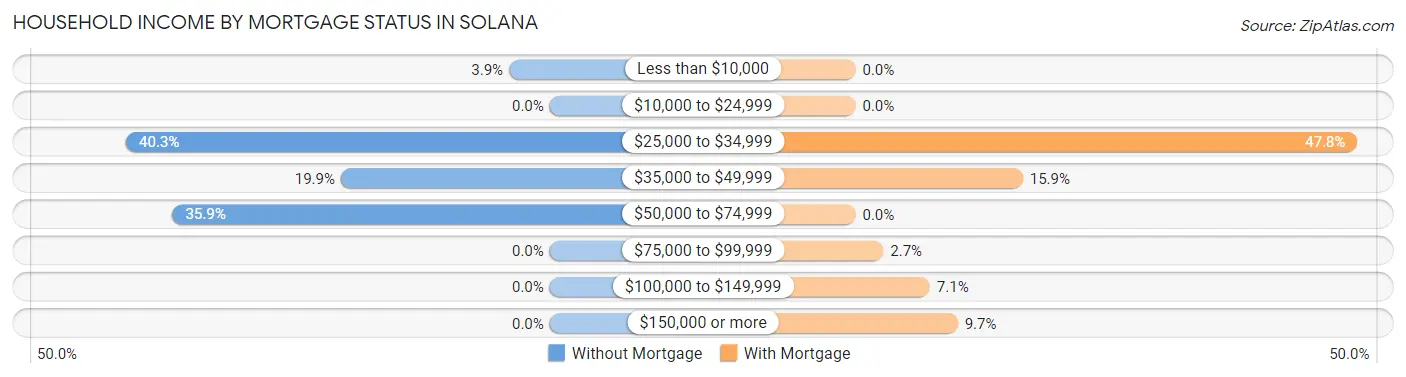
| Household Income | Without Mortgage | With Mortgage |
| Less than $10,000 | 7 (3.9%) | 0 (0.0%) |
| $10,000 to $24,999 | 0 (0.0%) | 0 (0.0%) |
| $25,000 to $34,999 | 73 (40.3%) | 54 (47.8%) |
| $35,000 to $49,999 | 36 (19.9%) | 18 (15.9%) |
| $50,000 to $74,999 | 65 (35.9%) | 0 (0.0%) |
| $75,000 to $99,999 | 0 (0.0%) | 3 (2.6%) |
| $100,000 to $149,999 | 0 (0.0%) | 8 (7.1%) |
| $150,000 or more | 0 (0.0%) | 11 (9.7%) |
| Total | 181 (100.0%) | 113 (100.0%) |
Property Value to Household Income Ratio in Solana
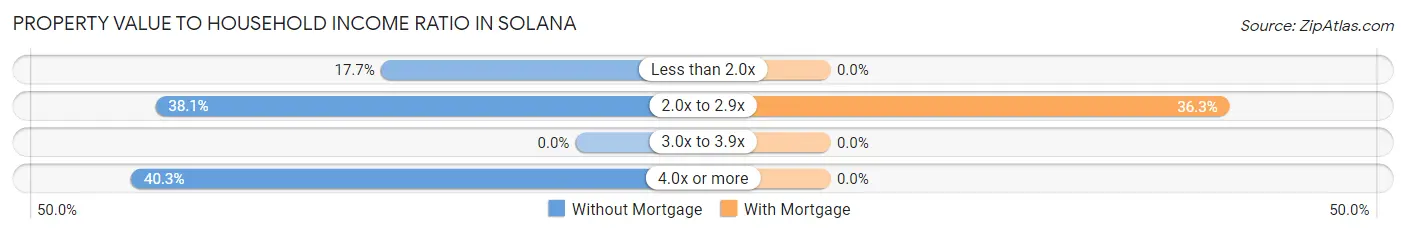
| Value-to-Income Ratio | Without Mortgage | With Mortgage |
| Less than 2.0x | 32 (17.7%) | 0 (0.0%) |
| 2.0x to 2.9x | 69 (38.1%) | 41 (36.3%) |
| 3.0x to 3.9x | 0 (0.0%) | 0 (0.0%) |
| 4.0x or more | 73 (40.3%) | 0 (0.0%) |
| Total | 181 (100.0%) | 113 (100.0%) |
Real Estate Taxes by Mortgage Status in Solana
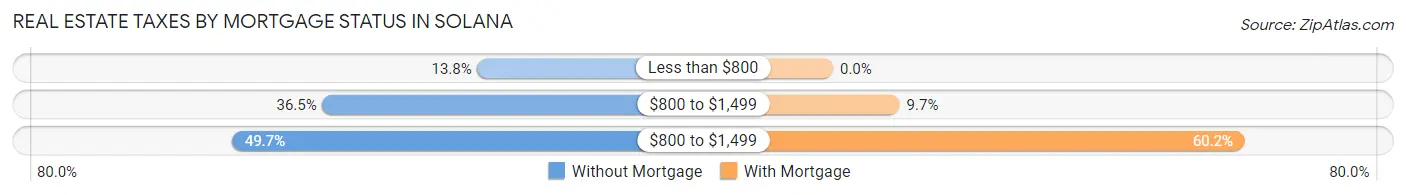
| Property Taxes | Without Mortgage | With Mortgage |
| Less than $800 | 25 (13.8%) | 0 (0.0%) |
| $800 to $1,499 | 66 (36.5%) | 11 (9.7%) |
| $800 to $1,499 | 90 (49.7%) | 68 (60.2%) |
| Total | 181 (100.0%) | 113 (100.0%) |
Health & Disability in Solana
Health Insurance Coverage by Age in Solana
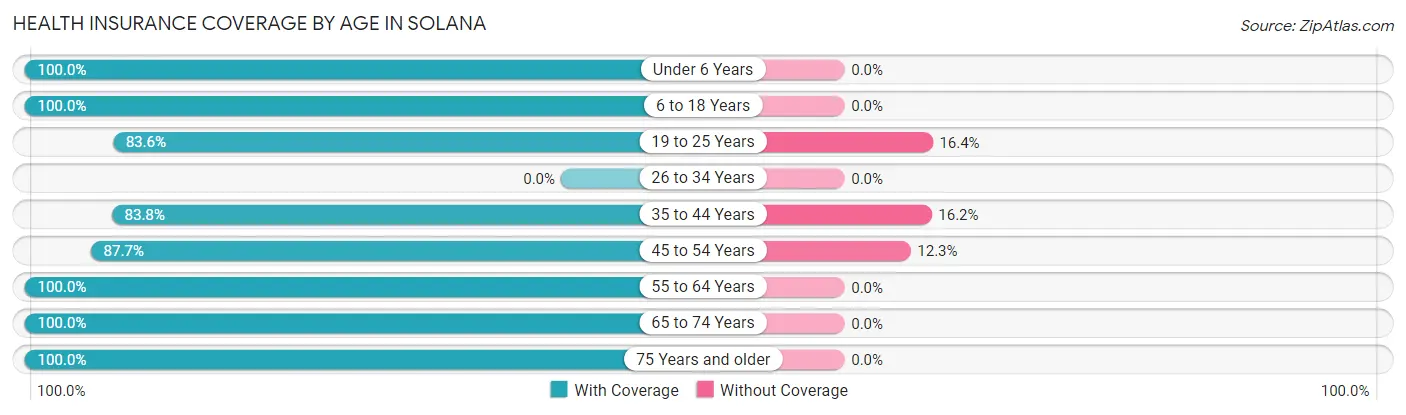
| Age Bracket | With Coverage | Without Coverage |
| Under 6 Years | 12 (100.0%) | 0 (0.0%) |
| 6 to 18 Years | 459 (100.0%) | 0 (0.0%) |
| 19 to 25 Years | 61 (83.6%) | 12 (16.4%) |
| 26 to 34 Years | 0 (0.0%) | 0 (0.0%) |
| 35 to 44 Years | 129 (83.8%) | 25 (16.2%) |
| 45 to 54 Years | 121 (87.7%) | 17 (12.3%) |
| 55 to 64 Years | 70 (100.0%) | 0 (0.0%) |
| 65 to 74 Years | 74 (100.0%) | 0 (0.0%) |
| 75 Years and older | 82 (100.0%) | 0 (0.0%) |
| Total | 1,008 (94.9%) | 54 (5.1%) |
Health Insurance Coverage by Citizenship Status in Solana
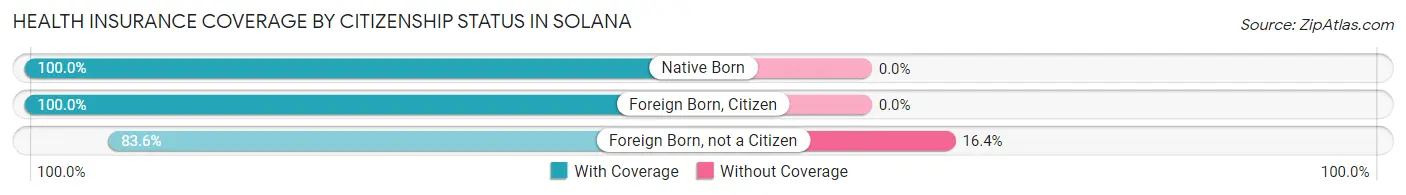
| Citizenship Status | With Coverage | Without Coverage |
| Native Born | 12 (100.0%) | 0 (0.0%) |
| Foreign Born, Citizen | 459 (100.0%) | 0 (0.0%) |
| Foreign Born, not a Citizen | 61 (83.6%) | 12 (16.4%) |
Health Insurance Coverage by Household Income in Solana
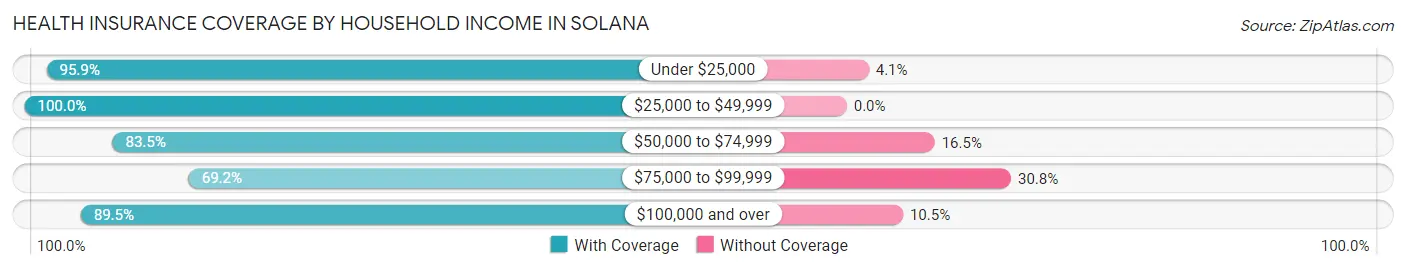
| Household Income | With Coverage | Without Coverage |
| Under $25,000 | 163 (95.9%) | 7 (4.1%) |
| $25,000 to $49,999 | 595 (100.0%) | 0 (0.0%) |
| $50,000 to $74,999 | 147 (83.5%) | 29 (16.5%) |
| $75,000 to $99,999 | 18 (69.2%) | 8 (30.8%) |
| $100,000 and over | 85 (89.5%) | 10 (10.5%) |
Public vs Private Health Insurance Coverage by Age in Solana
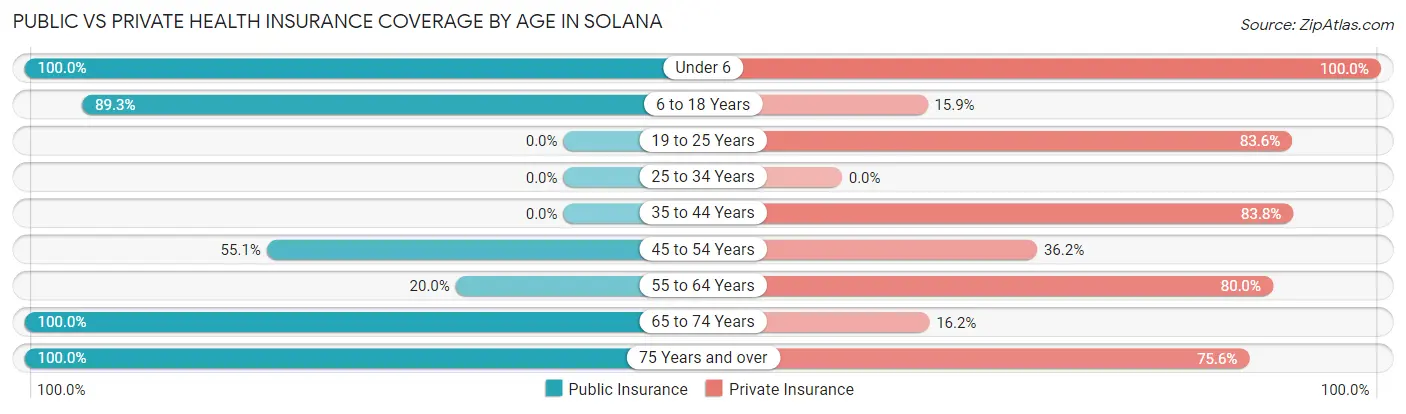
| Age Bracket | Public Insurance | Private Insurance |
| Under 6 | 12 (100.0%) | 12 (100.0%) |
| 6 to 18 Years | 410 (89.3%) | 73 (15.9%) |
| 19 to 25 Years | 0 (0.0%) | 61 (83.6%) |
| 25 to 34 Years | 0 (0.0%) | 0 (0.0%) |
| 35 to 44 Years | 0 (0.0%) | 129 (83.8%) |
| 45 to 54 Years | 76 (55.1%) | 50 (36.2%) |
| 55 to 64 Years | 14 (20.0%) | 56 (80.0%) |
| 65 to 74 Years | 74 (100.0%) | 12 (16.2%) |
| 75 Years and over | 82 (100.0%) | 62 (75.6%) |
| Total | 668 (62.9%) | 455 (42.8%) |
Disability Status by Sex by Age in Solana
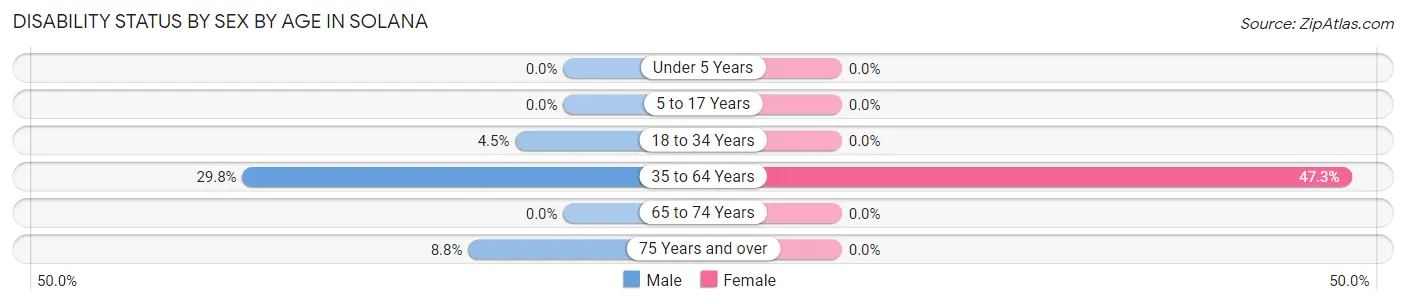
| Age Bracket | Male | Female |
| Under 5 Years | 0 (0.0%) | 0 (0.0%) |
| 5 to 17 Years | 0 (0.0%) | 0 (0.0%) |
| 18 to 34 Years | 12 (4.5%) | 0 (0.0%) |
| 35 to 64 Years | 53 (29.8%) | 87 (47.3%) |
| 65 to 74 Years | 0 (0.0%) | 0 (0.0%) |
| 75 Years and over | 3 (8.8%) | 0 (0.0%) |
Disability Class by Sex by Age in Solana
Disability Class: Hearing Difficulty
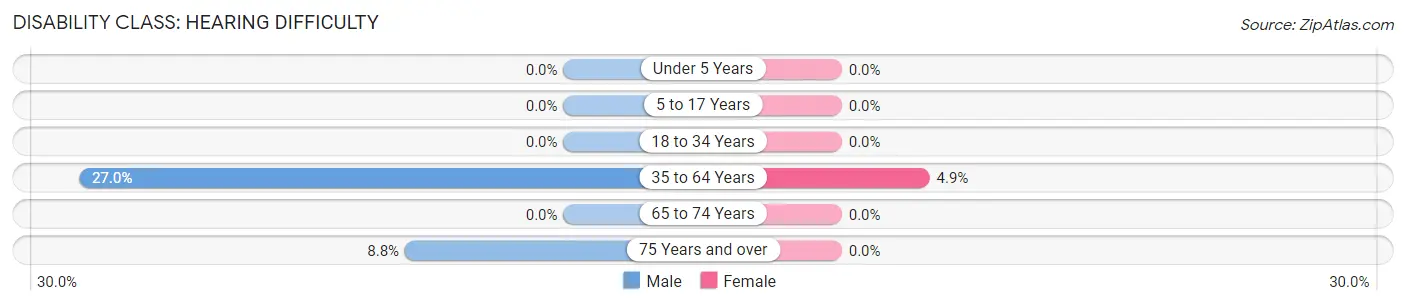
| Age Bracket | Male | Female |
| Under 5 Years | 0 (0.0%) | 0 (0.0%) |
| 5 to 17 Years | 0 (0.0%) | 0 (0.0%) |
| 18 to 34 Years | 0 (0.0%) | 0 (0.0%) |
| 35 to 64 Years | 48 (27.0%) | 9 (4.9%) |
| 65 to 74 Years | 0 (0.0%) | 0 (0.0%) |
| 75 Years and over | 3 (8.8%) | 0 (0.0%) |
Disability Class: Vision Difficulty
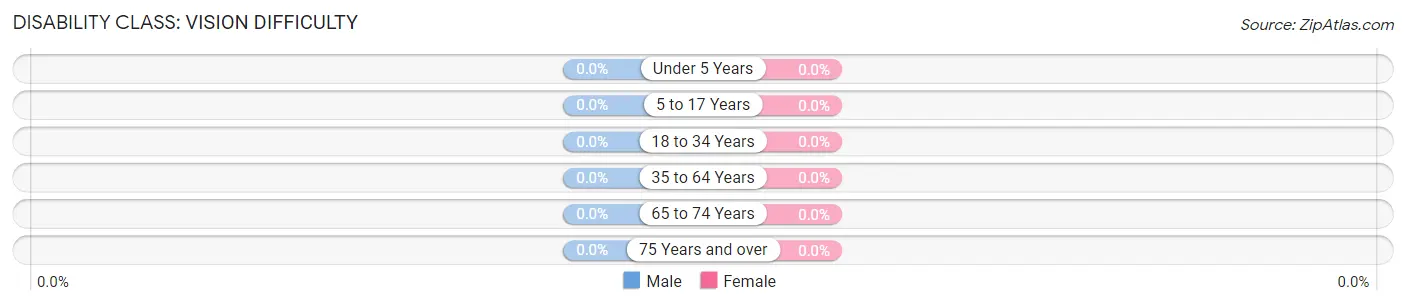
| Age Bracket | Male | Female |
| Under 5 Years | 0 (0.0%) | 0 (0.0%) |
| 5 to 17 Years | 0 (0.0%) | 0 (0.0%) |
| 18 to 34 Years | 0 (0.0%) | 0 (0.0%) |
| 35 to 64 Years | 0 (0.0%) | 0 (0.0%) |
| 65 to 74 Years | 0 (0.0%) | 0 (0.0%) |
| 75 Years and over | 0 (0.0%) | 0 (0.0%) |
Disability Class: Cognitive Difficulty
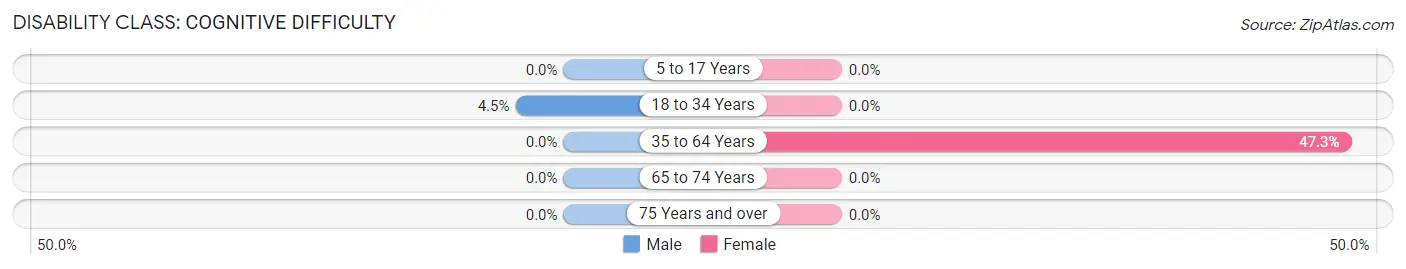
| Age Bracket | Male | Female |
| 5 to 17 Years | 0 (0.0%) | 0 (0.0%) |
| 18 to 34 Years | 12 (4.5%) | 0 (0.0%) |
| 35 to 64 Years | 0 (0.0%) | 87 (47.3%) |
| 65 to 74 Years | 0 (0.0%) | 0 (0.0%) |
| 75 Years and over | 0 (0.0%) | 0 (0.0%) |
Disability Class: Ambulatory Difficulty
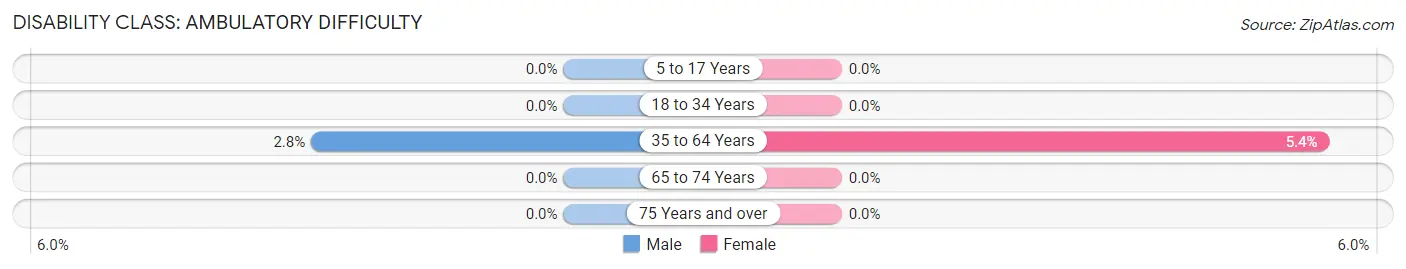
| Age Bracket | Male | Female |
| 5 to 17 Years | 0 (0.0%) | 0 (0.0%) |
| 18 to 34 Years | 0 (0.0%) | 0 (0.0%) |
| 35 to 64 Years | 5 (2.8%) | 10 (5.4%) |
| 65 to 74 Years | 0 (0.0%) | 0 (0.0%) |
| 75 Years and over | 0 (0.0%) | 0 (0.0%) |
Disability Class: Self-Care Difficulty
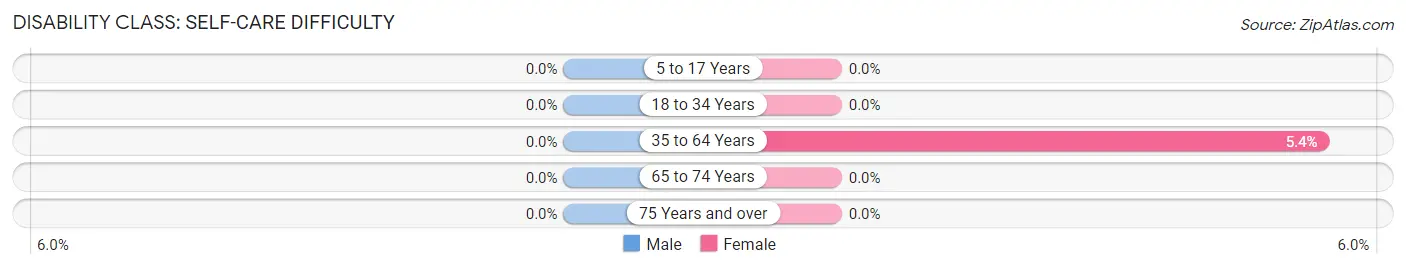
| Age Bracket | Male | Female |
| 5 to 17 Years | 0 (0.0%) | 0 (0.0%) |
| 18 to 34 Years | 0 (0.0%) | 0 (0.0%) |
| 35 to 64 Years | 0 (0.0%) | 10 (5.4%) |
| 65 to 74 Years | 0 (0.0%) | 0 (0.0%) |
| 75 Years and over | 0 (0.0%) | 0 (0.0%) |
Technology Access in Solana
Computing Device Access in Solana
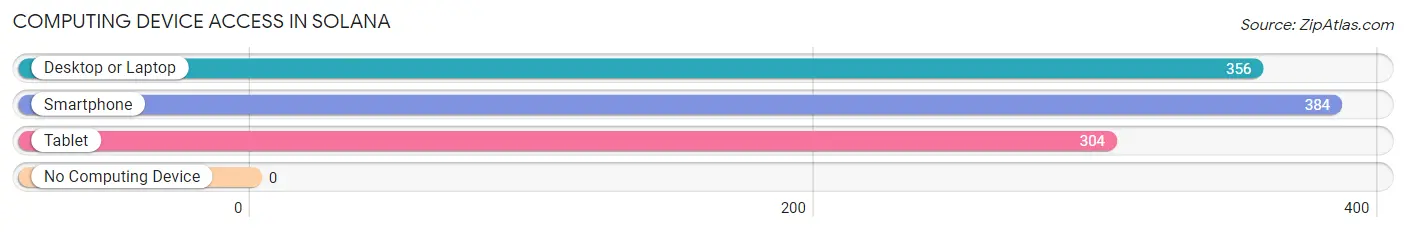
| Device Type | # Households | % Households |
| Desktop or Laptop | 356 | 88.1% |
| Smartphone | 384 | 95.1% |
| Tablet | 304 | 75.2% |
| No Computing Device | 0 | 0.0% |
| Total | 404 | 100.0% |
Internet Access in Solana
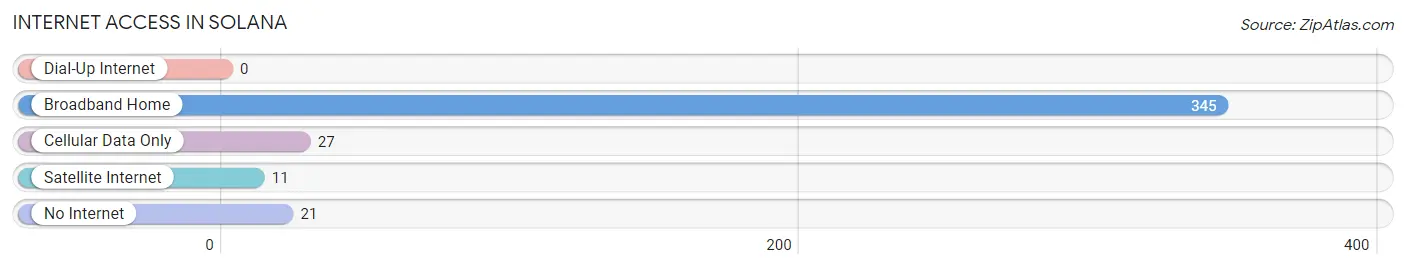
| Internet Type | # Households | % Households |
| Dial-Up Internet | 0 | 0.0% |
| Broadband Home | 345 | 85.4% |
| Cellular Data Only | 27 | 6.7% |
| Satellite Internet | 11 | 2.7% |
| No Internet | 21 | 5.2% |
| Total | 404 | 100.0% |
Solana Summary
Solana is a small town located in the state of Florida, in the United States. It is situated in the northern part of the state, in the county of Santa Rosa. The town has a population of approximately 1,500 people, and is located about 20 miles east of Pensacola.
History
Solana was founded in 1885 by a group of settlers from the nearby town of Milton. The settlers were looking for a place to settle and start a new life, and they chose the area around Solana because of its natural beauty and abundance of resources. The town was named after the Spanish word for “sunshine”, and the settlers quickly began to build homes and businesses in the area.
In the early 1900s, the town began to grow and prosper. The local economy was based on agriculture, and the town was home to several farms and ranches. The town also had a few small businesses, such as a general store and a post office.
In the 1950s, the town began to experience a period of growth and development. The local economy shifted from agriculture to tourism, and the town began to attract more visitors. The town also began to attract more businesses, such as restaurants, hotels, and shops.
Geography
Solana is located in the northern part of the state of Florida, in the county of Santa Rosa. The town is situated on the banks of the Blackwater River, and is surrounded by lush forests and rolling hills. The town is located about 20 miles east of Pensacola, and is about an hour and a half drive from the state capital of Tallahassee.
The town has a humid subtropical climate, with hot and humid summers and mild winters. The average temperature in the summer is around 90 degrees Fahrenheit, and the average temperature in the winter is around 60 degrees Fahrenheit.
Economy
The local economy of Solana is based primarily on tourism. The town is home to several hotels, restaurants, and shops, and attracts visitors from all over the state and country. The town also has a few small businesses, such as a general store and a post office.
The town is also home to several farms and ranches, and the local economy is still based on agriculture. The town is home to several wineries, and the local wine industry is growing.
Demographics
As of the 2010 census, the population of Solana was 1,500 people. The town is predominantly white, with a small Hispanic population. The median household income in the town is around $50,000, and the median age is around 40 years old. The town has a low crime rate, and is considered to be a safe place to live.
Common Questions
What is Per Capita Income in Solana?
Per Capita income in Solana is $18,324.
What is the Median Household income in Solana?
Median Household Income in Solana is $38,167.
What is Income or Wage Gap in Solana?
Income or Wage Gap in Solana is 29.1%.
Women in Solana earn 70.9 cents for every dollar earned by a man.
What is Inequality or Gini Index in Solana?
Inequality or Gini Index in Solana is 0.37.
What is the Total Population of Solana?
Total Population of Solana is 1,062.
What is the Total Male Population of Solana?
Total Male Population of Solana is 571.
What is the Total Female Population of Solana?
Total Female Population of Solana is 491.
What is the Ratio of Males per 100 Females in Solana?
There are 116.29 Males per 100 Females in Solana.
What is the Ratio of Females per 100 Males in Solana?
There are 85.99 Females per 100 Males in Solana.
What is the Median Population Age in Solana?
Median Population Age in Solana is 25.8 Years.
What is the Average Family Size in Solana
Average Family Size in Solana is 3.9 People.
What is the Average Household Size in Solana
Average Household Size in Solana is 2.6 People.
How Large is the Labor Force in Solana?
There are 393 People in the Labor Forcein in Solana.
What is the Percentage of People in the Labor Force in Solana?
46.3% of People are in the Labor Force in Solana.
What is the Unemployment Rate in Solana?
Unemployment Rate in Solana is 3.6%.