Grove City, FL Map & Demographics
Grove City Map
Grove City Overview
$36,472
PER CAPITA INCOME
$77,583
AVG FAMILY INCOME
$48,194
AVG HOUSEHOLD INCOME
32.0%
WAGE / INCOME GAP [ % ]
68.0¢/ $1
WAGE / INCOME GAP [ $ ]
0.43
INEQUALITY / GINI INDEX
1,824
TOTAL POPULATION
879
MALE POPULATION
945
FEMALE POPULATION
93.02
MALES / 100 FEMALES
107.51
FEMALES / 100 MALES
66.3
MEDIAN AGE
2.5
AVG FAMILY SIZE
1.8
AVG HOUSEHOLD SIZE
511
LABOR FORCE [ PEOPLE ]
29.0%
PERCENT IN LABOR FORCE
8.2%
UNEMPLOYMENT RATE
Grove City Area Codes
Income in Grove City
Income Overview in Grove City
Per Capita Income in Grove City is $36,472, while median incomes of families and households are $77,583 and $48,194 respectively.
| Characteristic | Number | Measure |
| Per Capita Income | 1,824 | $36,472 |
| Median Family Income | 481 | $77,583 |
| Mean Family Income | 481 | $85,600 |
| Median Household Income | 1,031 | $48,194 |
| Mean Household Income | 1,031 | $63,210 |
| Income Deficit | 481 | $0 |
| Wage / Income Gap (%) | 1,824 | 31.96% |
| Wage / Income Gap ($) | 1,824 | 68.04¢ per $1 |
| Gini / Inequality Index | 1,824 | 0.43 |
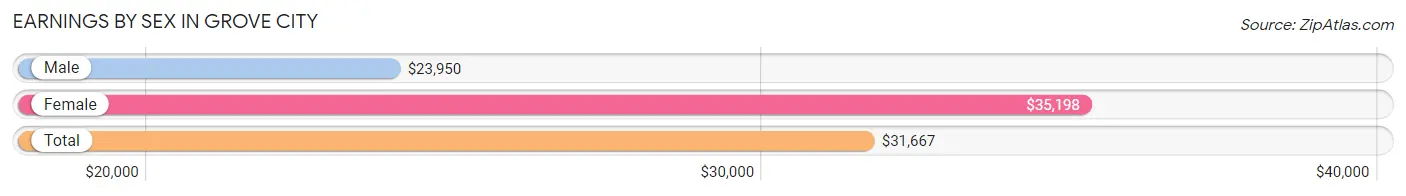
Earnings by Sex in Grove City
Average Earnings in Grove City are $31,667, $23,950 for men and $35,198 for women, a difference of 32.0%.
| Sex | Number | Average Earnings |
| Male | 314 (51.6%) | $23,950 |
| Female | 294 (48.4%) | $35,198 |
| Total | 608 (100.0%) | $31,667 |
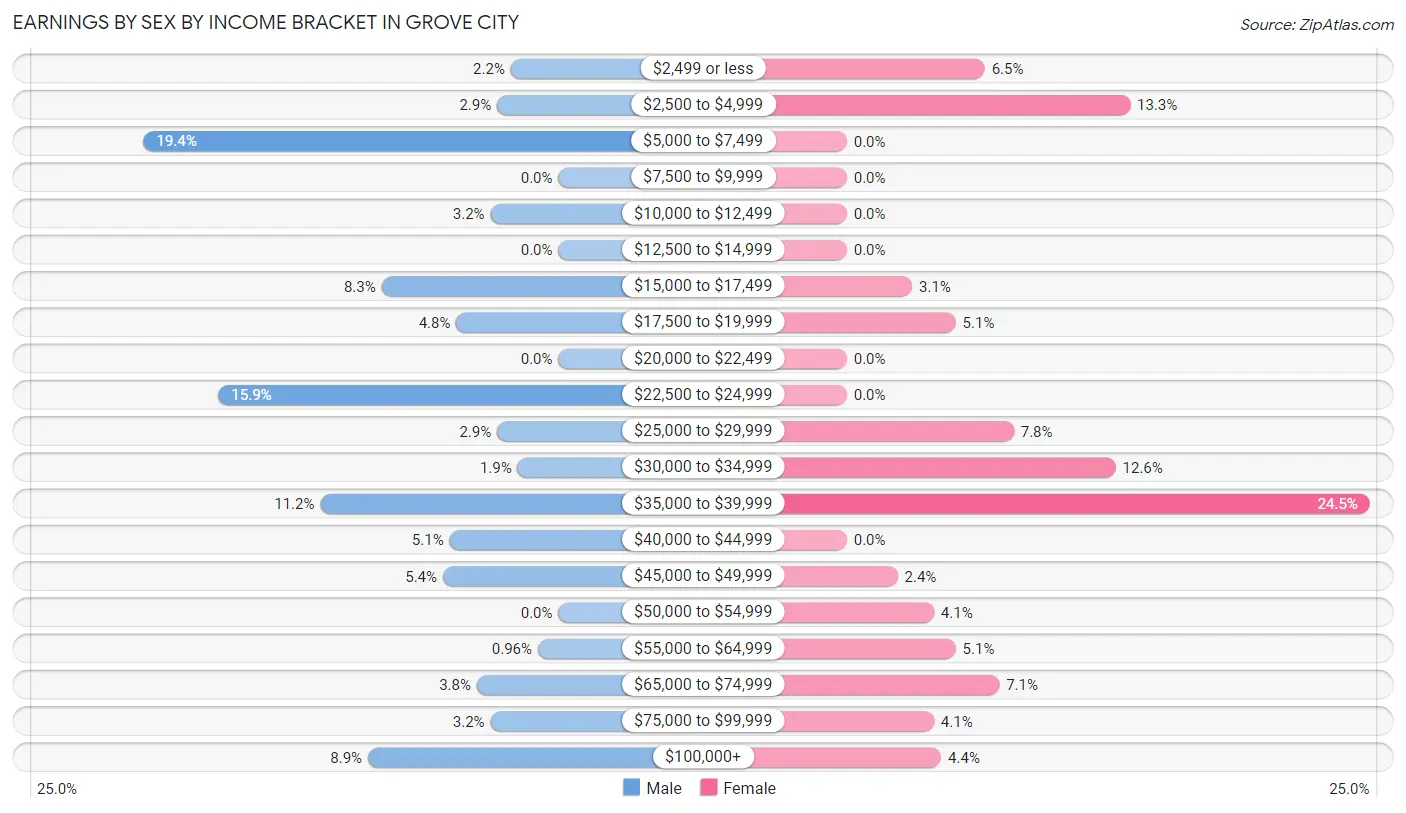
Earnings by Sex by Income Bracket in Grove City
The most common earnings brackets in Grove City are $5,000 to $7,499 for men (61 | 19.4%) and $35,000 to $39,999 for women (72 | 24.5%).
| Income | Male | Female |
| $2,499 or less | 7 (2.2%) | 19 (6.5%) |
| $2,500 to $4,999 | 9 (2.9%) | 39 (13.3%) |
| $5,000 to $7,499 | 61 (19.4%) | 0 (0.0%) |
| $7,500 to $9,999 | 0 (0.0%) | 0 (0.0%) |
| $10,000 to $12,499 | 10 (3.2%) | 0 (0.0%) |
| $12,500 to $14,999 | 0 (0.0%) | 0 (0.0%) |
| $15,000 to $17,499 | 26 (8.3%) | 9 (3.1%) |
| $17,500 to $19,999 | 15 (4.8%) | 15 (5.1%) |
| $20,000 to $22,499 | 0 (0.0%) | 0 (0.0%) |
| $22,500 to $24,999 | 50 (15.9%) | 0 (0.0%) |
| $25,000 to $29,999 | 9 (2.9%) | 23 (7.8%) |
| $30,000 to $34,999 | 6 (1.9%) | 37 (12.6%) |
| $35,000 to $39,999 | 35 (11.2%) | 72 (24.5%) |
| $40,000 to $44,999 | 16 (5.1%) | 0 (0.0%) |
| $45,000 to $49,999 | 17 (5.4%) | 7 (2.4%) |
| $50,000 to $54,999 | 0 (0.0%) | 12 (4.1%) |
| $55,000 to $64,999 | 3 (1.0%) | 15 (5.1%) |
| $65,000 to $74,999 | 12 (3.8%) | 21 (7.1%) |
| $75,000 to $99,999 | 10 (3.2%) | 12 (4.1%) |
| $100,000+ | 28 (8.9%) | 13 (4.4%) |
| Total | 314 (100.0%) | 294 (100.0%) |
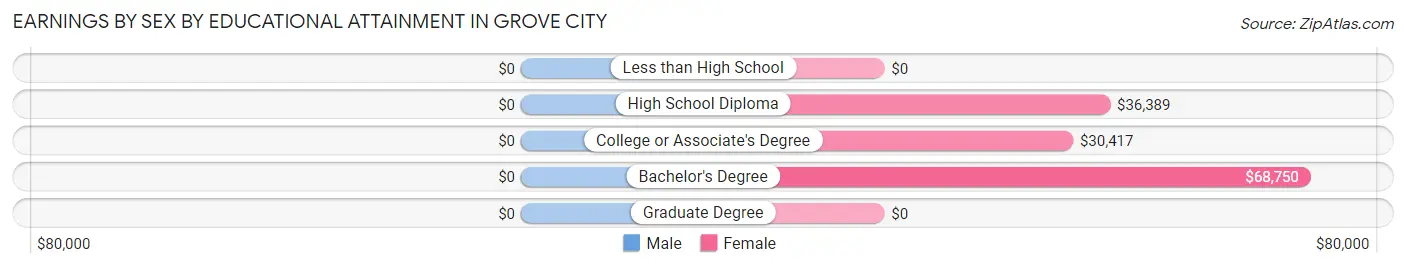
Earnings by Sex by Educational Attainment in Grove City
| Educational Attainment | Male Income | Female Income |
| Less than High School | - | - |
| High School Diploma | - | - |
| College or Associate's Degree | - | - |
| Bachelor's Degree | - | - |
| Graduate Degree | - | - |
| Total | $22,975 | $36,171 |
Family Income in Grove City
Family Income Brackets in Grove City
According to the Grove City family income data, there are 102 families falling into the $100,000 to $149,999 income range, which is the most common income bracket and makes up 21.2% of all families. Conversely, the $10,000 to $14,999 income bracket is the least frequent group with only 13 families (2.7%) belonging to this category.
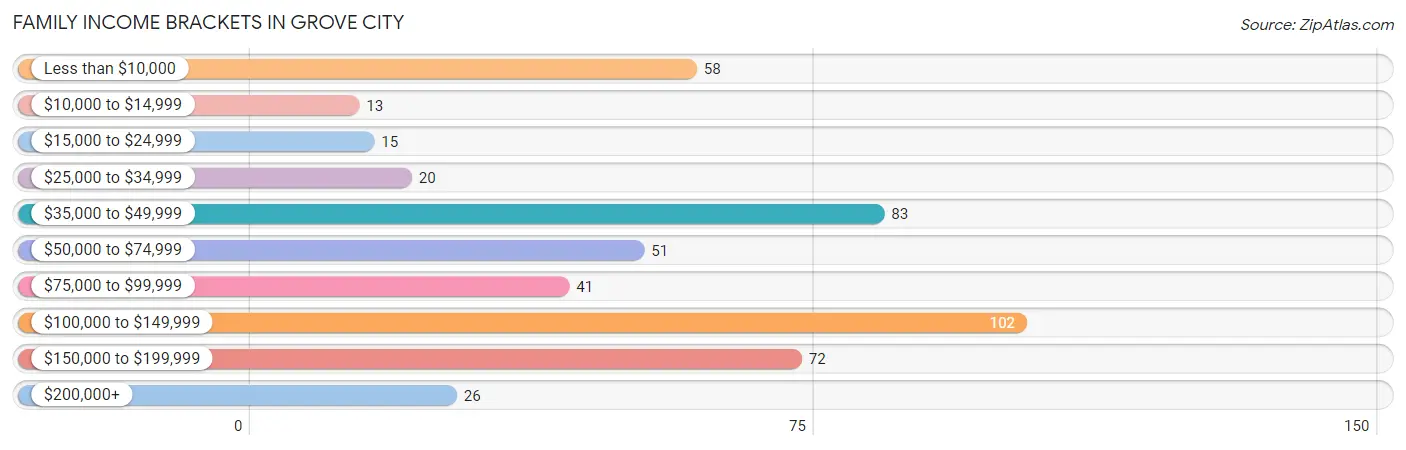
| Income Bracket | # Families | % Families |
| Less than $10,000 | 58 | 12.1% |
| $10,000 to $14,999 | 13 | 2.7% |
| $15,000 to $24,999 | 15 | 3.1% |
| $25,000 to $34,999 | 20 | 4.2% |
| $35,000 to $49,999 | 83 | 17.3% |
| $50,000 to $74,999 | 51 | 10.6% |
| $75,000 to $99,999 | 41 | 8.5% |
| $100,000 to $149,999 | 102 | 21.2% |
| $150,000 to $199,999 | 72 | 15.0% |
| $200,000+ | 26 | 5.4% |
Family Income by Famaliy Size in Grove City
2-person families (398 | 82.7%) account for the highest median family income in Grove City with $78,000 per family, while 2-person families (398 | 82.7%) have the highest median income of $39,000 per family member.
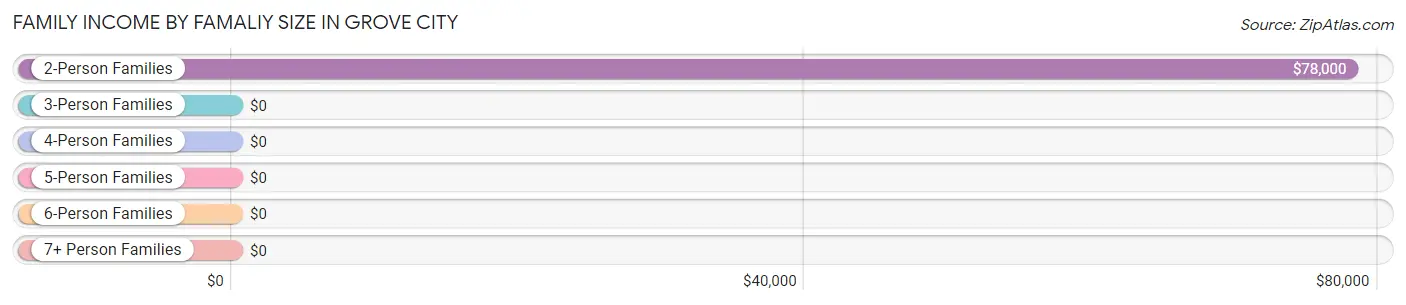
| Income Bracket | # Families | Median Income |
| 2-Person Families | 398 (82.7%) | $78,000 |
| 3-Person Families | 13 (2.7%) | $0 |
| 4-Person Families | 65 (13.5%) | $0 |
| 5-Person Families | 0 (0.0%) | $0 |
| 6-Person Families | 5 (1.0%) | $0 |
| 7+ Person Families | 0 (0.0%) | $0 |
| Total | 481 (100.0%) | $77,583 |
Family Income by Number of Earners in Grove City
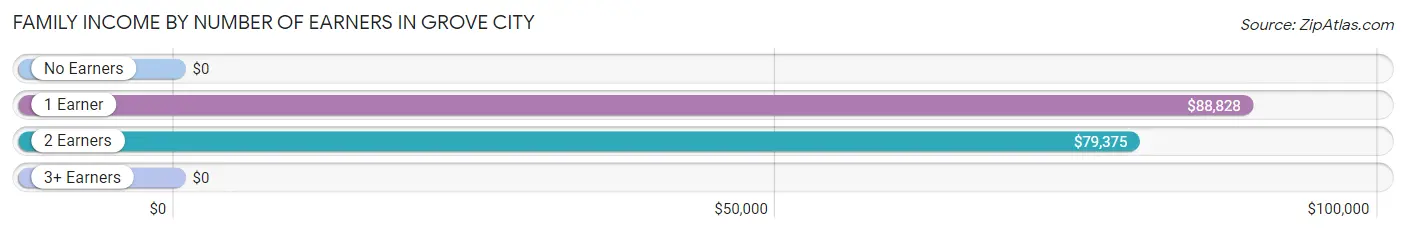
| Number of Earners | # Families | Median Income |
| No Earners | 263 (54.7%) | $0 |
| 1 Earner | 85 (17.7%) | $88,828 |
| 2 Earners | 121 (25.2%) | $79,375 |
| 3+ Earners | 12 (2.5%) | $0 |
| Total | 481 (100.0%) | $77,583 |
Household Income in Grove City
Household Income Brackets in Grove City
With 202 households falling in the category, the $35,000 to $49,999 income range is the most frequent in Grove City, accounting for 19.6% of all households. In contrast, only 13 households (1.3%) fall into the $10,000 to $14,999 income bracket, making it the least populous group.
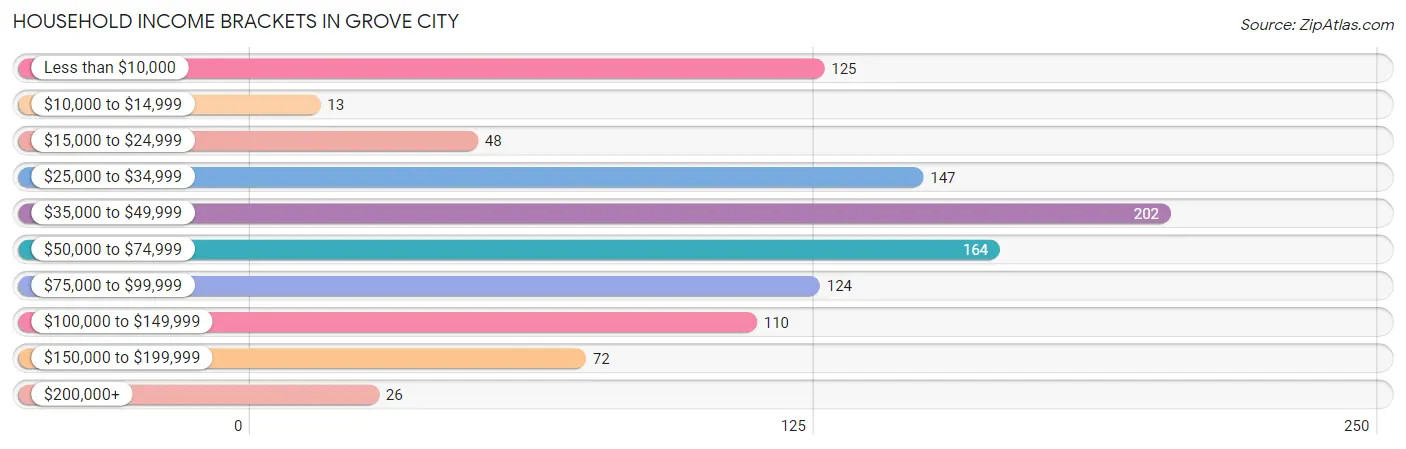
| Income Bracket | # Households | % Households |
| Less than $10,000 | 125 | 12.1% |
| $10,000 to $14,999 | 13 | 1.3% |
| $15,000 to $24,999 | 48 | 4.7% |
| $25,000 to $34,999 | 147 | 14.3% |
| $35,000 to $49,999 | 202 | 19.6% |
| $50,000 to $74,999 | 164 | 15.9% |
| $75,000 to $99,999 | 124 | 12.0% |
| $100,000 to $149,999 | 110 | 10.7% |
| $150,000 to $199,999 | 72 | 7.0% |
| $200,000+ | 26 | 2.5% |
Household Income by Householder Age in Grove City
The median household income in Grove City is $48,194, with the highest median household income of $51,146 found in the 65+ years age bracket for the primary householder. A total of 658 households (63.8%) fall into this category. Meanwhile, the 15 to 24 years age bracket for the primary householder has the lowest median household income of $0, with 23 households (2.2%) in this group.
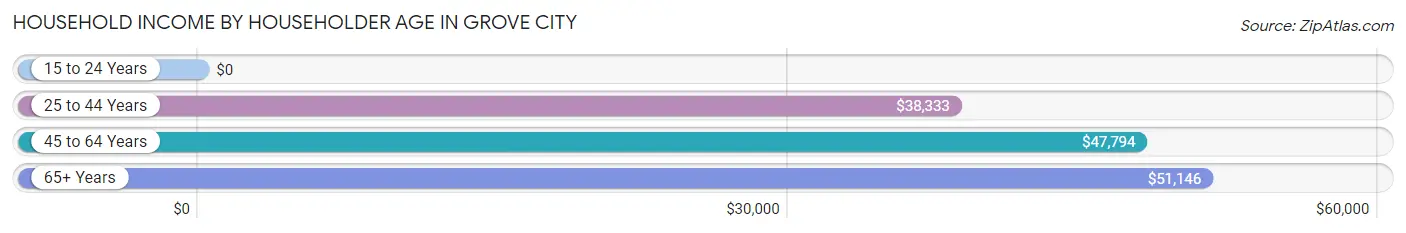
| Income Bracket | # Households | Median Income |
| 15 to 24 Years | 23 (2.2%) | $0 |
| 25 to 44 Years | 36 (3.5%) | $38,333 |
| 45 to 64 Years | 314 (30.5%) | $47,794 |
| 65+ Years | 658 (63.8%) | $51,146 |
| Total | 1,031 (100.0%) | $48,194 |
Poverty in Grove City
Income Below Poverty by Sex and Age in Grove City
With 14.6% poverty level for males and 24.6% for females among the residents of Grove City, 12 to 14 year old males and under 5 year old females are the most vulnerable to poverty, with 10 males (100.0%) and 17 females (100.0%) in their respective age groups living below the poverty level.
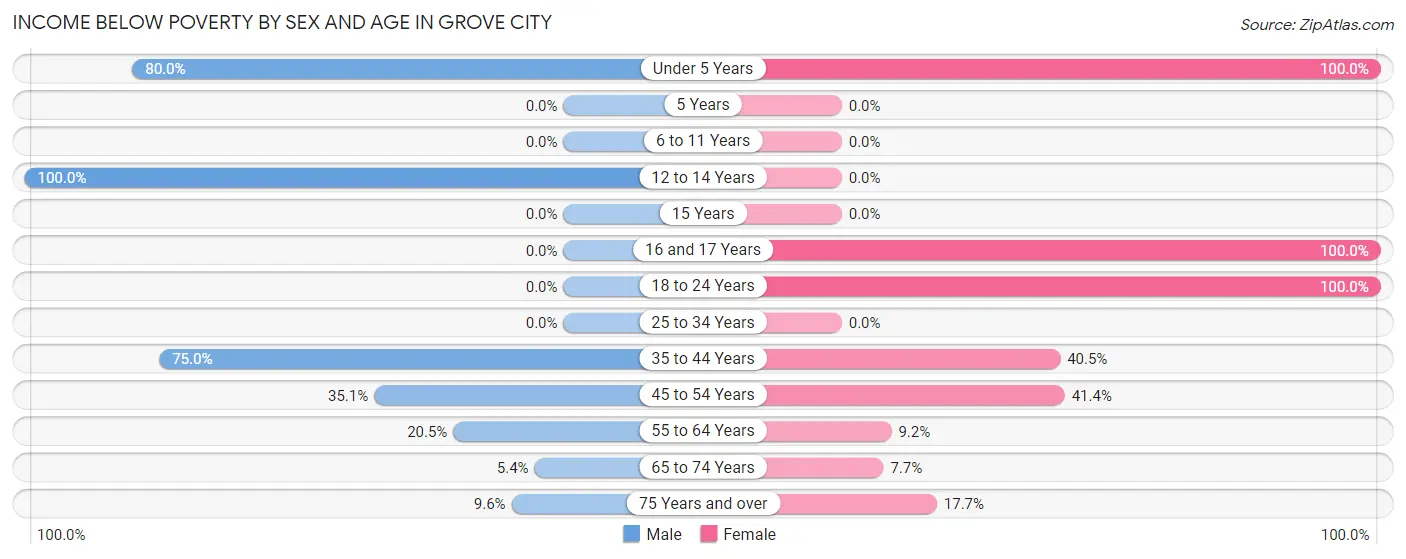
| Age Bracket | Male | Female |
| Under 5 Years | 16 (80.0%) | 17 (100.0%) |
| 5 Years | 0 (0.0%) | 0 (0.0%) |
| 6 to 11 Years | 0 (0.0%) | 0 (0.0%) |
| 12 to 14 Years | 10 (100.0%) | 0 (0.0%) |
| 15 Years | 0 (0.0%) | 0 (0.0%) |
| 16 and 17 Years | 0 (0.0%) | 53 (100.0%) |
| 18 to 24 Years | 0 (0.0%) | 30 (100.0%) |
| 25 to 34 Years | 0 (0.0%) | 0 (0.0%) |
| 35 to 44 Years | 9 (75.0%) | 15 (40.5%) |
| 45 to 54 Years | 26 (35.1%) | 36 (41.4%) |
| 55 to 64 Years | 27 (20.4%) | 20 (9.2%) |
| 65 to 74 Years | 13 (5.4%) | 14 (7.7%) |
| 75 Years and over | 26 (9.6%) | 45 (17.6%) |
| Total | 127 (14.6%) | 230 (24.6%) |
Income Above Poverty by Sex and Age in Grove City
According to the poverty statistics in Grove City, males aged 6 to 11 years and females aged 25 to 34 years are the age groups that are most secure financially, with 100.0% of males and 100.0% of females in these age groups living above the poverty line.
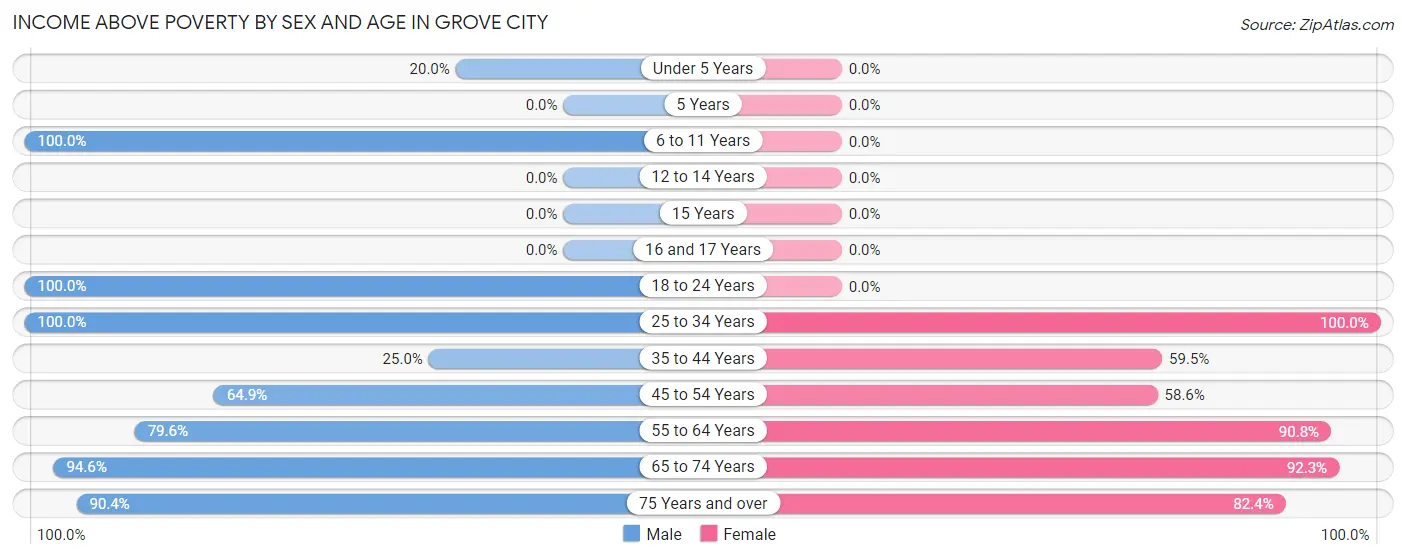
| Age Bracket | Male | Female |
| Under 5 Years | 4 (20.0%) | 0 (0.0%) |
| 5 Years | 0 (0.0%) | 0 (0.0%) |
| 6 to 11 Years | 16 (100.0%) | 0 (0.0%) |
| 12 to 14 Years | 0 (0.0%) | 0 (0.0%) |
| 15 Years | 0 (0.0%) | 0 (0.0%) |
| 16 and 17 Years | 0 (0.0%) | 0 (0.0%) |
| 18 to 24 Years | 39 (100.0%) | 0 (0.0%) |
| 25 to 34 Years | 53 (100.0%) | 56 (100.0%) |
| 35 to 44 Years | 3 (25.0%) | 22 (59.5%) |
| 45 to 54 Years | 48 (64.9%) | 51 (58.6%) |
| 55 to 64 Years | 105 (79.5%) | 197 (90.8%) |
| 65 to 74 Years | 229 (94.6%) | 167 (92.3%) |
| 75 Years and over | 244 (90.4%) | 210 (82.4%) |
| Total | 741 (85.4%) | 703 (75.3%) |
Income Below Poverty Among Married-Couple Families in Grove City
The poverty statistics for married-couple families in Grove City show that 14.6% or 62 of the total 424 families live below the poverty line. Families with 1 or 2 children have the highest poverty rate of 56.5%, comprising of 26 families. On the other hand, families with no children have the lowest poverty rate of 9.5%, which includes 36 families.
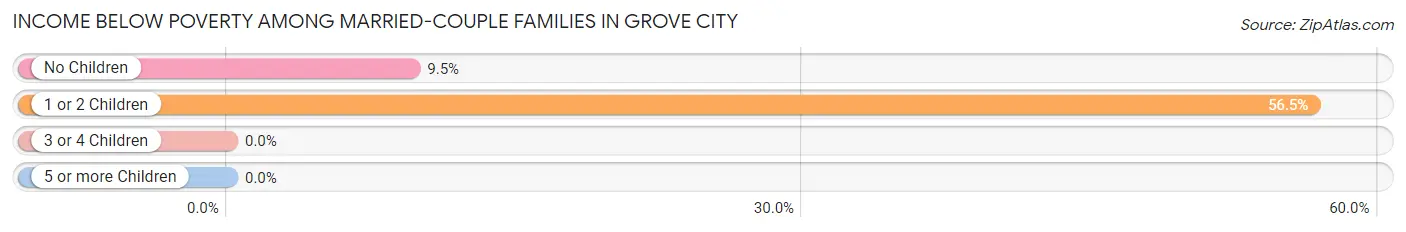
| Children | Above Poverty | Below Poverty |
| No Children | 342 (90.5%) | 36 (9.5%) |
| 1 or 2 Children | 20 (43.5%) | 26 (56.5%) |
| 3 or 4 Children | 0 (0.0%) | 0 (0.0%) |
| 5 or more Children | 0 (0.0%) | 0 (0.0%) |
| Total | 362 (85.4%) | 62 (14.6%) |
Income Below Poverty Among Single-Parent Households in Grove City
According to the poverty data in Grove City, 29.0% or 9 single-father households and 57.7% or 15 single-mother households are living below the poverty line. Among single-father households, those with 1 or 2 children have the highest poverty rate, with 9 households (100.0%) experiencing poverty. Likewise, among single-mother households, those with 3 or 4 children have the highest poverty rate, with 15 households (100.0%) falling below the poverty line.
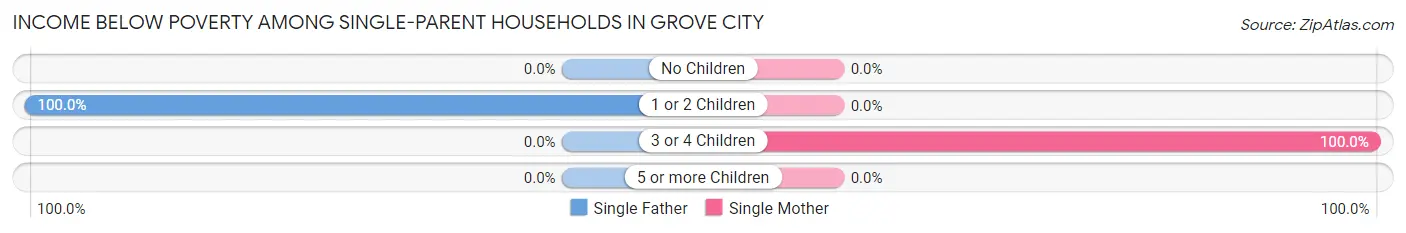
| Children | Single Father | Single Mother |
| No Children | 0 (0.0%) | 0 (0.0%) |
| 1 or 2 Children | 9 (100.0%) | 0 (0.0%) |
| 3 or 4 Children | 0 (0.0%) | 15 (100.0%) |
| 5 or more Children | 0 (0.0%) | 0 (0.0%) |
| Total | 9 (29.0%) | 15 (57.7%) |
Income Below Poverty Among Married-Couple vs Single-Parent Households in Grove City
The poverty data for Grove City shows that 62 of the married-couple family households (14.6%) and 24 of the single-parent households (42.1%) are living below the poverty level. Within the married-couple family households, those with 1 or 2 children have the highest poverty rate, with 26 households (56.5%) falling below the poverty line. Among the single-parent households, those with 1 or 2 children have the highest poverty rate, with 9 household (100.0%) living below poverty.
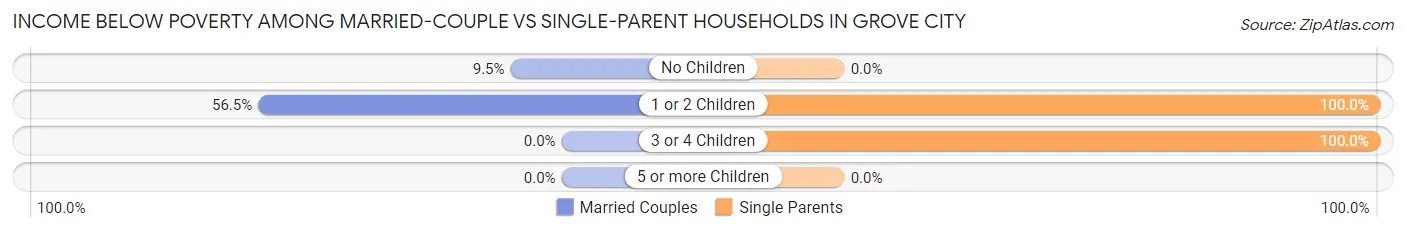
| Children | Married-Couple Families | Single-Parent Households |
| No Children | 36 (9.5%) | 0 (0.0%) |
| 1 or 2 Children | 26 (56.5%) | 9 (100.0%) |
| 3 or 4 Children | 0 (0.0%) | 15 (100.0%) |
| 5 or more Children | 0 (0.0%) | 0 (0.0%) |
| Total | 62 (14.6%) | 24 (42.1%) |
Race in Grove City
The most populous races in Grove City are White / Caucasian (1,717 | 94.1%), Two or more Races (46 | 2.5%), and Black / African American (33 | 1.8%).
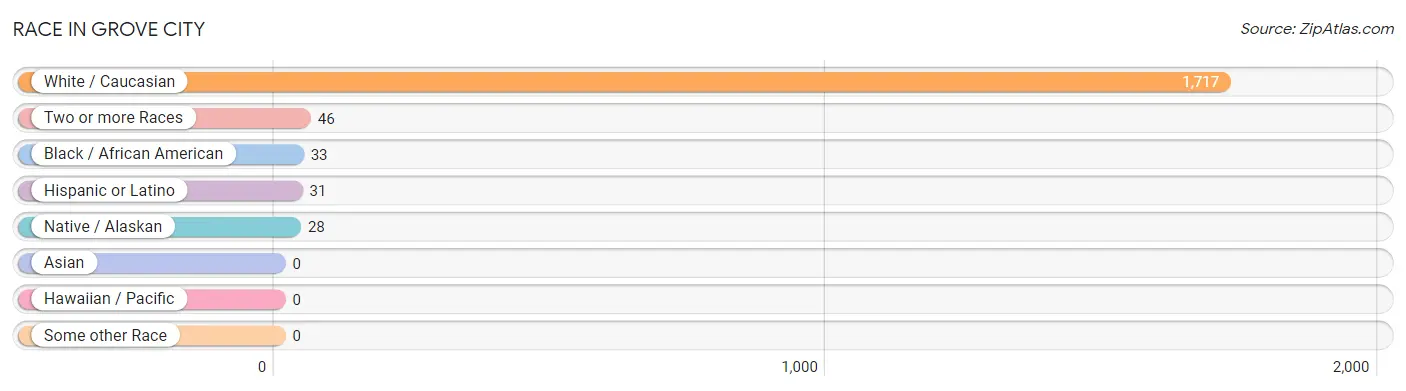
| Race | # Population | % Population |
| Asian | 0 | 0.0% |
| Black / African American | 33 | 1.8% |
| Hawaiian / Pacific | 0 | 0.0% |
| Hispanic or Latino | 31 | 1.7% |
| Native / Alaskan | 28 | 1.5% |
| White / Caucasian | 1,717 | 94.1% |
| Two or more Races | 46 | 2.5% |
| Some other Race | 0 | 0.0% |
| Total | 1,824 | 100.0% |
Ancestry in Grove City
The most populous ancestries reported in Grove City are German (339 | 18.6%), American (258 | 14.1%), English (239 | 13.1%), Irish (219 | 12.0%), and Italian (166 | 9.1%), together accounting for 66.9% of all Grove City residents.
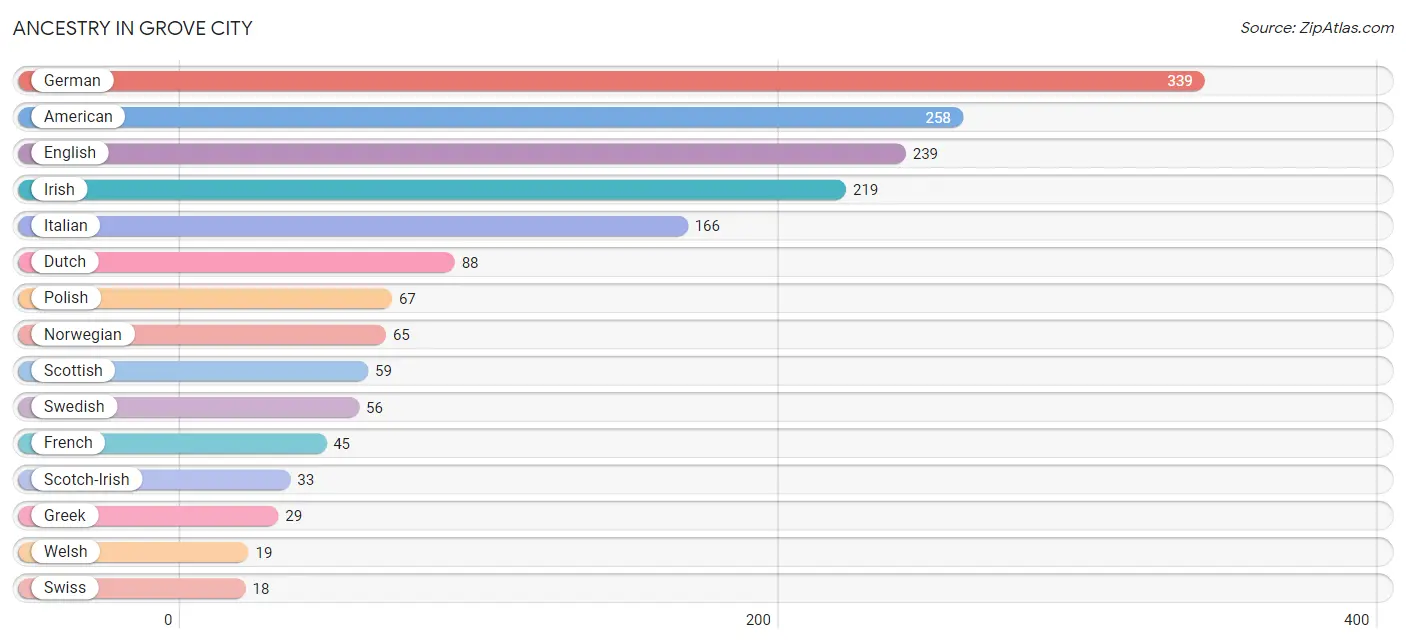
| Ancestry | # Population | % Population |
| American | 258 | 14.1% |
| Austrian | 9 | 0.5% |
| Belgian | 6 | 0.3% |
| Canadian | 17 | 0.9% |
| Colombian | 11 | 0.6% |
| Cuban | 11 | 0.6% |
| Danish | 8 | 0.4% |
| Dutch | 88 | 4.8% |
| Eastern European | 10 | 0.5% |
| English | 239 | 13.1% |
| European | 12 | 0.7% |
| French | 45 | 2.5% |
| German | 339 | 18.6% |
| Greek | 29 | 1.6% |
| Hungarian | 5 | 0.3% |
| Irish | 219 | 12.0% |
| Italian | 166 | 9.1% |
| Jamaican | 12 | 0.7% |
| Norwegian | 65 | 3.6% |
| Polish | 67 | 3.7% |
| Puerto Rican | 9 | 0.5% |
| Romanian | 9 | 0.5% |
| Scotch-Irish | 33 | 1.8% |
| Scottish | 59 | 3.2% |
| Seminole | 17 | 0.9% |
| Slovak | 9 | 0.5% |
| South American | 11 | 0.6% |
| Swedish | 56 | 3.1% |
| Swiss | 18 | 1.0% |
| Welsh | 19 | 1.0% | View All 30 Rows |
Immigrants in Grove City
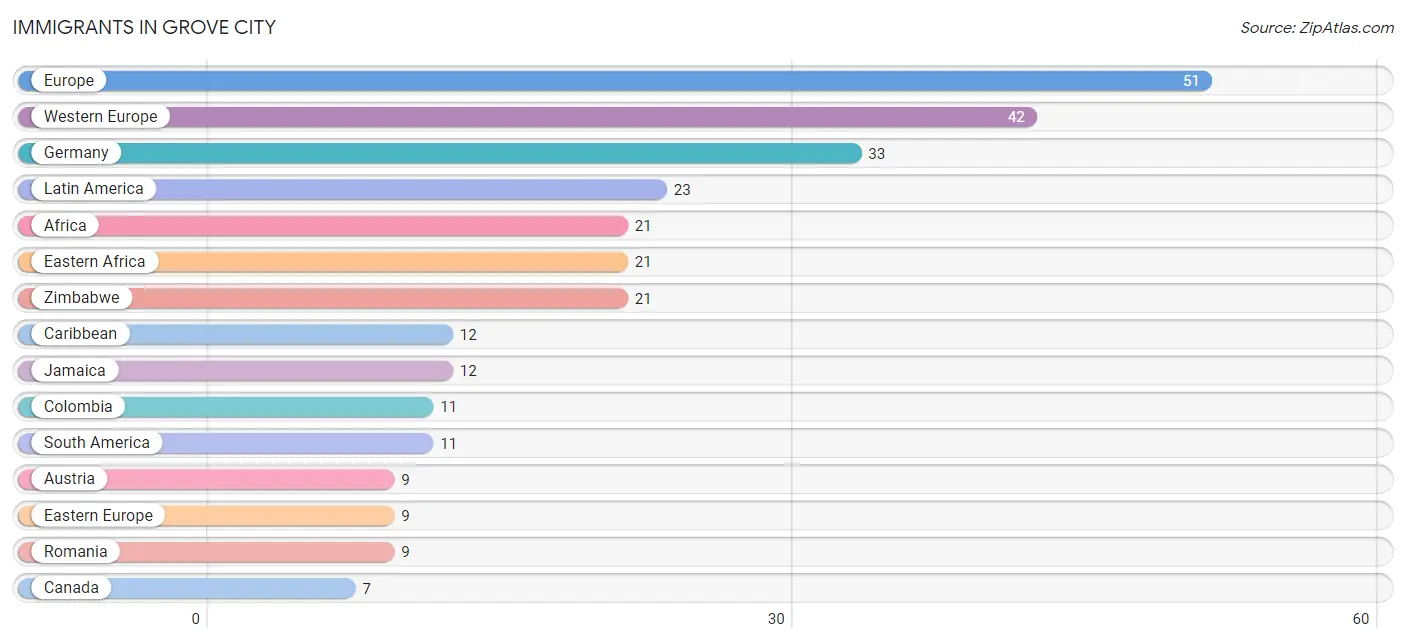
The most numerous immigrant groups reported in Grove City came from Europe (51 | 2.8%), Western Europe (42 | 2.3%), Germany (33 | 1.8%), Latin America (23 | 1.3%), and Africa (21 | 1.1%), together accounting for 9.3% of all Grove City residents.
| Immigration Origin | # Population | % Population |
| Africa | 21 | 1.1% |
| Austria | 9 | 0.5% |
| Canada | 7 | 0.4% |
| Caribbean | 12 | 0.7% |
| Colombia | 11 | 0.6% |
| Eastern Africa | 21 | 1.1% |
| Eastern Europe | 9 | 0.5% |
| Europe | 51 | 2.8% |
| Germany | 33 | 1.8% |
| Jamaica | 12 | 0.7% |
| Latin America | 23 | 1.3% |
| Romania | 9 | 0.5% |
| South America | 11 | 0.6% |
| Western Europe | 42 | 2.3% |
| Zimbabwe | 21 | 1.1% | View All 15 Rows |
Sex and Age in Grove City
Sex and Age in Grove City
The most populous age groups in Grove City are 65 to 69 Years (153 | 17.4%) for men and 60 to 64 Years (131 | 13.9%) for women.
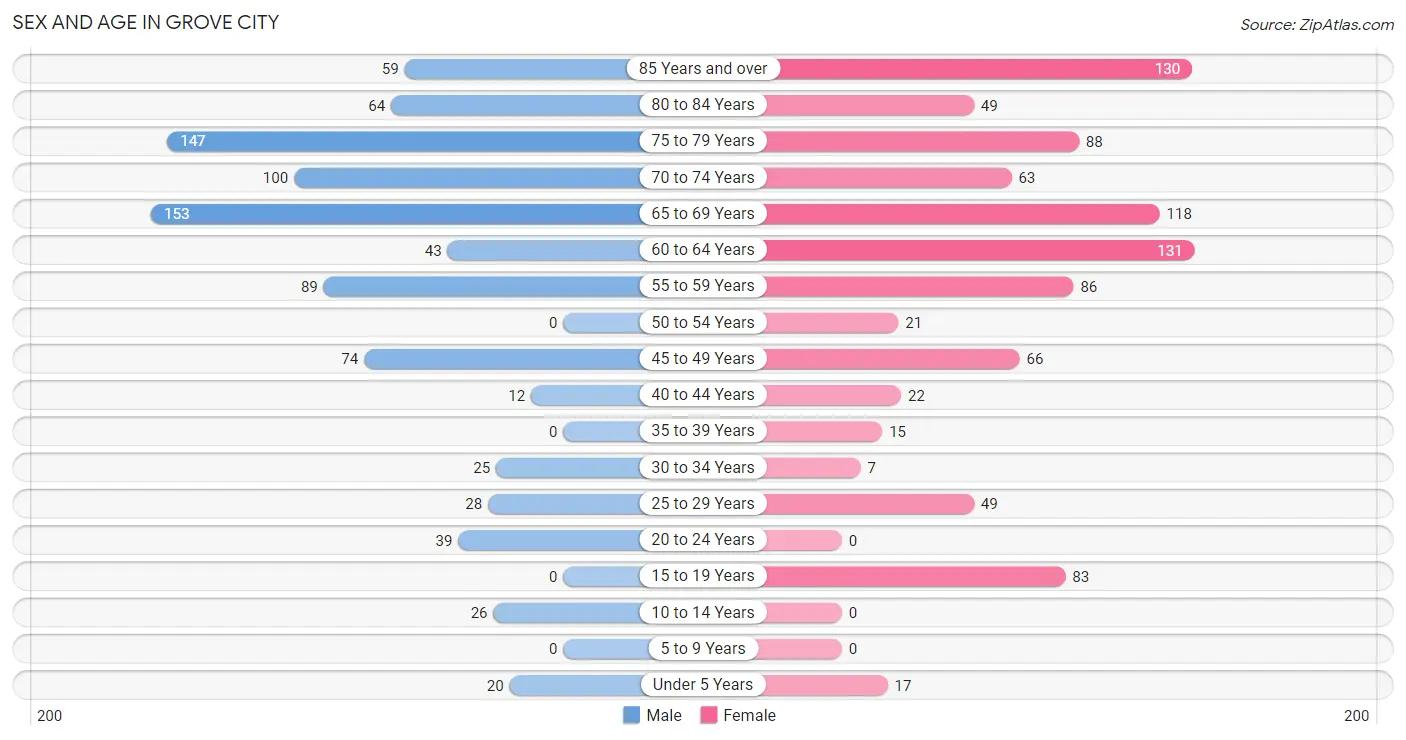
| Age Bracket | Male | Female |
| Under 5 Years | 20 (2.3%) | 17 (1.8%) |
| 5 to 9 Years | 0 (0.0%) | 0 (0.0%) |
| 10 to 14 Years | 26 (3.0%) | 0 (0.0%) |
| 15 to 19 Years | 0 (0.0%) | 83 (8.8%) |
| 20 to 24 Years | 39 (4.4%) | 0 (0.0%) |
| 25 to 29 Years | 28 (3.2%) | 49 (5.2%) |
| 30 to 34 Years | 25 (2.8%) | 7 (0.7%) |
| 35 to 39 Years | 0 (0.0%) | 15 (1.6%) |
| 40 to 44 Years | 12 (1.4%) | 22 (2.3%) |
| 45 to 49 Years | 74 (8.4%) | 66 (7.0%) |
| 50 to 54 Years | 0 (0.0%) | 21 (2.2%) |
| 55 to 59 Years | 89 (10.1%) | 86 (9.1%) |
| 60 to 64 Years | 43 (4.9%) | 131 (13.9%) |
| 65 to 69 Years | 153 (17.4%) | 118 (12.5%) |
| 70 to 74 Years | 100 (11.4%) | 63 (6.7%) |
| 75 to 79 Years | 147 (16.7%) | 88 (9.3%) |
| 80 to 84 Years | 64 (7.3%) | 49 (5.2%) |
| 85 Years and over | 59 (6.7%) | 130 (13.8%) |
| Total | 879 (100.0%) | 945 (100.0%) |
Families and Households in Grove City
Median Family Size in Grove City
The median family size in Grove City is 2.45 persons per family, with single female/mother families (26 | 5.4%) accounting for the largest median family size of 3.69 persons per family. On the other hand, single male/father families (31 | 6.4%) represent the smallest median family size with 2.26 persons per family.
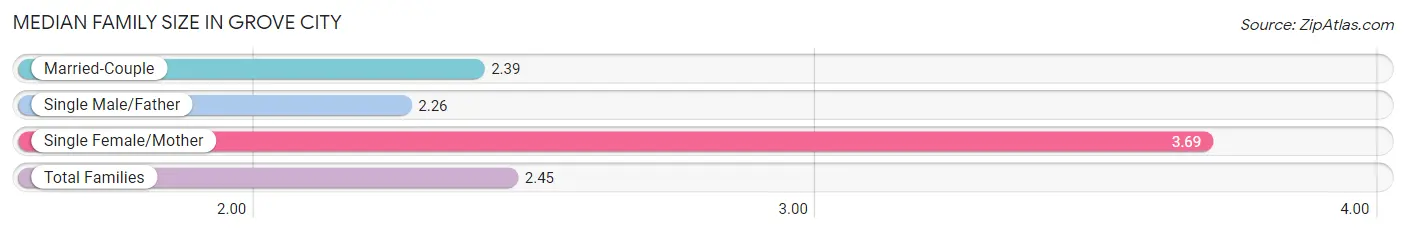
| Family Type | # Families | Family Size |
| Married-Couple | 424 (88.1%) | 2.39 |
| Single Male/Father | 31 (6.4%) | 2.26 |
| Single Female/Mother | 26 (5.4%) | 3.69 |
| Total Families | 481 (100.0%) | 2.45 |
Median Household Size in Grove City
The median household size in Grove City is 1.75 persons per household, with single female/mother households (26 | 2.5%) accounting for the largest median household size of 4.5 persons per household. non-family households (550 | 53.3%) represent the smallest median household size with 1.07 persons per household.
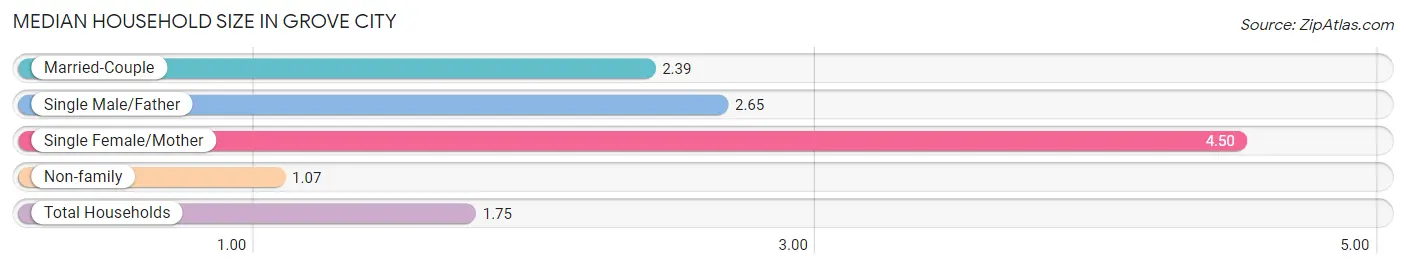
| Household Type | # Households | Household Size |
| Married-Couple | 424 (41.1%) | 2.39 |
| Single Male/Father | 31 (3.0%) | 2.65 |
| Single Female/Mother | 26 (2.5%) | 4.50 |
| Non-family | 550 (53.3%) | 1.07 |
| Total Households | 1,031 (100.0%) | 1.75 |
Household Size by Marriage Status in Grove City
Out of a total of 1,031 households in Grove City, 481 (46.7%) are family households, while 550 (53.3%) are nonfamily households. The most numerous type of family households are 2-person households, comprising 378, and the most common type of nonfamily households are 1-person households, comprising 507.
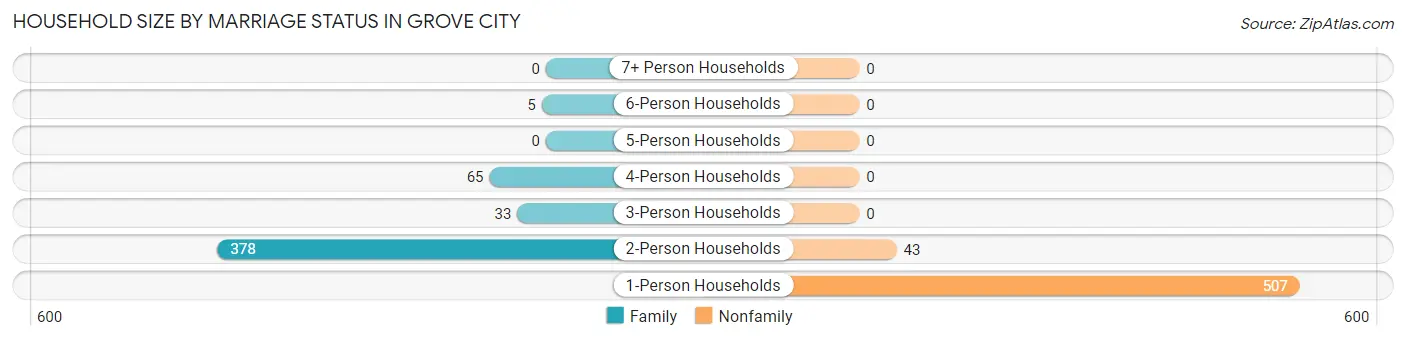
| Household Size | Family Households | Nonfamily Households |
| 1-Person Households | - | 507 (49.2%) |
| 2-Person Households | 378 (36.7%) | 43 (4.2%) |
| 3-Person Households | 33 (3.2%) | 0 (0.0%) |
| 4-Person Households | 65 (6.3%) | 0 (0.0%) |
| 5-Person Households | 0 (0.0%) | 0 (0.0%) |
| 6-Person Households | 5 (0.5%) | 0 (0.0%) |
| 7+ Person Households | 0 (0.0%) | 0 (0.0%) |
| Total | 481 (46.7%) | 550 (53.3%) |
Female Fertility in Grove City
Fertility by Age in Grove City
Average fertility rate in Grove City is 62.0 births per 1,000 women. Women in the age bracket of 35 to 50 years have the highest fertility rate with 146.0 births per 1,000 women. Women in the age bracket of 35 to 50 years acount for 100.0% of all women with births.
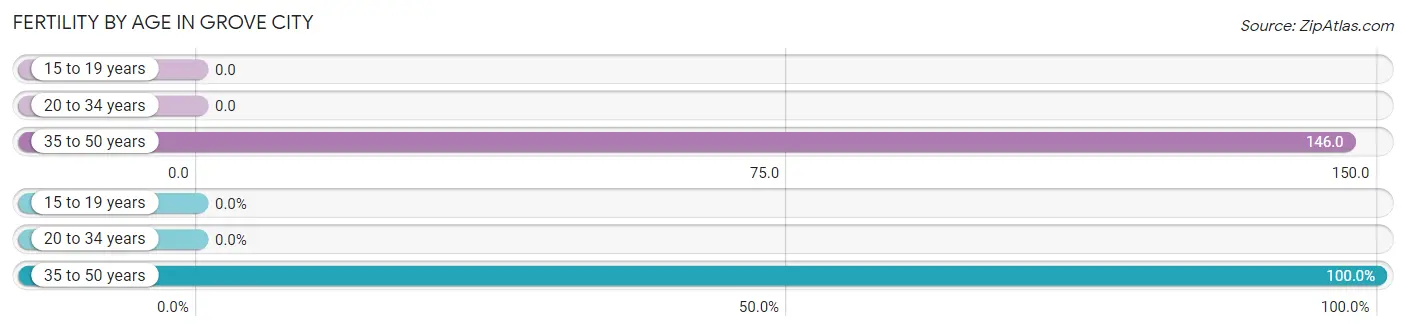
| Age Bracket | Women with Births | Births / 1,000 Women |
| 15 to 19 years | 0 (0.0%) | 0.0 |
| 20 to 34 years | 0 (0.0%) | 0.0 |
| 35 to 50 years | 15 (100.0%) | 146.0 |
| Total | 15 (100.0%) | 62.0 |
Fertility by Age by Marriage Status in Grove City
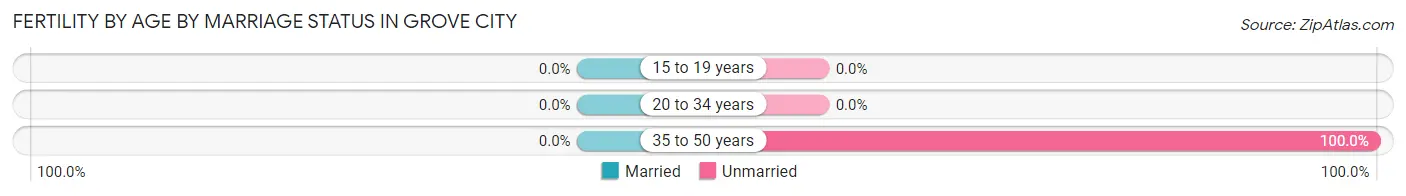
| Age Bracket | Married | Unmarried |
| 15 to 19 years | 0 (0.0%) | 0 (0.0%) |
| 20 to 34 years | 0 (0.0%) | 0 (0.0%) |
| 35 to 50 years | 0 (0.0%) | 15 (100.0%) |
| Total | 0 (0.0%) | 15 (100.0%) |
Fertility by Education in Grove City
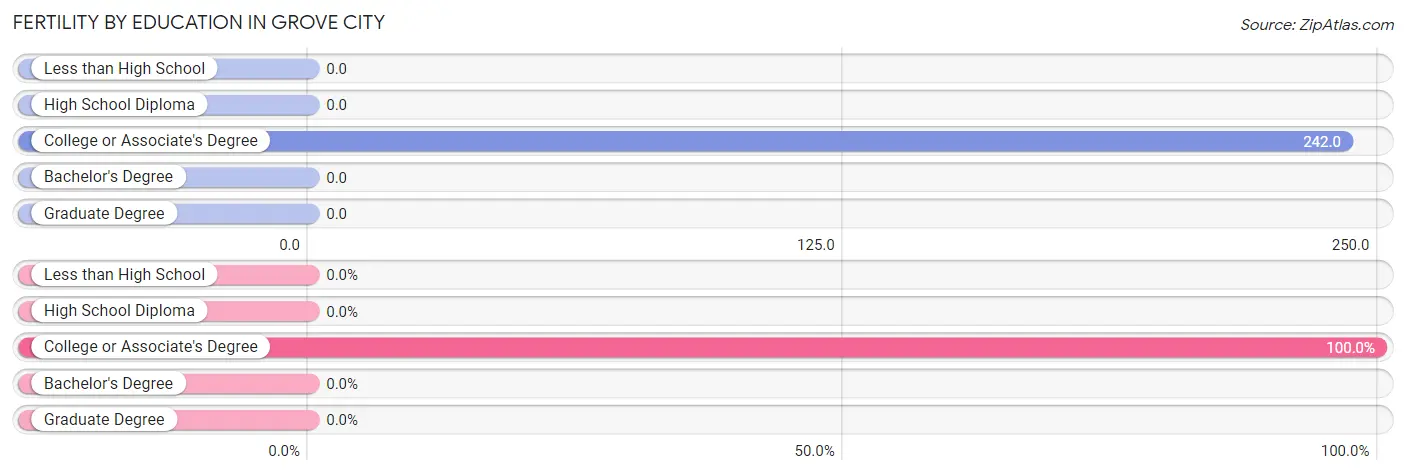
| Educational Attainment | Women with Births | Births / 1,000 Women |
| Less than High School | 0 (0.0%) | 0.0 |
| High School Diploma | 0 (0.0%) | 0.0 |
| College or Associate's Degree | 15 (100.0%) | 242.0 |
| Bachelor's Degree | 0 (0.0%) | 0.0 |
| Graduate Degree | 0 (0.0%) | 0.0 |
| Total | 15 (100.0%) | 62.0 |
Fertility by Education by Marriage Status in Grove City
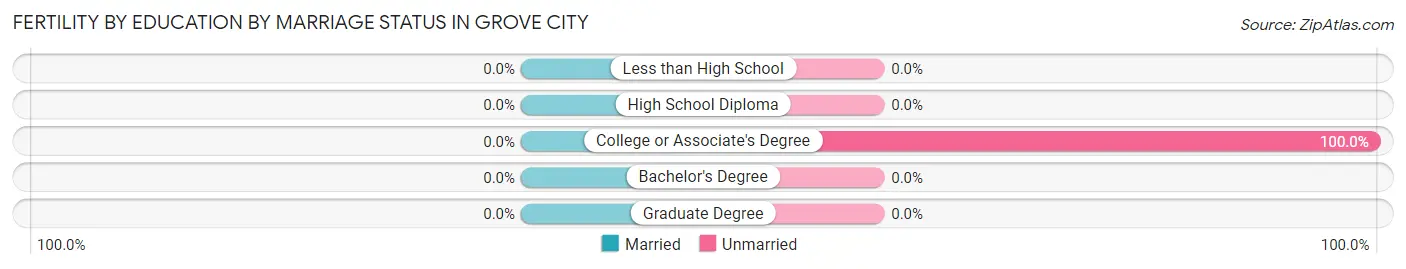
| Educational Attainment | Married | Unmarried |
| Less than High School | 0 (0.0%) | 0 (0.0%) |
| High School Diploma | 0 (0.0%) | 0 (0.0%) |
| College or Associate's Degree | 0 (0.0%) | 15 (100.0%) |
| Bachelor's Degree | 0 (0.0%) | 0 (0.0%) |
| Graduate Degree | 0 (0.0%) | 0 (0.0%) |
| Total | 0 (0.0%) | 15 (100.0%) |
Employment Characteristics in Grove City
Employment by Class of Employer in Grove City
Among the 434 employed individuals in Grove City, private company employees (352 | 81.1%), not-for-profit organizations (34 | 7.8%), and self-employed (incorporated) (33 | 7.6%) make up the most common classes of employment.
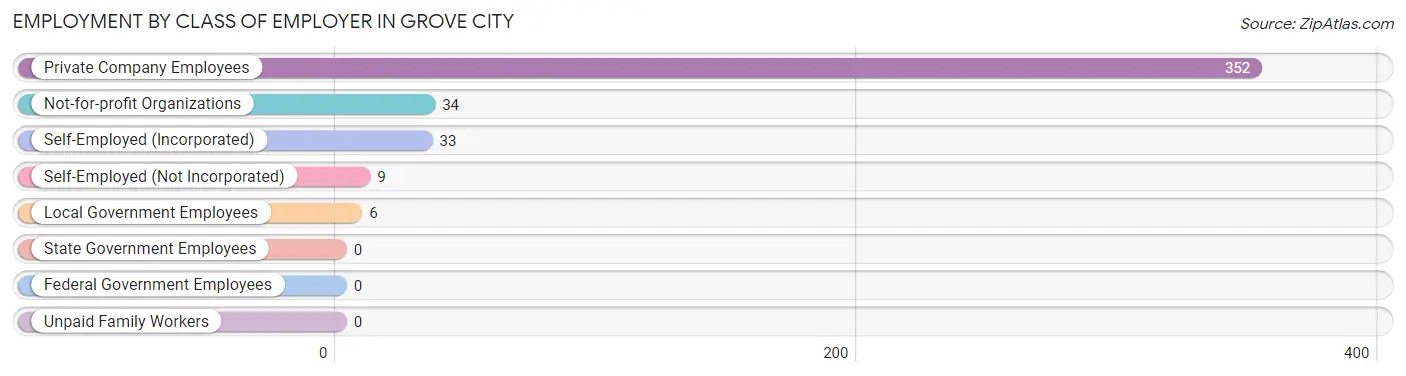
| Employer Class | # Employees | % Employees |
| Private Company Employees | 352 | 81.1% |
| Self-Employed (Incorporated) | 33 | 7.6% |
| Self-Employed (Not Incorporated) | 9 | 2.1% |
| Not-for-profit Organizations | 34 | 7.8% |
| Local Government Employees | 6 | 1.4% |
| State Government Employees | 0 | 0.0% |
| Federal Government Employees | 0 | 0.0% |
| Unpaid Family Workers | 0 | 0.0% |
| Total | 434 | 100.0% |
Employment Status by Age in Grove City
According to the labor force statistics for Grove City, out of the total population over 16 years of age (1,761), 29.0% or 511 individuals are in the labor force, with 8.2% or 42 of them unemployed. The age group with the highest labor force participation rate is 20 to 24 years, with 100.0% or 39 individuals in the labor force. Within the labor force, the 30 to 34 years age range has the highest percentage of unemployed individuals, with 100.0% or 7 of them being unemployed.
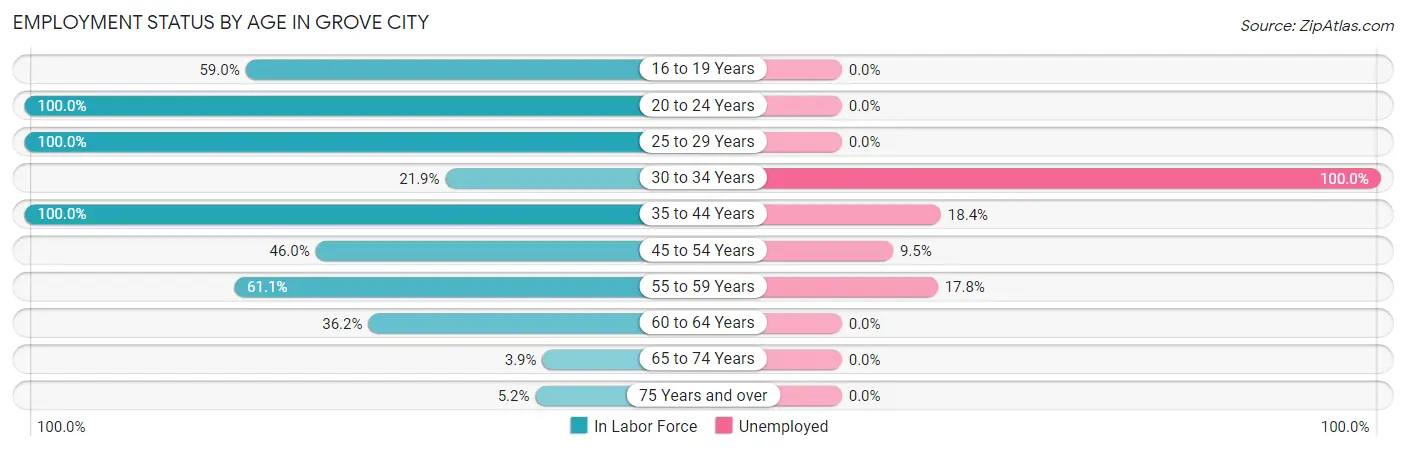
| Age Bracket | In Labor Force | Unemployed |
| 16 to 19 Years | 49 (59.0%) | 0 (0.0%) |
| 20 to 24 Years | 39 (100.0%) | 0 (0.0%) |
| 25 to 29 Years | 77 (100.0%) | 0 (0.0%) |
| 30 to 34 Years | 7 (21.9%) | 7 (100.0%) |
| 35 to 44 Years | 49 (100.0%) | 9 (18.4%) |
| 45 to 54 Years | 74 (46.0%) | 7 (9.5%) |
| 55 to 59 Years | 107 (61.1%) | 19 (17.8%) |
| 60 to 64 Years | 63 (36.2%) | 0 (0.0%) |
| 65 to 74 Years | 17 (3.9%) | 0 (0.0%) |
| 75 Years and over | 28 (5.2%) | 0 (0.0%) |
| Total | 511 (29.0%) | 42 (8.2%) |
Employment Status by Educational Attainment in Grove City
According to labor force statistics for Grove City, 56.4% of individuals (377) out of the total population between 25 and 64 years of age (668) are in the labor force, with 11.1% or 42 of them being unemployed. The group with the highest labor force participation rate are those with the educational attainment of bachelor's degree or higher, with 81.2% or 95 individuals in the labor force. Within the labor force, individuals with high school diploma education have the highest percentage of unemployment, with 18.1% or 26 of them being unemployed.
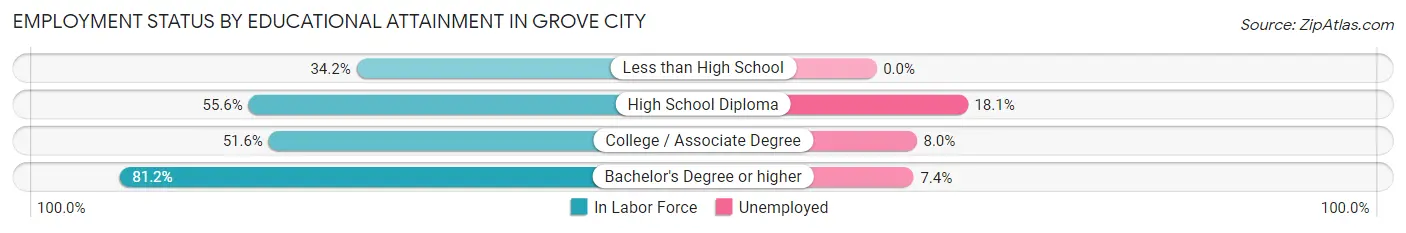
| Educational Attainment | In Labor Force | Unemployed |
| Less than High School | 25 (34.2%) | 0 (0.0%) |
| High School Diploma | 144 (55.6%) | 47 (18.1%) |
| College / Associate Degree | 113 (51.6%) | 18 (8.0%) |
| Bachelor's Degree or higher | 95 (81.2%) | 9 (7.4%) |
| Total | 377 (56.4%) | 74 (11.1%) |
Employment Occupations by Sex in Grove City
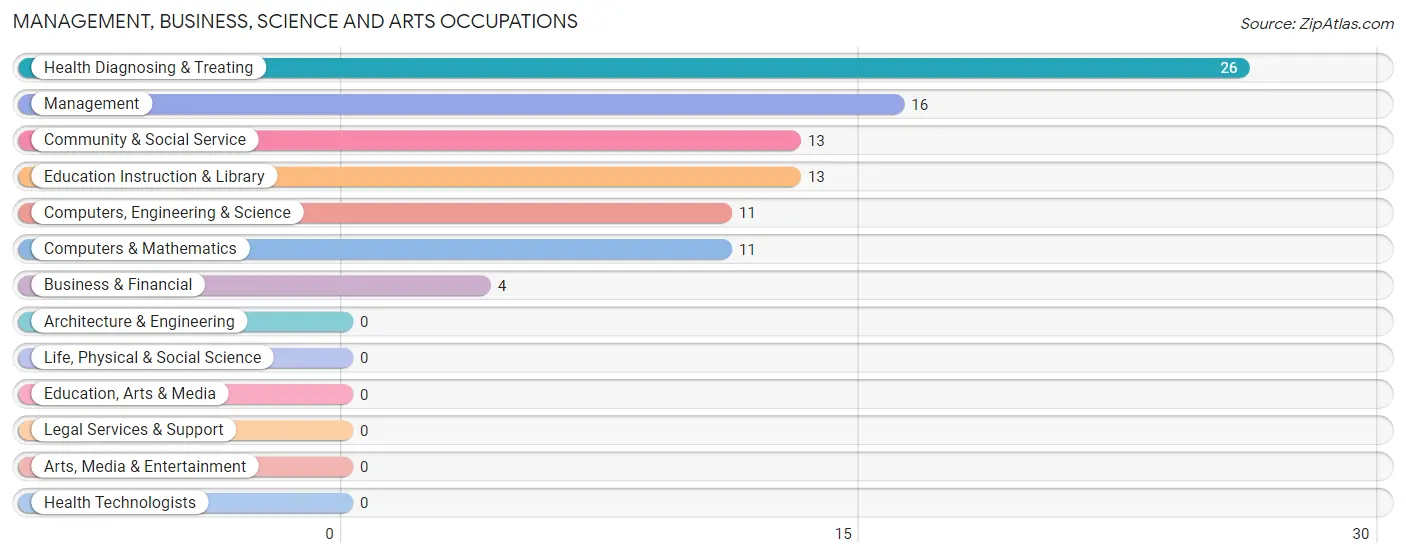
Management, Business, Science and Arts Occupations
The most common Management, Business, Science and Arts occupations in Grove City are Health Diagnosing & Treating (26 | 5.6%), Management (16 | 3.4%), Community & Social Service (13 | 2.8%), Education Instruction & Library (13 | 2.8%), and Computers, Engineering & Science (11 | 2.4%).
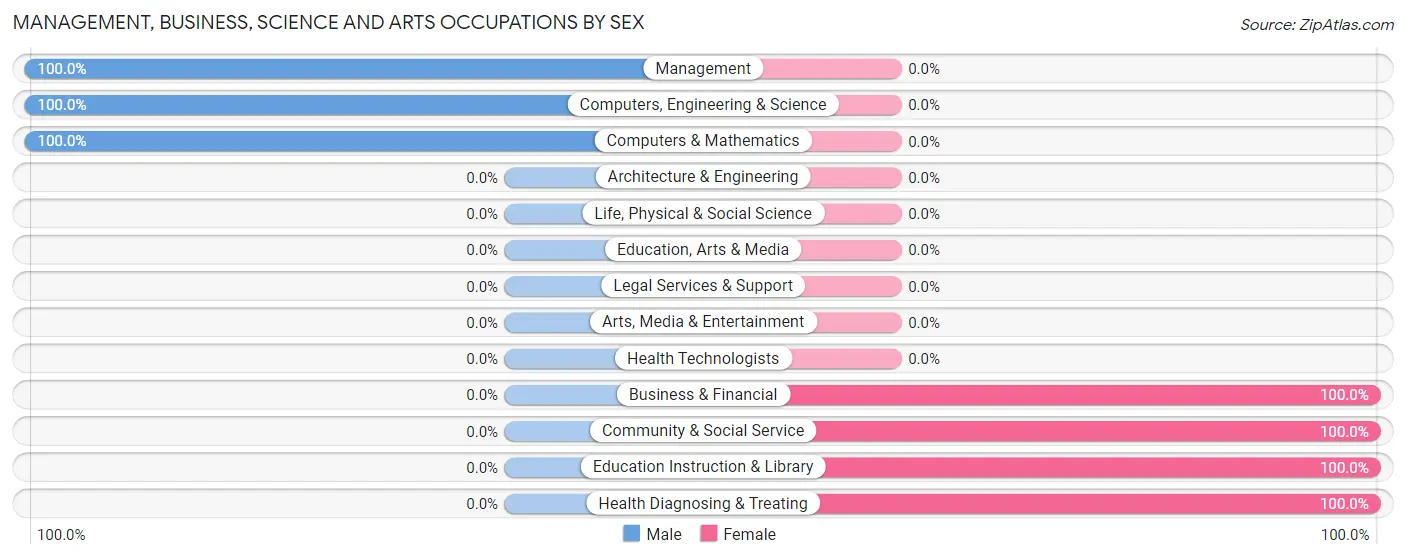
Management, Business, Science and Arts Occupations by Sex
Within the Management, Business, Science and Arts occupations in Grove City, the most male-oriented occupations are Management (100.0%), Computers, Engineering & Science (100.0%), and Computers & Mathematics (100.0%), while the most female-oriented occupations are Business & Financial (100.0%), Community & Social Service (100.0%), and Education Instruction & Library (100.0%).
| Occupation | Male | Female |
| Management | 16 (100.0%) | 0 (0.0%) |
| Business & Financial | 0 (0.0%) | 4 (100.0%) |
| Computers, Engineering & Science | 11 (100.0%) | 0 (0.0%) |
| Computers & Mathematics | 11 (100.0%) | 0 (0.0%) |
| Architecture & Engineering | 0 (0.0%) | 0 (0.0%) |
| Life, Physical & Social Science | 0 (0.0%) | 0 (0.0%) |
| Community & Social Service | 0 (0.0%) | 13 (100.0%) |
| Education, Arts & Media | 0 (0.0%) | 0 (0.0%) |
| Legal Services & Support | 0 (0.0%) | 0 (0.0%) |
| Education Instruction & Library | 0 (0.0%) | 13 (100.0%) |
| Arts, Media & Entertainment | 0 (0.0%) | 0 (0.0%) |
| Health Diagnosing & Treating | 0 (0.0%) | 26 (100.0%) |
| Health Technologists | 0 (0.0%) | 0 (0.0%) |
| Total (Category) | 27 (38.6%) | 43 (61.4%) |
| Total (Overall) | 195 (41.7%) | 273 (58.3%) |
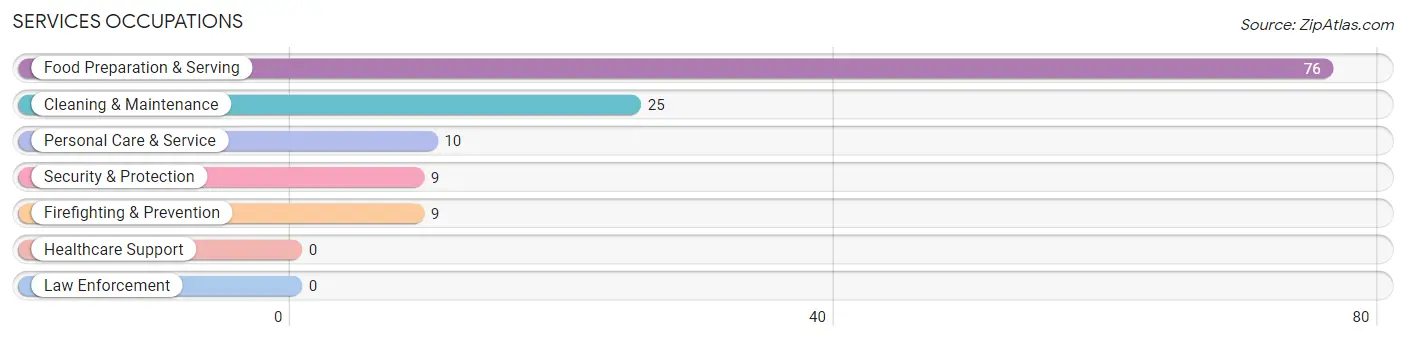
Services Occupations
The most common Services occupations in Grove City are Food Preparation & Serving (76 | 16.2%), Cleaning & Maintenance (25 | 5.3%), Personal Care & Service (10 | 2.1%), Security & Protection (9 | 1.9%), and Firefighting & Prevention (9 | 1.9%).
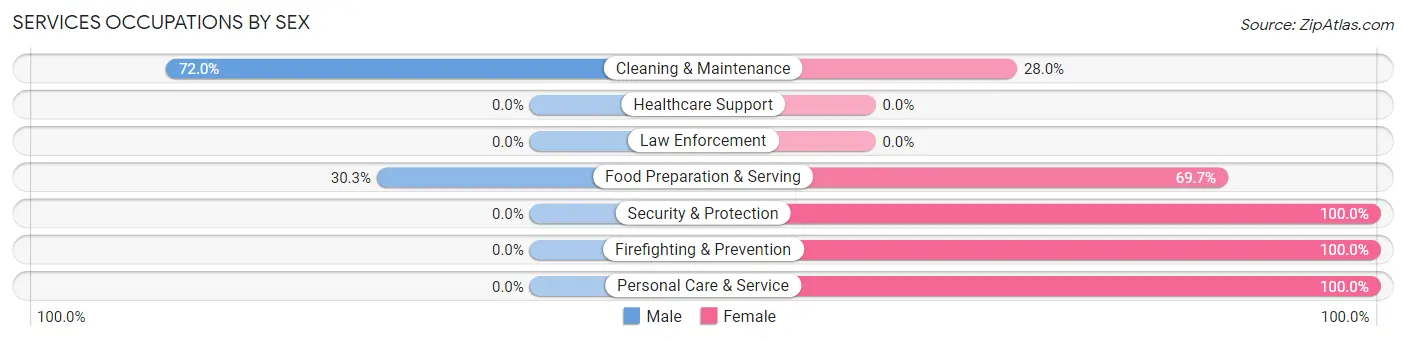
Services Occupations by Sex
Within the Services occupations in Grove City, the most male-oriented occupations are Cleaning & Maintenance (72.0%), and Food Preparation & Serving (30.3%), while the most female-oriented occupations are Security & Protection (100.0%), Firefighting & Prevention (100.0%), and Personal Care & Service (100.0%).
| Occupation | Male | Female |
| Healthcare Support | 0 (0.0%) | 0 (0.0%) |
| Security & Protection | 0 (0.0%) | 9 (100.0%) |
| Firefighting & Prevention | 0 (0.0%) | 9 (100.0%) |
| Law Enforcement | 0 (0.0%) | 0 (0.0%) |
| Food Preparation & Serving | 23 (30.3%) | 53 (69.7%) |
| Cleaning & Maintenance | 18 (72.0%) | 7 (28.0%) |
| Personal Care & Service | 0 (0.0%) | 10 (100.0%) |
| Total (Category) | 41 (34.2%) | 79 (65.8%) |
| Total (Overall) | 195 (41.7%) | 273 (58.3%) |
Sales and Office Occupations
The most common Sales and Office occupations in Grove City are Office & Administration (78 | 16.7%), and Sales & Related (62 | 13.3%).
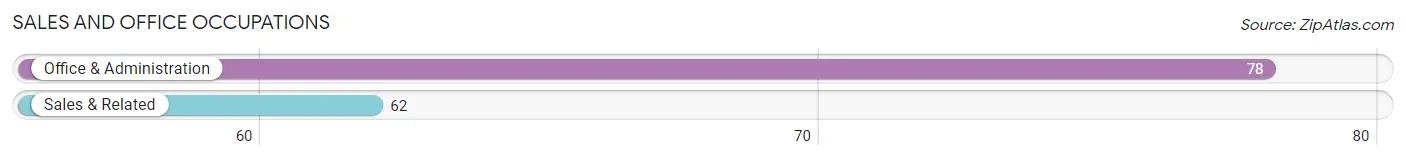
Sales and Office Occupations by Sex

| Occupation | Male | Female |
| Sales & Related | 25 (40.3%) | 37 (59.7%) |
| Office & Administration | 15 (19.2%) | 63 (80.8%) |
| Total (Category) | 40 (28.6%) | 100 (71.4%) |
| Total (Overall) | 195 (41.7%) | 273 (58.3%) |
Natural Resources, Construction and Maintenance Occupations
The most common Natural Resources, Construction and Maintenance occupations in Grove City are , and Construction & Extraction (66 | 14.1%).

Natural Resources, Construction and Maintenance Occupations by Sex
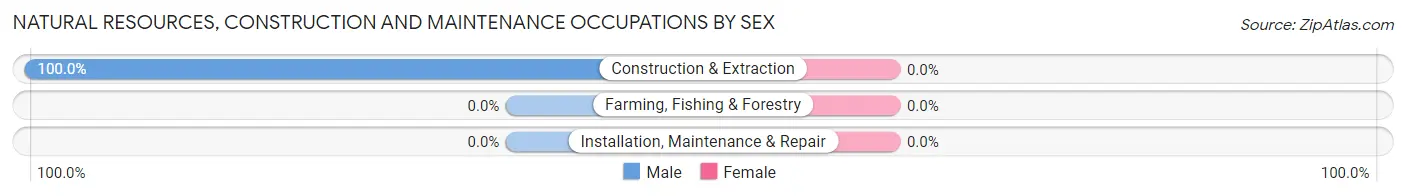
| Occupation | Male | Female |
| Farming, Fishing & Forestry | 0 (0.0%) | 0 (0.0%) |
| Construction & Extraction | 66 (100.0%) | 0 (0.0%) |
| Installation, Maintenance & Repair | 0 (0.0%) | 0 (0.0%) |
| Total (Category) | 66 (100.0%) | 0 (0.0%) |
| Total (Overall) | 195 (41.7%) | 273 (58.3%) |
Production, Transportation and Moving Occupations
The most common Production, Transportation and Moving occupations in Grove City are Production (51 | 10.9%), and Transportation (21 | 4.5%).
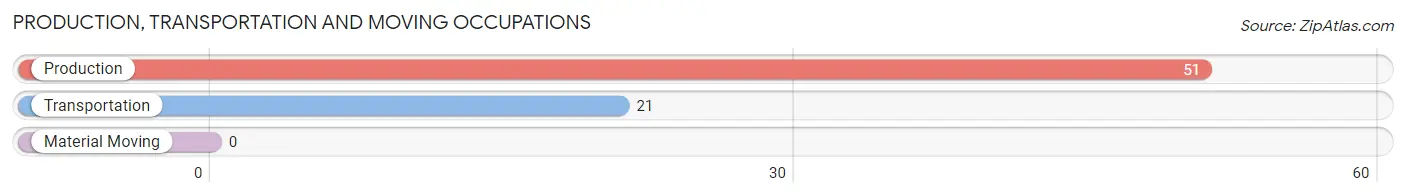
Production, Transportation and Moving Occupations by Sex
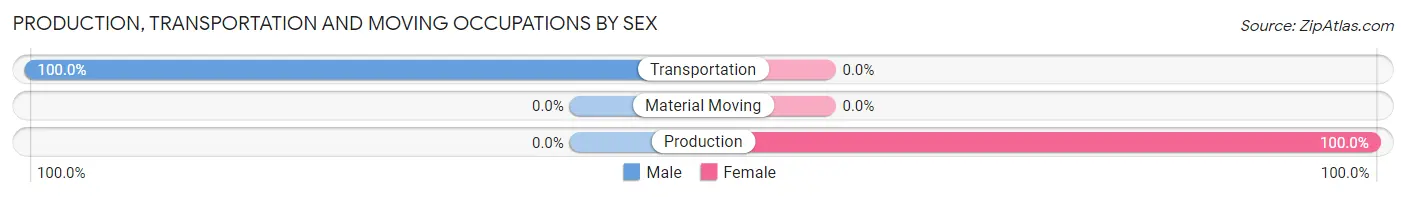
| Occupation | Male | Female |
| Production | 0 (0.0%) | 51 (100.0%) |
| Transportation | 21 (100.0%) | 0 (0.0%) |
| Material Moving | 0 (0.0%) | 0 (0.0%) |
| Total (Category) | 21 (29.2%) | 51 (70.8%) |
| Total (Overall) | 195 (41.7%) | 273 (58.3%) |
Employment Industries by Sex in Grove City
Employment Industries in Grove City
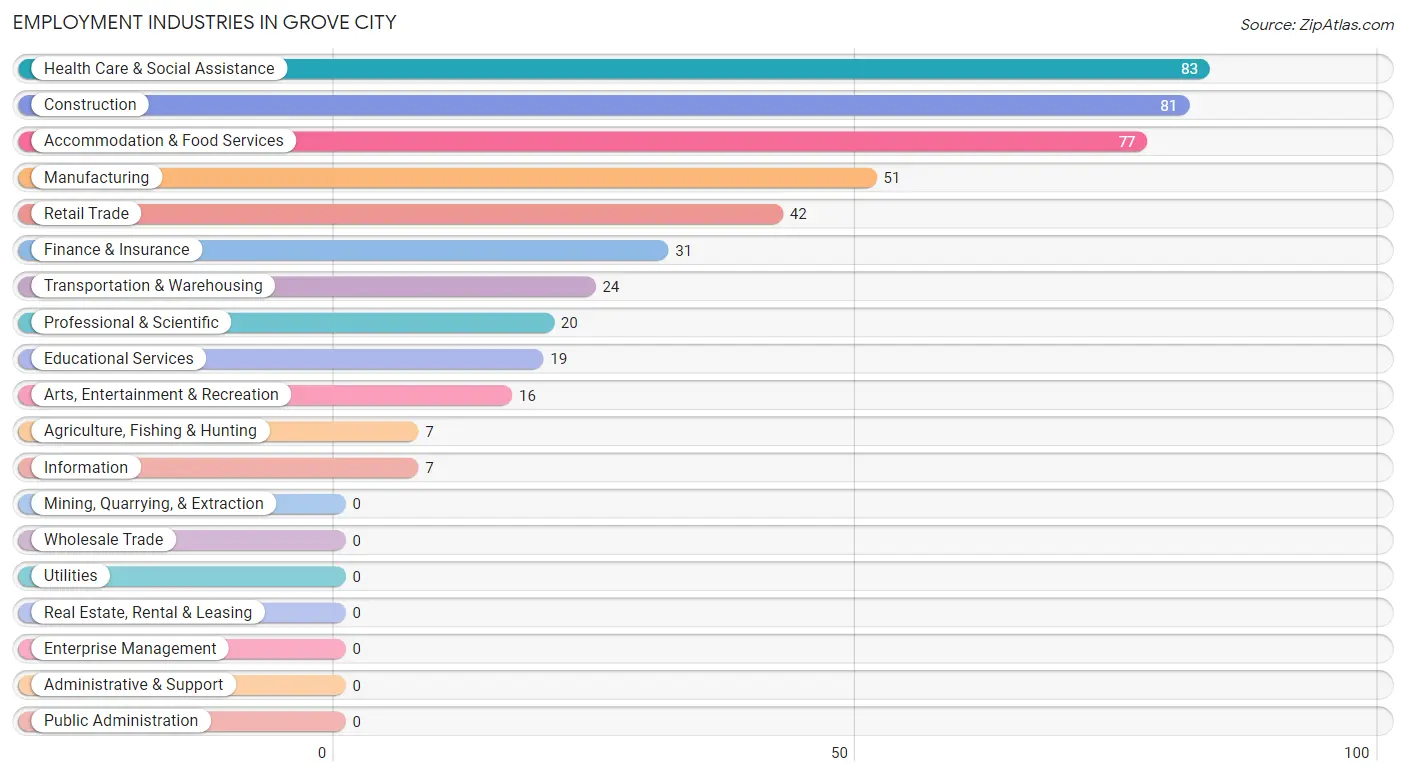
The major employment industries in Grove City include Health Care & Social Assistance (83 | 17.7%), Construction (81 | 17.3%), Accommodation & Food Services (77 | 16.5%), Manufacturing (51 | 10.9%), and Retail Trade (42 | 9.0%).
Employment Industries by Sex in Grove City
The Grove City industries that see more men than women are Transportation & Warehousing (100.0%), Information (100.0%), and Arts, Entertainment & Recreation (100.0%), whereas the industries that tend to have a higher number of women are Agriculture, Fishing & Hunting (100.0%), Manufacturing (100.0%), and Retail Trade (100.0%).
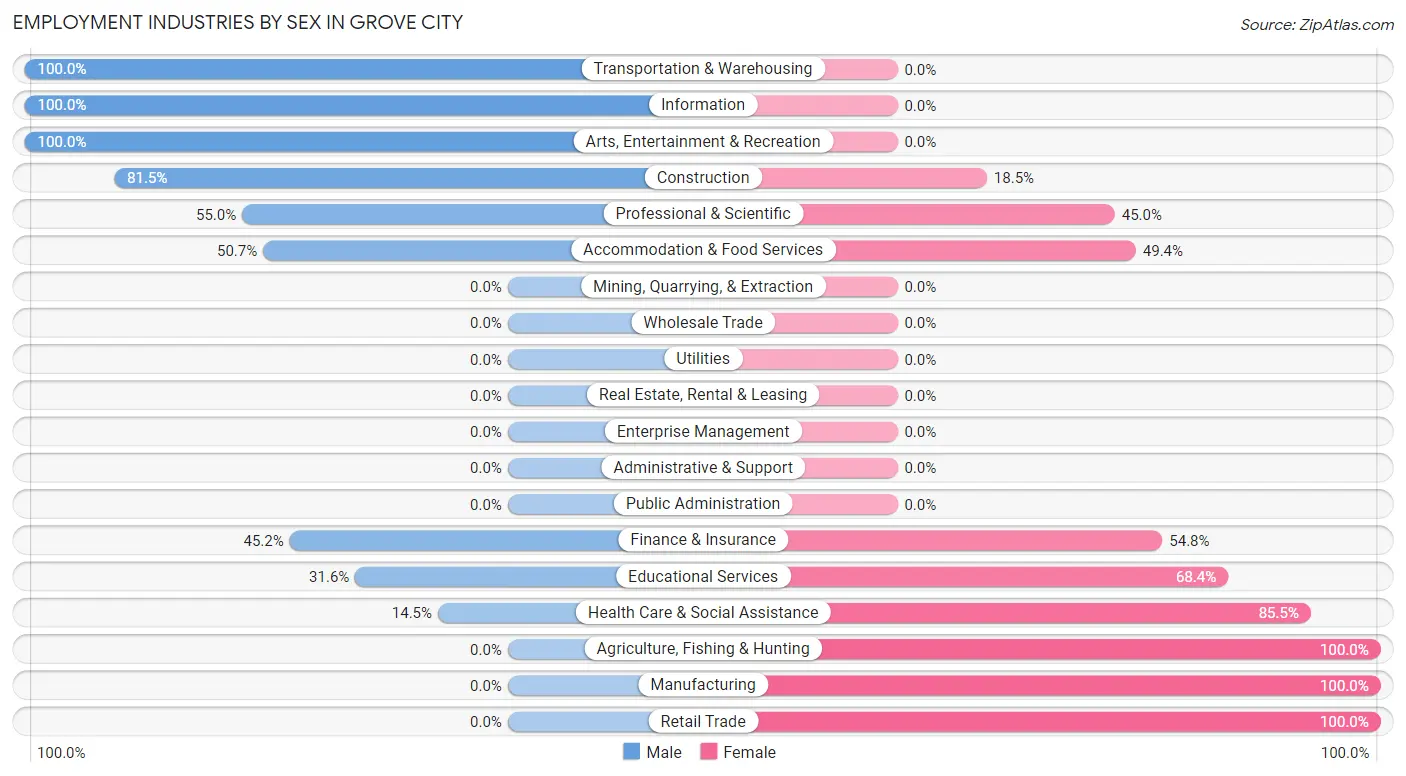
| Industry | Male | Female |
| Agriculture, Fishing & Hunting | 0 (0.0%) | 7 (100.0%) |
| Mining, Quarrying, & Extraction | 0 (0.0%) | 0 (0.0%) |
| Construction | 66 (81.5%) | 15 (18.5%) |
| Manufacturing | 0 (0.0%) | 51 (100.0%) |
| Wholesale Trade | 0 (0.0%) | 0 (0.0%) |
| Retail Trade | 0 (0.0%) | 42 (100.0%) |
| Transportation & Warehousing | 24 (100.0%) | 0 (0.0%) |
| Utilities | 0 (0.0%) | 0 (0.0%) |
| Information | 7 (100.0%) | 0 (0.0%) |
| Finance & Insurance | 14 (45.2%) | 17 (54.8%) |
| Real Estate, Rental & Leasing | 0 (0.0%) | 0 (0.0%) |
| Professional & Scientific | 11 (55.0%) | 9 (45.0%) |
| Enterprise Management | 0 (0.0%) | 0 (0.0%) |
| Administrative & Support | 0 (0.0%) | 0 (0.0%) |
| Educational Services | 6 (31.6%) | 13 (68.4%) |
| Health Care & Social Assistance | 12 (14.5%) | 71 (85.5%) |
| Arts, Entertainment & Recreation | 16 (100.0%) | 0 (0.0%) |
| Accommodation & Food Services | 39 (50.6%) | 38 (49.3%) |
| Public Administration | 0 (0.0%) | 0 (0.0%) |
| Total | 195 (41.7%) | 273 (58.3%) |
Education in Grove City
School Enrollment in Grove City
The most common levels of schooling among the 130 students in Grove City are high school (63 | 48.5%), college / undergraduate (39 | 30.0%), and middle school (16 | 12.3%).
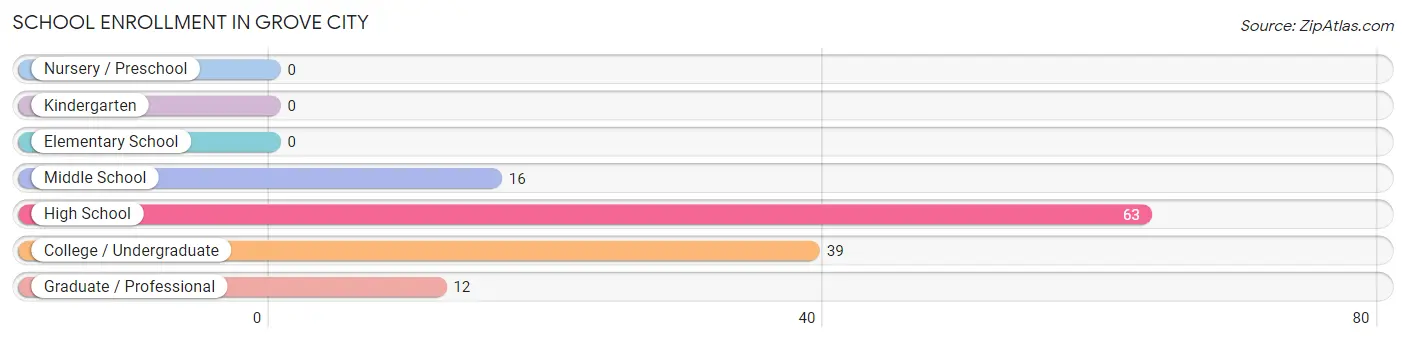
| School Level | # Students | % Students |
| Nursery / Preschool | 0 | 0.0% |
| Kindergarten | 0 | 0.0% |
| Elementary School | 0 | 0.0% |
| Middle School | 16 | 12.3% |
| High School | 63 | 48.5% |
| College / Undergraduate | 39 | 30.0% |
| Graduate / Professional | 12 | 9.2% |
| Total | 130 | 100.0% |
School Enrollment by Age by Funding Source in Grove City
Out of a total of 130 students who are enrolled in schools in Grove City, 12 (9.2%) attend a private institution, while the remaining 118 (90.8%) are enrolled in public schools. The age group of 35 years and over has the highest likelihood of being enrolled in private schools, with 12 (100.0% in the age bracket) enrolled. Conversely, the age group of 10 to 14 year olds has the lowest likelihood of being enrolled in a private school, with 26 (100.0% in the age bracket) attending a public institution.
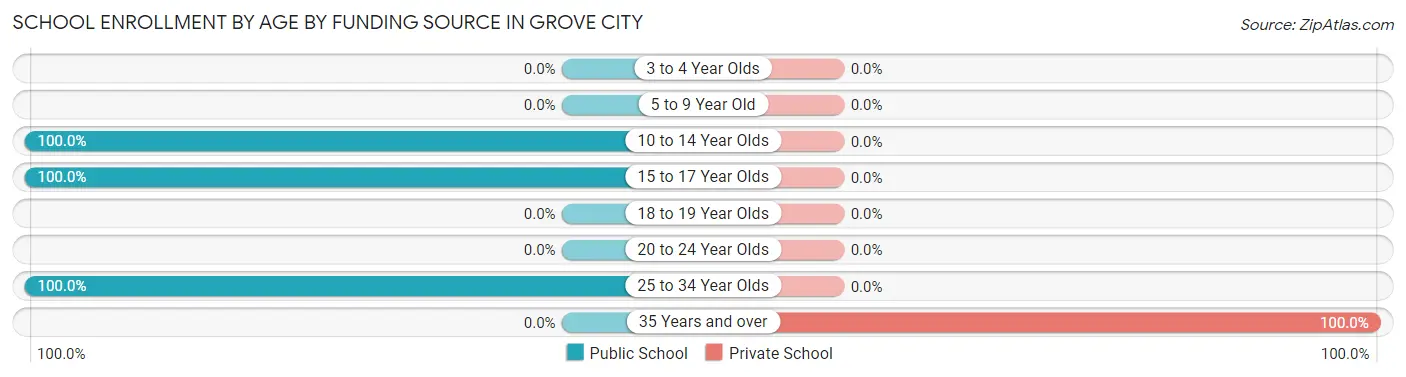
| Age Bracket | Public School | Private School |
| 3 to 4 Year Olds | 0 (0.0%) | 0 (0.0%) |
| 5 to 9 Year Old | 0 (0.0%) | 0 (0.0%) |
| 10 to 14 Year Olds | 26 (100.0%) | 0 (0.0%) |
| 15 to 17 Year Olds | 53 (100.0%) | 0 (0.0%) |
| 18 to 19 Year Olds | 0 (0.0%) | 0 (0.0%) |
| 20 to 24 Year Olds | 0 (0.0%) | 0 (0.0%) |
| 25 to 34 Year Olds | 39 (100.0%) | 0 (0.0%) |
| 35 Years and over | 0 (0.0%) | 12 (100.0%) |
| Total | 118 (90.8%) | 12 (9.2%) |
Educational Attainment by Field of Study in Grove City
Business (108 | 26.7%), social sciences (59 | 14.6%), literature & languages (57 | 14.1%), education (49 | 12.1%), and engineering (32 | 7.9%) are the most common fields of study among 404 individuals in Grove City who have obtained a bachelor's degree or higher.
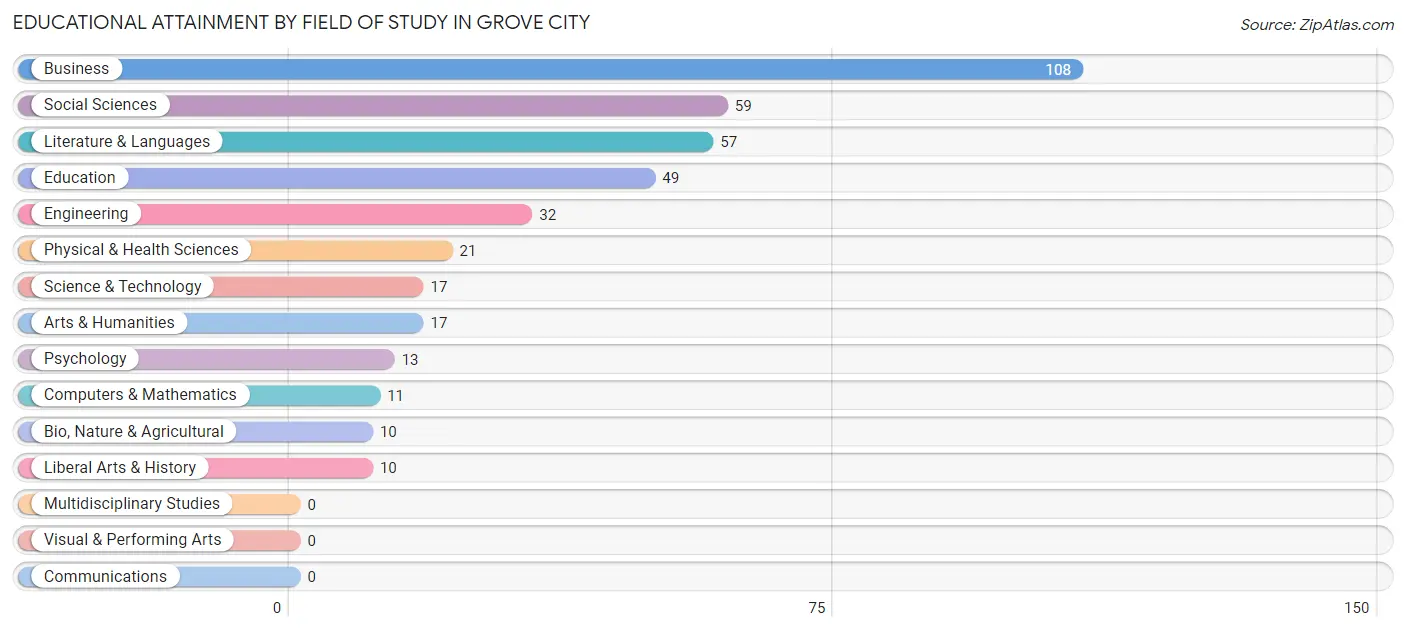
| Field of Study | # Graduates | % Graduates |
| Computers & Mathematics | 11 | 2.7% |
| Bio, Nature & Agricultural | 10 | 2.5% |
| Physical & Health Sciences | 21 | 5.2% |
| Psychology | 13 | 3.2% |
| Social Sciences | 59 | 14.6% |
| Engineering | 32 | 7.9% |
| Multidisciplinary Studies | 0 | 0.0% |
| Science & Technology | 17 | 4.2% |
| Business | 108 | 26.7% |
| Education | 49 | 12.1% |
| Literature & Languages | 57 | 14.1% |
| Liberal Arts & History | 10 | 2.5% |
| Visual & Performing Arts | 0 | 0.0% |
| Communications | 0 | 0.0% |
| Arts & Humanities | 17 | 4.2% |
| Total | 404 | 100.0% |
Transportation & Commute in Grove City
Vehicle Availability by Sex in Grove City
The most prevalent vehicle ownership categories in Grove City are males with 2 vehicles (74, accounting for 38.0%) and females with 2 vehicles (52, making up 31.0%).
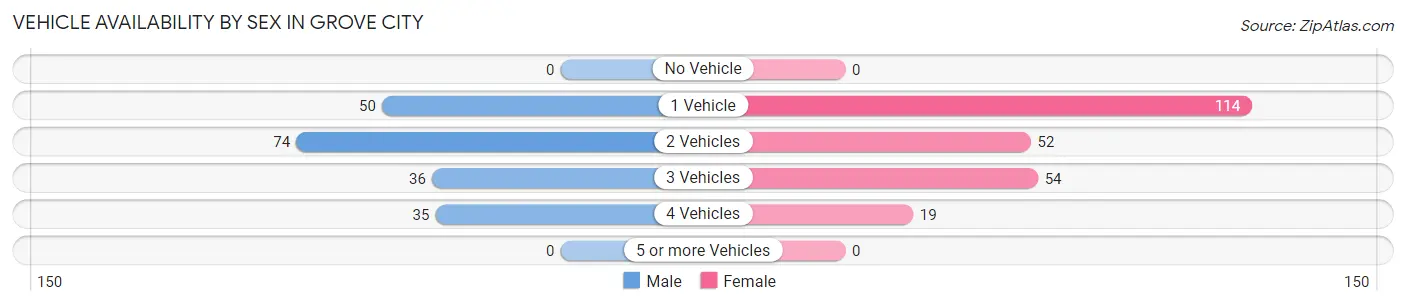
| Vehicles Available | Male | Female |
| No Vehicle | 0 (0.0%) | 0 (0.0%) |
| 1 Vehicle | 50 (25.6%) | 114 (47.7%) |
| 2 Vehicles | 74 (38.0%) | 52 (21.8%) |
| 3 Vehicles | 36 (18.5%) | 54 (22.6%) |
| 4 Vehicles | 35 (17.9%) | 19 (8.0%) |
| 5 or more Vehicles | 0 (0.0%) | 0 (0.0%) |
| Total | 195 (100.0%) | 239 (100.0%) |
Commute Time in Grove City
The most frequently occuring commute durations in Grove City are 30 to 34 minutes (80 commuters, 24.8%), 5 to 9 minutes (57 commuters, 17.7%), and 25 to 29 minutes (32 commuters, 9.9%).
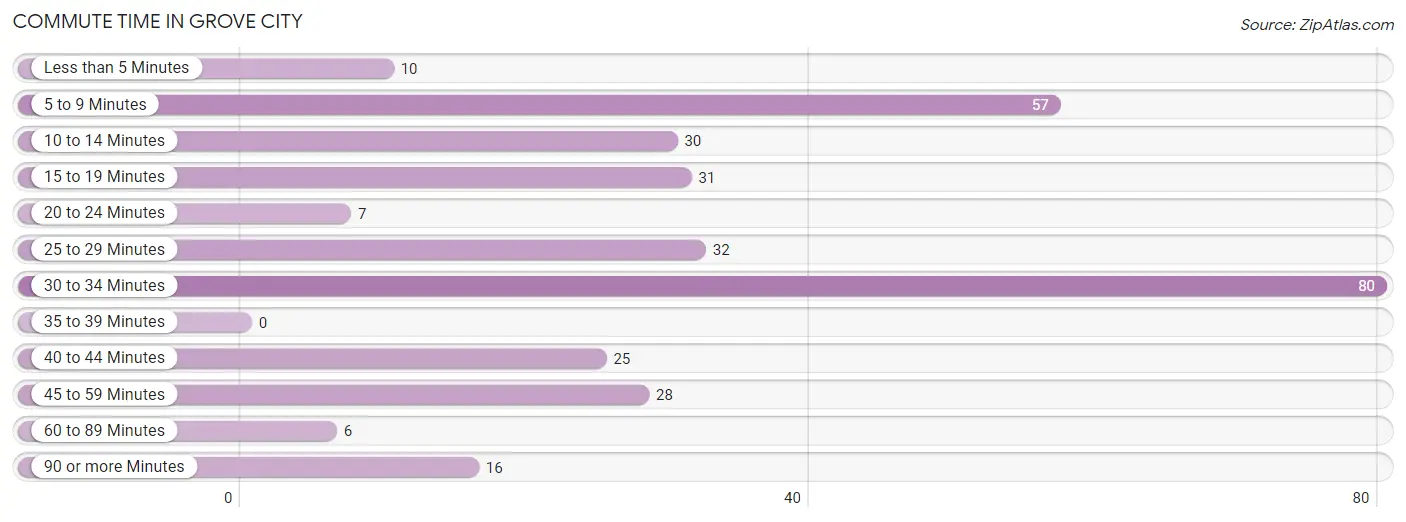
| Commute Time | # Commuters | % Commuters |
| Less than 5 Minutes | 10 | 3.1% |
| 5 to 9 Minutes | 57 | 17.7% |
| 10 to 14 Minutes | 30 | 9.3% |
| 15 to 19 Minutes | 31 | 9.6% |
| 20 to 24 Minutes | 7 | 2.2% |
| 25 to 29 Minutes | 32 | 9.9% |
| 30 to 34 Minutes | 80 | 24.8% |
| 35 to 39 Minutes | 0 | 0.0% |
| 40 to 44 Minutes | 25 | 7.8% |
| 45 to 59 Minutes | 28 | 8.7% |
| 60 to 89 Minutes | 6 | 1.9% |
| 90 or more Minutes | 16 | 5.0% |
Commute Time by Sex in Grove City
The most common commute times in Grove City are 25 to 29 minutes (32 commuters, 20.4%) for males and 30 to 34 minutes (68 commuters, 41.2%) for females.
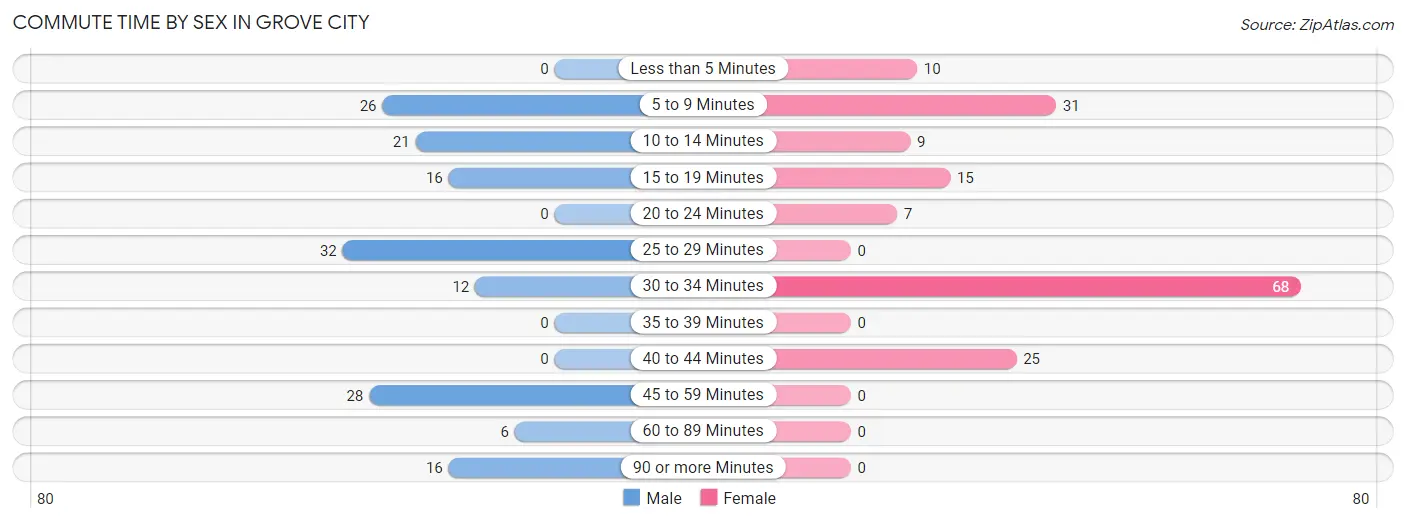
| Commute Time | Male | Female |
| Less than 5 Minutes | 0 (0.0%) | 10 (6.1%) |
| 5 to 9 Minutes | 26 (16.6%) | 31 (18.8%) |
| 10 to 14 Minutes | 21 (13.4%) | 9 (5.4%) |
| 15 to 19 Minutes | 16 (10.2%) | 15 (9.1%) |
| 20 to 24 Minutes | 0 (0.0%) | 7 (4.2%) |
| 25 to 29 Minutes | 32 (20.4%) | 0 (0.0%) |
| 30 to 34 Minutes | 12 (7.6%) | 68 (41.2%) |
| 35 to 39 Minutes | 0 (0.0%) | 0 (0.0%) |
| 40 to 44 Minutes | 0 (0.0%) | 25 (15.1%) |
| 45 to 59 Minutes | 28 (17.8%) | 0 (0.0%) |
| 60 to 89 Minutes | 6 (3.8%) | 0 (0.0%) |
| 90 or more Minutes | 16 (10.2%) | 0 (0.0%) |
Time of Departure to Work by Sex in Grove City
The most frequent times of departure to work in Grove City are 12:00 PM to 3:59 PM (45, 28.7%) for males and 12:00 AM to 4:59 AM (51, 30.9%) for females.
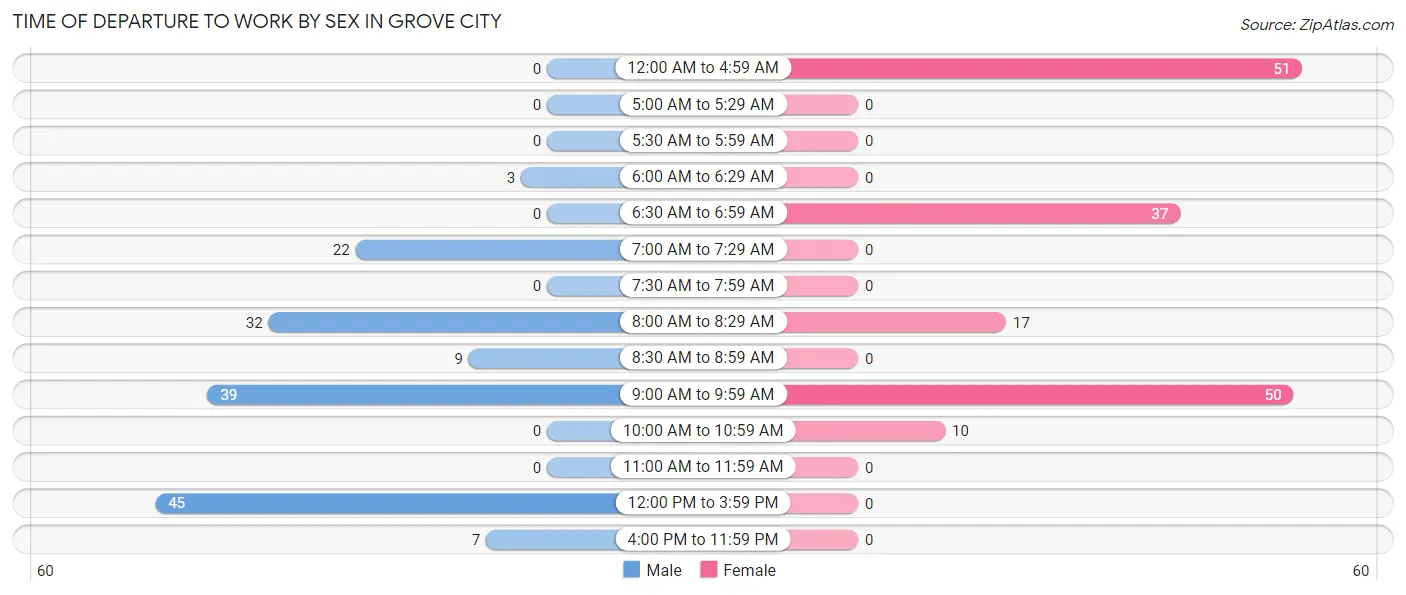
| Time of Departure | Male | Female |
| 12:00 AM to 4:59 AM | 0 (0.0%) | 51 (30.9%) |
| 5:00 AM to 5:29 AM | 0 (0.0%) | 0 (0.0%) |
| 5:30 AM to 5:59 AM | 0 (0.0%) | 0 (0.0%) |
| 6:00 AM to 6:29 AM | 3 (1.9%) | 0 (0.0%) |
| 6:30 AM to 6:59 AM | 0 (0.0%) | 37 (22.4%) |
| 7:00 AM to 7:29 AM | 22 (14.0%) | 0 (0.0%) |
| 7:30 AM to 7:59 AM | 0 (0.0%) | 0 (0.0%) |
| 8:00 AM to 8:29 AM | 32 (20.4%) | 17 (10.3%) |
| 8:30 AM to 8:59 AM | 9 (5.7%) | 0 (0.0%) |
| 9:00 AM to 9:59 AM | 39 (24.8%) | 50 (30.3%) |
| 10:00 AM to 10:59 AM | 0 (0.0%) | 10 (6.1%) |
| 11:00 AM to 11:59 AM | 0 (0.0%) | 0 (0.0%) |
| 12:00 PM to 3:59 PM | 45 (28.7%) | 0 (0.0%) |
| 4:00 PM to 11:59 PM | 7 (4.5%) | 0 (0.0%) |
| Total | 157 (100.0%) | 165 (100.0%) |
Housing Occupancy in Grove City
Occupancy by Ownership in Grove City
Of the total 1,031 dwellings in Grove City, owner-occupied units account for 665 (64.5%), while renter-occupied units make up 366 (35.5%).
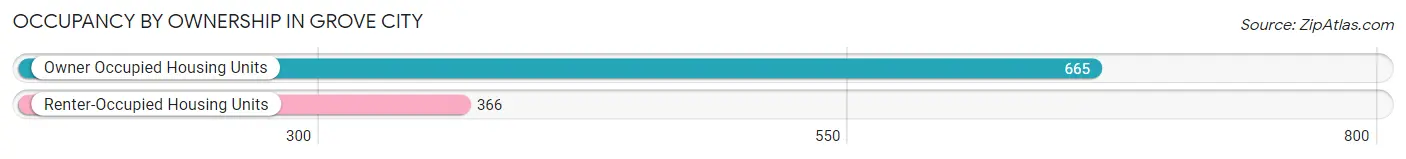
| Occupancy | # Housing Units | % Housing Units |
| Owner Occupied Housing Units | 665 | 64.5% |
| Renter-Occupied Housing Units | 366 | 35.5% |
| Total Occupied Housing Units | 1,031 | 100.0% |
Occupancy by Household Size in Grove City
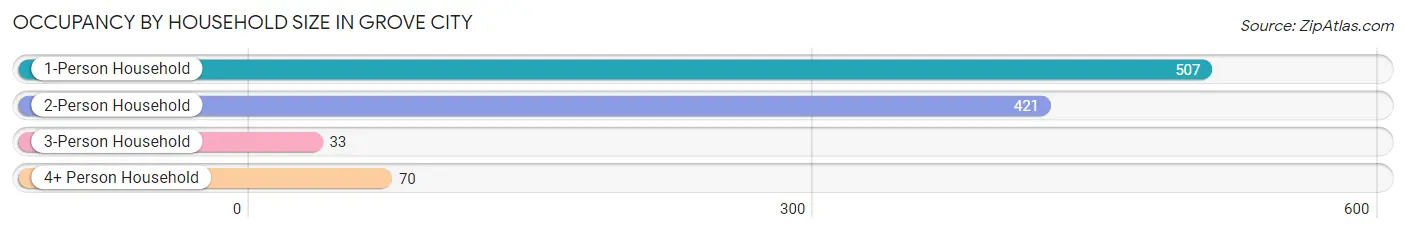
| Household Size | # Housing Units | % Housing Units |
| 1-Person Household | 507 | 49.2% |
| 2-Person Household | 421 | 40.8% |
| 3-Person Household | 33 | 3.2% |
| 4+ Person Household | 70 | 6.8% |
| Total Housing Units | 1,031 | 100.0% |
Occupancy by Ownership by Household Size in Grove City
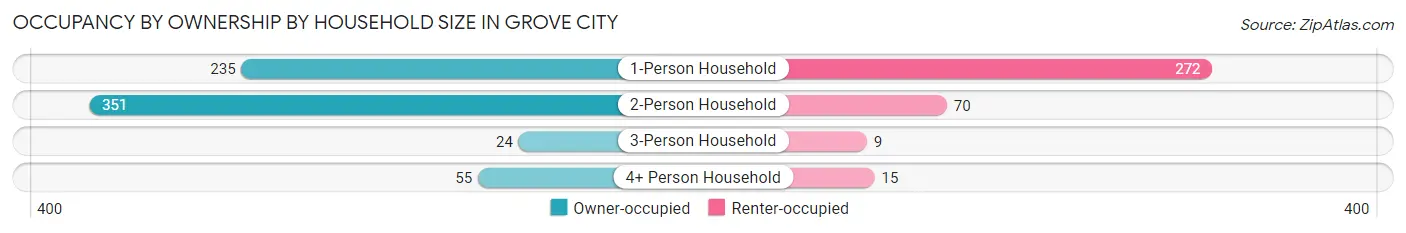
| Household Size | Owner-occupied | Renter-occupied |
| 1-Person Household | 235 (46.4%) | 272 (53.6%) |
| 2-Person Household | 351 (83.4%) | 70 (16.6%) |
| 3-Person Household | 24 (72.7%) | 9 (27.3%) |
| 4+ Person Household | 55 (78.6%) | 15 (21.4%) |
| Total Housing Units | 665 (64.5%) | 366 (35.5%) |
Occupancy by Educational Attainment in Grove City
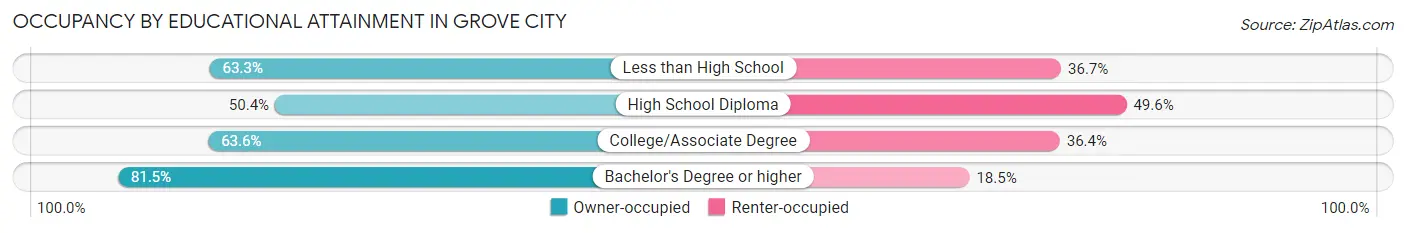
| Household Size | Owner-occupied | Renter-occupied |
| Less than High School | 95 (63.3%) | 55 (36.7%) |
| High School Diploma | 136 (50.4%) | 134 (49.6%) |
| College/Associate Degree | 227 (63.6%) | 130 (36.4%) |
| Bachelor's Degree or higher | 207 (81.5%) | 47 (18.5%) |
Occupancy by Age of Householder in Grove City
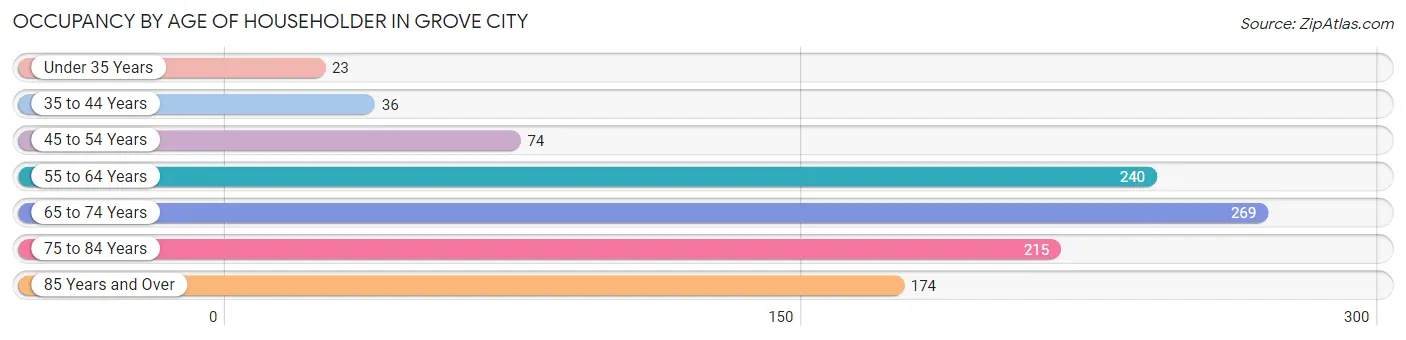
| Age Bracket | # Households | % Households |
| Under 35 Years | 23 | 2.2% |
| 35 to 44 Years | 36 | 3.5% |
| 45 to 54 Years | 74 | 7.2% |
| 55 to 64 Years | 240 | 23.3% |
| 65 to 74 Years | 269 | 26.1% |
| 75 to 84 Years | 215 | 20.8% |
| 85 Years and Over | 174 | 16.9% |
| Total | 1,031 | 100.0% |
Housing Finances in Grove City
Median Income by Occupancy in Grove City
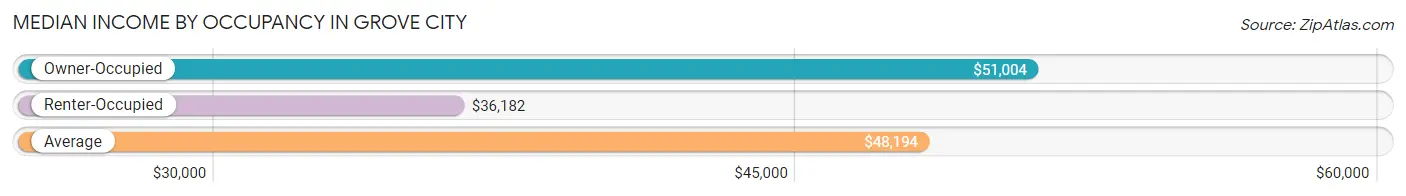
| Occupancy Type | # Households | Median Income |
| Owner-Occupied | 665 (64.5%) | $51,004 |
| Renter-Occupied | 366 (35.5%) | $36,182 |
| Average | 1,031 (100.0%) | $48,194 |
Occupancy by Householder Income Bracket in Grove City
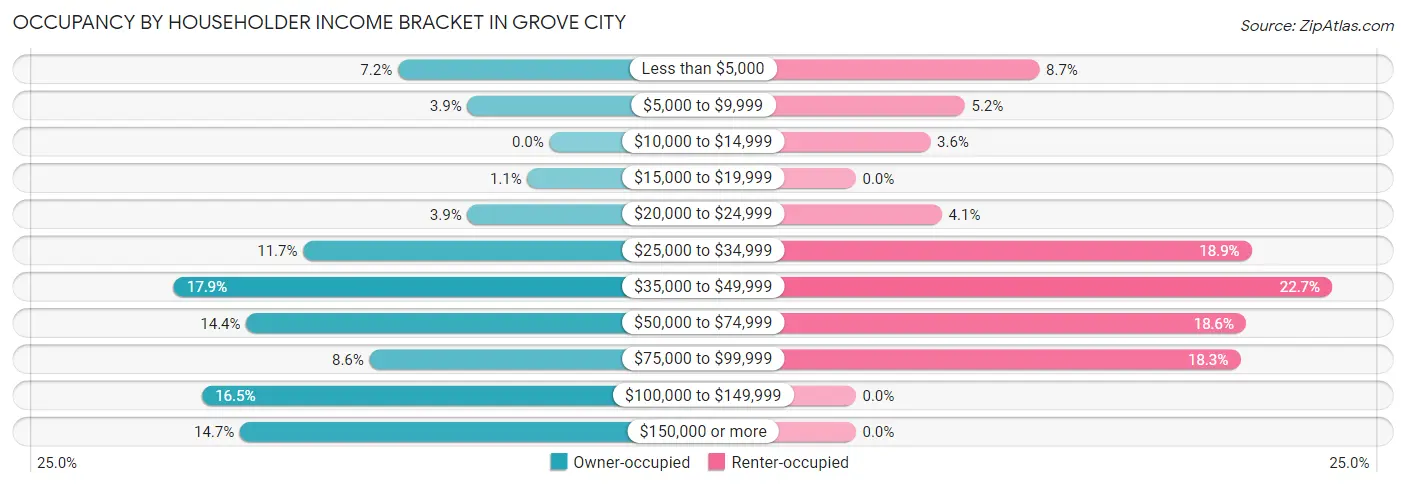
| Income Bracket | Owner-occupied | Renter-occupied |
| Less than $5,000 | 48 (7.2%) | 32 (8.7%) |
| $5,000 to $9,999 | 26 (3.9%) | 19 (5.2%) |
| $10,000 to $14,999 | 0 (0.0%) | 13 (3.5%) |
| $15,000 to $19,999 | 7 (1.1%) | 0 (0.0%) |
| $20,000 to $24,999 | 26 (3.9%) | 15 (4.1%) |
| $25,000 to $34,999 | 78 (11.7%) | 69 (18.9%) |
| $35,000 to $49,999 | 119 (17.9%) | 83 (22.7%) |
| $50,000 to $74,999 | 96 (14.4%) | 68 (18.6%) |
| $75,000 to $99,999 | 57 (8.6%) | 67 (18.3%) |
| $100,000 to $149,999 | 110 (16.5%) | 0 (0.0%) |
| $150,000 or more | 98 (14.7%) | 0 (0.0%) |
| Total | 665 (100.0%) | 366 (100.0%) |
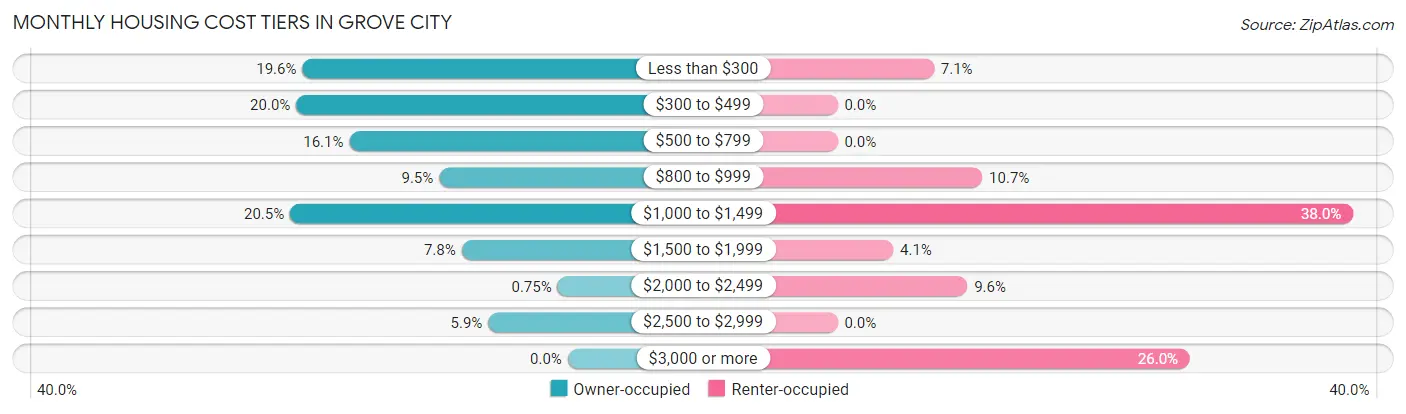
Monthly Housing Cost Tiers in Grove City
| Monthly Cost | Owner-occupied | Renter-occupied |
| Less than $300 | 130 (19.6%) | 26 (7.1%) |
| $300 to $499 | 133 (20.0%) | 0 (0.0%) |
| $500 to $799 | 107 (16.1%) | 0 (0.0%) |
| $800 to $999 | 63 (9.5%) | 39 (10.7%) |
| $1,000 to $1,499 | 136 (20.4%) | 139 (38.0%) |
| $1,500 to $1,999 | 52 (7.8%) | 15 (4.1%) |
| $2,000 to $2,499 | 5 (0.7%) | 35 (9.6%) |
| $2,500 to $2,999 | 39 (5.9%) | 0 (0.0%) |
| $3,000 or more | 0 (0.0%) | 95 (26.0%) |
| Total | 665 (100.0%) | 366 (100.0%) |
Physical Housing Characteristics in Grove City
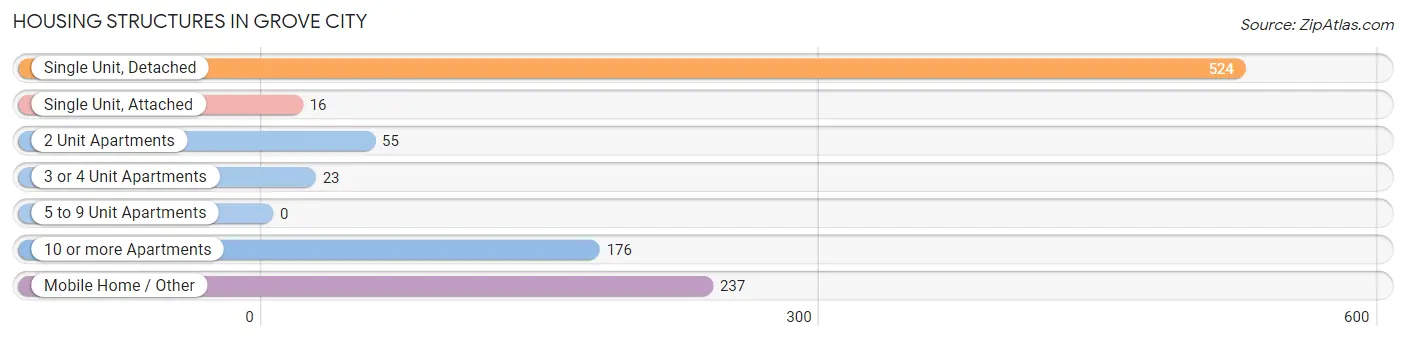
Housing Structures in Grove City
| Structure Type | # Housing Units | % Housing Units |
| Single Unit, Detached | 524 | 50.8% |
| Single Unit, Attached | 16 | 1.5% |
| 2 Unit Apartments | 55 | 5.3% |
| 3 or 4 Unit Apartments | 23 | 2.2% |
| 5 to 9 Unit Apartments | 0 | 0.0% |
| 10 or more Apartments | 176 | 17.1% |
| Mobile Home / Other | 237 | 23.0% |
| Total | 1,031 | 100.0% |
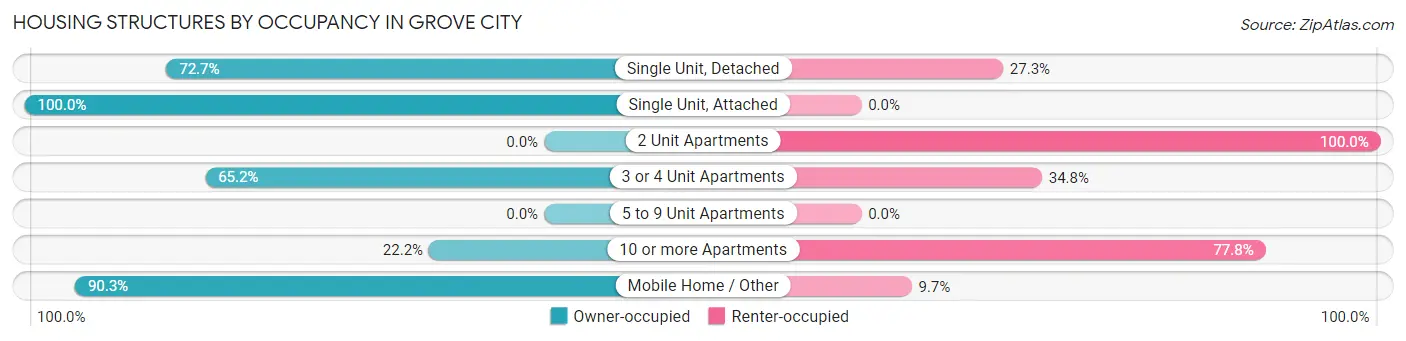
Housing Structures by Occupancy in Grove City
| Structure Type | Owner-occupied | Renter-occupied |
| Single Unit, Detached | 381 (72.7%) | 143 (27.3%) |
| Single Unit, Attached | 16 (100.0%) | 0 (0.0%) |
| 2 Unit Apartments | 0 (0.0%) | 55 (100.0%) |
| 3 or 4 Unit Apartments | 15 (65.2%) | 8 (34.8%) |
| 5 to 9 Unit Apartments | 0 (0.0%) | 0 (0.0%) |
| 10 or more Apartments | 39 (22.2%) | 137 (77.8%) |
| Mobile Home / Other | 214 (90.3%) | 23 (9.7%) |
| Total | 665 (64.5%) | 366 (35.5%) |
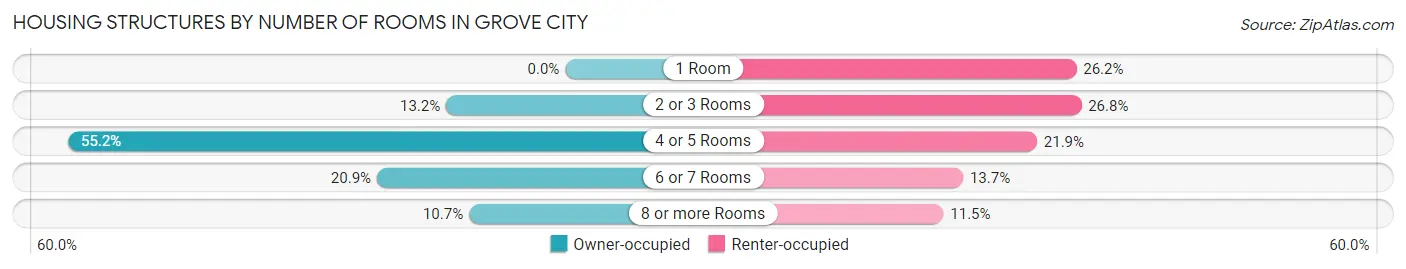
Housing Structures by Number of Rooms in Grove City
| Number of Rooms | Owner-occupied | Renter-occupied |
| 1 Room | 0 (0.0%) | 96 (26.2%) |
| 2 or 3 Rooms | 88 (13.2%) | 98 (26.8%) |
| 4 or 5 Rooms | 367 (55.2%) | 80 (21.9%) |
| 6 or 7 Rooms | 139 (20.9%) | 50 (13.7%) |
| 8 or more Rooms | 71 (10.7%) | 42 (11.5%) |
| Total | 665 (100.0%) | 366 (100.0%) |
Housing Structure by Heating Type in Grove City
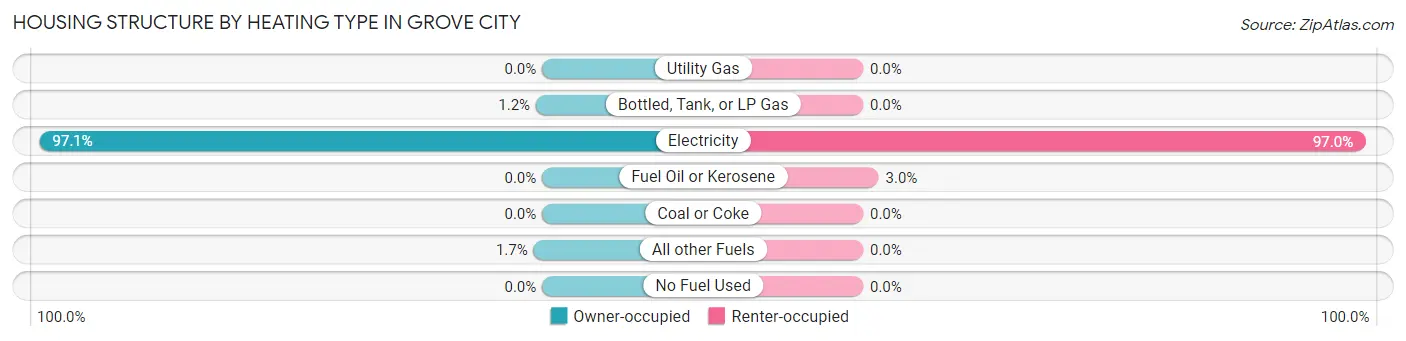
| Heating Type | Owner-occupied | Renter-occupied |
| Utility Gas | 0 (0.0%) | 0 (0.0%) |
| Bottled, Tank, or LP Gas | 8 (1.2%) | 0 (0.0%) |
| Electricity | 646 (97.1%) | 355 (97.0%) |
| Fuel Oil or Kerosene | 0 (0.0%) | 11 (3.0%) |
| Coal or Coke | 0 (0.0%) | 0 (0.0%) |
| All other Fuels | 11 (1.7%) | 0 (0.0%) |
| No Fuel Used | 0 (0.0%) | 0 (0.0%) |
| Total | 665 (100.0%) | 366 (100.0%) |
Household Vehicle Usage in Grove City
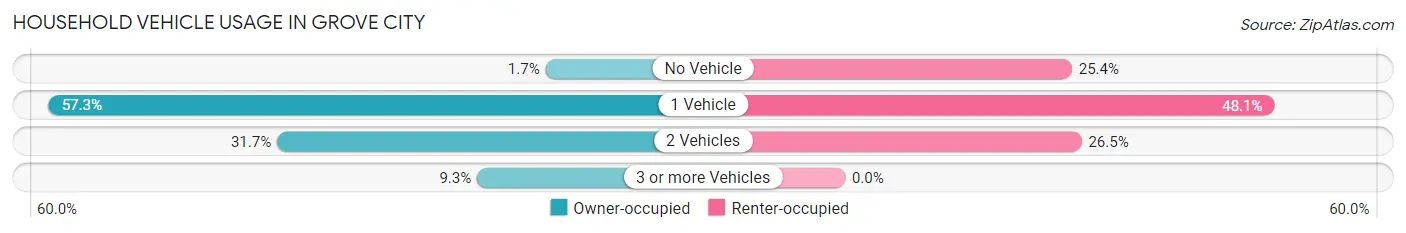
| Vehicles per Household | Owner-occupied | Renter-occupied |
| No Vehicle | 11 (1.7%) | 93 (25.4%) |
| 1 Vehicle | 381 (57.3%) | 176 (48.1%) |
| 2 Vehicles | 211 (31.7%) | 97 (26.5%) |
| 3 or more Vehicles | 62 (9.3%) | 0 (0.0%) |
| Total | 665 (100.0%) | 366 (100.0%) |
Real Estate & Mortgages in Grove City
Real Estate and Mortgage Overview in Grove City
| Characteristic | Without Mortgage | With Mortgage |
| Housing Units | 516 | 149 |
| Median Property Value | $254,600 | $324,200 |
| Median Household Income | $51,011 | $17 |
| Monthly Housing Costs | $486 | $0 |
| Real Estate Taxes | $2,063 | $0 |
Property Value by Mortgage Status in Grove City
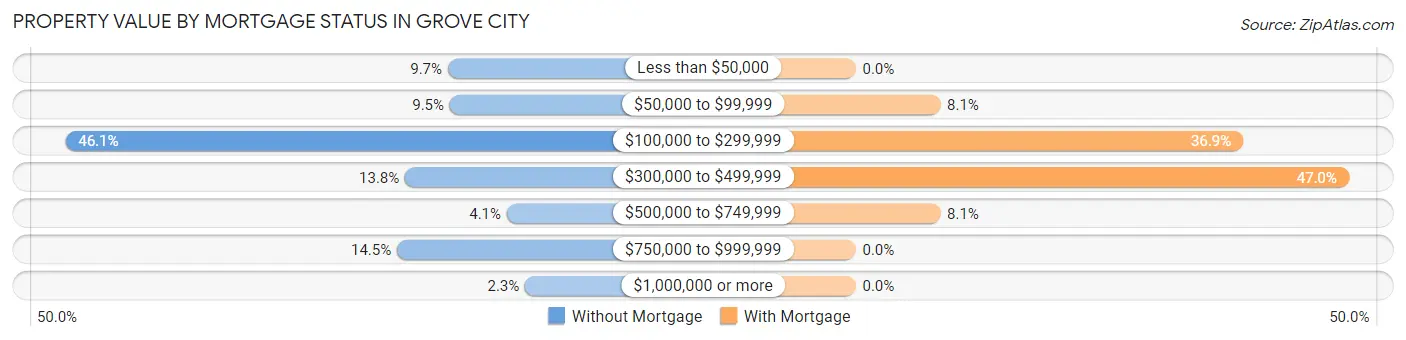
| Property Value | Without Mortgage | With Mortgage |
| Less than $50,000 | 50 (9.7%) | 0 (0.0%) |
| $50,000 to $99,999 | 49 (9.5%) | 12 (8.1%) |
| $100,000 to $299,999 | 238 (46.1%) | 55 (36.9%) |
| $300,000 to $499,999 | 71 (13.8%) | 70 (47.0%) |
| $500,000 to $749,999 | 21 (4.1%) | 12 (8.1%) |
| $750,000 to $999,999 | 75 (14.5%) | 0 (0.0%) |
| $1,000,000 or more | 12 (2.3%) | 0 (0.0%) |
| Total | 516 (100.0%) | 149 (100.0%) |
Household Income by Mortgage Status in Grove City
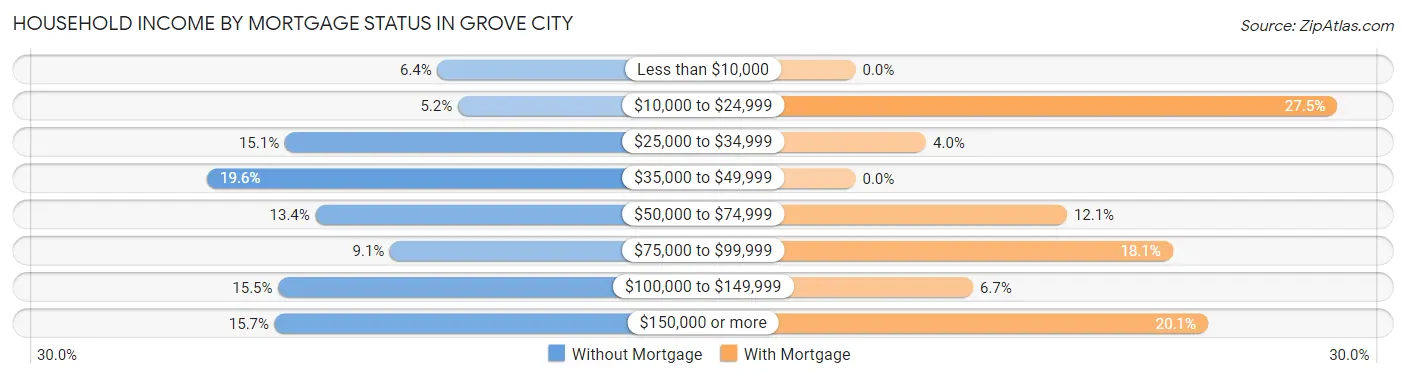
| Household Income | Without Mortgage | With Mortgage |
| Less than $10,000 | 33 (6.4%) | 0 (0.0%) |
| $10,000 to $24,999 | 27 (5.2%) | 41 (27.5%) |
| $25,000 to $34,999 | 78 (15.1%) | 6 (4.0%) |
| $35,000 to $49,999 | 101 (19.6%) | 0 (0.0%) |
| $50,000 to $74,999 | 69 (13.4%) | 18 (12.1%) |
| $75,000 to $99,999 | 47 (9.1%) | 27 (18.1%) |
| $100,000 to $149,999 | 80 (15.5%) | 10 (6.7%) |
| $150,000 or more | 81 (15.7%) | 30 (20.1%) |
| Total | 516 (100.0%) | 149 (100.0%) |
Property Value to Household Income Ratio in Grove City
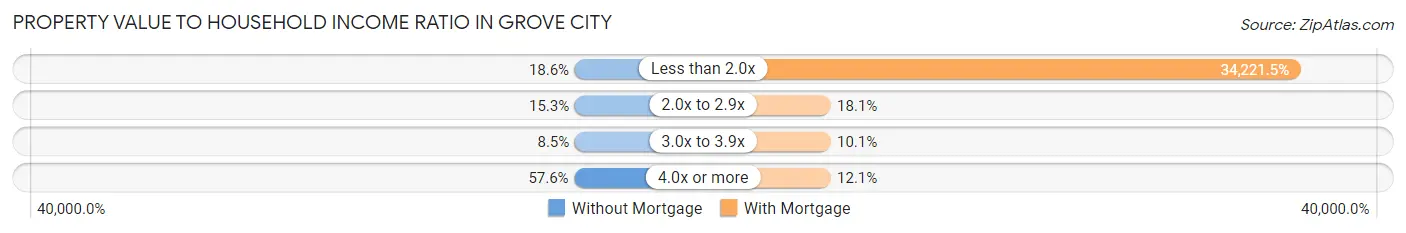
| Value-to-Income Ratio | Without Mortgage | With Mortgage |
| Less than 2.0x | 96 (18.6%) | 50,990 (34,221.5%) |
| 2.0x to 2.9x | 79 (15.3%) | 27 (18.1%) |
| 3.0x to 3.9x | 44 (8.5%) | 15 (10.1%) |
| 4.0x or more | 297 (57.6%) | 18 (12.1%) |
| Total | 516 (100.0%) | 149 (100.0%) |
Real Estate Taxes by Mortgage Status in Grove City
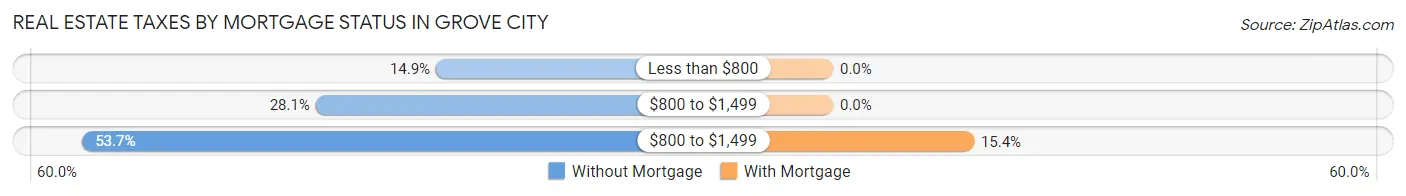
| Property Taxes | Without Mortgage | With Mortgage |
| Less than $800 | 77 (14.9%) | 0 (0.0%) |
| $800 to $1,499 | 145 (28.1%) | 0 (0.0%) |
| $800 to $1,499 | 277 (53.7%) | 23 (15.4%) |
| Total | 516 (100.0%) | 149 (100.0%) |
Health & Disability in Grove City
Health Insurance Coverage by Age in Grove City
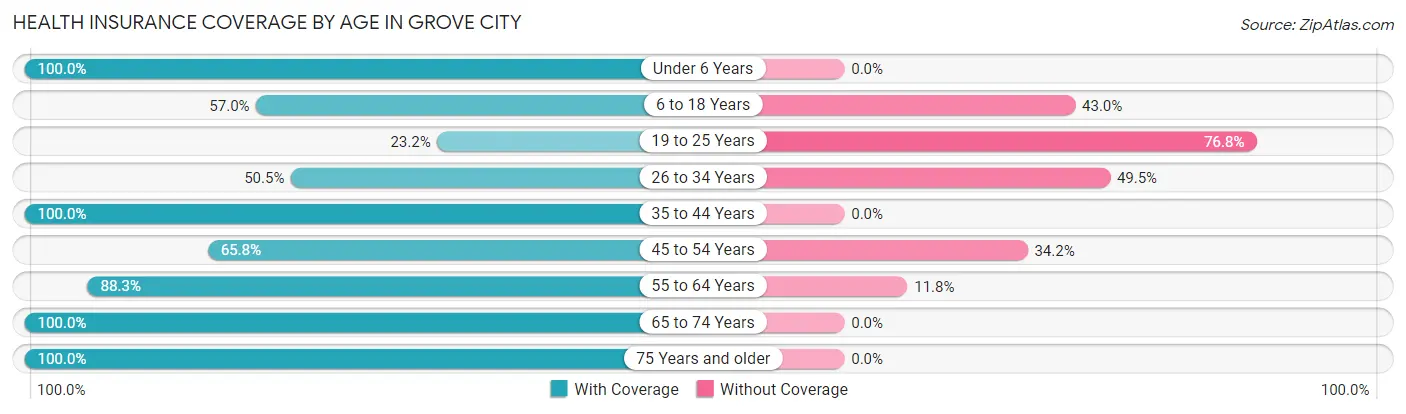
| Age Bracket | With Coverage | Without Coverage |
| Under 6 Years | 37 (100.0%) | 0 (0.0%) |
| 6 to 18 Years | 45 (57.0%) | 34 (43.0%) |
| 19 to 25 Years | 16 (23.2%) | 53 (76.8%) |
| 26 to 34 Years | 55 (50.5%) | 54 (49.5%) |
| 35 to 44 Years | 49 (100.0%) | 0 (0.0%) |
| 45 to 54 Years | 106 (65.8%) | 55 (34.2%) |
| 55 to 64 Years | 308 (88.2%) | 41 (11.7%) |
| 65 to 74 Years | 423 (100.0%) | 0 (0.0%) |
| 75 Years and older | 525 (100.0%) | 0 (0.0%) |
| Total | 1,564 (86.8%) | 237 (13.2%) |
Health Insurance Coverage by Citizenship Status in Grove City
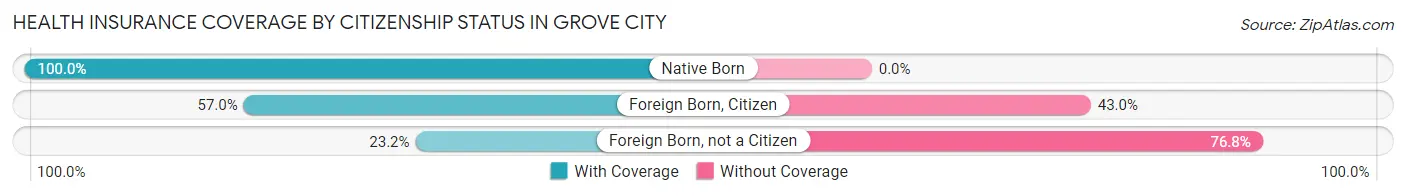
| Citizenship Status | With Coverage | Without Coverage |
| Native Born | 37 (100.0%) | 0 (0.0%) |
| Foreign Born, Citizen | 45 (57.0%) | 34 (43.0%) |
| Foreign Born, not a Citizen | 16 (23.2%) | 53 (76.8%) |
Health Insurance Coverage by Household Income in Grove City
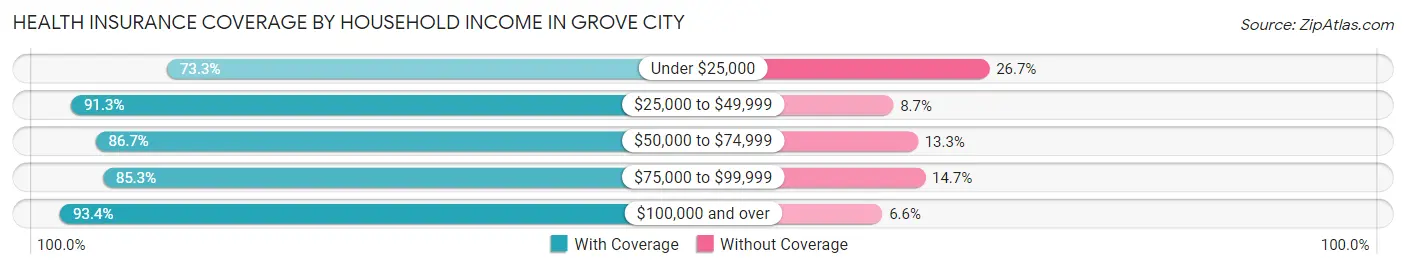
| Household Income | With Coverage | Without Coverage |
| Under $25,000 | 272 (73.3%) | 99 (26.7%) |
| $25,000 to $49,999 | 430 (91.3%) | 41 (8.7%) |
| $50,000 to $74,999 | 235 (86.7%) | 36 (13.3%) |
| $75,000 to $99,999 | 163 (85.3%) | 28 (14.7%) |
| $100,000 and over | 464 (93.4%) | 33 (6.6%) |
Public vs Private Health Insurance Coverage by Age in Grove City
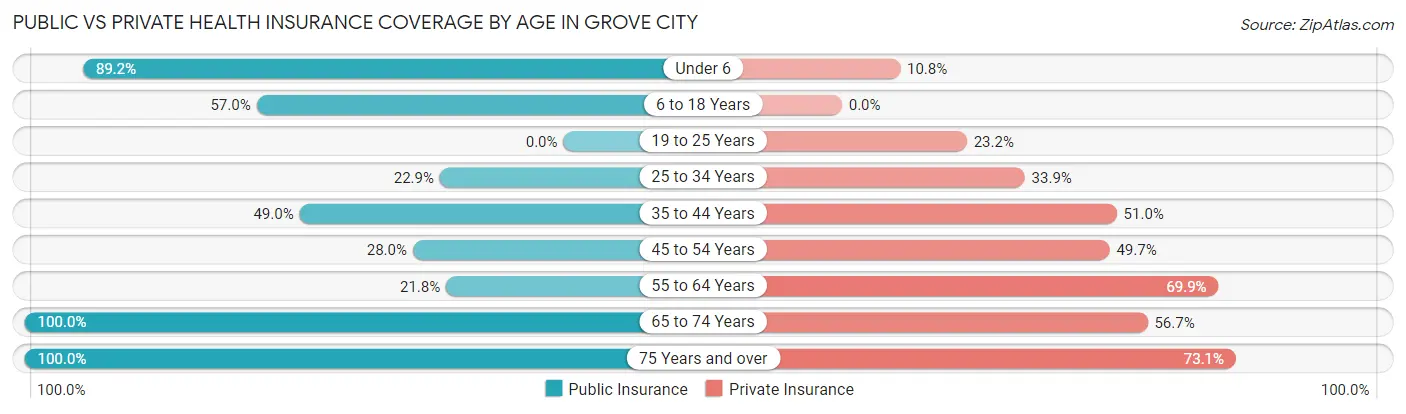
| Age Bracket | Public Insurance | Private Insurance |
| Under 6 | 33 (89.2%) | 4 (10.8%) |
| 6 to 18 Years | 45 (57.0%) | 0 (0.0%) |
| 19 to 25 Years | 0 (0.0%) | 16 (23.2%) |
| 25 to 34 Years | 25 (22.9%) | 37 (33.9%) |
| 35 to 44 Years | 24 (49.0%) | 25 (51.0%) |
| 45 to 54 Years | 45 (28.0%) | 80 (49.7%) |
| 55 to 64 Years | 76 (21.8%) | 244 (69.9%) |
| 65 to 74 Years | 423 (100.0%) | 240 (56.7%) |
| 75 Years and over | 525 (100.0%) | 384 (73.1%) |
| Total | 1,196 (66.4%) | 1,030 (57.2%) |
Disability Status by Sex by Age in Grove City
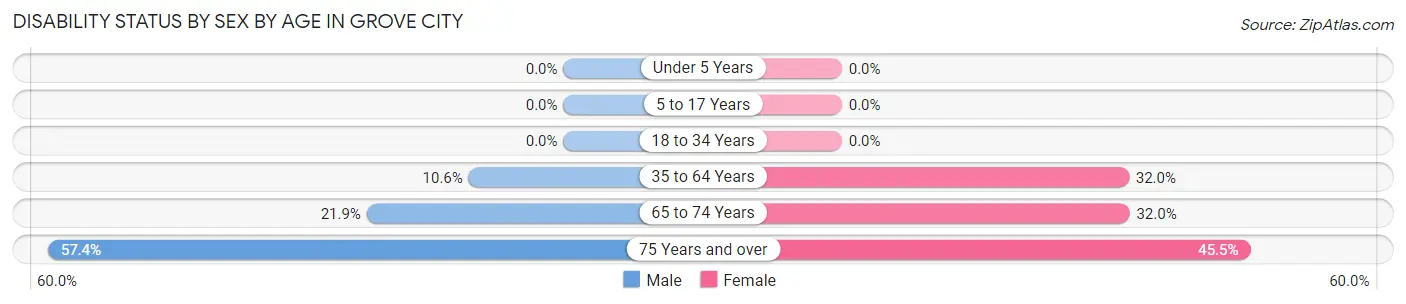
| Age Bracket | Male | Female |
| Under 5 Years | 0 (0.0%) | 0 (0.0%) |
| 5 to 17 Years | 0 (0.0%) | 0 (0.0%) |
| 18 to 34 Years | 0 (0.0%) | 0 (0.0%) |
| 35 to 64 Years | 23 (10.5%) | 109 (32.0%) |
| 65 to 74 Years | 53 (21.9%) | 58 (32.0%) |
| 75 Years and over | 155 (57.4%) | 116 (45.5%) |
Disability Class by Sex by Age in Grove City
Disability Class: Hearing Difficulty
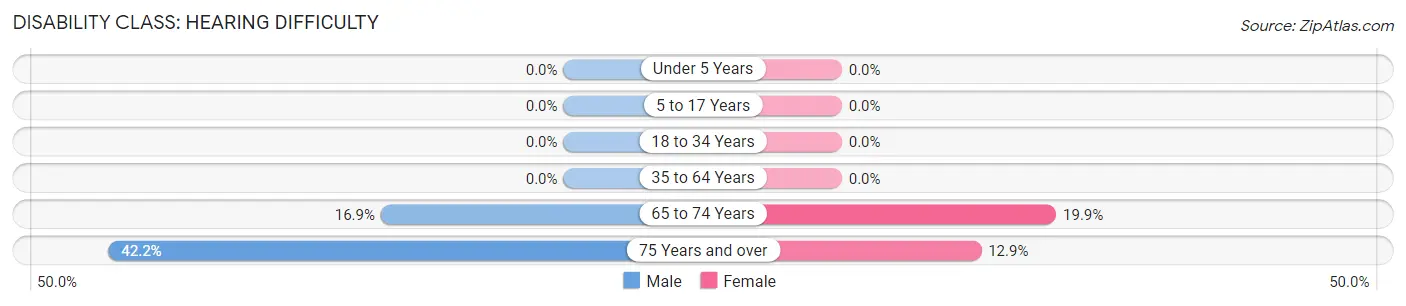
| Age Bracket | Male | Female |
| Under 5 Years | 0 (0.0%) | 0 (0.0%) |
| 5 to 17 Years | 0 (0.0%) | 0 (0.0%) |
| 18 to 34 Years | 0 (0.0%) | 0 (0.0%) |
| 35 to 64 Years | 0 (0.0%) | 0 (0.0%) |
| 65 to 74 Years | 41 (16.9%) | 36 (19.9%) |
| 75 Years and over | 114 (42.2%) | 33 (12.9%) |
Disability Class: Vision Difficulty
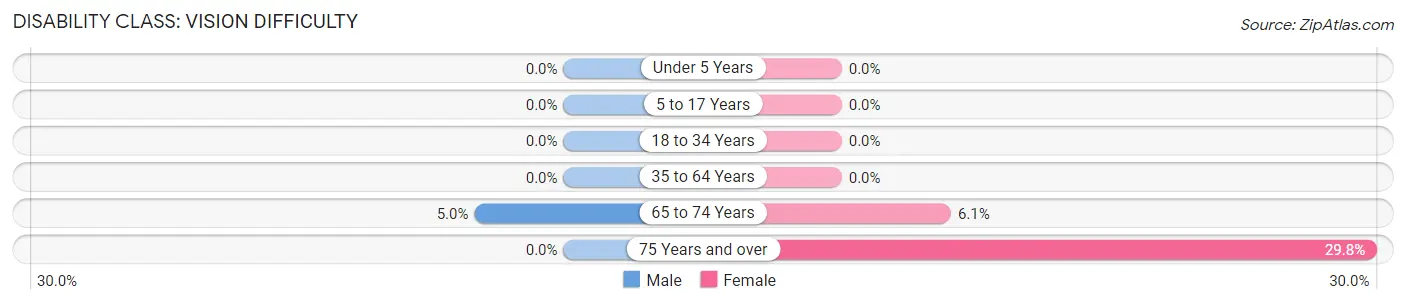
| Age Bracket | Male | Female |
| Under 5 Years | 0 (0.0%) | 0 (0.0%) |
| 5 to 17 Years | 0 (0.0%) | 0 (0.0%) |
| 18 to 34 Years | 0 (0.0%) | 0 (0.0%) |
| 35 to 64 Years | 0 (0.0%) | 0 (0.0%) |
| 65 to 74 Years | 12 (5.0%) | 11 (6.1%) |
| 75 Years and over | 0 (0.0%) | 76 (29.8%) |
Disability Class: Cognitive Difficulty
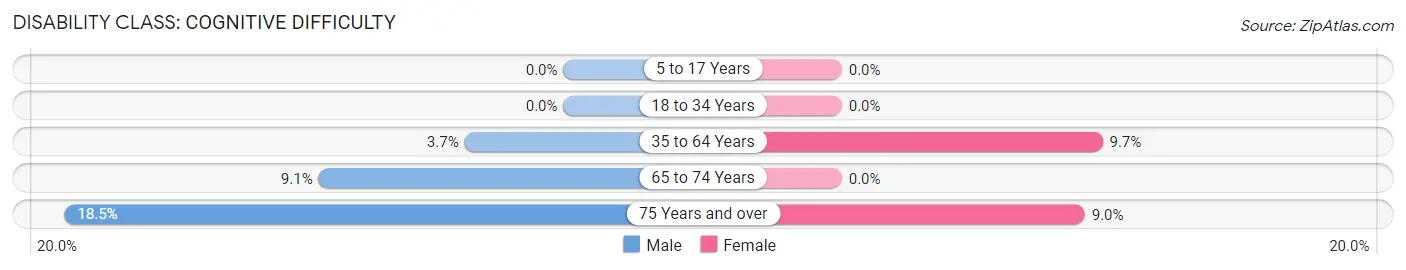
| Age Bracket | Male | Female |
| 5 to 17 Years | 0 (0.0%) | 0 (0.0%) |
| 18 to 34 Years | 0 (0.0%) | 0 (0.0%) |
| 35 to 64 Years | 8 (3.7%) | 33 (9.7%) |
| 65 to 74 Years | 22 (9.1%) | 0 (0.0%) |
| 75 Years and over | 50 (18.5%) | 23 (9.0%) |
Disability Class: Ambulatory Difficulty
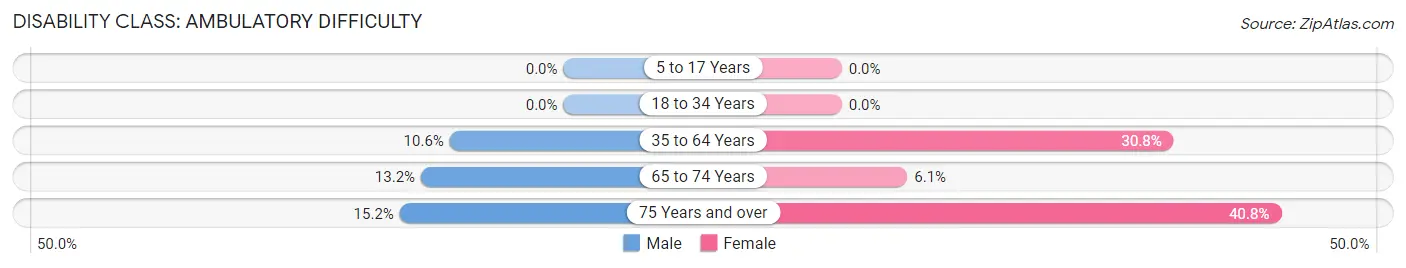
| Age Bracket | Male | Female |
| 5 to 17 Years | 0 (0.0%) | 0 (0.0%) |
| 18 to 34 Years | 0 (0.0%) | 0 (0.0%) |
| 35 to 64 Years | 23 (10.5%) | 105 (30.8%) |
| 65 to 74 Years | 32 (13.2%) | 11 (6.1%) |
| 75 Years and over | 41 (15.2%) | 104 (40.8%) |
Disability Class: Self-Care Difficulty
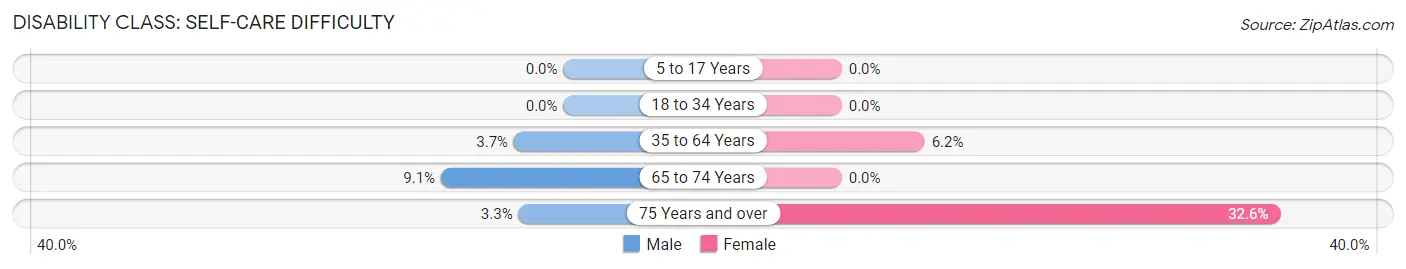
| Age Bracket | Male | Female |
| 5 to 17 Years | 0 (0.0%) | 0 (0.0%) |
| 18 to 34 Years | 0 (0.0%) | 0 (0.0%) |
| 35 to 64 Years | 8 (3.7%) | 21 (6.2%) |
| 65 to 74 Years | 22 (9.1%) | 0 (0.0%) |
| 75 Years and over | 9 (3.3%) | 83 (32.6%) |
Technology Access in Grove City
Computing Device Access in Grove City
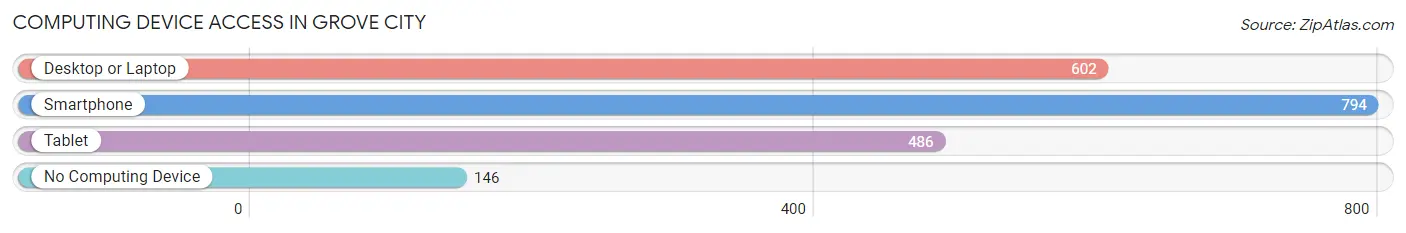
| Device Type | # Households | % Households |
| Desktop or Laptop | 602 | 58.4% |
| Smartphone | 794 | 77.0% |
| Tablet | 486 | 47.1% |
| No Computing Device | 146 | 14.2% |
| Total | 1,031 | 100.0% |
Internet Access in Grove City
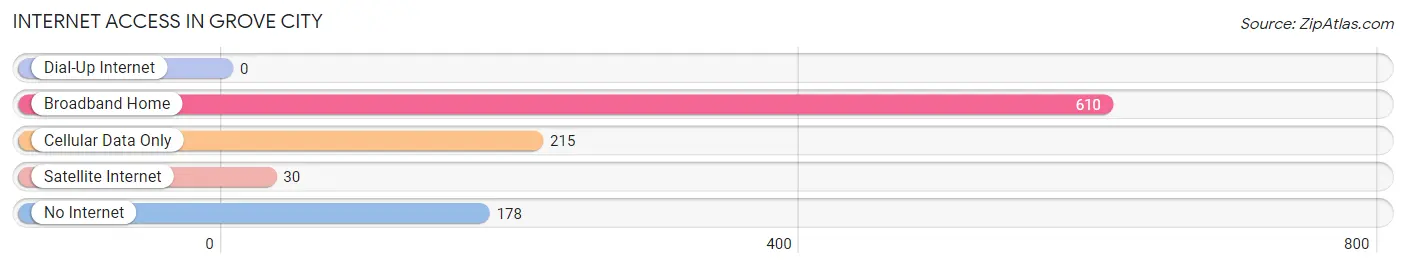
| Internet Type | # Households | % Households |
| Dial-Up Internet | 0 | 0.0% |
| Broadband Home | 610 | 59.2% |
| Cellular Data Only | 215 | 20.8% |
| Satellite Internet | 30 | 2.9% |
| No Internet | 178 | 17.3% |
| Total | 1,031 | 100.0% |
Grove City Summary
Grove City is a small unincorporated community located in Charlotte County, Florida. It is situated on the Gulf of Mexico, just south of Englewood and north of Port Charlotte. The population of Grove City was estimated to be 1,845 in 2019.
History
The area that is now known as Grove City was first settled in the late 1800s by a group of settlers from the Midwest. The settlers were attracted to the area due to its abundance of fish and wildlife, as well as its proximity to the Gulf of Mexico. The first post office in the area was established in 1887, and the town was officially incorporated in 1895.
The town was named after the groves of citrus trees that were planted in the area by the settlers. The citrus industry was a major part of the local economy for many years, and the town was known for its production of oranges, grapefruit, and tangerines.
In the early 1900s, the town began to grow and develop. A school was built in 1910, and a library was established in 1912. The town also had a hotel, a bank, and a movie theater.
Geography
Grove City is located in the southwestern part of Charlotte County, Florida. It is situated on the Gulf of Mexico, just south of Englewood and north of Port Charlotte. The town is bordered by the Peace River to the east and the Myakka River to the west.
The town is located on a flat coastal plain, with an elevation of just 10 feet above sea level. The climate is subtropical, with hot, humid summers and mild winters. The average annual temperature is 73 degrees Fahrenheit, and the average annual rainfall is 54 inches.
Economy
The economy of Grove City is largely based on tourism and fishing. The town is a popular destination for fishing, boating, and other outdoor activities. There are several marinas in the area, as well as a number of restaurants and shops.
The town is also home to a number of small businesses, including a grocery store, a hardware store, and a gas station. The town is also home to a number of manufacturing companies, including a boat manufacturer and a furniture manufacturer.
Demographics
As of 2019, the population of Grove City was estimated to be 1,845. The population is predominantly white (90.3%), with a small percentage of African Americans (4.2%) and Hispanics (3.2%). The median household income is $41,945, and the median home value is $179,400.
The town is served by the Charlotte County Public Schools system. The town is also home to a number of churches, including the First Baptist Church of Grove City and the Grove City United Methodist Church.
Conclusion
Grove City is a small unincorporated community located in Charlotte County, Florida. It is situated on the Gulf of Mexico, just south of Englewood and north of Port Charlotte. The population of Grove City was estimated to be 1,845 in 2019. The economy of Grove City is largely based on tourism and fishing, and the town is a popular destination for fishing, boating, and other outdoor activities. The population is predominantly white, with a small percentage of African Americans and Hispanics. The median household income is $41,945, and the median home value is $179,400. The town is served by the Charlotte County Public Schools system, and is home to a number of churches.
Common Questions
What is Per Capita Income in Grove City?
Per Capita income in Grove City is $36,472.
What is the Median Family Income in Grove City?
Median Family Income in Grove City is $77,583.
What is the Median Household income in Grove City?
Median Household Income in Grove City is $48,194.
What is Income or Wage Gap in Grove City?
Income or Wage Gap in Grove City is 32.0%.
Women in Grove City earn 68.0 cents for every dollar earned by a man.
What is Inequality or Gini Index in Grove City?
Inequality or Gini Index in Grove City is 0.43.
What is the Total Population of Grove City?
Total Population of Grove City is 1,824.
What is the Total Male Population of Grove City?
Total Male Population of Grove City is 879.
What is the Total Female Population of Grove City?
Total Female Population of Grove City is 945.
What is the Ratio of Males per 100 Females in Grove City?
There are 93.02 Males per 100 Females in Grove City.
What is the Ratio of Females per 100 Males in Grove City?
There are 107.51 Females per 100 Males in Grove City.
What is the Median Population Age in Grove City?
Median Population Age in Grove City is 66.3 Years.
What is the Average Family Size in Grove City
Average Family Size in Grove City is 2.5 People.
What is the Average Household Size in Grove City
Average Household Size in Grove City is 1.8 People.
How Large is the Labor Force in Grove City?
There are 511 People in the Labor Forcein in Grove City.
What is the Percentage of People in the Labor Force in Grove City?
29.0% of People are in the Labor Force in Grove City.
What is the Unemployment Rate in Grove City?
Unemployment Rate in Grove City is 8.2%.