Zip Codes with the Highest Percentage of Population Employed in Food Preparation & Serving in Lehigh Acres, FL
RELATED REPORTS & OPTIONS
Food Preparation & Serving
Lehigh Acres
Compare Zip Codes
Map of Zip Codes with the Highest Percentage of Population Employed in Food Preparation & Serving in Lehigh Acres
6.0%
9.5%
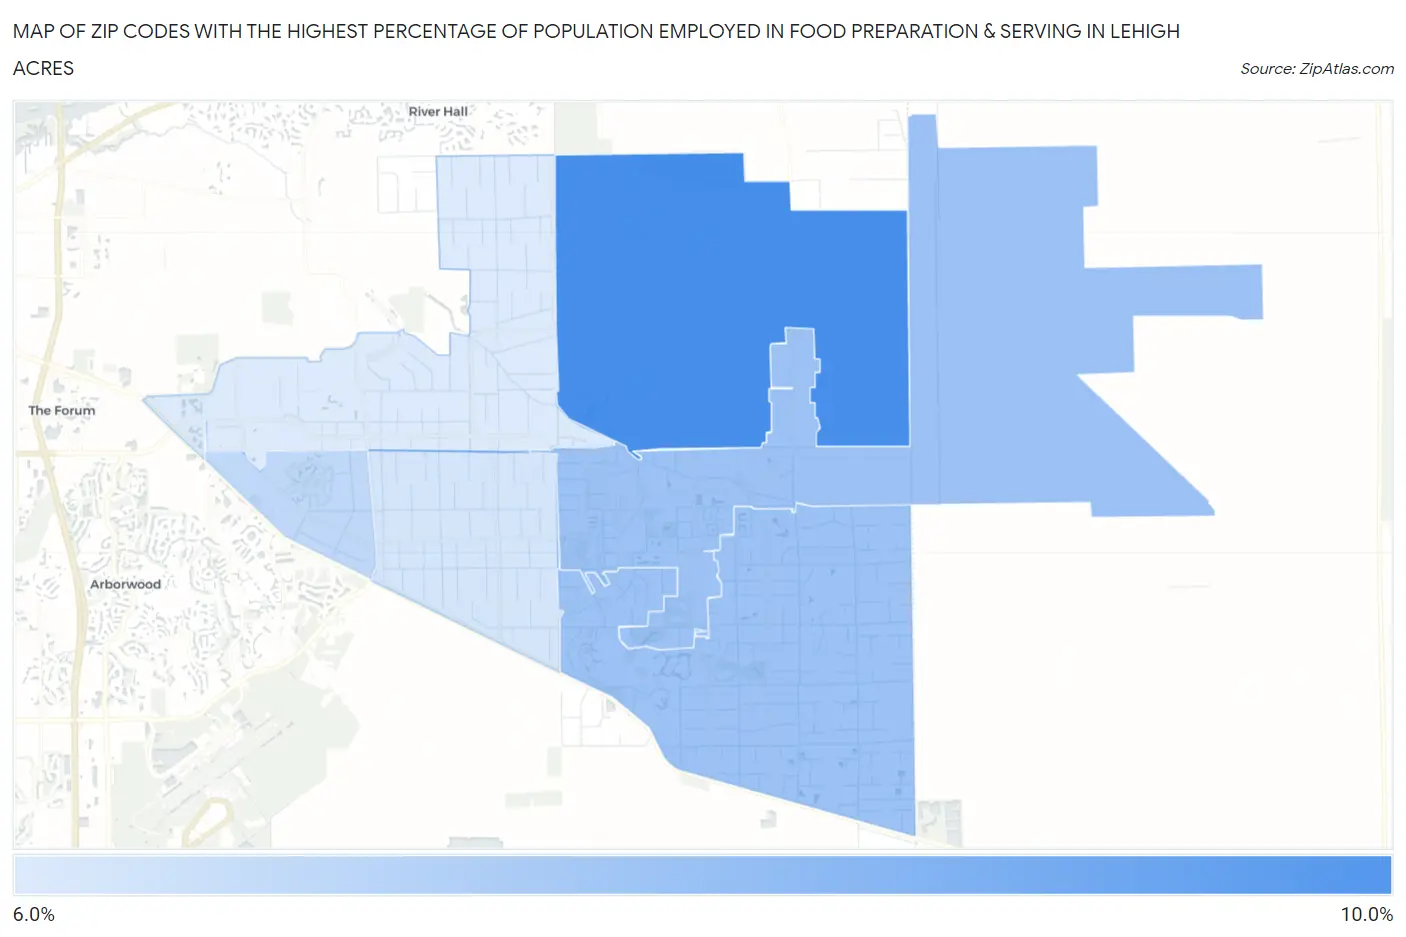
Zip Codes with the Highest Percentage of Population Employed in Food Preparation & Serving in Lehigh Acres, FL
| Zip Code | % Employed | vs State | vs National | |
| 1. | 33972 | 9.5% | 6.1%(+3.46)#110 | 5.3%(+4.26)#3,015 |
| 2. | 33936 | 7.6% | 6.1%(+1.49)#246 | 5.3%(+2.29)#5,408 |
| 3. | 33974 | 7.5% | 6.1%(+1.42)#258 | 5.3%(+2.22)#5,543 |
| 4. | 33973 | 6.7% | 6.1%(+0.648)#357 | 5.3%(+1.45)#7,232 |
| 5. | 33976 | 6.2% | 6.1%(+0.155)#419 | 5.3%(+0.959)#8,603 |
| 6. | 33971 | 6.0% | 6.1%(-0.064)#452 | 5.3%(+0.741)#9,251 |
1
Common Questions
What are the Top 5 Zip Codes with the Highest Percentage of Population Employed in Food Preparation & Serving in Lehigh Acres, FL?
Top 5 Zip Codes with the Highest Percentage of Population Employed in Food Preparation & Serving in Lehigh Acres, FL are:
What zip code has the Highest Percentage of Population Employed in Food Preparation & Serving in Lehigh Acres, FL?
33972 has the Highest Percentage of Population Employed in Food Preparation & Serving in Lehigh Acres, FL with 9.5%.
What is the Percentage of Population Employed in Food Preparation & Serving in Lehigh Acres, FL?
Percentage of Population Employed in Food Preparation & Serving in Lehigh Acres is 7.1%.
What is the Percentage of Population Employed in Food Preparation & Serving in Florida?
Percentage of Population Employed in Food Preparation & Serving in Florida is 6.1%.
What is the Percentage of Population Employed in Food Preparation & Serving in the United States?
Percentage of Population Employed in Food Preparation & Serving in the United States is 5.3%.