Zip Codes with the Highest Percentage of Population Employed in Food Preparation & Serving in Sebastian, FL
RELATED REPORTS & OPTIONS
Food Preparation & Serving
Sebastian
Compare Zip Codes
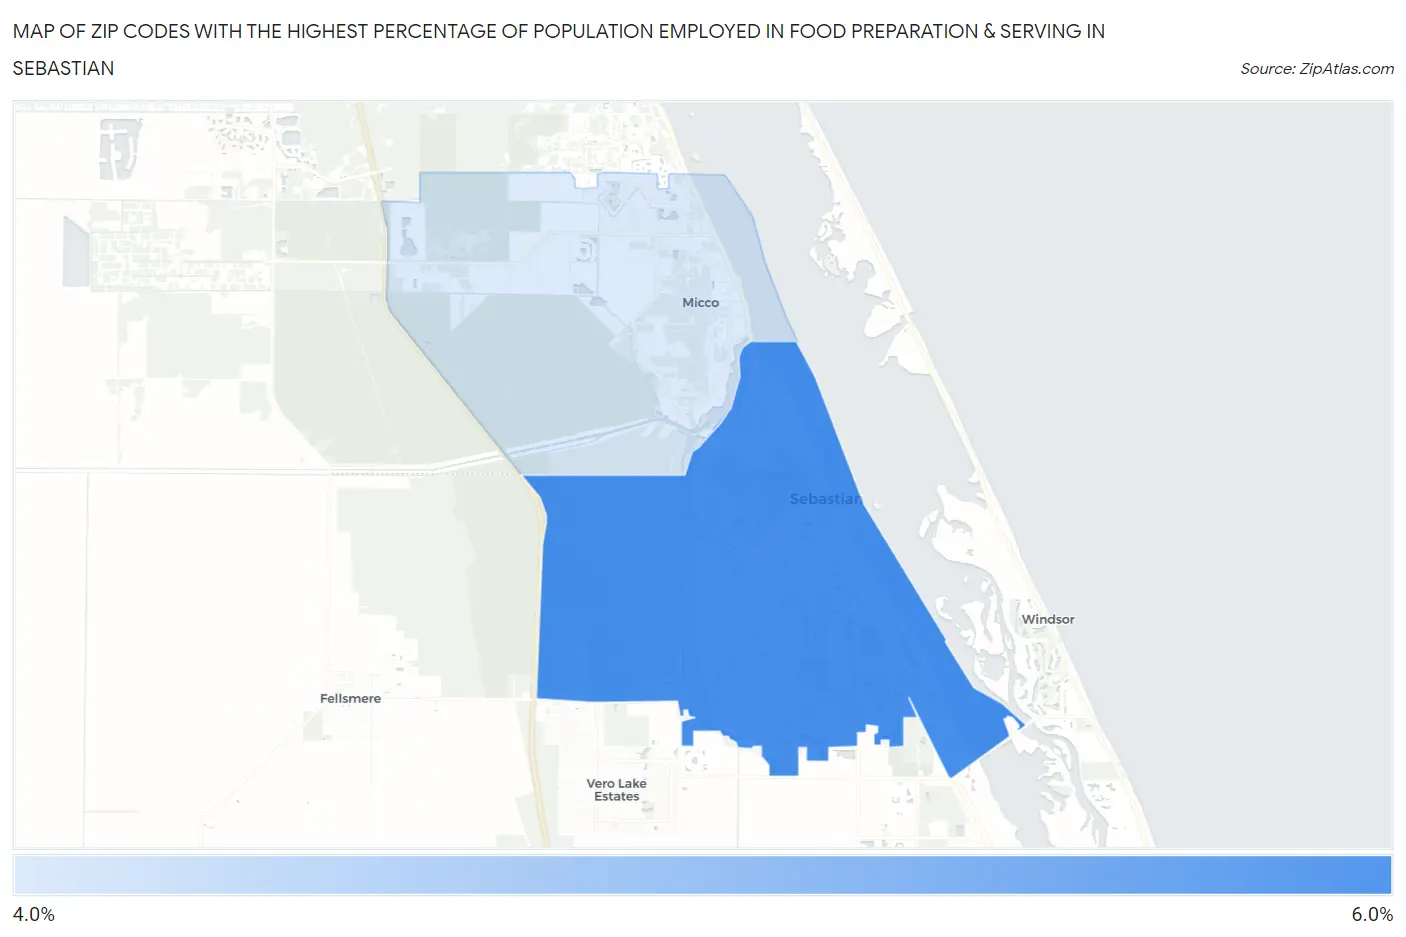
Map of Zip Codes with the Highest Percentage of Population Employed in Food Preparation & Serving in Sebastian
4.7%
5.8%
Zip Codes with the Highest Percentage of Population Employed in Food Preparation & Serving in Sebastian, FL
| Zip Code | % Employed | vs State | vs National | |
| 1. | 32958 | 5.8% | 6.1%(-0.307)#493 | 5.3%(+0.498)#10,079 |
| 2. | 32976 | 4.7% | 6.1%(-1.35)#640 | 5.3%(-0.549)#14,006 |
1
Common Questions
What are the Top Zip Codes with the Highest Percentage of Population Employed in Food Preparation & Serving in Sebastian, FL?
Top Zip Codes with the Highest Percentage of Population Employed in Food Preparation & Serving in Sebastian, FL are:
What zip code has the Highest Percentage of Population Employed in Food Preparation & Serving in Sebastian, FL?
32958 has the Highest Percentage of Population Employed in Food Preparation & Serving in Sebastian, FL with 5.8%.
What is the Percentage of Population Employed in Food Preparation & Serving in Sebastian, FL?
Percentage of Population Employed in Food Preparation & Serving in Sebastian is 6.4%.
What is the Percentage of Population Employed in Food Preparation & Serving in Florida?
Percentage of Population Employed in Food Preparation & Serving in Florida is 6.1%.
What is the Percentage of Population Employed in Food Preparation & Serving in the United States?
Percentage of Population Employed in Food Preparation & Serving in the United States is 5.3%.