Goulding, FL Map & Demographics
Goulding Map
Goulding Overview
$15,399
PER CAPITA INCOME
$34,000
AVG FAMILY INCOME
$25,799
AVG HOUSEHOLD INCOME
0.43
INEQUALITY / GINI INDEX
3,476
TOTAL POPULATION
2,260
MALE POPULATION
1,216
FEMALE POPULATION
185.86
MALES / 100 FEMALES
53.81
FEMALES / 100 MALES
39.7
MEDIAN AGE
3.2
AVG FAMILY SIZE
2.2
AVG HOUSEHOLD SIZE
839
LABOR FORCE [ PEOPLE ]
26.8%
PERCENT IN LABOR FORCE
14.7%
UNEMPLOYMENT RATE
Income in Goulding
Income Overview in Goulding
Per Capita Income in Goulding is $15,399, while median incomes of families and households are $34,000 and $25,799 respectively.
| Characteristic | Number | Measure |
| Per Capita Income | 3,476 | $15,399 |
| Median Family Income | 492 | $34,000 |
| Mean Family Income | 492 | $40,071 |
| Median Household Income | 937 | $25,799 |
| Mean Household Income | 937 | $33,173 |
| Income Deficit | 492 | $0 |
| Wage / Income Gap (%) | 3,476 | 0.00% |
| Wage / Income Gap ($) | 3,476 | 100.00¢ per $1 |
| Gini / Inequality Index | 3,476 | 0.43 |
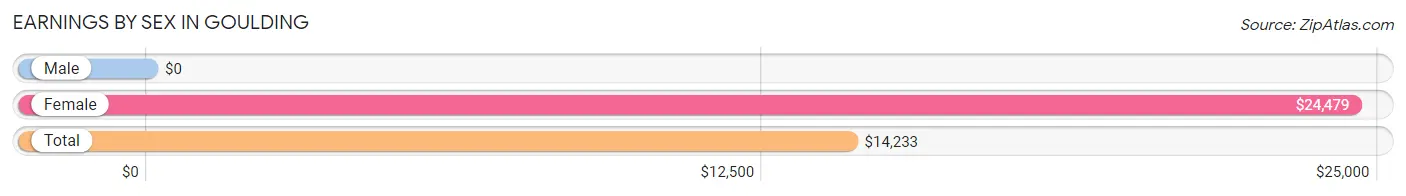
Earnings by Sex in Goulding
| Sex | Number | Average Earnings |
| Male | 835 (63.5%) | $0 |
| Female | 480 (36.5%) | $24,479 |
| Total | 1,315 (100.0%) | $14,233 |
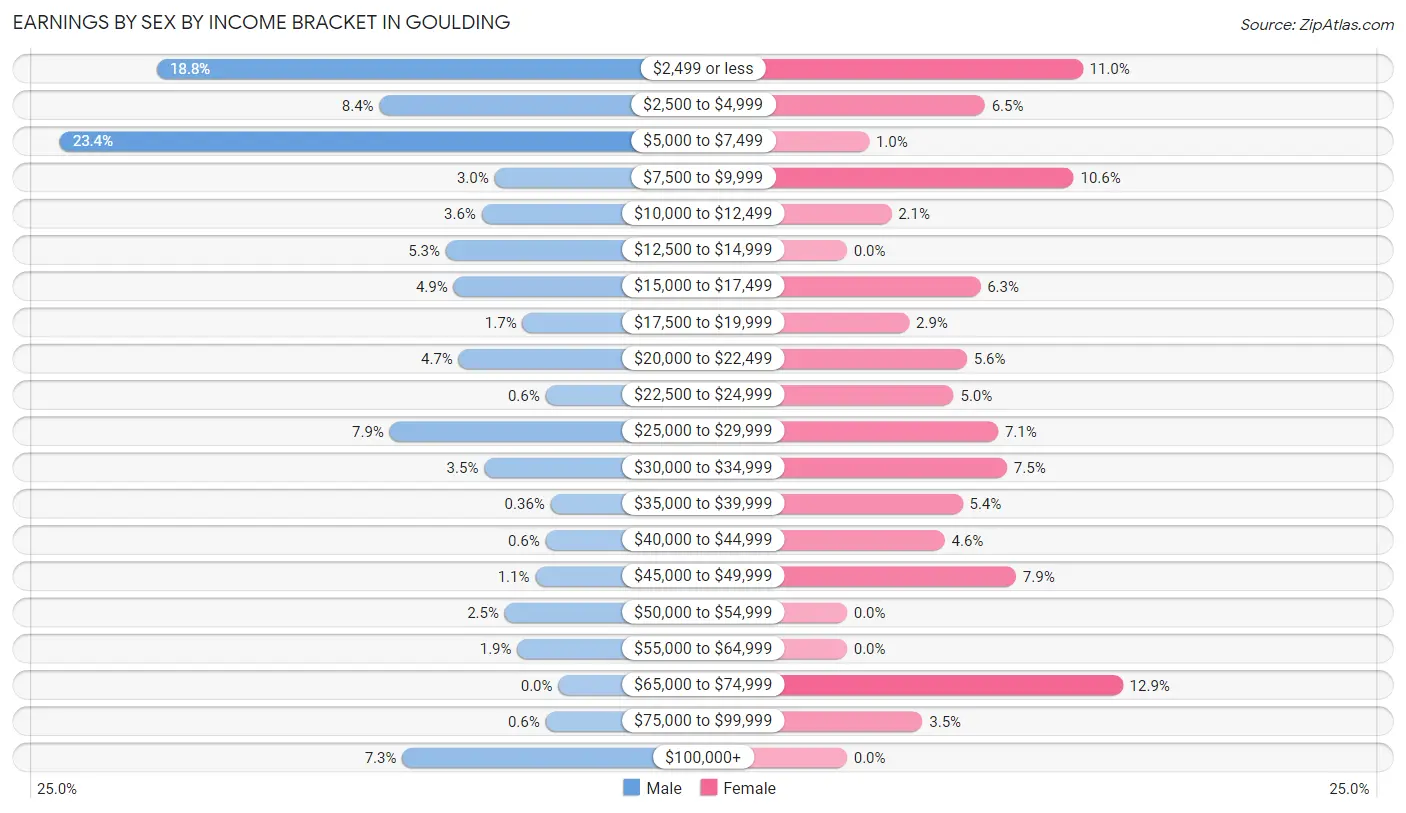
Earnings by Sex by Income Bracket in Goulding
The most common earnings brackets in Goulding are $5,000 to $7,499 for men (195 | 23.4%) and $65,000 to $74,999 for women (62 | 12.9%).
| Income | Male | Female |
| $2,499 or less | 157 (18.8%) | 53 (11.0%) |
| $2,500 to $4,999 | 70 (8.4%) | 31 (6.5%) |
| $5,000 to $7,499 | 195 (23.4%) | 5 (1.0%) |
| $7,500 to $9,999 | 25 (3.0%) | 51 (10.6%) |
| $10,000 to $12,499 | 30 (3.6%) | 10 (2.1%) |
| $12,500 to $14,999 | 44 (5.3%) | 0 (0.0%) |
| $15,000 to $17,499 | 41 (4.9%) | 30 (6.2%) |
| $17,500 to $19,999 | 14 (1.7%) | 14 (2.9%) |
| $20,000 to $22,499 | 39 (4.7%) | 27 (5.6%) |
| $22,500 to $24,999 | 5 (0.6%) | 24 (5.0%) |
| $25,000 to $29,999 | 66 (7.9%) | 34 (7.1%) |
| $30,000 to $34,999 | 29 (3.5%) | 36 (7.5%) |
| $35,000 to $39,999 | 3 (0.4%) | 26 (5.4%) |
| $40,000 to $44,999 | 5 (0.6%) | 22 (4.6%) |
| $45,000 to $49,999 | 9 (1.1%) | 38 (7.9%) |
| $50,000 to $54,999 | 21 (2.5%) | 0 (0.0%) |
| $55,000 to $64,999 | 16 (1.9%) | 0 (0.0%) |
| $65,000 to $74,999 | 0 (0.0%) | 62 (12.9%) |
| $75,000 to $99,999 | 5 (0.6%) | 17 (3.5%) |
| $100,000+ | 61 (7.3%) | 0 (0.0%) |
| Total | 835 (100.0%) | 480 (100.0%) |
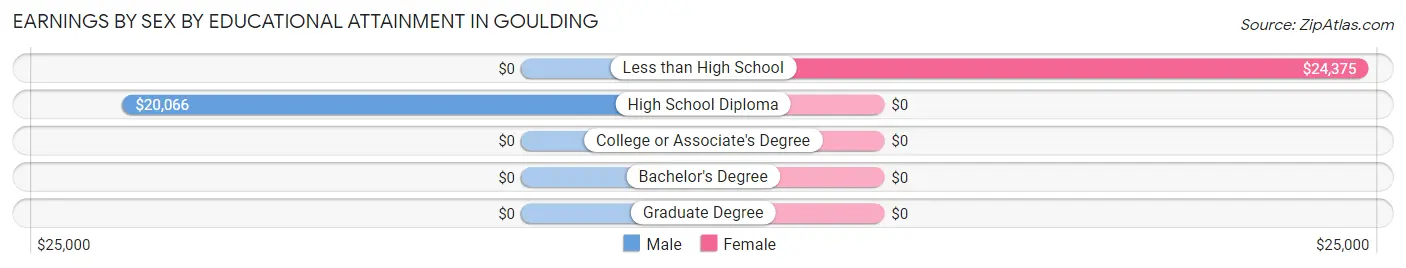
Earnings by Sex by Educational Attainment in Goulding
Average earnings in Goulding are $19,196 for men and $26,176 for women, a difference of 26.7%. Men with an educational attainment of high school diploma enjoy the highest average annual earnings of $20,066, while those with high school diploma education earn the least with $20,066. Women with an educational attainment of less than high school earn the most with the average annual earnings of $24,375, while those with less than high school education have the smallest earnings of $24,375.
| Educational Attainment | Male Income | Female Income |
| Less than High School | - | - |
| High School Diploma | $20,066 | $0 |
| College or Associate's Degree | - | - |
| Bachelor's Degree | - | - |
| Graduate Degree | - | - |
| Total | $19,196 | $26,176 |
Family Income in Goulding
Family Income Brackets in Goulding
According to the Goulding family income data, there are 102 families falling into the $15,000 to $24,999 income range, which is the most common income bracket and makes up 20.7% of all families.
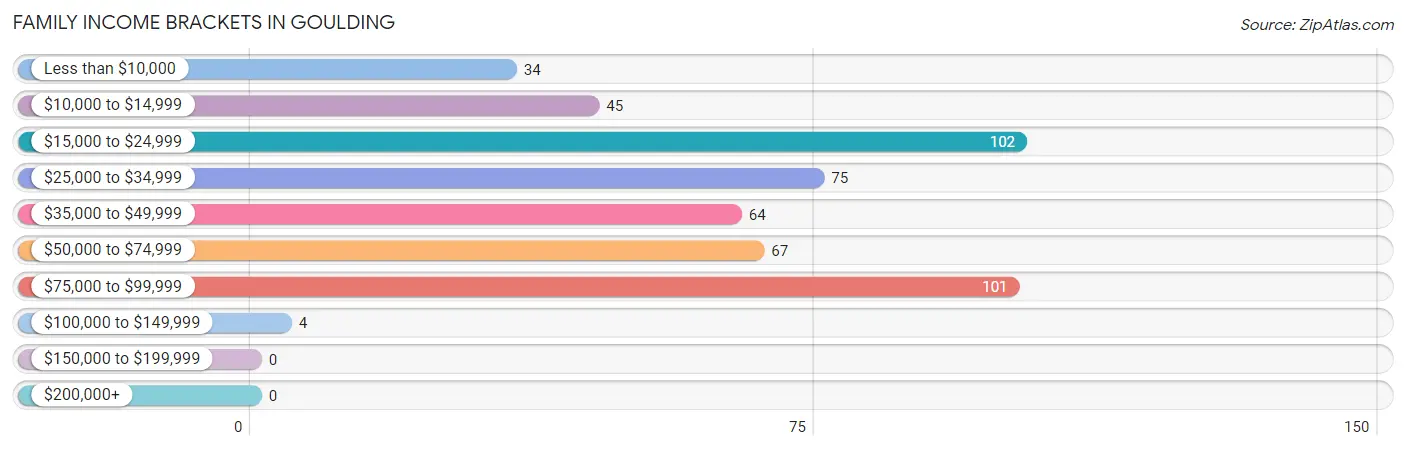
| Income Bracket | # Families | % Families |
| Less than $10,000 | 34 | 6.9% |
| $10,000 to $14,999 | 45 | 9.1% |
| $15,000 to $24,999 | 102 | 20.7% |
| $25,000 to $34,999 | 75 | 15.2% |
| $35,000 to $49,999 | 64 | 13.0% |
| $50,000 to $74,999 | 67 | 13.6% |
| $75,000 to $99,999 | 101 | 20.5% |
| $100,000 to $149,999 | 4 | 0.8% |
| $150,000 to $199,999 | 0 | 0.0% |
| $200,000+ | 0 | 0.0% |
Family Income by Famaliy Size in Goulding
4-person families (106 | 21.5%) account for the highest median family income in Goulding with $80,363 per family, while 4-person families (106 | 21.5%) have the highest median income of $20,091 per family member.
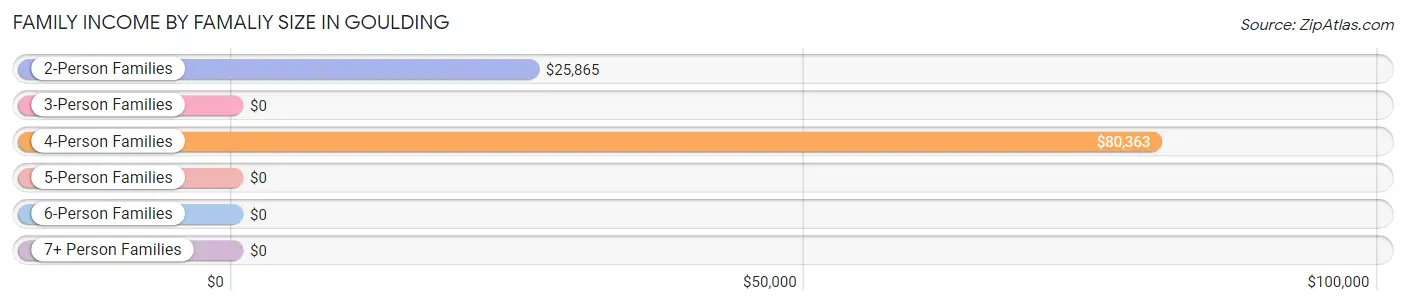
| Income Bracket | # Families | Median Income |
| 2-Person Families | 269 (54.7%) | $25,865 |
| 3-Person Families | 79 (16.1%) | $0 |
| 4-Person Families | 106 (21.5%) | $80,363 |
| 5-Person Families | 19 (3.9%) | $0 |
| 6-Person Families | 0 (0.0%) | $0 |
| 7+ Person Families | 19 (3.9%) | $0 |
| Total | 492 (100.0%) | $34,000 |
Family Income by Number of Earners in Goulding
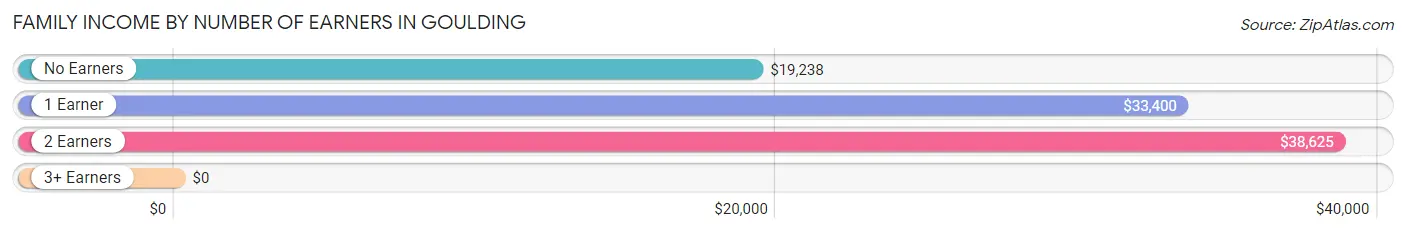
| Number of Earners | # Families | Median Income |
| No Earners | 165 (33.5%) | $19,238 |
| 1 Earner | 160 (32.5%) | $33,400 |
| 2 Earners | 85 (17.3%) | $38,625 |
| 3+ Earners | 82 (16.7%) | $0 |
| Total | 492 (100.0%) | $34,000 |
Household Income in Goulding
Household Income Brackets in Goulding
With 181 households falling in the category, the $15,000 to $24,999 income range is the most frequent in Goulding, accounting for 19.3% of all households.
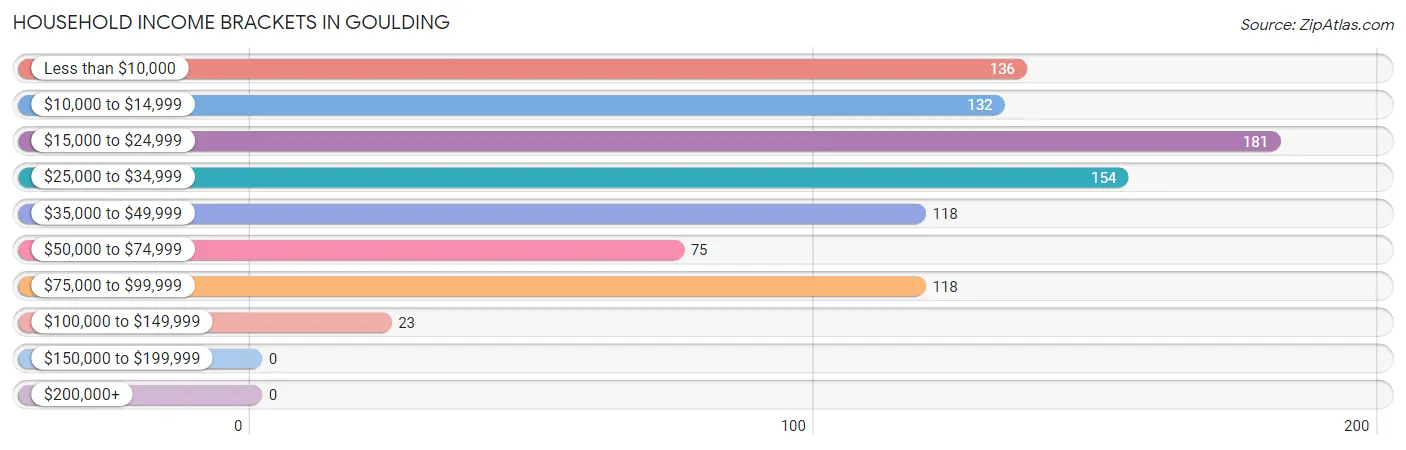
| Income Bracket | # Households | % Households |
| Less than $10,000 | 136 | 14.5% |
| $10,000 to $14,999 | 132 | 14.1% |
| $15,000 to $24,999 | 181 | 19.3% |
| $25,000 to $34,999 | 154 | 16.4% |
| $35,000 to $49,999 | 118 | 12.6% |
| $50,000 to $74,999 | 75 | 8.0% |
| $75,000 to $99,999 | 118 | 12.6% |
| $100,000 to $149,999 | 23 | 2.5% |
| $150,000 to $199,999 | 0 | 0.0% |
| $200,000+ | 0 | 0.0% |
Household Income by Householder Age in Goulding
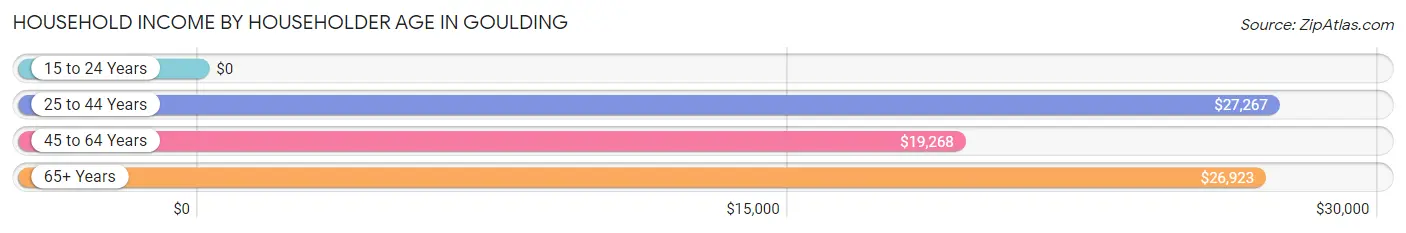
The median household income in Goulding is $25,799, with the highest median household income of $27,267 found in the 25 to 44 years age bracket for the primary householder. A total of 418 households (44.6%) fall into this category. Meanwhile, the 15 to 24 years age bracket for the primary householder has the lowest median household income of $0, with 23 households (2.5%) in this group.
| Income Bracket | # Households | Median Income |
| 15 to 24 Years | 23 (2.5%) | $0 |
| 25 to 44 Years | 418 (44.6%) | $27,267 |
| 45 to 64 Years | 216 (23.1%) | $19,268 |
| 65+ Years | 280 (29.9%) | $26,923 |
| Total | 937 (100.0%) | $25,799 |
Poverty in Goulding
Income Below Poverty by Sex and Age in Goulding
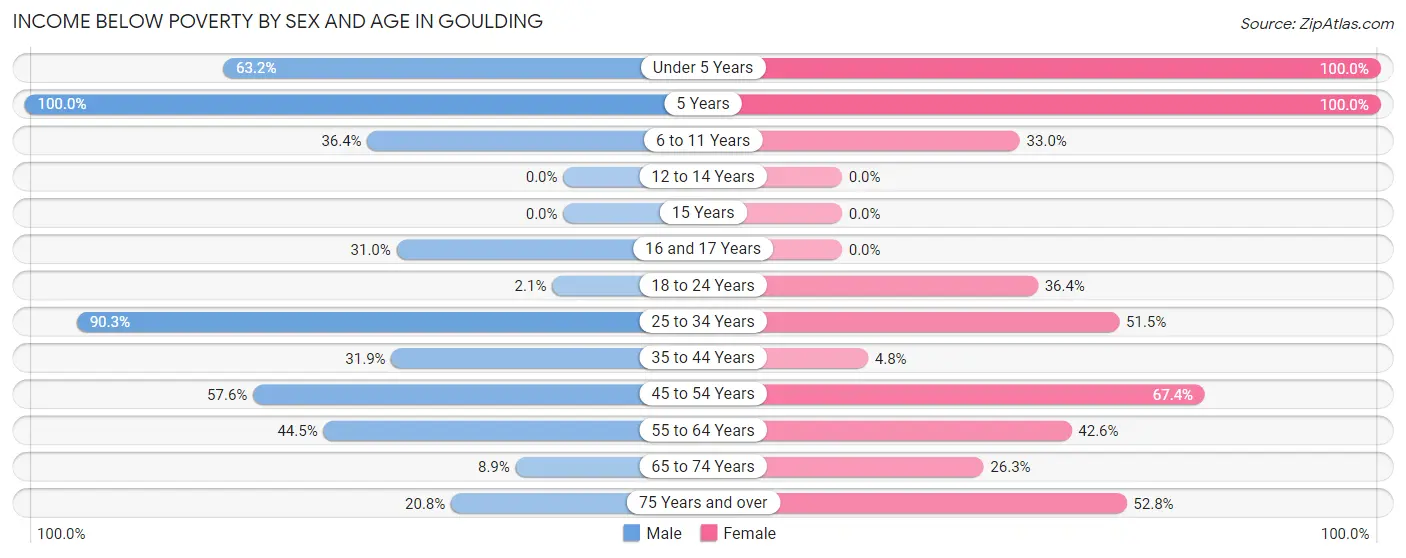
With 32.0% poverty level for males and 35.5% for females among the residents of Goulding, 5 year old males and under 5 year old females are the most vulnerable to poverty, with 18 males (100.0%) and 12 females (100.0%) in their respective age groups living below the poverty level.
| Age Bracket | Male | Female |
| Under 5 Years | 12 (63.2%) | 12 (100.0%) |
| 5 Years | 18 (100.0%) | 35 (100.0%) |
| 6 to 11 Years | 32 (36.4%) | 34 (33.0%) |
| 12 to 14 Years | 0 (0.0%) | 0 (0.0%) |
| 15 Years | 0 (0.0%) | 0 (0.0%) |
| 16 and 17 Years | 13 (30.9%) | 0 (0.0%) |
| 18 to 24 Years | 7 (2.1%) | 28 (36.4%) |
| 25 to 34 Years | 112 (90.3%) | 70 (51.5%) |
| 35 to 44 Years | 45 (31.9%) | 9 (4.8%) |
| 45 to 54 Years | 57 (57.6%) | 31 (67.4%) |
| 55 to 64 Years | 65 (44.5%) | 49 (42.6%) |
| 65 to 74 Years | 7 (8.9%) | 41 (26.3%) |
| 75 Years and over | 15 (20.8%) | 28 (52.8%) |
| Total | 383 (32.0%) | 337 (35.5%) |
Income Above Poverty by Sex and Age in Goulding
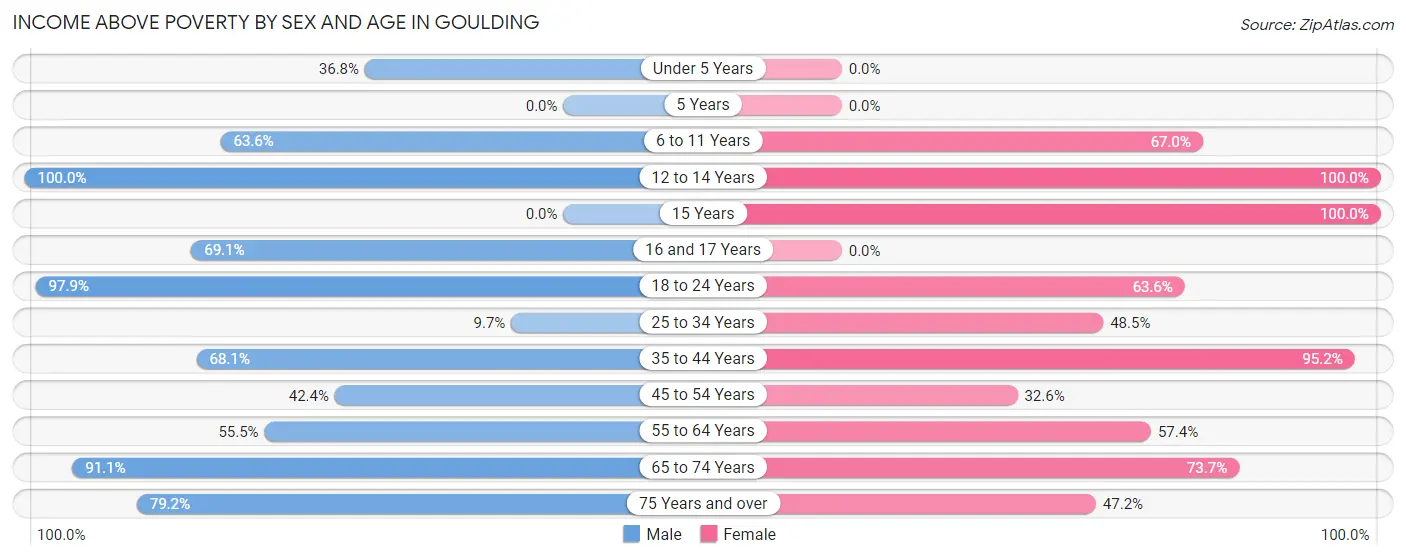
According to the poverty statistics in Goulding, males aged 12 to 14 years and females aged 12 to 14 years are the age groups that are most secure financially, with 100.0% of males and 100.0% of females in these age groups living above the poverty line.
| Age Bracket | Male | Female |
| Under 5 Years | 7 (36.8%) | 0 (0.0%) |
| 5 Years | 0 (0.0%) | 0 (0.0%) |
| 6 to 11 Years | 56 (63.6%) | 69 (67.0%) |
| 12 to 14 Years | 30 (100.0%) | 24 (100.0%) |
| 15 Years | 0 (0.0%) | 5 (100.0%) |
| 16 and 17 Years | 29 (69.1%) | 0 (0.0%) |
| 18 to 24 Years | 332 (97.9%) | 49 (63.6%) |
| 25 to 34 Years | 12 (9.7%) | 66 (48.5%) |
| 35 to 44 Years | 96 (68.1%) | 177 (95.2%) |
| 45 to 54 Years | 42 (42.4%) | 15 (32.6%) |
| 55 to 64 Years | 81 (55.5%) | 66 (57.4%) |
| 65 to 74 Years | 72 (91.1%) | 115 (73.7%) |
| 75 Years and over | 57 (79.2%) | 25 (47.2%) |
| Total | 814 (68.0%) | 611 (64.4%) |
Income Below Poverty Among Married-Couple Families in Goulding
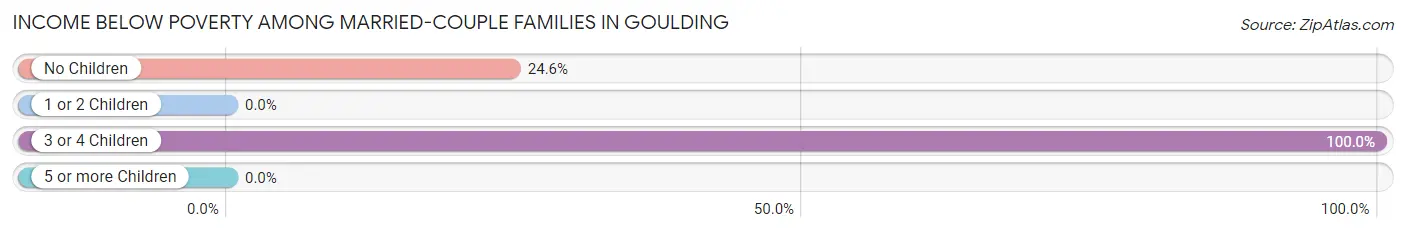
The poverty statistics for married-couple families in Goulding show that 29.3% or 46 of the total 157 families live below the poverty line. Families with 3 or 4 children have the highest poverty rate of 100.0%, comprising of 14 families. On the other hand, families with 1 or 2 children have the lowest poverty rate of 0.0%, which includes 0 families.
| Children | Above Poverty | Below Poverty |
| No Children | 98 (75.4%) | 32 (24.6%) |
| 1 or 2 Children | 13 (100.0%) | 0 (0.0%) |
| 3 or 4 Children | 0 (0.0%) | 14 (100.0%) |
| 5 or more Children | 0 (0.0%) | 0 (0.0%) |
| Total | 111 (70.7%) | 46 (29.3%) |
Income Below Poverty Among Single-Parent Households in Goulding
According to the poverty data in Goulding, 69.6% or 71 single-father households and 24.9% or 58 single-mother households are living below the poverty line. Among single-father households, those with 1 or 2 children have the highest poverty rate, with 59 households (100.0%) experiencing poverty. Likewise, among single-mother households, those with 1 or 2 children have the highest poverty rate, with 44 households (46.8%) falling below the poverty line.
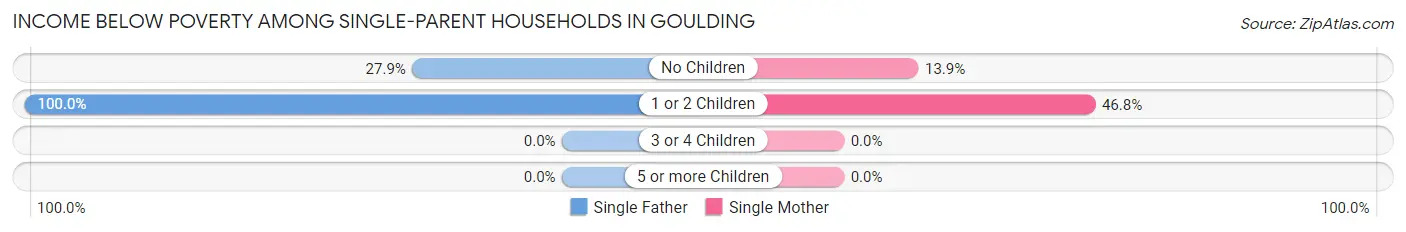
| Children | Single Father | Single Mother |
| No Children | 12 (27.9%) | 14 (13.9%) |
| 1 or 2 Children | 59 (100.0%) | 44 (46.8%) |
| 3 or 4 Children | 0 (0.0%) | 0 (0.0%) |
| 5 or more Children | 0 (0.0%) | 0 (0.0%) |
| Total | 71 (69.6%) | 58 (24.9%) |
Income Below Poverty Among Married-Couple vs Single-Parent Households in Goulding
The poverty data for Goulding shows that 46 of the married-couple family households (29.3%) and 129 of the single-parent households (38.5%) are living below the poverty level. Within the married-couple family households, those with 3 or 4 children have the highest poverty rate, with 14 households (100.0%) falling below the poverty line. Among the single-parent households, those with 1 or 2 children have the highest poverty rate, with 103 household (67.3%) living below poverty.
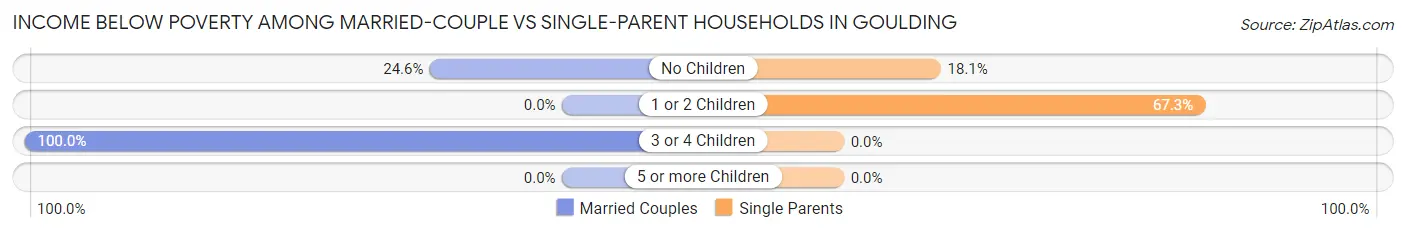
| Children | Married-Couple Families | Single-Parent Households |
| No Children | 32 (24.6%) | 26 (18.1%) |
| 1 or 2 Children | 0 (0.0%) | 103 (67.3%) |
| 3 or 4 Children | 14 (100.0%) | 0 (0.0%) |
| 5 or more Children | 0 (0.0%) | 0 (0.0%) |
| Total | 46 (29.3%) | 129 (38.5%) |
Race in Goulding
The most populous races in Goulding are Black / African American (2,158 | 62.1%), White / Caucasian (974 | 28.0%), and Two or more Races (289 | 8.3%).
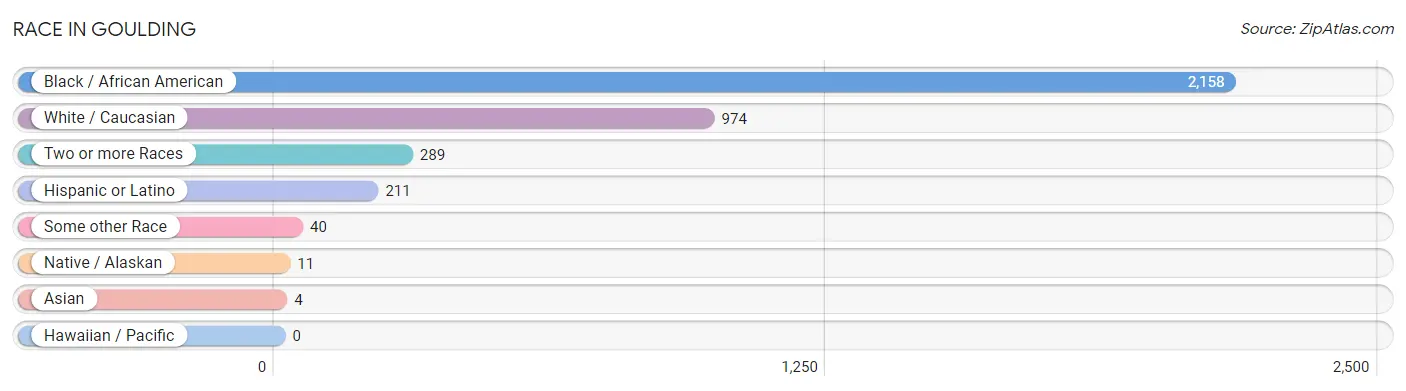
| Race | # Population | % Population |
| Asian | 4 | 0.1% |
| Black / African American | 2,158 | 62.1% |
| Hawaiian / Pacific | 0 | 0.0% |
| Hispanic or Latino | 211 | 6.1% |
| Native / Alaskan | 11 | 0.3% |
| White / Caucasian | 974 | 28.0% |
| Two or more Races | 289 | 8.3% |
| Some other Race | 40 | 1.1% |
| Total | 3,476 | 100.0% |
Ancestry in Goulding
The most populous ancestries reported in Goulding are Irish (229 | 6.6%), German (170 | 4.9%), English (136 | 3.9%), European (109 | 3.1%), and Cuban (71 | 2.0%), together accounting for 20.6% of all Goulding residents.
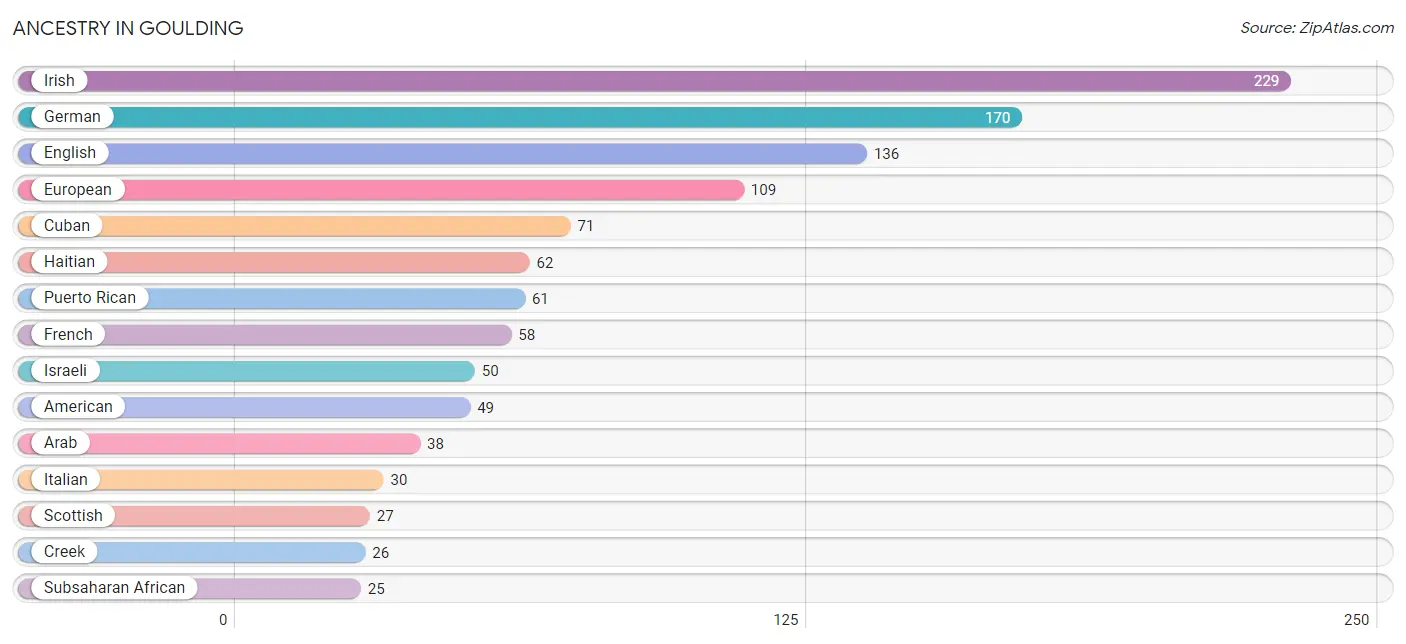
| Ancestry | # Population | % Population |
| African | 17 | 0.5% |
| American | 49 | 1.4% |
| Arab | 38 | 1.1% |
| Blackfeet | 21 | 0.6% |
| Burmese | 4 | 0.1% |
| Celtic | 5 | 0.1% |
| Central American | 5 | 0.1% |
| Cherokee | 21 | 0.6% |
| Creek | 26 | 0.7% |
| Cuban | 71 | 2.0% |
| Czechoslovakian | 5 | 0.1% |
| Dutch | 10 | 0.3% |
| English | 136 | 3.9% |
| European | 109 | 3.1% |
| French | 58 | 1.7% |
| German | 170 | 4.9% |
| Haitian | 62 | 1.8% |
| Honduran | 5 | 0.1% |
| Irish | 229 | 6.6% |
| Israeli | 50 | 1.4% |
| Italian | 30 | 0.9% |
| Korean | 8 | 0.2% |
| Mexican | 21 | 0.6% |
| Norwegian | 9 | 0.3% |
| Polish | 6 | 0.2% |
| Puerto Rican | 61 | 1.8% |
| Scotch-Irish | 20 | 0.6% |
| Scottish | 27 | 0.8% |
| South American Indian | 5 | 0.1% |
| Subsaharan African | 25 | 0.7% |
| Swedish | 18 | 0.5% |
| Ukrainian | 7 | 0.2% |
| Welsh | 13 | 0.4% | View All 33 Rows |
Immigrants in Goulding
The most numerous immigrant groups reported in Goulding came from Latin America (62 | 1.8%), Caribbean (53 | 1.5%), Trinidad and Tobago (31 | 0.9%), Cuba (22 | 0.6%), and Central America (9 | 0.3%), together accounting for 5.1% of all Goulding residents.
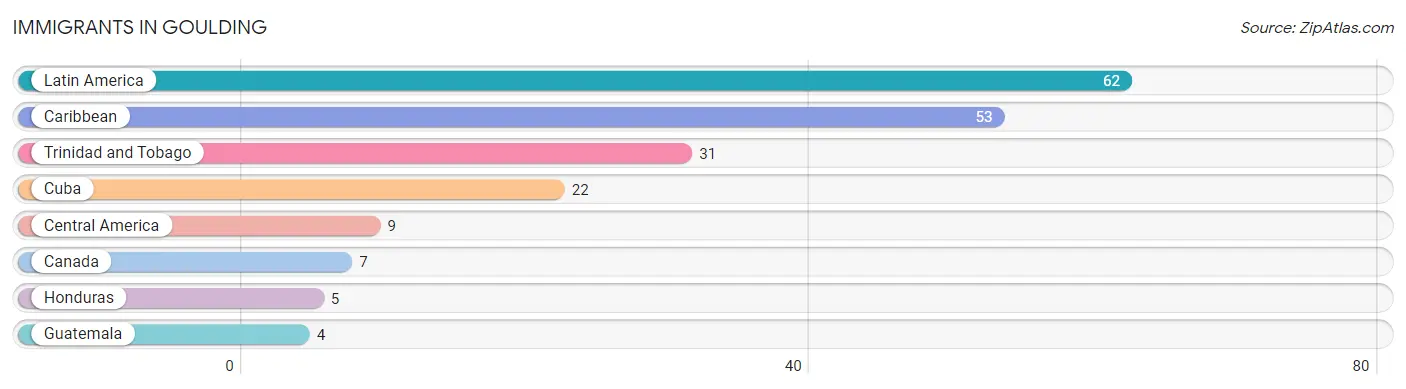
| Immigration Origin | # Population | % Population |
| Canada | 7 | 0.2% |
| Caribbean | 53 | 1.5% |
| Central America | 9 | 0.3% |
| Cuba | 22 | 0.6% |
| Guatemala | 4 | 0.1% |
| Honduras | 5 | 0.1% |
| Latin America | 62 | 1.8% |
| Trinidad and Tobago | 31 | 0.9% | View All 8 Rows |
Sex and Age in Goulding
Sex and Age in Goulding
The most populous age groups in Goulding are 15 to 19 Years (294 | 13.0%) for men and 40 to 44 Years (180 | 14.8%) for women.
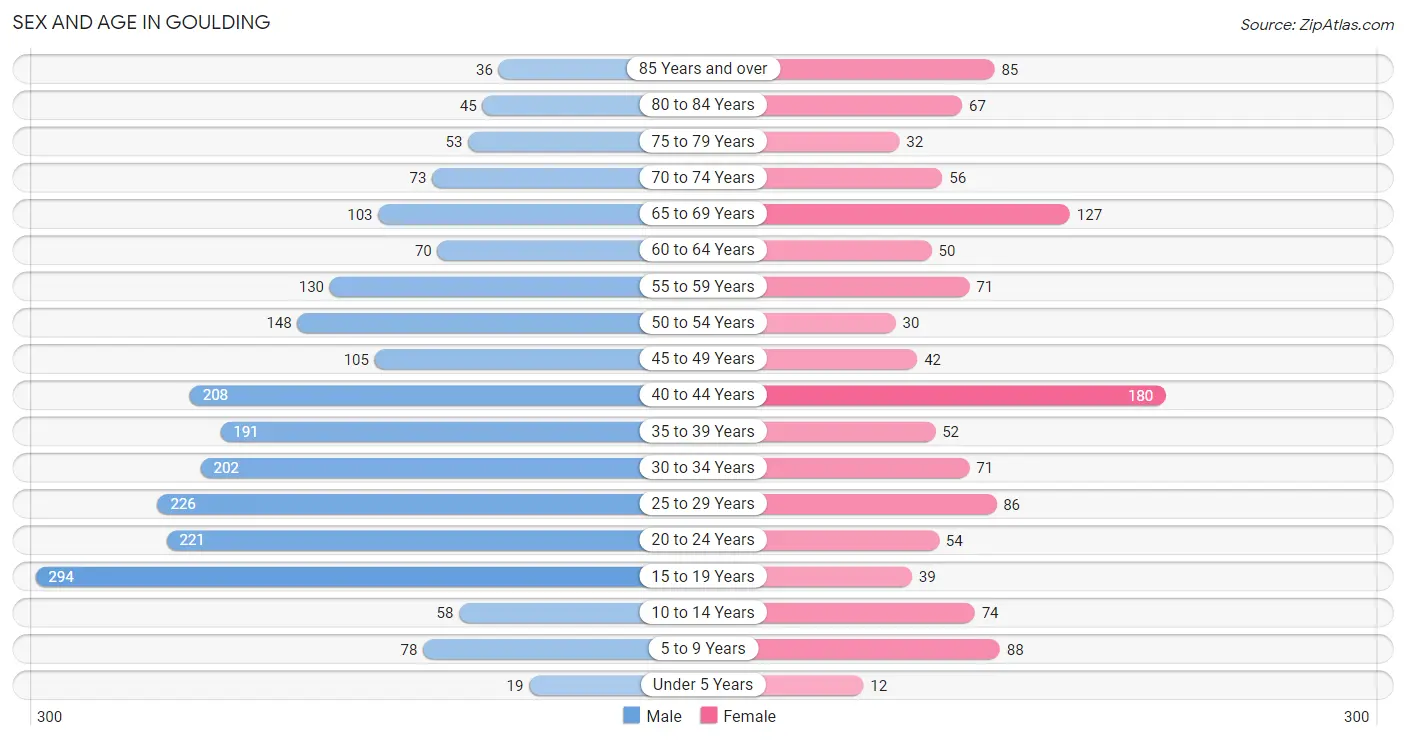
| Age Bracket | Male | Female |
| Under 5 Years | 19 (0.8%) | 12 (1.0%) |
| 5 to 9 Years | 78 (3.5%) | 88 (7.2%) |
| 10 to 14 Years | 58 (2.6%) | 74 (6.1%) |
| 15 to 19 Years | 294 (13.0%) | 39 (3.2%) |
| 20 to 24 Years | 221 (9.8%) | 54 (4.4%) |
| 25 to 29 Years | 226 (10.0%) | 86 (7.1%) |
| 30 to 34 Years | 202 (8.9%) | 71 (5.8%) |
| 35 to 39 Years | 191 (8.5%) | 52 (4.3%) |
| 40 to 44 Years | 208 (9.2%) | 180 (14.8%) |
| 45 to 49 Years | 105 (4.6%) | 42 (3.5%) |
| 50 to 54 Years | 148 (6.6%) | 30 (2.5%) |
| 55 to 59 Years | 130 (5.8%) | 71 (5.8%) |
| 60 to 64 Years | 70 (3.1%) | 50 (4.1%) |
| 65 to 69 Years | 103 (4.6%) | 127 (10.4%) |
| 70 to 74 Years | 73 (3.2%) | 56 (4.6%) |
| 75 to 79 Years | 53 (2.4%) | 32 (2.6%) |
| 80 to 84 Years | 45 (2.0%) | 67 (5.5%) |
| 85 Years and over | 36 (1.6%) | 85 (7.0%) |
| Total | 2,260 (100.0%) | 1,216 (100.0%) |
Families and Households in Goulding
Median Family Size in Goulding
The median family size in Goulding is 3.23 persons per family, with single female/mother families (233 | 47.4%) accounting for the largest median family size of 4.31 persons per family. On the other hand, single male/father families (102 | 20.7%) represent the smallest median family size with 1.90 persons per family.
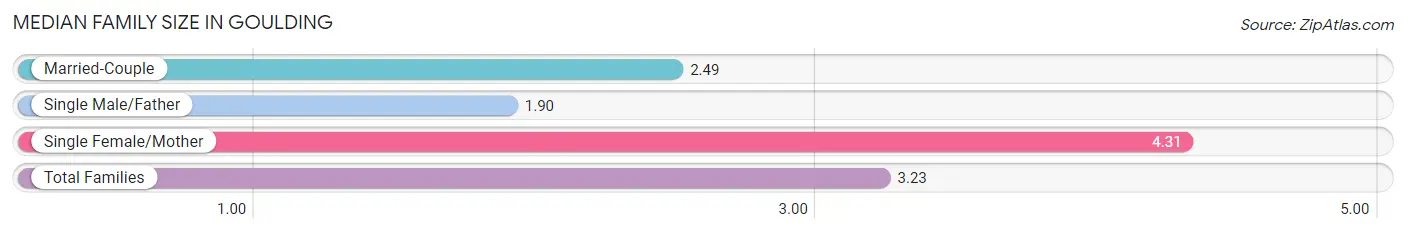
| Family Type | # Families | Family Size |
| Married-Couple | 157 (31.9%) | 2.49 |
| Single Male/Father | 102 (20.7%) | 1.90 |
| Single Female/Mother | 233 (47.4%) | 4.31 |
| Total Families | 492 (100.0%) | 3.23 |
Median Household Size in Goulding
The median household size in Goulding is 2.19 persons per household, with single female/mother households (233 | 24.9%) accounting for the largest median household size of 4.31 persons per household. non-family households (445 | 47.5%) represent the smallest median household size with 1.03 persons per household.
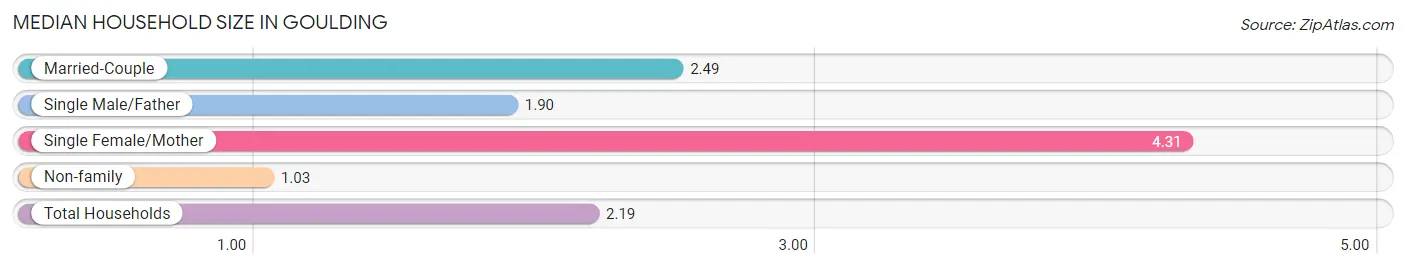
| Household Type | # Households | Household Size |
| Married-Couple | 157 (16.8%) | 2.49 |
| Single Male/Father | 102 (10.9%) | 1.90 |
| Single Female/Mother | 233 (24.9%) | 4.31 |
| Non-family | 445 (47.5%) | 1.03 |
| Total Households | 937 (100.0%) | 2.19 |
Household Size by Marriage Status in Goulding
Out of a total of 937 households in Goulding, 492 (52.5%) are family households, while 445 (47.5%) are nonfamily households. The most numerous type of family households are 2-person households, comprising 269, and the most common type of nonfamily households are 1-person households, comprising 433.
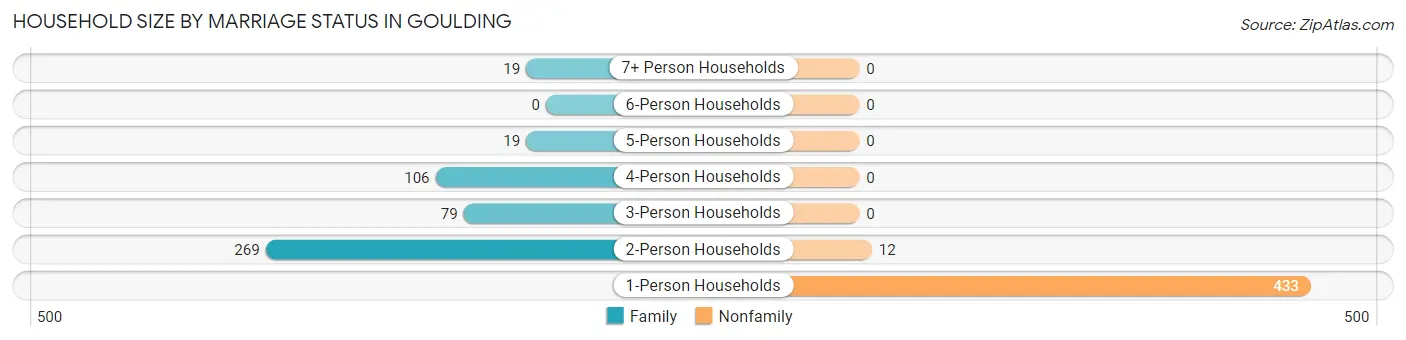
| Household Size | Family Households | Nonfamily Households |
| 1-Person Households | - | 433 (46.2%) |
| 2-Person Households | 269 (28.7%) | 12 (1.3%) |
| 3-Person Households | 79 (8.4%) | 0 (0.0%) |
| 4-Person Households | 106 (11.3%) | 0 (0.0%) |
| 5-Person Households | 19 (2.0%) | 0 (0.0%) |
| 6-Person Households | 0 (0.0%) | 0 (0.0%) |
| 7+ Person Households | 19 (2.0%) | 0 (0.0%) |
| Total | 492 (52.5%) | 445 (47.5%) |
Female Fertility in Goulding
Fertility by Age in Goulding
Average fertility rate in Goulding is 36.0 births per 1,000 women. Women in the age bracket of 20 to 34 years have the highest fertility rate with 66.0 births per 1,000 women. Women in the age bracket of 20 to 34 years acount for 73.7% of all women with births.
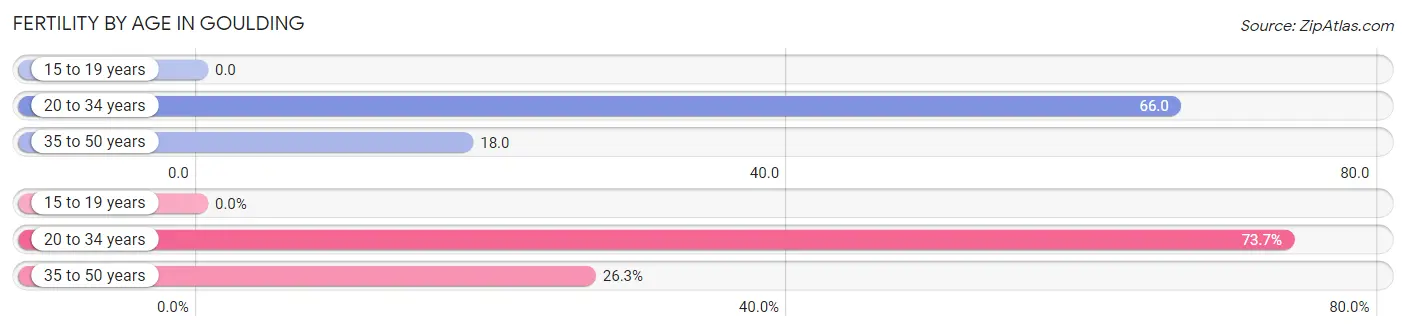
| Age Bracket | Women with Births | Births / 1,000 Women |
| 15 to 19 years | 0 (0.0%) | 0.0 |
| 20 to 34 years | 14 (73.7%) | 66.0 |
| 35 to 50 years | 5 (26.3%) | 18.0 |
| Total | 19 (100.0%) | 36.0 |
Fertility by Age by Marriage Status in Goulding
73.7% of women with births (19) in Goulding are married. The highest percentage of unmarried women with births falls into 35 to 50 years age bracket with 100.0% of them unmarried at the time of birth, while the lowest percentage of unmarried women with births belong to 20 to 34 years age bracket with 0.0% of them unmarried.
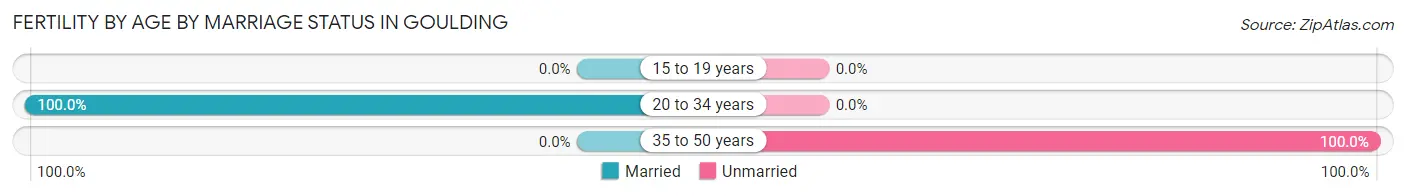
| Age Bracket | Married | Unmarried |
| 15 to 19 years | 0 (0.0%) | 0 (0.0%) |
| 20 to 34 years | 14 (100.0%) | 0 (0.0%) |
| 35 to 50 years | 0 (0.0%) | 5 (100.0%) |
| Total | 14 (73.7%) | 5 (26.3%) |
Fertility by Education in Goulding
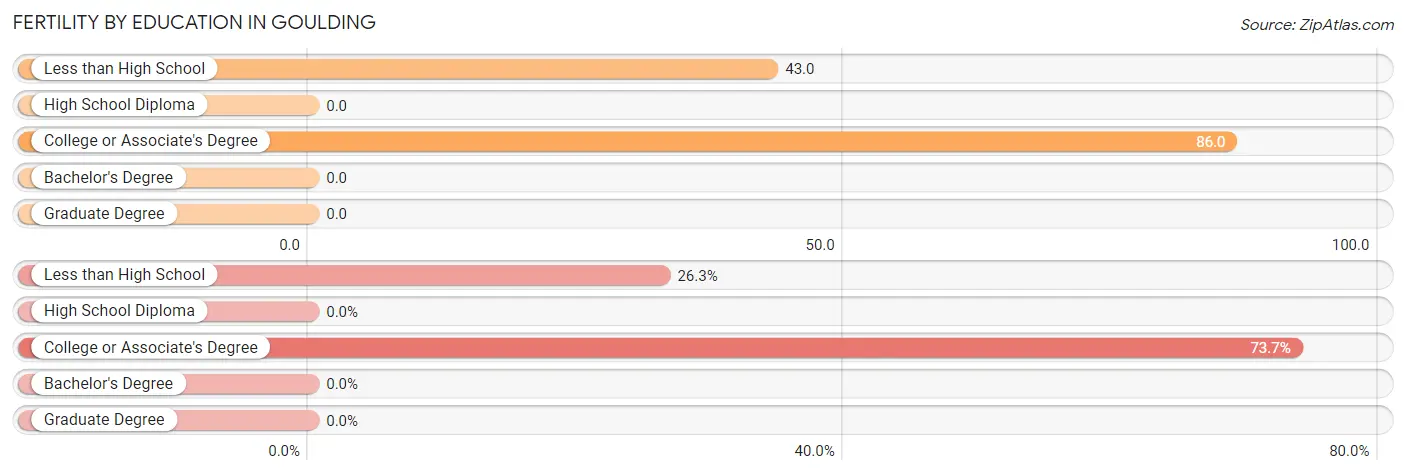
| Educational Attainment | Women with Births | Births / 1,000 Women |
| Less than High School | 5 (26.3%) | 43.0 |
| High School Diploma | 0 (0.0%) | 0.0 |
| College or Associate's Degree | 14 (73.7%) | 86.0 |
| Bachelor's Degree | 0 (0.0%) | 0.0 |
| Graduate Degree | 0 (0.0%) | 0.0 |
| Total | 19 (100.0%) | 36.0 |
Fertility by Education by Marriage Status in Goulding
26.3% of women with births in Goulding are unmarried. Women with the educational attainment of college or associate's degree are most likely to be married with 100.0% of them married at childbirth, while women with the educational attainment of less than high school are least likely to be married with 100.0% of them unmarried at childbirth.
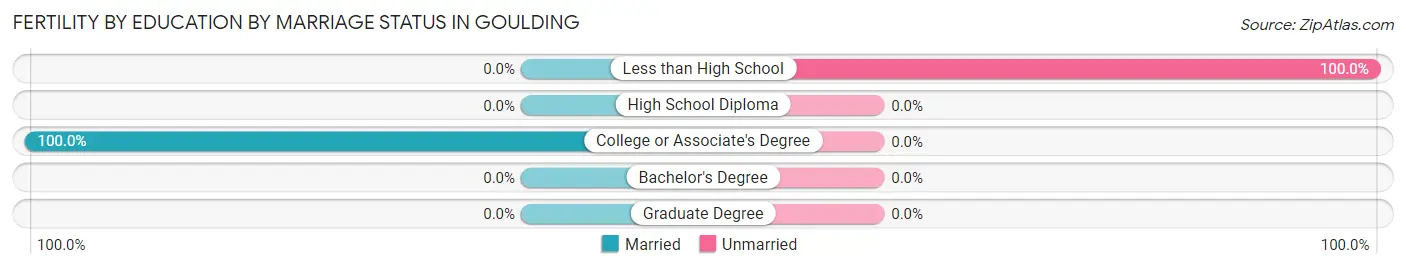
| Educational Attainment | Married | Unmarried |
| Less than High School | 0 (0.0%) | 5 (100.0%) |
| High School Diploma | 0 (0.0%) | 0 (0.0%) |
| College or Associate's Degree | 14 (100.0%) | 0 (0.0%) |
| Bachelor's Degree | 0 (0.0%) | 0 (0.0%) |
| Graduate Degree | 0 (0.0%) | 0 (0.0%) |
| Total | 14 (73.7%) | 5 (26.3%) |
Employment Characteristics in Goulding
Employment by Class of Employer in Goulding
Among the 716 employed individuals in Goulding, private company employees (569 | 79.5%), local government employees (95 | 13.3%), and self-employed (incorporated) (35 | 4.9%) make up the most common classes of employment.
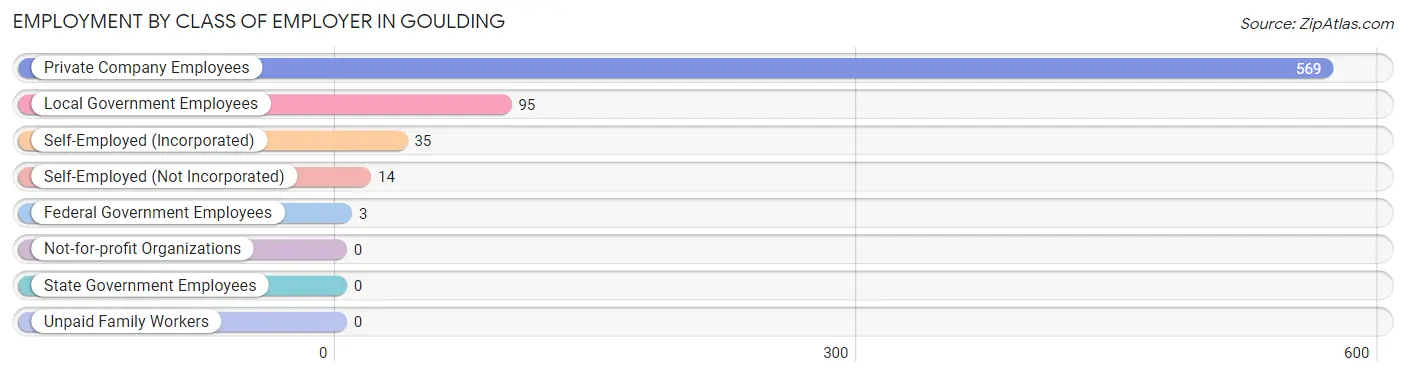
| Employer Class | # Employees | % Employees |
| Private Company Employees | 569 | 79.5% |
| Self-Employed (Incorporated) | 35 | 4.9% |
| Self-Employed (Not Incorporated) | 14 | 2.0% |
| Not-for-profit Organizations | 0 | 0.0% |
| Local Government Employees | 95 | 13.3% |
| State Government Employees | 0 | 0.0% |
| Federal Government Employees | 3 | 0.4% |
| Unpaid Family Workers | 0 | 0.0% |
| Total | 716 | 100.0% |
Employment Status by Age in Goulding
According to the labor force statistics for Goulding, out of the total population over 16 years of age (3,130), 26.8% or 839 individuals are in the labor force, with 14.7% or 123 of them unemployed. The age group with the highest labor force participation rate is 20 to 24 years, with 55.6% or 153 individuals in the labor force. Within the labor force, the 25 to 29 years age range has the highest percentage of unemployed individuals, with 60.9% or 70 of them being unemployed.
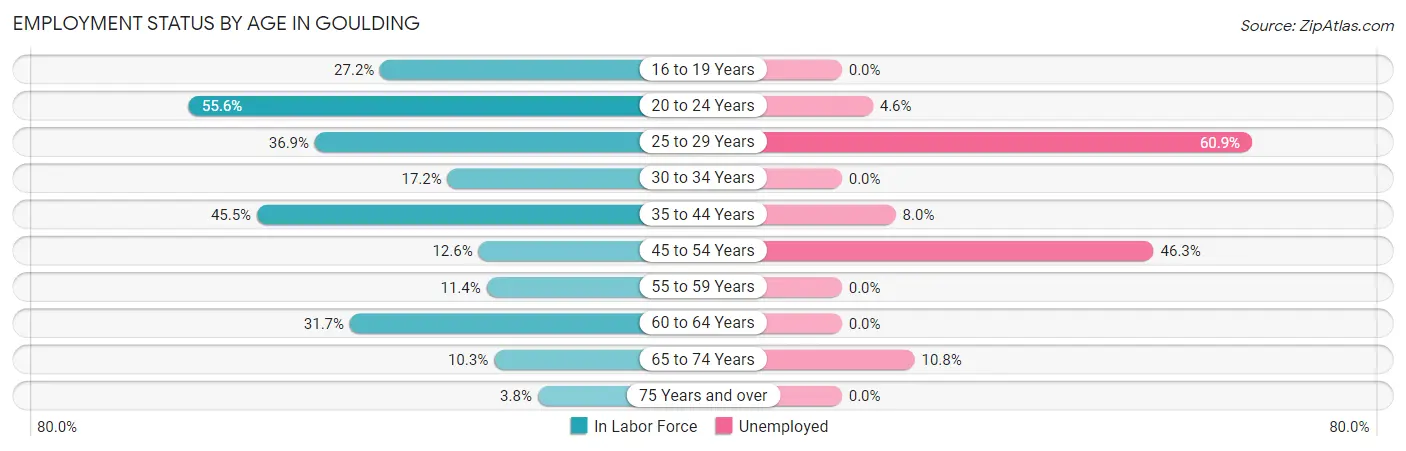
| Age Bracket | In Labor Force | Unemployed |
| 16 to 19 Years | 86 (27.2%) | 0 (0.0%) |
| 20 to 24 Years | 153 (55.6%) | 7 (4.6%) |
| 25 to 29 Years | 115 (36.9%) | 70 (60.9%) |
| 30 to 34 Years | 47 (17.2%) | 0 (0.0%) |
| 35 to 44 Years | 287 (45.5%) | 23 (8.0%) |
| 45 to 54 Years | 41 (12.6%) | 19 (46.3%) |
| 55 to 59 Years | 23 (11.4%) | 0 (0.0%) |
| 60 to 64 Years | 38 (31.7%) | 0 (0.0%) |
| 65 to 74 Years | 37 (10.3%) | 4 (10.8%) |
| 75 Years and over | 12 (3.8%) | 0 (0.0%) |
| Total | 839 (26.8%) | 123 (14.7%) |
Employment Status by Educational Attainment in Goulding
According to labor force statistics for Goulding, 29.6% of individuals (551) out of the total population between 25 and 64 years of age (1,862) are in the labor force, with 20.3% or 112 of them being unemployed. The group with the highest labor force participation rate are those with the educational attainment of bachelor's degree or higher, with 77.9% or 67 individuals in the labor force. Within the labor force, individuals with bachelor's degree or higher education have the highest percentage of unemployment, with 56.7% or 38 of them being unemployed.
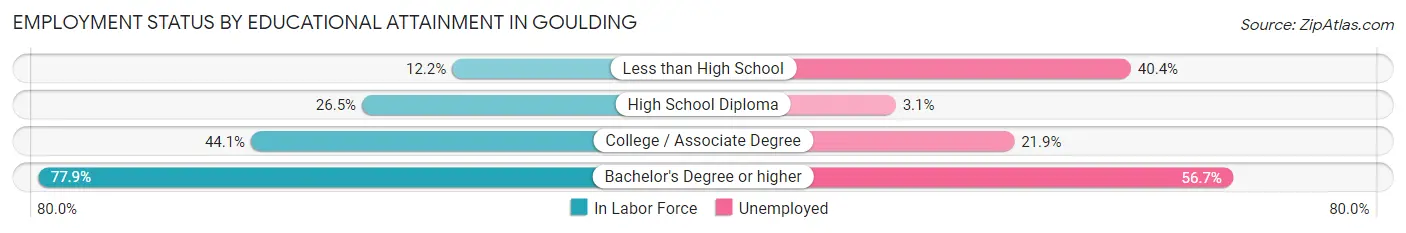
| Educational Attainment | In Labor Force | Unemployed |
| Less than High School | 57 (12.2%) | 189 (40.4%) |
| High School Diploma | 226 (26.5%) | 26 (3.1%) |
| College / Associate Degree | 201 (44.1%) | 100 (21.9%) |
| Bachelor's Degree or higher | 67 (77.9%) | 49 (56.7%) |
| Total | 551 (29.6%) | 378 (20.3%) |
Employment Occupations by Sex in Goulding
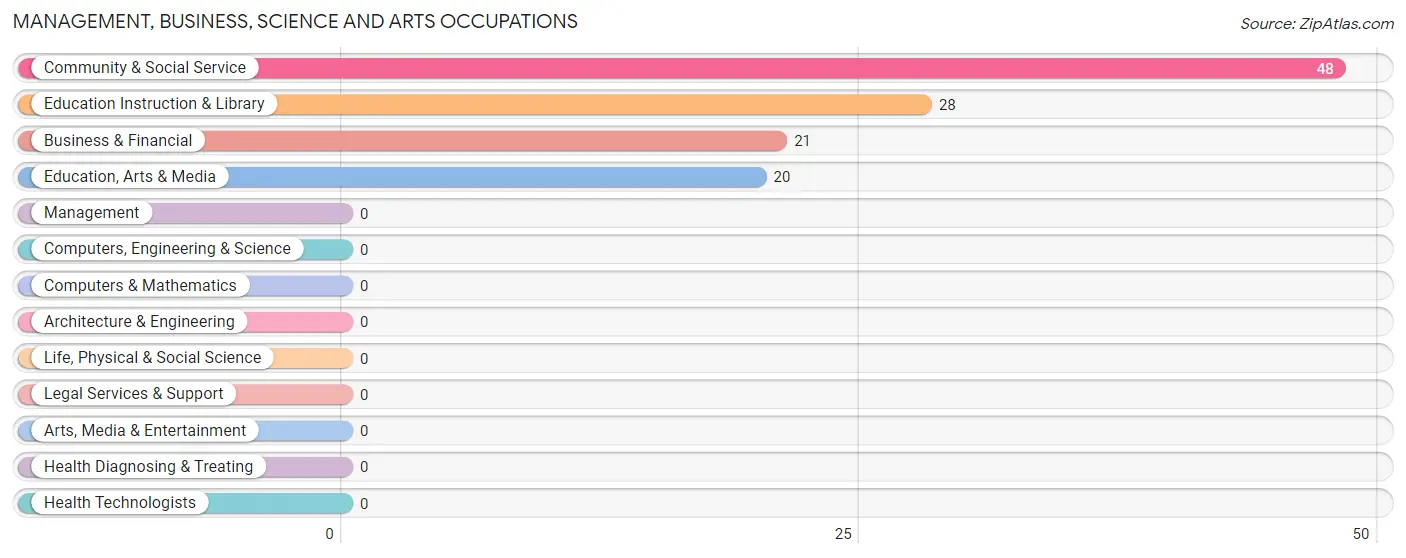
Management, Business, Science and Arts Occupations
The most common Management, Business, Science and Arts occupations in Goulding are Community & Social Service (48 | 6.7%), Education Instruction & Library (28 | 3.9%), Business & Financial (21 | 2.9%), and Education, Arts & Media (20 | 2.8%).
Management, Business, Science and Arts Occupations by Sex
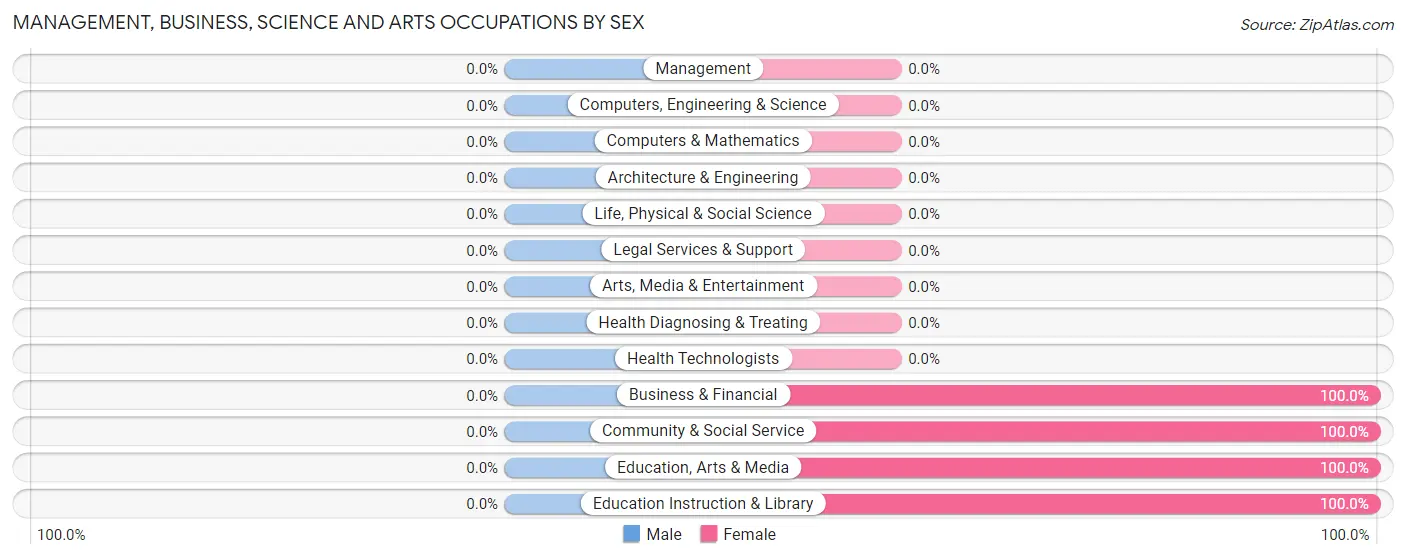
| Occupation | Male | Female |
| Management | 0 (0.0%) | 0 (0.0%) |
| Business & Financial | 0 (0.0%) | 21 (100.0%) |
| Computers, Engineering & Science | 0 (0.0%) | 0 (0.0%) |
| Computers & Mathematics | 0 (0.0%) | 0 (0.0%) |
| Architecture & Engineering | 0 (0.0%) | 0 (0.0%) |
| Life, Physical & Social Science | 0 (0.0%) | 0 (0.0%) |
| Community & Social Service | 0 (0.0%) | 48 (100.0%) |
| Education, Arts & Media | 0 (0.0%) | 20 (100.0%) |
| Legal Services & Support | 0 (0.0%) | 0 (0.0%) |
| Education Instruction & Library | 0 (0.0%) | 28 (100.0%) |
| Arts, Media & Entertainment | 0 (0.0%) | 0 (0.0%) |
| Health Diagnosing & Treating | 0 (0.0%) | 0 (0.0%) |
| Health Technologists | 0 (0.0%) | 0 (0.0%) |
| Total (Category) | 0 (0.0%) | 69 (100.0%) |
| Total (Overall) | 342 (47.8%) | 374 (52.2%) |
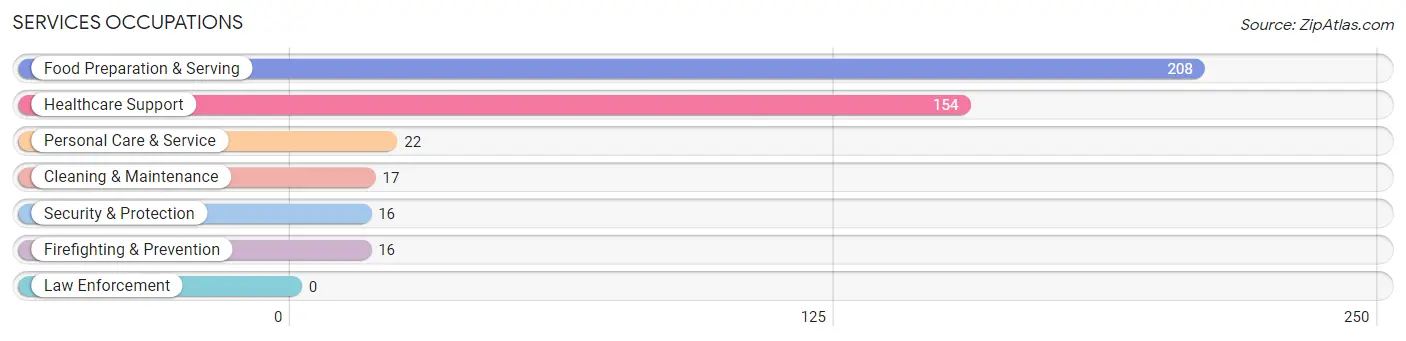
Services Occupations
The most common Services occupations in Goulding are Food Preparation & Serving (208 | 29.0%), Healthcare Support (154 | 21.5%), Personal Care & Service (22 | 3.1%), Cleaning & Maintenance (17 | 2.4%), and Security & Protection (16 | 2.2%).
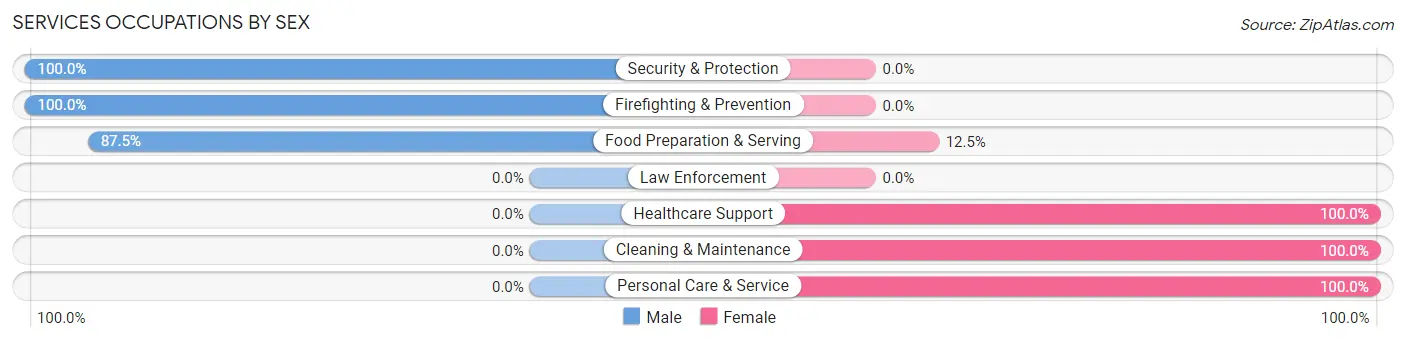
Services Occupations by Sex
Within the Services occupations in Goulding, the most male-oriented occupations are Security & Protection (100.0%), Firefighting & Prevention (100.0%), and Food Preparation & Serving (87.5%), while the most female-oriented occupations are Healthcare Support (100.0%), Cleaning & Maintenance (100.0%), and Personal Care & Service (100.0%).
| Occupation | Male | Female |
| Healthcare Support | 0 (0.0%) | 154 (100.0%) |
| Security & Protection | 16 (100.0%) | 0 (0.0%) |
| Firefighting & Prevention | 16 (100.0%) | 0 (0.0%) |
| Law Enforcement | 0 (0.0%) | 0 (0.0%) |
| Food Preparation & Serving | 182 (87.5%) | 26 (12.5%) |
| Cleaning & Maintenance | 0 (0.0%) | 17 (100.0%) |
| Personal Care & Service | 0 (0.0%) | 22 (100.0%) |
| Total (Category) | 198 (47.5%) | 219 (52.5%) |
| Total (Overall) | 342 (47.8%) | 374 (52.2%) |
Sales and Office Occupations
The most common Sales and Office occupations in Goulding are Sales & Related (45 | 6.3%), and Office & Administration (41 | 5.7%).

Sales and Office Occupations by Sex
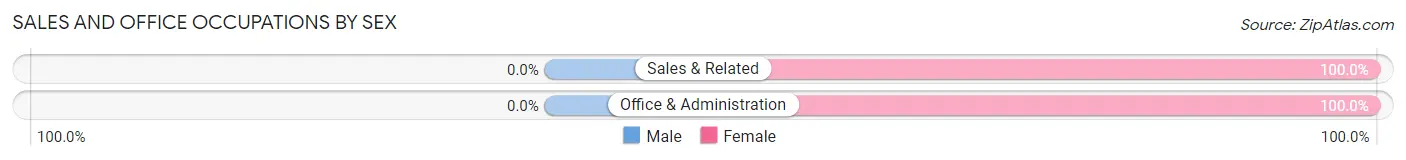
| Occupation | Male | Female |
| Sales & Related | 0 (0.0%) | 45 (100.0%) |
| Office & Administration | 0 (0.0%) | 41 (100.0%) |
| Total (Category) | 0 (0.0%) | 86 (100.0%) |
| Total (Overall) | 342 (47.8%) | 374 (52.2%) |
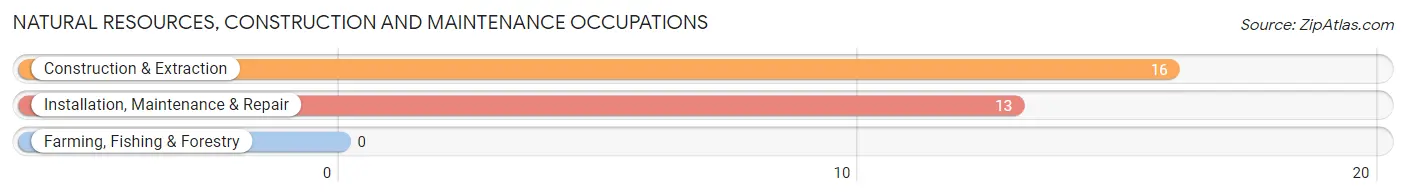
Natural Resources, Construction and Maintenance Occupations
The most common Natural Resources, Construction and Maintenance occupations in Goulding are Construction & Extraction (16 | 2.2%), and Installation, Maintenance & Repair (13 | 1.8%).
Natural Resources, Construction and Maintenance Occupations by Sex
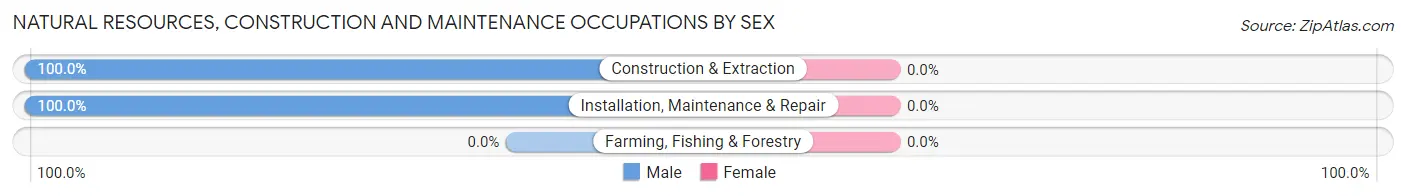
| Occupation | Male | Female |
| Farming, Fishing & Forestry | 0 (0.0%) | 0 (0.0%) |
| Construction & Extraction | 16 (100.0%) | 0 (0.0%) |
| Installation, Maintenance & Repair | 13 (100.0%) | 0 (0.0%) |
| Total (Category) | 29 (100.0%) | 0 (0.0%) |
| Total (Overall) | 342 (47.8%) | 374 (52.2%) |
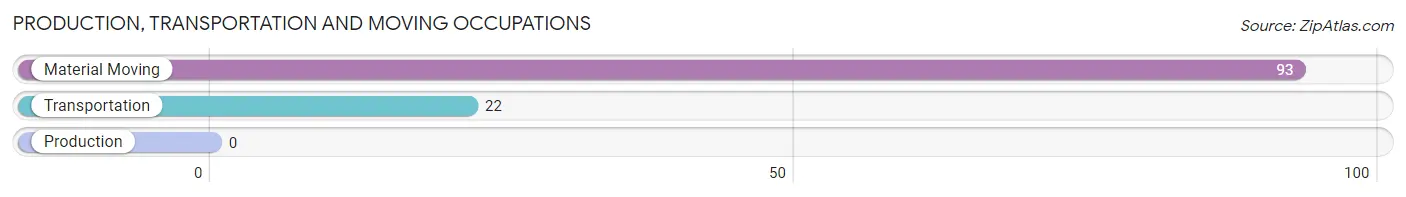
Production, Transportation and Moving Occupations
The most common Production, Transportation and Moving occupations in Goulding are Material Moving (93 | 13.0%), and Transportation (22 | 3.1%).
Production, Transportation and Moving Occupations by Sex
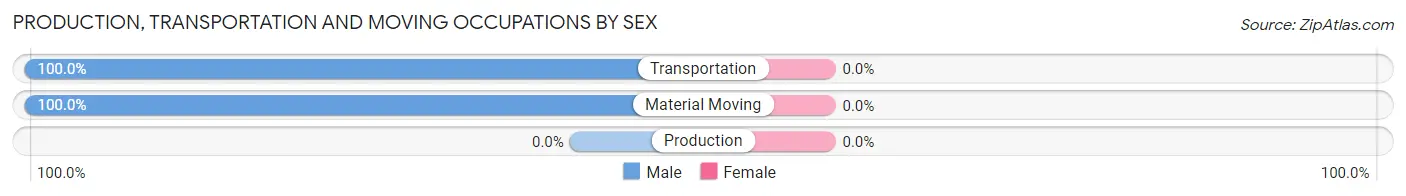
| Occupation | Male | Female |
| Production | 0 (0.0%) | 0 (0.0%) |
| Transportation | 22 (100.0%) | 0 (0.0%) |
| Material Moving | 93 (100.0%) | 0 (0.0%) |
| Total (Category) | 115 (100.0%) | 0 (0.0%) |
| Total (Overall) | 342 (47.8%) | 374 (52.2%) |
Employment Industries by Sex in Goulding
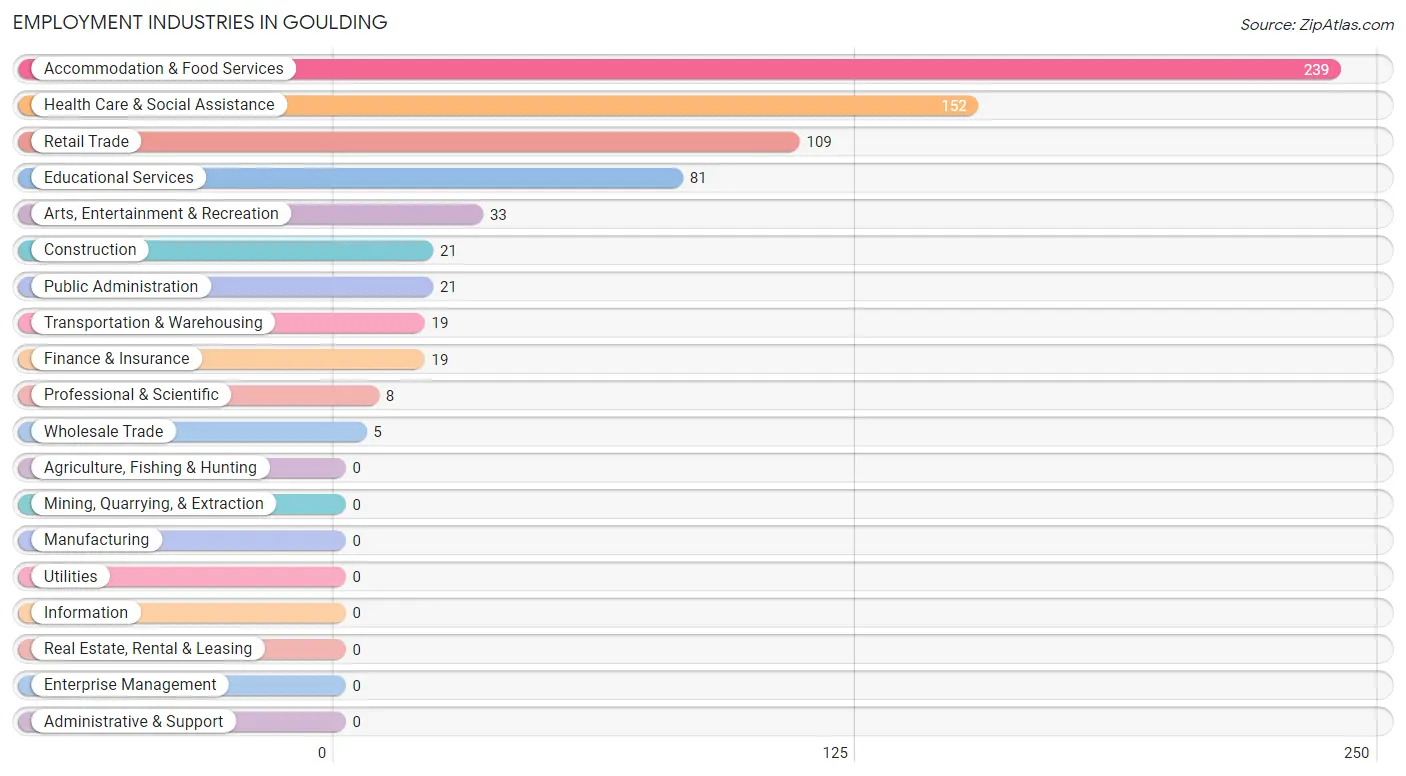
Employment Industries in Goulding
The major employment industries in Goulding include Accommodation & Food Services (239 | 33.4%), Health Care & Social Assistance (152 | 21.2%), Retail Trade (109 | 15.2%), Educational Services (81 | 11.3%), and Arts, Entertainment & Recreation (33 | 4.6%).
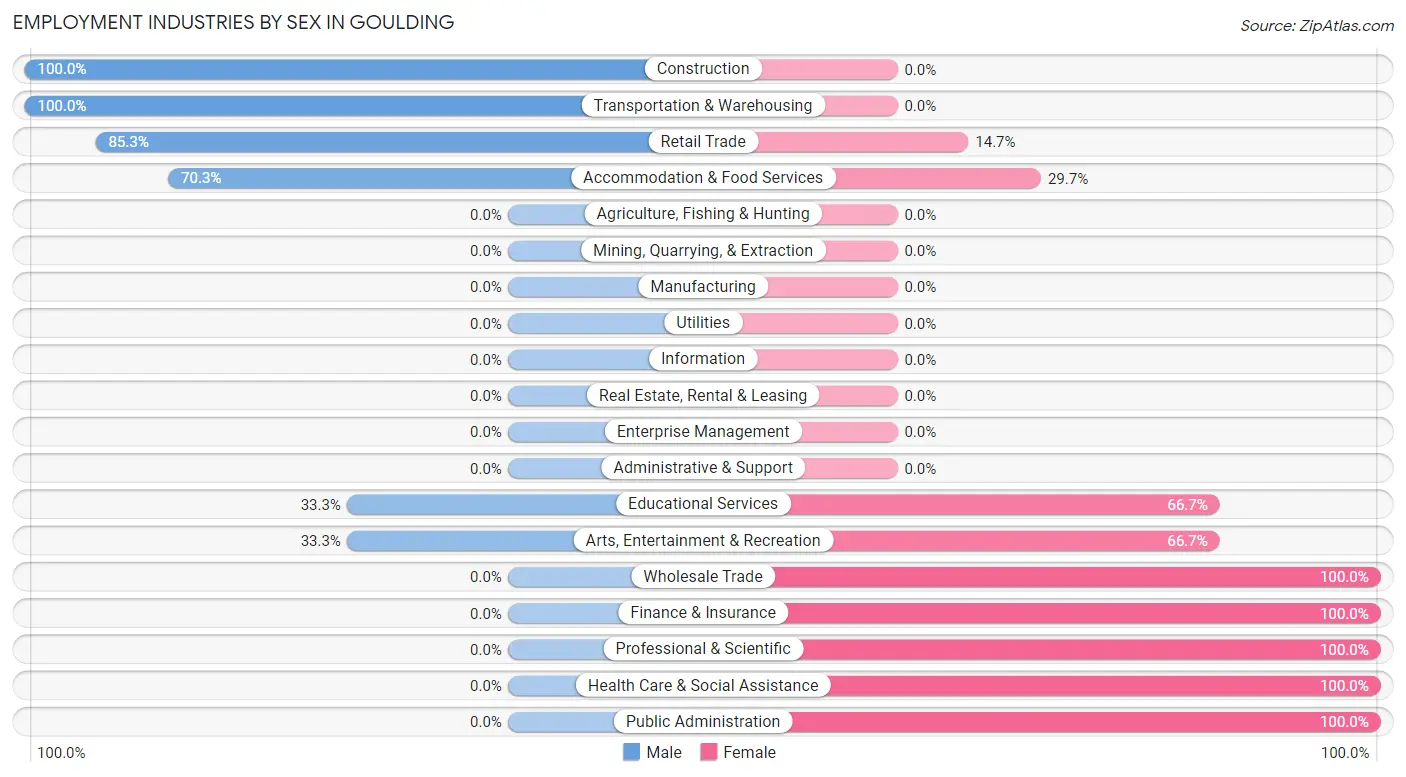
Employment Industries by Sex in Goulding
The Goulding industries that see more men than women are Construction (100.0%), Transportation & Warehousing (100.0%), and Retail Trade (85.3%), whereas the industries that tend to have a higher number of women are Wholesale Trade (100.0%), Finance & Insurance (100.0%), and Professional & Scientific (100.0%).
| Industry | Male | Female |
| Agriculture, Fishing & Hunting | 0 (0.0%) | 0 (0.0%) |
| Mining, Quarrying, & Extraction | 0 (0.0%) | 0 (0.0%) |
| Construction | 21 (100.0%) | 0 (0.0%) |
| Manufacturing | 0 (0.0%) | 0 (0.0%) |
| Wholesale Trade | 0 (0.0%) | 5 (100.0%) |
| Retail Trade | 93 (85.3%) | 16 (14.7%) |
| Transportation & Warehousing | 19 (100.0%) | 0 (0.0%) |
| Utilities | 0 (0.0%) | 0 (0.0%) |
| Information | 0 (0.0%) | 0 (0.0%) |
| Finance & Insurance | 0 (0.0%) | 19 (100.0%) |
| Real Estate, Rental & Leasing | 0 (0.0%) | 0 (0.0%) |
| Professional & Scientific | 0 (0.0%) | 8 (100.0%) |
| Enterprise Management | 0 (0.0%) | 0 (0.0%) |
| Administrative & Support | 0 (0.0%) | 0 (0.0%) |
| Educational Services | 27 (33.3%) | 54 (66.7%) |
| Health Care & Social Assistance | 0 (0.0%) | 152 (100.0%) |
| Arts, Entertainment & Recreation | 11 (33.3%) | 22 (66.7%) |
| Accommodation & Food Services | 168 (70.3%) | 71 (29.7%) |
| Public Administration | 0 (0.0%) | 21 (100.0%) |
| Total | 342 (47.8%) | 374 (52.2%) |
Education in Goulding
School Enrollment in Goulding
The most common levels of schooling among the 514 students in Goulding are high school (146 | 28.4%), middle school (127 | 24.7%), and elementary school (81 | 15.8%).

| School Level | # Students | % Students |
| Nursery / Preschool | 19 | 3.7% |
| Kindergarten | 69 | 13.4% |
| Elementary School | 81 | 15.8% |
| Middle School | 127 | 24.7% |
| High School | 146 | 28.4% |
| College / Undergraduate | 50 | 9.7% |
| Graduate / Professional | 22 | 4.3% |
| Total | 514 | 100.0% |
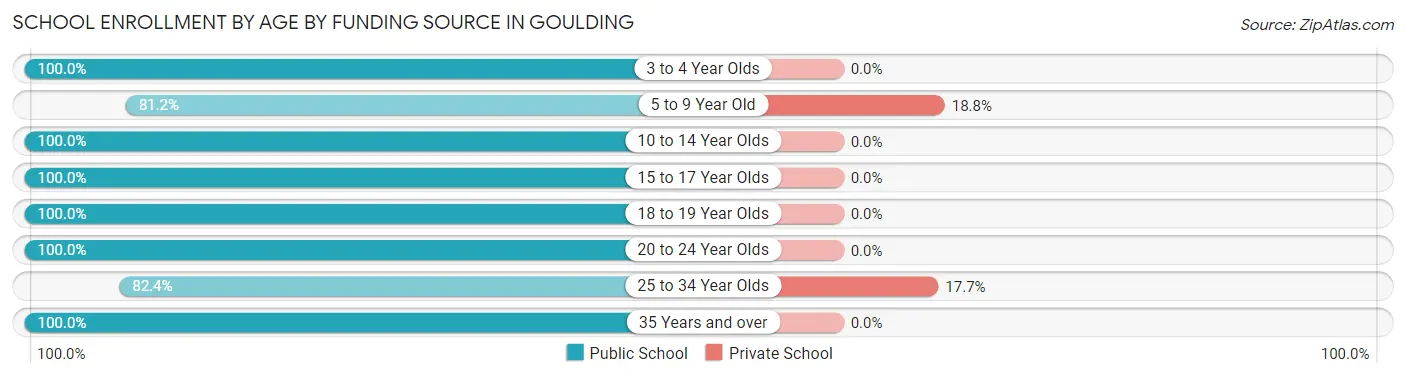
School Enrollment by Age by Funding Source in Goulding
Out of a total of 514 students who are enrolled in schools in Goulding, 41 (8.0%) attend a private institution, while the remaining 473 (92.0%) are enrolled in public schools. The age group of 5 to 9 year old has the highest likelihood of being enrolled in private schools, with 26 (18.8% in the age bracket) enrolled. Conversely, the age group of 3 to 4 year olds has the lowest likelihood of being enrolled in a private school, with 12 (100.0% in the age bracket) attending a public institution.
| Age Bracket | Public School | Private School |
| 3 to 4 Year Olds | 12 (100.0%) | 0 (0.0%) |
| 5 to 9 Year Old | 112 (81.2%) | 26 (18.8%) |
| 10 to 14 Year Olds | 132 (100.0%) | 0 (0.0%) |
| 15 to 17 Year Olds | 82 (100.0%) | 0 (0.0%) |
| 18 to 19 Year Olds | 28 (100.0%) | 0 (0.0%) |
| 20 to 24 Year Olds | 5 (100.0%) | 0 (0.0%) |
| 25 to 34 Year Olds | 70 (82.4%) | 15 (17.6%) |
| 35 Years and over | 32 (100.0%) | 0 (0.0%) |
| Total | 473 (92.0%) | 41 (8.0%) |
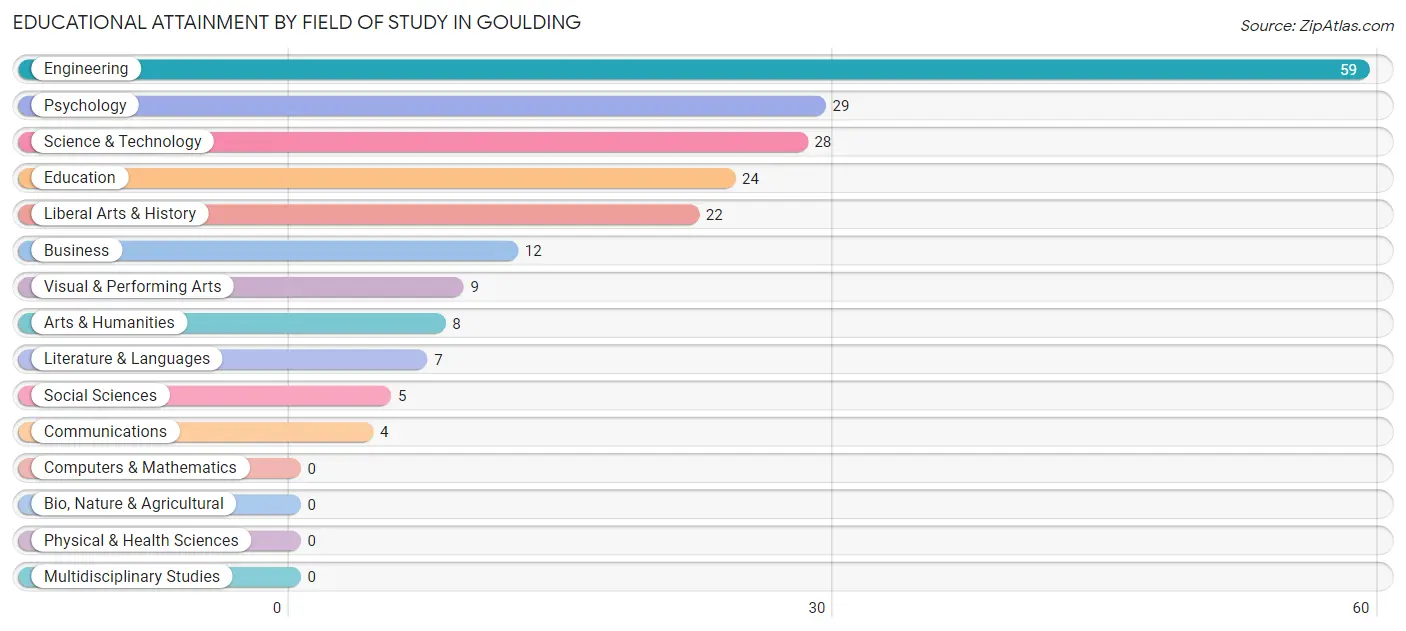
Educational Attainment by Field of Study in Goulding
Engineering (59 | 28.5%), psychology (29 | 14.0%), science & technology (28 | 13.5%), education (24 | 11.6%), and liberal arts & history (22 | 10.6%) are the most common fields of study among 207 individuals in Goulding who have obtained a bachelor's degree or higher.
| Field of Study | # Graduates | % Graduates |
| Computers & Mathematics | 0 | 0.0% |
| Bio, Nature & Agricultural | 0 | 0.0% |
| Physical & Health Sciences | 0 | 0.0% |
| Psychology | 29 | 14.0% |
| Social Sciences | 5 | 2.4% |
| Engineering | 59 | 28.5% |
| Multidisciplinary Studies | 0 | 0.0% |
| Science & Technology | 28 | 13.5% |
| Business | 12 | 5.8% |
| Education | 24 | 11.6% |
| Literature & Languages | 7 | 3.4% |
| Liberal Arts & History | 22 | 10.6% |
| Visual & Performing Arts | 9 | 4.3% |
| Communications | 4 | 1.9% |
| Arts & Humanities | 8 | 3.9% |
| Total | 207 | 100.0% |
Transportation & Commute in Goulding
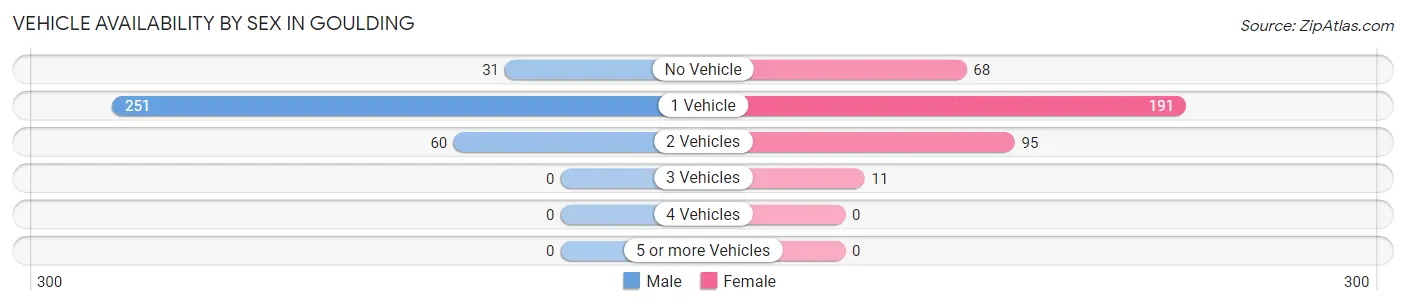
Vehicle Availability by Sex in Goulding
The most prevalent vehicle ownership categories in Goulding are males with 1 vehicle (251, accounting for 73.4%) and females with 1 vehicle (191, making up 68.8%).
| Vehicles Available | Male | Female |
| No Vehicle | 31 (9.1%) | 68 (18.6%) |
| 1 Vehicle | 251 (73.4%) | 191 (52.3%) |
| 2 Vehicles | 60 (17.5%) | 95 (26.0%) |
| 3 Vehicles | 0 (0.0%) | 11 (3.0%) |
| 4 Vehicles | 0 (0.0%) | 0 (0.0%) |
| 5 or more Vehicles | 0 (0.0%) | 0 (0.0%) |
| Total | 342 (100.0%) | 365 (100.0%) |
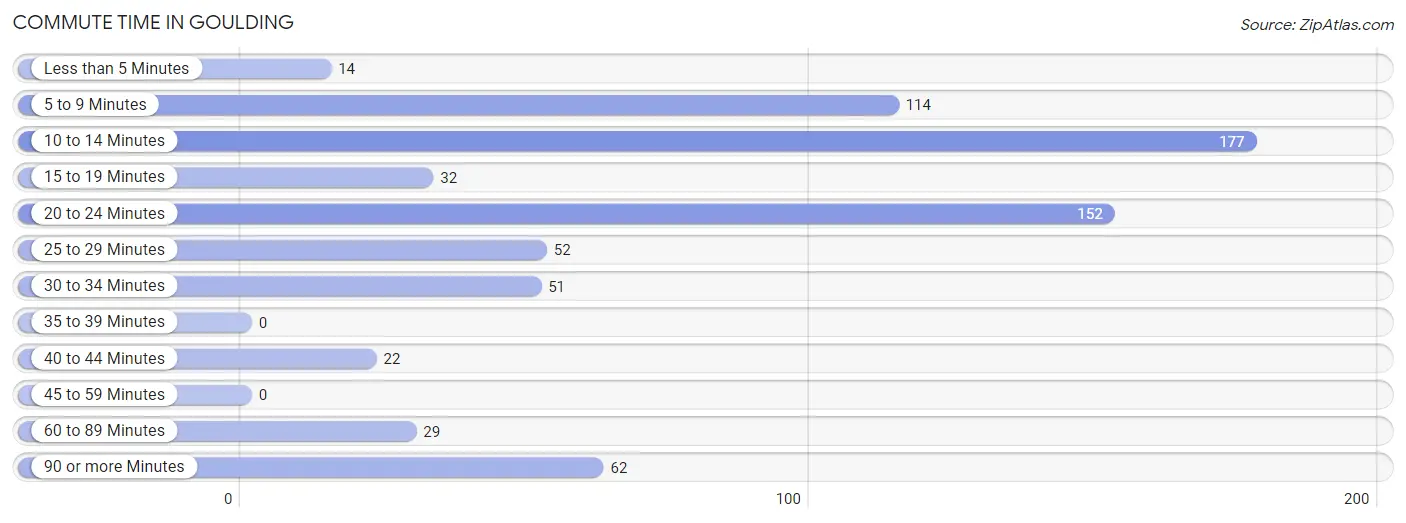
Commute Time in Goulding
The most frequently occuring commute durations in Goulding are 10 to 14 minutes (177 commuters, 25.1%), 20 to 24 minutes (152 commuters, 21.6%), and 5 to 9 minutes (114 commuters, 16.2%).
| Commute Time | # Commuters | % Commuters |
| Less than 5 Minutes | 14 | 2.0% |
| 5 to 9 Minutes | 114 | 16.2% |
| 10 to 14 Minutes | 177 | 25.1% |
| 15 to 19 Minutes | 32 | 4.5% |
| 20 to 24 Minutes | 152 | 21.6% |
| 25 to 29 Minutes | 52 | 7.4% |
| 30 to 34 Minutes | 51 | 7.2% |
| 35 to 39 Minutes | 0 | 0.0% |
| 40 to 44 Minutes | 22 | 3.1% |
| 45 to 59 Minutes | 0 | 0.0% |
| 60 to 89 Minutes | 29 | 4.1% |
| 90 or more Minutes | 62 | 8.8% |
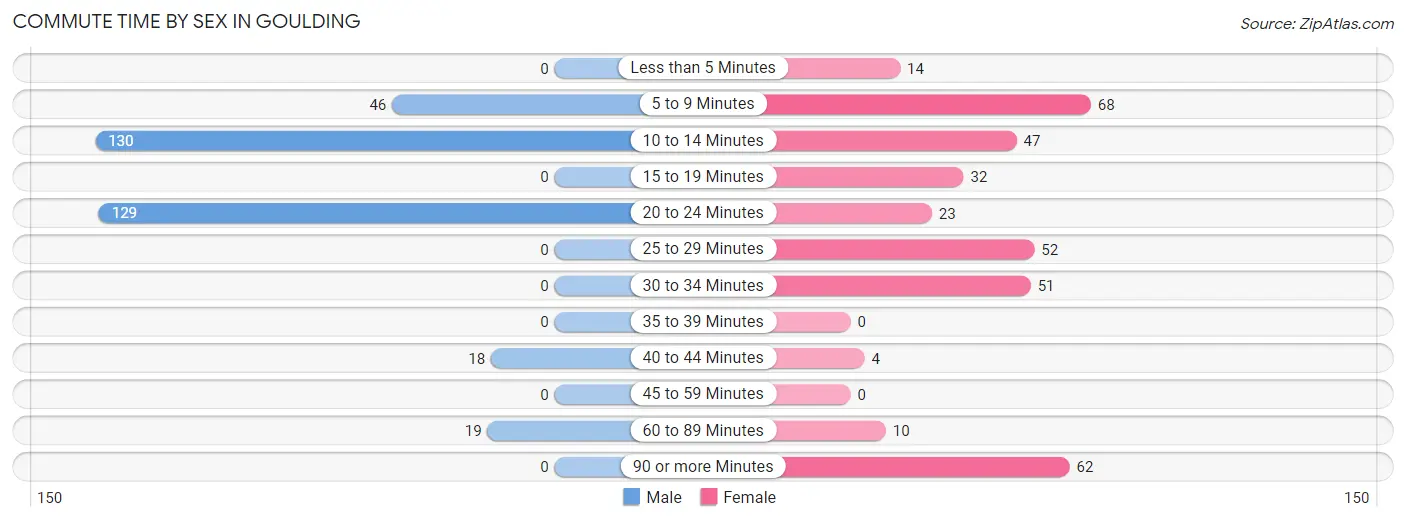
Commute Time by Sex in Goulding
The most common commute times in Goulding are 10 to 14 minutes (130 commuters, 38.0%) for males and 5 to 9 minutes (68 commuters, 18.7%) for females.
| Commute Time | Male | Female |
| Less than 5 Minutes | 0 (0.0%) | 14 (3.9%) |
| 5 to 9 Minutes | 46 (13.5%) | 68 (18.7%) |
| 10 to 14 Minutes | 130 (38.0%) | 47 (13.0%) |
| 15 to 19 Minutes | 0 (0.0%) | 32 (8.8%) |
| 20 to 24 Minutes | 129 (37.7%) | 23 (6.3%) |
| 25 to 29 Minutes | 0 (0.0%) | 52 (14.3%) |
| 30 to 34 Minutes | 0 (0.0%) | 51 (14.1%) |
| 35 to 39 Minutes | 0 (0.0%) | 0 (0.0%) |
| 40 to 44 Minutes | 18 (5.3%) | 4 (1.1%) |
| 45 to 59 Minutes | 0 (0.0%) | 0 (0.0%) |
| 60 to 89 Minutes | 19 (5.6%) | 10 (2.8%) |
| 90 or more Minutes | 0 (0.0%) | 62 (17.1%) |
Time of Departure to Work by Sex in Goulding
The most frequent times of departure to work in Goulding are 9:00 AM to 9:59 AM (94, 27.5%) for males and 12:00 PM to 3:59 PM (79, 21.8%) for females.
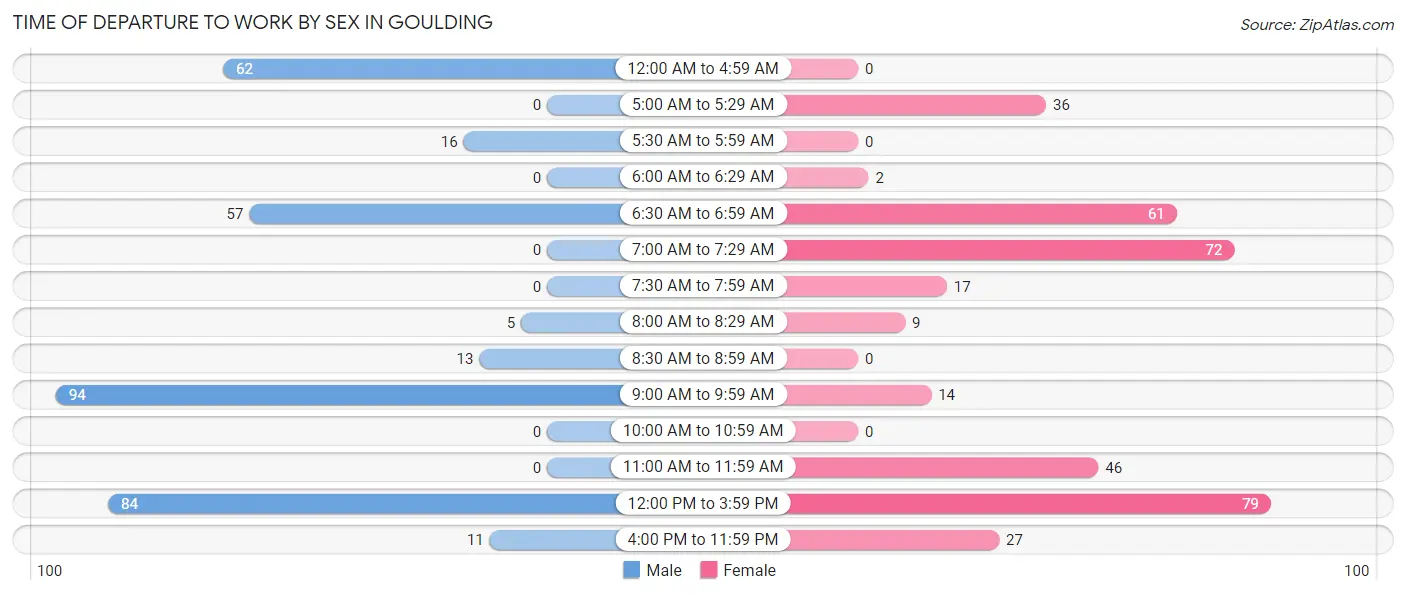
| Time of Departure | Male | Female |
| 12:00 AM to 4:59 AM | 62 (18.1%) | 0 (0.0%) |
| 5:00 AM to 5:29 AM | 0 (0.0%) | 36 (9.9%) |
| 5:30 AM to 5:59 AM | 16 (4.7%) | 0 (0.0%) |
| 6:00 AM to 6:29 AM | 0 (0.0%) | 2 (0.5%) |
| 6:30 AM to 6:59 AM | 57 (16.7%) | 61 (16.8%) |
| 7:00 AM to 7:29 AM | 0 (0.0%) | 72 (19.8%) |
| 7:30 AM to 7:59 AM | 0 (0.0%) | 17 (4.7%) |
| 8:00 AM to 8:29 AM | 5 (1.5%) | 9 (2.5%) |
| 8:30 AM to 8:59 AM | 13 (3.8%) | 0 (0.0%) |
| 9:00 AM to 9:59 AM | 94 (27.5%) | 14 (3.9%) |
| 10:00 AM to 10:59 AM | 0 (0.0%) | 0 (0.0%) |
| 11:00 AM to 11:59 AM | 0 (0.0%) | 46 (12.7%) |
| 12:00 PM to 3:59 PM | 84 (24.6%) | 79 (21.8%) |
| 4:00 PM to 11:59 PM | 11 (3.2%) | 27 (7.4%) |
| Total | 342 (100.0%) | 363 (100.0%) |
Housing Occupancy in Goulding
Occupancy by Ownership in Goulding
Of the total 937 dwellings in Goulding, owner-occupied units account for 372 (39.7%), while renter-occupied units make up 565 (60.3%).
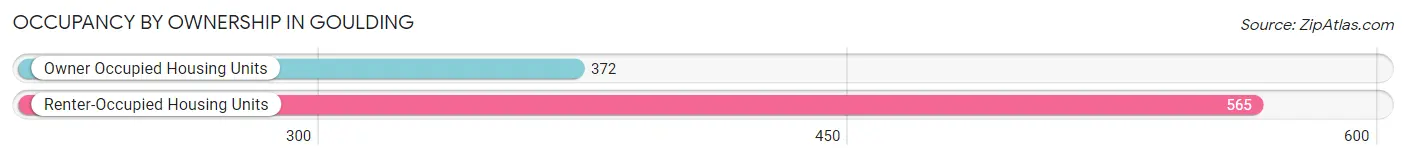
| Occupancy | # Housing Units | % Housing Units |
| Owner Occupied Housing Units | 372 | 39.7% |
| Renter-Occupied Housing Units | 565 | 60.3% |
| Total Occupied Housing Units | 937 | 100.0% |
Occupancy by Household Size in Goulding
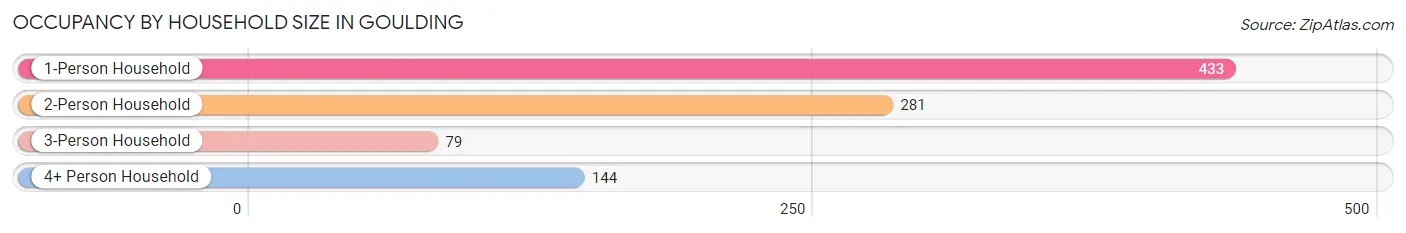
| Household Size | # Housing Units | % Housing Units |
| 1-Person Household | 433 | 46.2% |
| 2-Person Household | 281 | 30.0% |
| 3-Person Household | 79 | 8.4% |
| 4+ Person Household | 144 | 15.4% |
| Total Housing Units | 937 | 100.0% |
Occupancy by Ownership by Household Size in Goulding
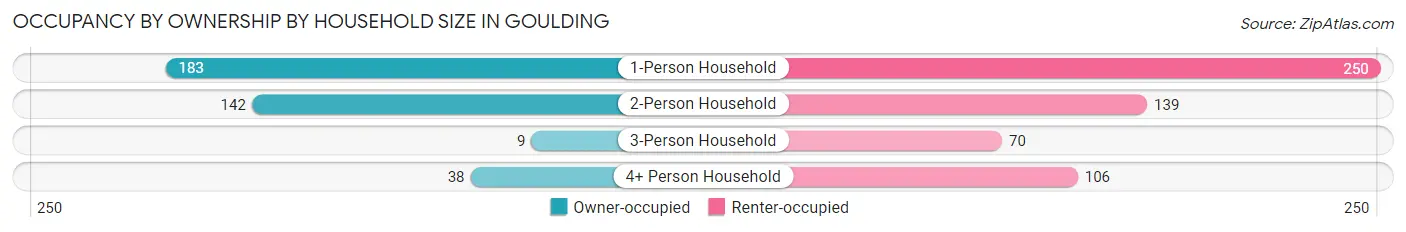
| Household Size | Owner-occupied | Renter-occupied |
| 1-Person Household | 183 (42.3%) | 250 (57.7%) |
| 2-Person Household | 142 (50.5%) | 139 (49.5%) |
| 3-Person Household | 9 (11.4%) | 70 (88.6%) |
| 4+ Person Household | 38 (26.4%) | 106 (73.6%) |
| Total Housing Units | 372 (39.7%) | 565 (60.3%) |
Occupancy by Educational Attainment in Goulding
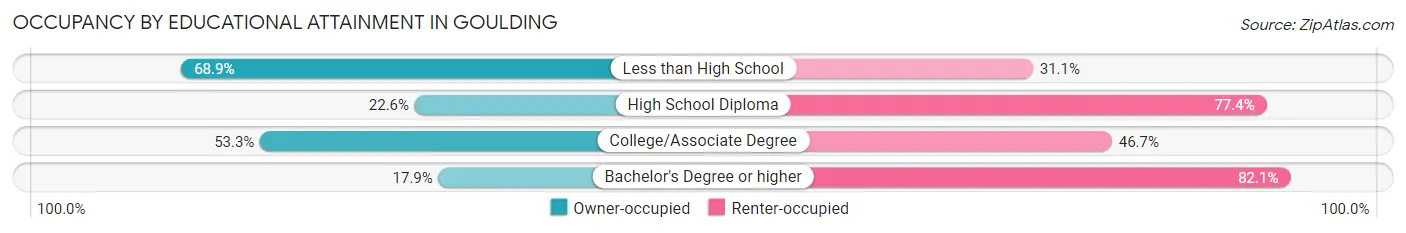
| Household Size | Owner-occupied | Renter-occupied |
| Less than High School | 111 (68.9%) | 50 (31.1%) |
| High School Diploma | 95 (22.6%) | 325 (77.4%) |
| College/Associate Degree | 154 (53.3%) | 135 (46.7%) |
| Bachelor's Degree or higher | 12 (17.9%) | 55 (82.1%) |
Occupancy by Age of Householder in Goulding
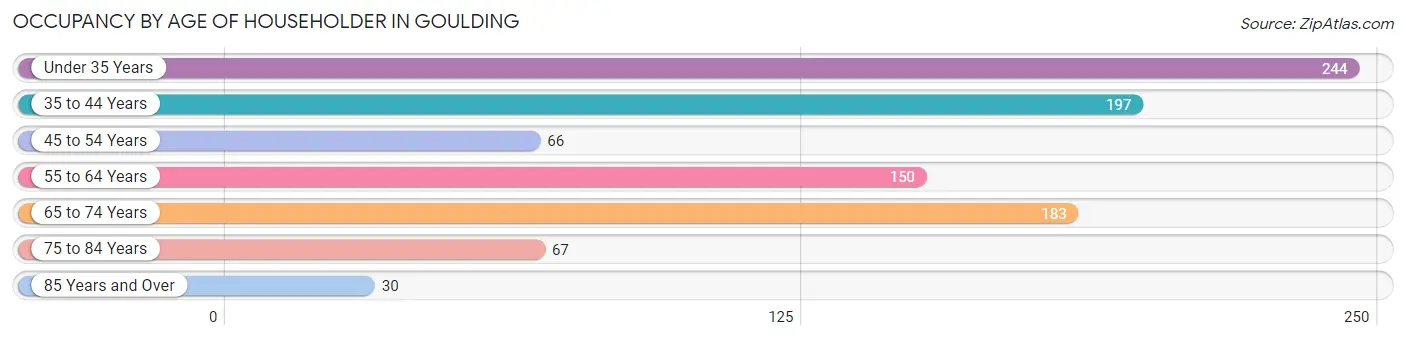
| Age Bracket | # Households | % Households |
| Under 35 Years | 244 | 26.0% |
| 35 to 44 Years | 197 | 21.0% |
| 45 to 54 Years | 66 | 7.0% |
| 55 to 64 Years | 150 | 16.0% |
| 65 to 74 Years | 183 | 19.5% |
| 75 to 84 Years | 67 | 7.1% |
| 85 Years and Over | 30 | 3.2% |
| Total | 937 | 100.0% |
Housing Finances in Goulding
Median Income by Occupancy in Goulding
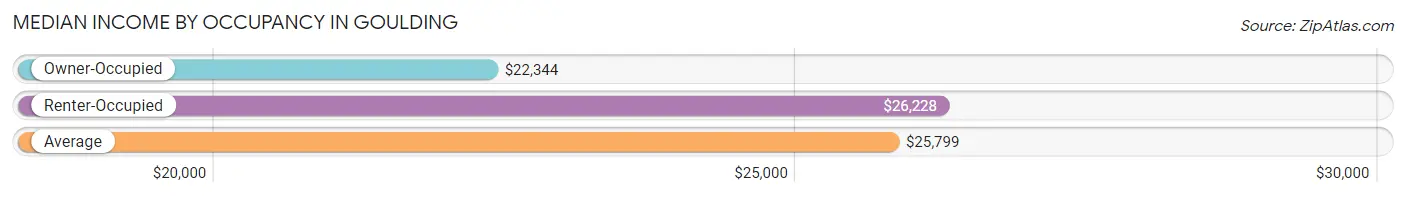
| Occupancy Type | # Households | Median Income |
| Owner-Occupied | 372 (39.7%) | $22,344 |
| Renter-Occupied | 565 (60.3%) | $26,228 |
| Average | 937 (100.0%) | $25,799 |
Occupancy by Householder Income Bracket in Goulding
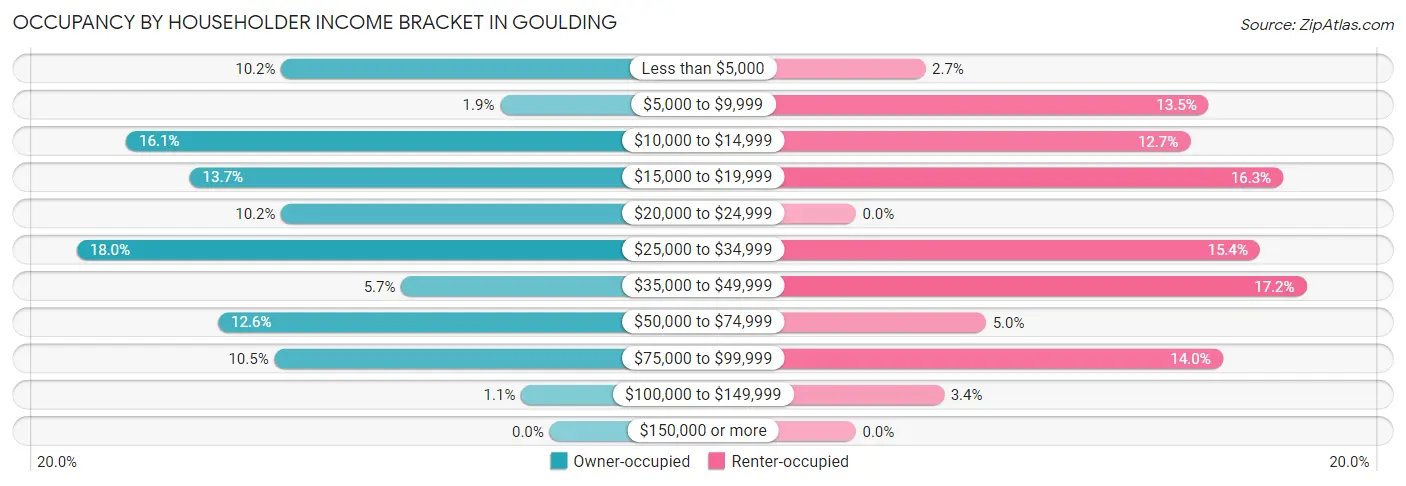
| Income Bracket | Owner-occupied | Renter-occupied |
| Less than $5,000 | 38 (10.2%) | 15 (2.6%) |
| $5,000 to $9,999 | 7 (1.9%) | 76 (13.5%) |
| $10,000 to $14,999 | 60 (16.1%) | 72 (12.7%) |
| $15,000 to $19,999 | 51 (13.7%) | 92 (16.3%) |
| $20,000 to $24,999 | 38 (10.2%) | 0 (0.0%) |
| $25,000 to $34,999 | 67 (18.0%) | 87 (15.4%) |
| $35,000 to $49,999 | 21 (5.7%) | 97 (17.2%) |
| $50,000 to $74,999 | 47 (12.6%) | 28 (5.0%) |
| $75,000 to $99,999 | 39 (10.5%) | 79 (14.0%) |
| $100,000 to $149,999 | 4 (1.1%) | 19 (3.4%) |
| $150,000 or more | 0 (0.0%) | 0 (0.0%) |
| Total | 372 (100.0%) | 565 (100.0%) |
Monthly Housing Cost Tiers in Goulding
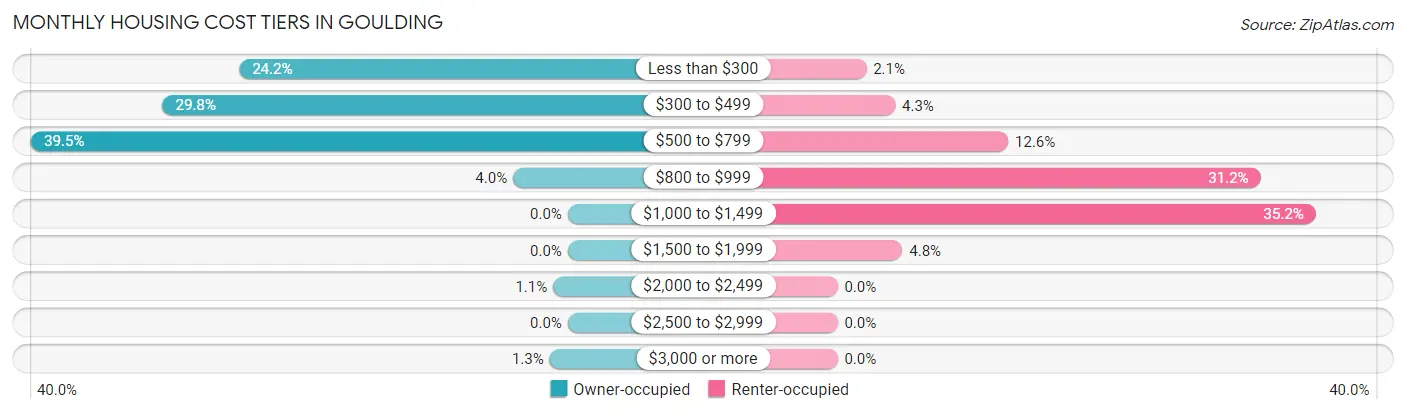
| Monthly Cost | Owner-occupied | Renter-occupied |
| Less than $300 | 90 (24.2%) | 12 (2.1%) |
| $300 to $499 | 111 (29.8%) | 24 (4.3%) |
| $500 to $799 | 147 (39.5%) | 71 (12.6%) |
| $800 to $999 | 15 (4.0%) | 176 (31.1%) |
| $1,000 to $1,499 | 0 (0.0%) | 199 (35.2%) |
| $1,500 to $1,999 | 0 (0.0%) | 27 (4.8%) |
| $2,000 to $2,499 | 4 (1.1%) | 0 (0.0%) |
| $2,500 to $2,999 | 0 (0.0%) | 0 (0.0%) |
| $3,000 or more | 5 (1.3%) | 0 (0.0%) |
| Total | 372 (100.0%) | 565 (100.0%) |
Physical Housing Characteristics in Goulding
Housing Structures in Goulding
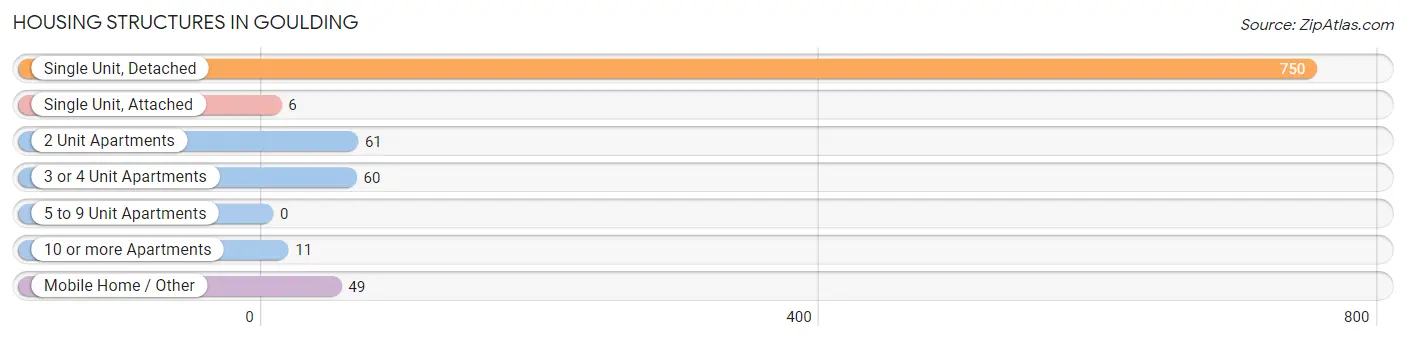
| Structure Type | # Housing Units | % Housing Units |
| Single Unit, Detached | 750 | 80.0% |
| Single Unit, Attached | 6 | 0.6% |
| 2 Unit Apartments | 61 | 6.5% |
| 3 or 4 Unit Apartments | 60 | 6.4% |
| 5 to 9 Unit Apartments | 0 | 0.0% |
| 10 or more Apartments | 11 | 1.2% |
| Mobile Home / Other | 49 | 5.2% |
| Total | 937 | 100.0% |
Housing Structures by Occupancy in Goulding
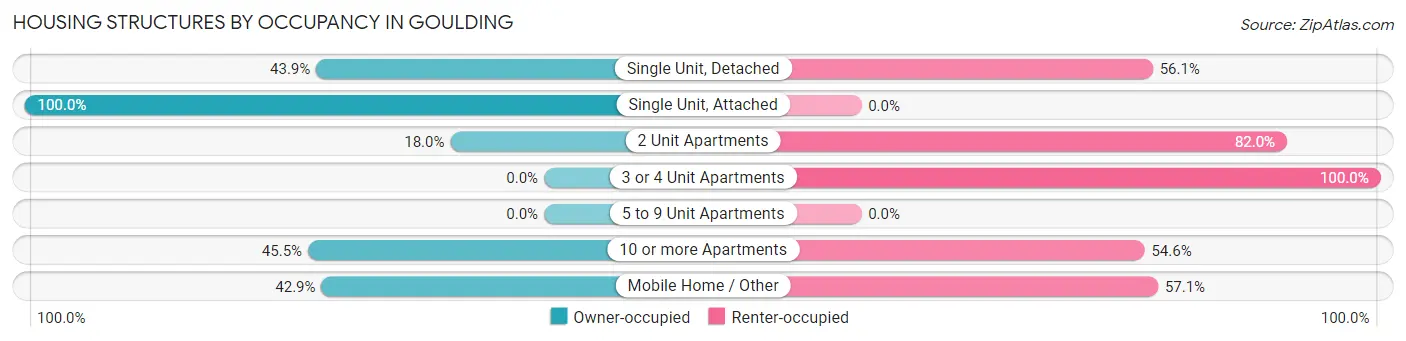
| Structure Type | Owner-occupied | Renter-occupied |
| Single Unit, Detached | 329 (43.9%) | 421 (56.1%) |
| Single Unit, Attached | 6 (100.0%) | 0 (0.0%) |
| 2 Unit Apartments | 11 (18.0%) | 50 (82.0%) |
| 3 or 4 Unit Apartments | 0 (0.0%) | 60 (100.0%) |
| 5 to 9 Unit Apartments | 0 (0.0%) | 0 (0.0%) |
| 10 or more Apartments | 5 (45.5%) | 6 (54.5%) |
| Mobile Home / Other | 21 (42.9%) | 28 (57.1%) |
| Total | 372 (39.7%) | 565 (60.3%) |
Housing Structures by Number of Rooms in Goulding
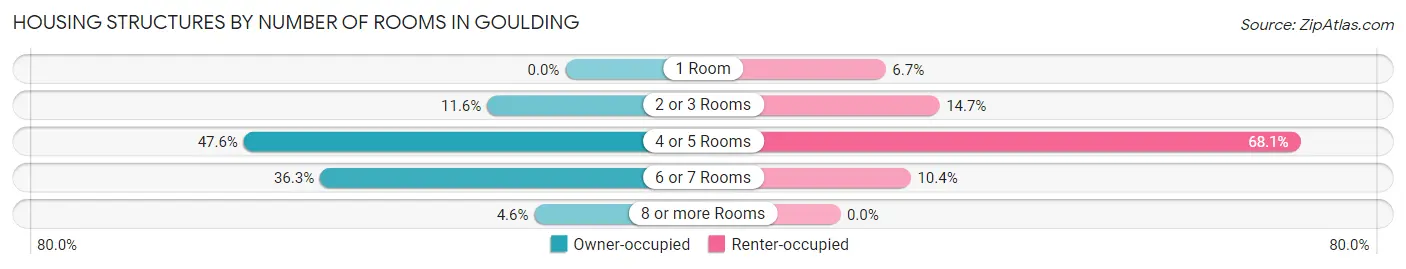
| Number of Rooms | Owner-occupied | Renter-occupied |
| 1 Room | 0 (0.0%) | 38 (6.7%) |
| 2 or 3 Rooms | 43 (11.6%) | 83 (14.7%) |
| 4 or 5 Rooms | 177 (47.6%) | 385 (68.1%) |
| 6 or 7 Rooms | 135 (36.3%) | 59 (10.4%) |
| 8 or more Rooms | 17 (4.6%) | 0 (0.0%) |
| Total | 372 (100.0%) | 565 (100.0%) |
Housing Structure by Heating Type in Goulding
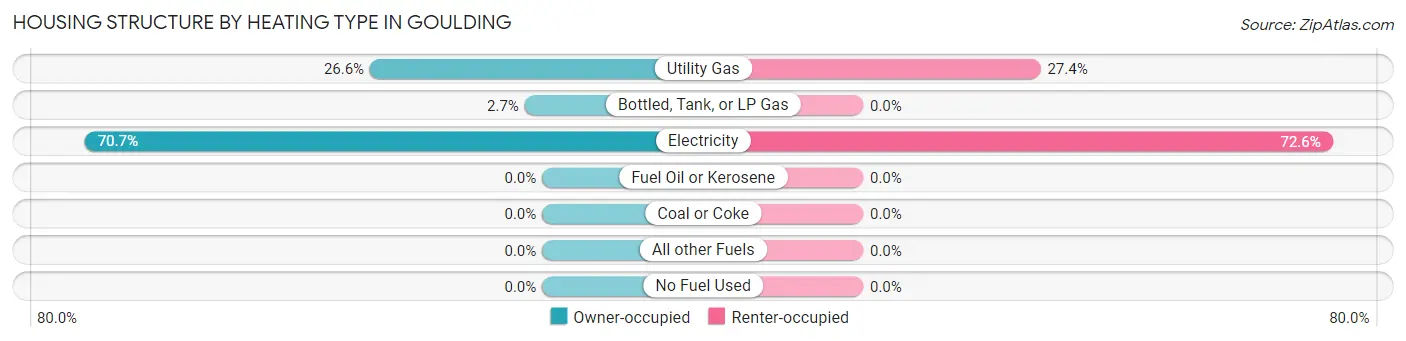
| Heating Type | Owner-occupied | Renter-occupied |
| Utility Gas | 99 (26.6%) | 155 (27.4%) |
| Bottled, Tank, or LP Gas | 10 (2.7%) | 0 (0.0%) |
| Electricity | 263 (70.7%) | 410 (72.6%) |
| Fuel Oil or Kerosene | 0 (0.0%) | 0 (0.0%) |
| Coal or Coke | 0 (0.0%) | 0 (0.0%) |
| All other Fuels | 0 (0.0%) | 0 (0.0%) |
| No Fuel Used | 0 (0.0%) | 0 (0.0%) |
| Total | 372 (100.0%) | 565 (100.0%) |
Household Vehicle Usage in Goulding
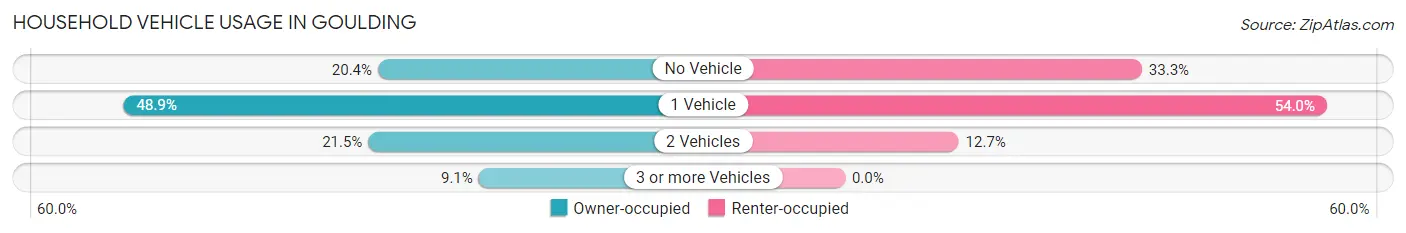
| Vehicles per Household | Owner-occupied | Renter-occupied |
| No Vehicle | 76 (20.4%) | 188 (33.3%) |
| 1 Vehicle | 182 (48.9%) | 305 (54.0%) |
| 2 Vehicles | 80 (21.5%) | 72 (12.7%) |
| 3 or more Vehicles | 34 (9.1%) | 0 (0.0%) |
| Total | 372 (100.0%) | 565 (100.0%) |
Real Estate & Mortgages in Goulding
Real Estate and Mortgage Overview in Goulding
| Characteristic | Without Mortgage | With Mortgage |
| Housing Units | 314 | 58 |
| Median Property Value | $57,500 | $108,300 |
| Median Household Income | $22,344 | $0 |
| Monthly Housing Costs | $382 | $5 |
| Real Estate Taxes | $422 | $6 |
Property Value by Mortgage Status in Goulding
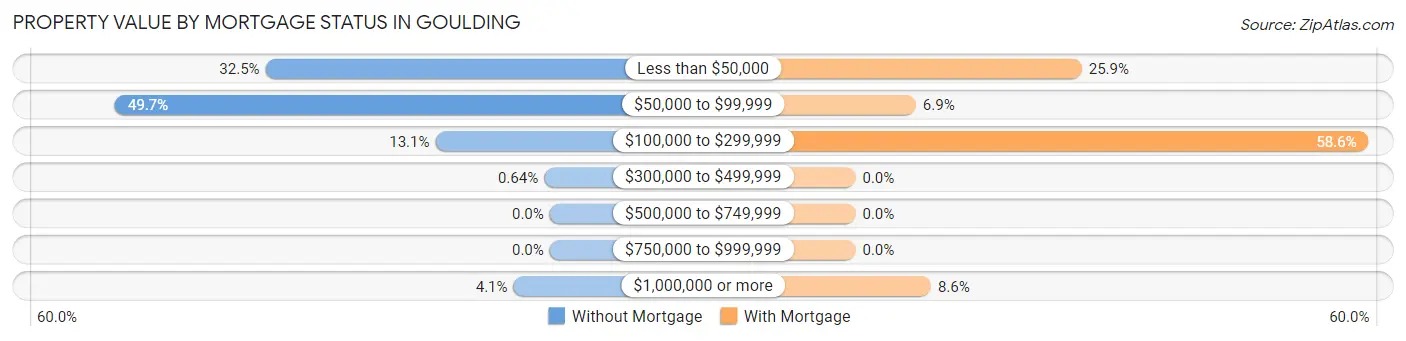
| Property Value | Without Mortgage | With Mortgage |
| Less than $50,000 | 102 (32.5%) | 15 (25.9%) |
| $50,000 to $99,999 | 156 (49.7%) | 4 (6.9%) |
| $100,000 to $299,999 | 41 (13.1%) | 34 (58.6%) |
| $300,000 to $499,999 | 2 (0.6%) | 0 (0.0%) |
| $500,000 to $749,999 | 0 (0.0%) | 0 (0.0%) |
| $750,000 to $999,999 | 0 (0.0%) | 0 (0.0%) |
| $1,000,000 or more | 13 (4.1%) | 5 (8.6%) |
| Total | 314 (100.0%) | 58 (100.0%) |
Household Income by Mortgage Status in Goulding
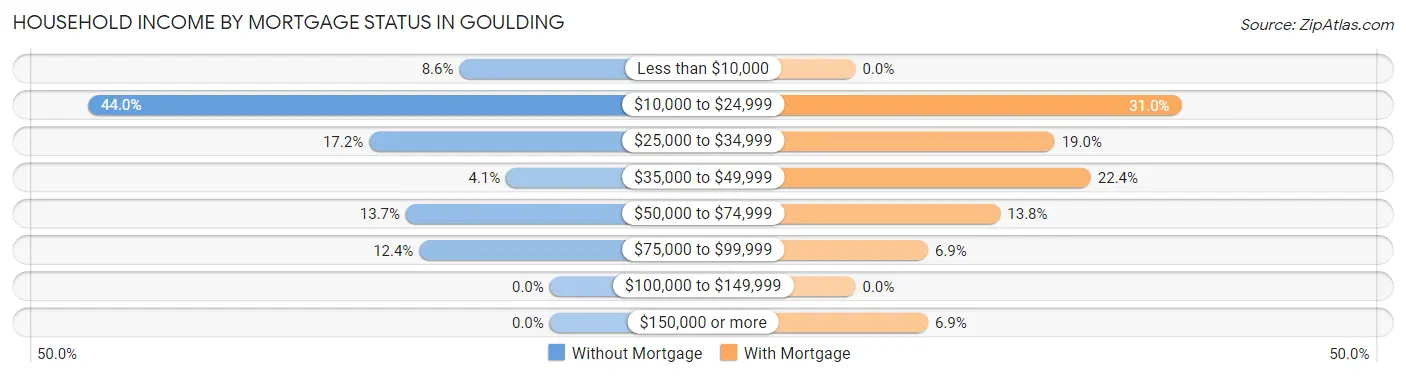
| Household Income | Without Mortgage | With Mortgage |
| Less than $10,000 | 27 (8.6%) | 0 (0.0%) |
| $10,000 to $24,999 | 138 (44.0%) | 18 (31.0%) |
| $25,000 to $34,999 | 54 (17.2%) | 11 (19.0%) |
| $35,000 to $49,999 | 13 (4.1%) | 13 (22.4%) |
| $50,000 to $74,999 | 43 (13.7%) | 8 (13.8%) |
| $75,000 to $99,999 | 39 (12.4%) | 4 (6.9%) |
| $100,000 to $149,999 | 0 (0.0%) | 0 (0.0%) |
| $150,000 or more | 0 (0.0%) | 4 (6.9%) |
| Total | 314 (100.0%) | 58 (100.0%) |
Property Value to Household Income Ratio in Goulding
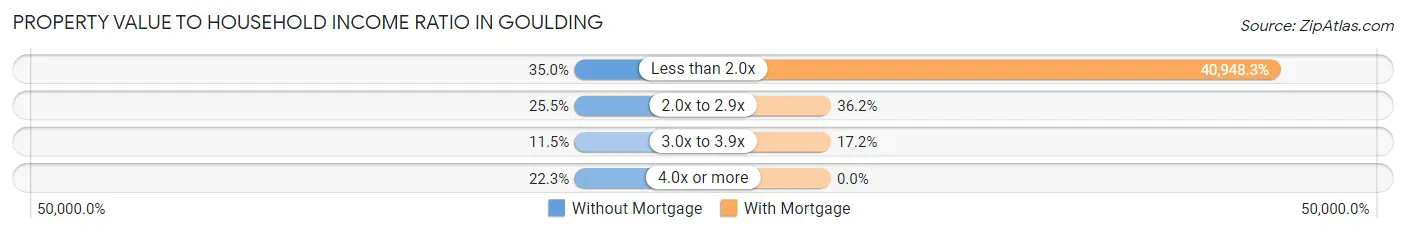
| Value-to-Income Ratio | Without Mortgage | With Mortgage |
| Less than 2.0x | 110 (35.0%) | 23,750 (40,948.3%) |
| 2.0x to 2.9x | 80 (25.5%) | 21 (36.2%) |
| 3.0x to 3.9x | 36 (11.5%) | 10 (17.2%) |
| 4.0x or more | 70 (22.3%) | 0 (0.0%) |
| Total | 314 (100.0%) | 58 (100.0%) |
Real Estate Taxes by Mortgage Status in Goulding
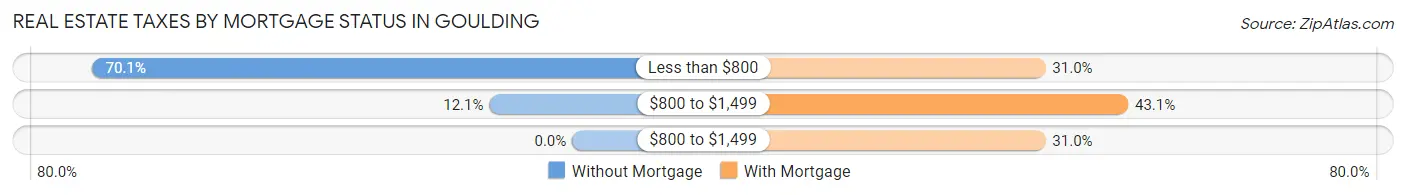
| Property Taxes | Without Mortgage | With Mortgage |
| Less than $800 | 220 (70.1%) | 18 (31.0%) |
| $800 to $1,499 | 38 (12.1%) | 25 (43.1%) |
| $800 to $1,499 | 0 (0.0%) | 18 (31.0%) |
| Total | 314 (100.0%) | 58 (100.0%) |
Health & Disability in Goulding
Health Insurance Coverage by Age in Goulding
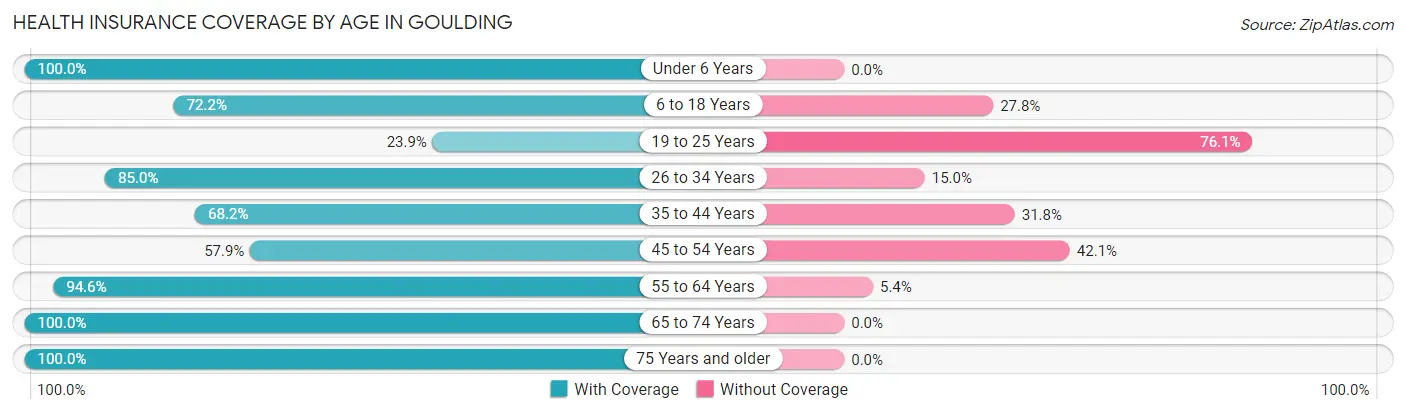
| Age Bracket | With Coverage | Without Coverage |
| Under 6 Years | 84 (100.0%) | 0 (0.0%) |
| 6 to 18 Years | 320 (72.2%) | 123 (27.8%) |
| 19 to 25 Years | 65 (23.9%) | 207 (76.1%) |
| 26 to 34 Years | 215 (85.0%) | 38 (15.0%) |
| 35 to 44 Years | 223 (68.2%) | 104 (31.8%) |
| 45 to 54 Years | 84 (57.9%) | 61 (42.1%) |
| 55 to 64 Years | 247 (94.6%) | 14 (5.4%) |
| 65 to 74 Years | 235 (100.0%) | 0 (0.0%) |
| 75 Years and older | 125 (100.0%) | 0 (0.0%) |
| Total | 1,598 (74.5%) | 547 (25.5%) |
Health Insurance Coverage by Citizenship Status in Goulding
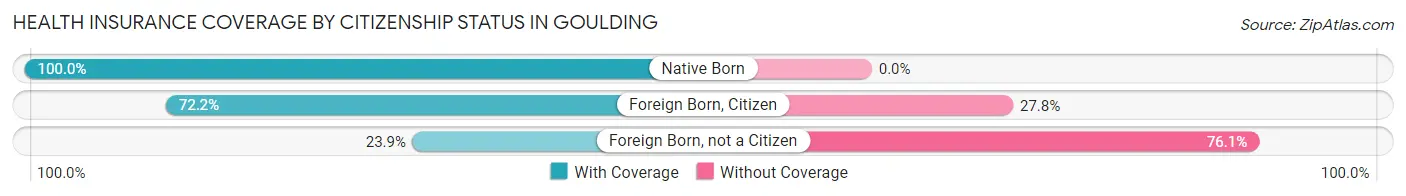
| Citizenship Status | With Coverage | Without Coverage |
| Native Born | 84 (100.0%) | 0 (0.0%) |
| Foreign Born, Citizen | 320 (72.2%) | 123 (27.8%) |
| Foreign Born, not a Citizen | 65 (23.9%) | 207 (76.1%) |
Health Insurance Coverage by Household Income in Goulding
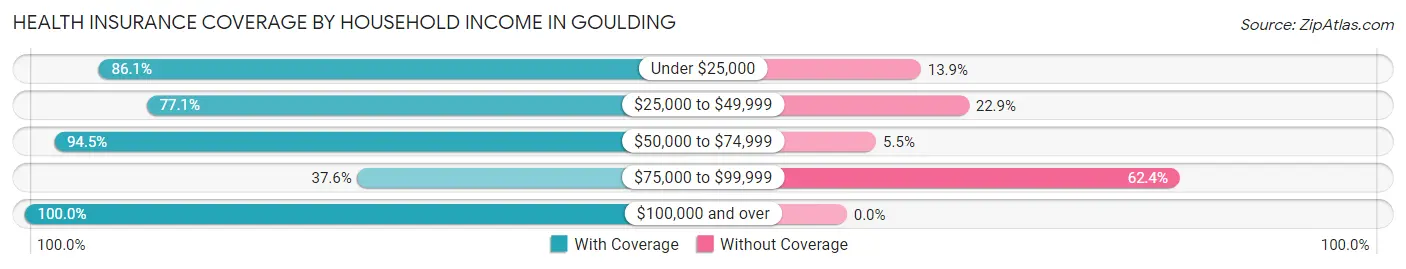
| Household Income | With Coverage | Without Coverage |
| Under $25,000 | 615 (86.1%) | 99 (13.9%) |
| $25,000 to $49,999 | 432 (77.1%) | 128 (22.9%) |
| $50,000 to $74,999 | 309 (94.5%) | 18 (5.5%) |
| $75,000 to $99,999 | 155 (37.6%) | 257 (62.4%) |
| $100,000 and over | 35 (100.0%) | 0 (0.0%) |
Public vs Private Health Insurance Coverage by Age in Goulding
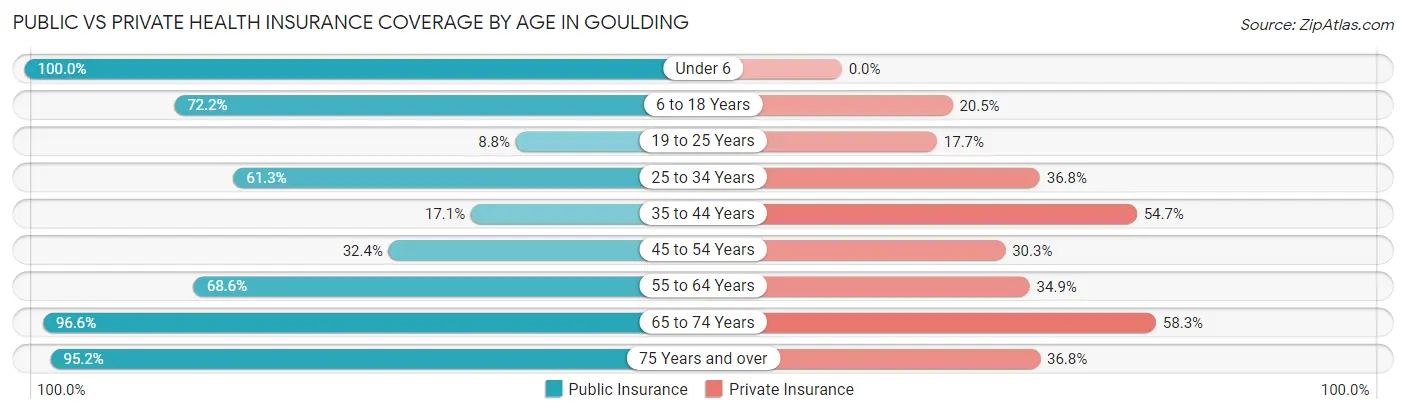
| Age Bracket | Public Insurance | Private Insurance |
| Under 6 | 84 (100.0%) | 0 (0.0%) |
| 6 to 18 Years | 320 (72.2%) | 91 (20.5%) |
| 19 to 25 Years | 24 (8.8%) | 48 (17.6%) |
| 25 to 34 Years | 155 (61.3%) | 93 (36.8%) |
| 35 to 44 Years | 56 (17.1%) | 179 (54.7%) |
| 45 to 54 Years | 47 (32.4%) | 44 (30.3%) |
| 55 to 64 Years | 179 (68.6%) | 91 (34.9%) |
| 65 to 74 Years | 227 (96.6%) | 137 (58.3%) |
| 75 Years and over | 119 (95.2%) | 46 (36.8%) |
| Total | 1,211 (56.5%) | 729 (34.0%) |
Disability Status by Sex by Age in Goulding
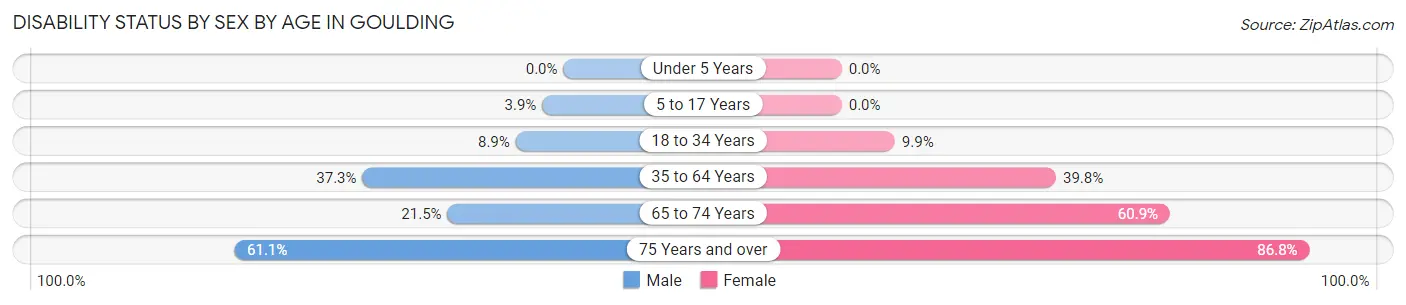
| Age Bracket | Male | Female |
| Under 5 Years | 0 (0.0%) | 0 (0.0%) |
| 5 to 17 Years | 7 (3.9%) | 0 (0.0%) |
| 18 to 34 Years | 41 (8.9%) | 21 (9.9%) |
| 35 to 64 Years | 144 (37.3%) | 138 (39.8%) |
| 65 to 74 Years | 17 (21.5%) | 95 (60.9%) |
| 75 Years and over | 44 (61.1%) | 46 (86.8%) |
Disability Class by Sex by Age in Goulding
Disability Class: Hearing Difficulty
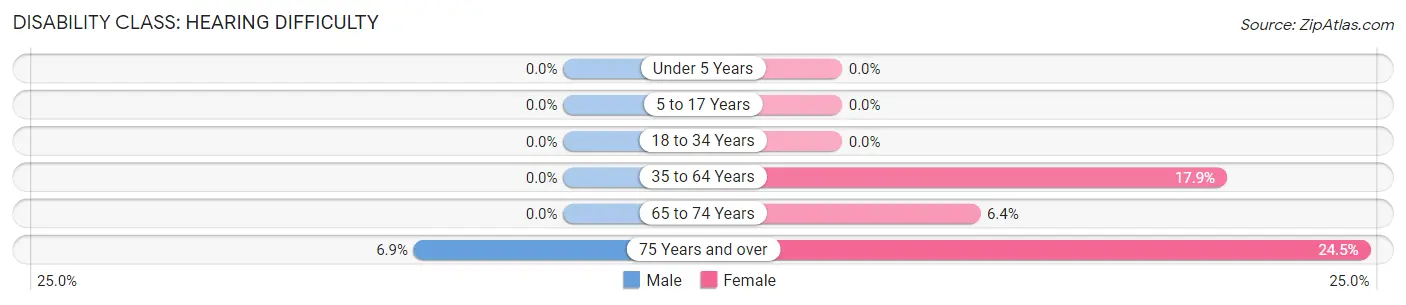
| Age Bracket | Male | Female |
| Under 5 Years | 0 (0.0%) | 0 (0.0%) |
| 5 to 17 Years | 0 (0.0%) | 0 (0.0%) |
| 18 to 34 Years | 0 (0.0%) | 0 (0.0%) |
| 35 to 64 Years | 0 (0.0%) | 62 (17.9%) |
| 65 to 74 Years | 0 (0.0%) | 10 (6.4%) |
| 75 Years and over | 5 (6.9%) | 13 (24.5%) |
Disability Class: Vision Difficulty
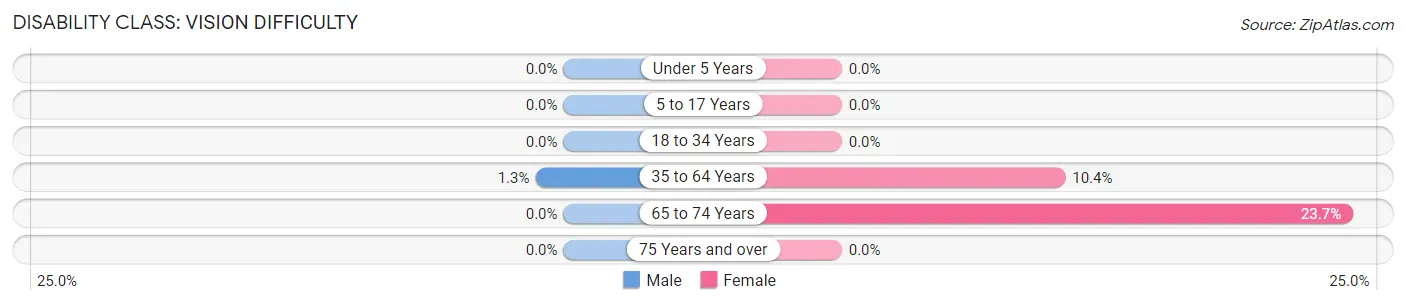
| Age Bracket | Male | Female |
| Under 5 Years | 0 (0.0%) | 0 (0.0%) |
| 5 to 17 Years | 0 (0.0%) | 0 (0.0%) |
| 18 to 34 Years | 0 (0.0%) | 0 (0.0%) |
| 35 to 64 Years | 5 (1.3%) | 36 (10.4%) |
| 65 to 74 Years | 0 (0.0%) | 37 (23.7%) |
| 75 Years and over | 0 (0.0%) | 0 (0.0%) |
Disability Class: Cognitive Difficulty
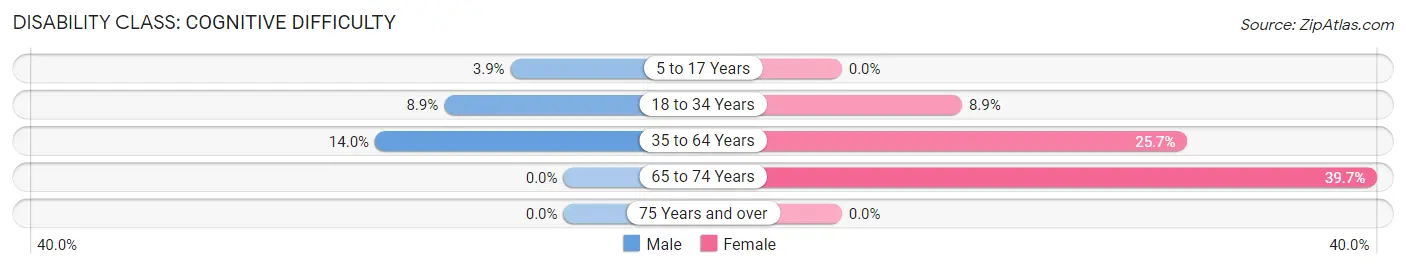
| Age Bracket | Male | Female |
| 5 to 17 Years | 7 (3.9%) | 0 (0.0%) |
| 18 to 34 Years | 41 (8.9%) | 19 (8.9%) |
| 35 to 64 Years | 54 (14.0%) | 89 (25.7%) |
| 65 to 74 Years | 0 (0.0%) | 62 (39.7%) |
| 75 Years and over | 0 (0.0%) | 0 (0.0%) |
Disability Class: Ambulatory Difficulty
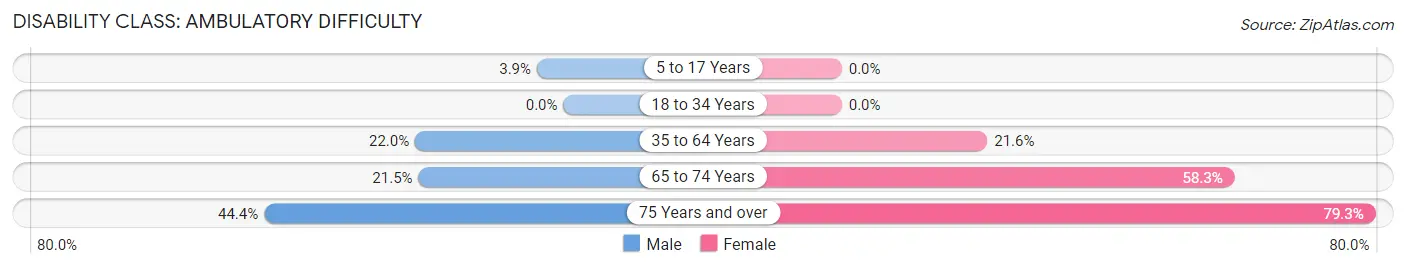
| Age Bracket | Male | Female |
| 5 to 17 Years | 7 (3.9%) | 0 (0.0%) |
| 18 to 34 Years | 0 (0.0%) | 0 (0.0%) |
| 35 to 64 Years | 85 (22.0%) | 75 (21.6%) |
| 65 to 74 Years | 17 (21.5%) | 91 (58.3%) |
| 75 Years and over | 32 (44.4%) | 42 (79.2%) |
Disability Class: Self-Care Difficulty
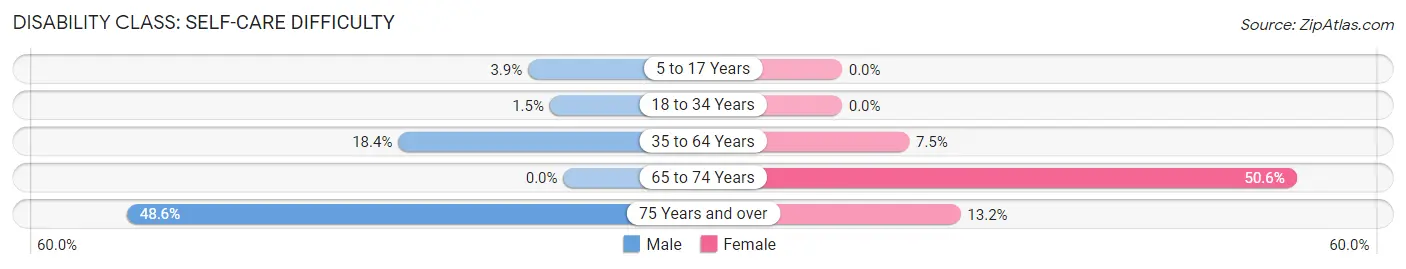
| Age Bracket | Male | Female |
| 5 to 17 Years | 7 (3.9%) | 0 (0.0%) |
| 18 to 34 Years | 7 (1.5%) | 0 (0.0%) |
| 35 to 64 Years | 71 (18.4%) | 26 (7.5%) |
| 65 to 74 Years | 0 (0.0%) | 79 (50.6%) |
| 75 Years and over | 35 (48.6%) | 7 (13.2%) |
Technology Access in Goulding
Computing Device Access in Goulding
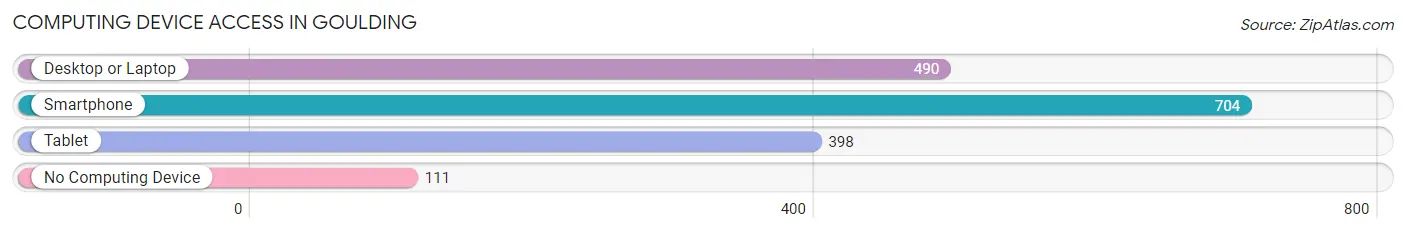
| Device Type | # Households | % Households |
| Desktop or Laptop | 490 | 52.3% |
| Smartphone | 704 | 75.1% |
| Tablet | 398 | 42.5% |
| No Computing Device | 111 | 11.8% |
| Total | 937 | 100.0% |
Internet Access in Goulding
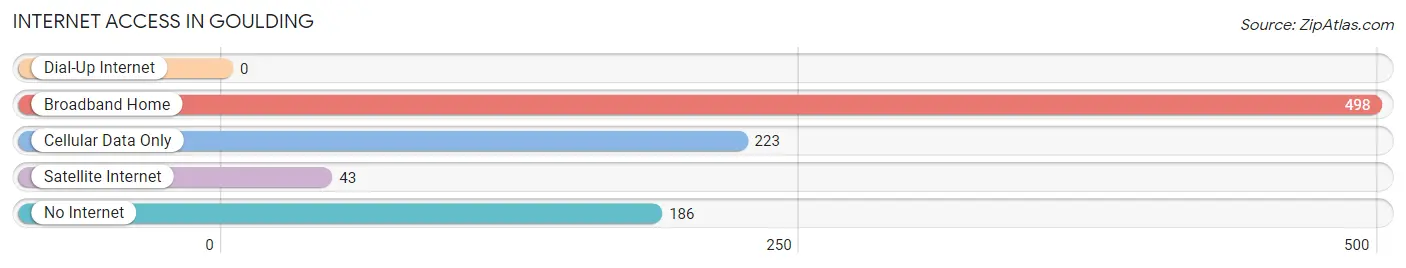
| Internet Type | # Households | % Households |
| Dial-Up Internet | 0 | 0.0% |
| Broadband Home | 498 | 53.1% |
| Cellular Data Only | 223 | 23.8% |
| Satellite Internet | 43 | 4.6% |
| No Internet | 186 | 19.9% |
| Total | 937 | 100.0% |
Goulding Summary
Goulding is a small unincorporated community located in the western part of Santa Rosa County, Florida. It is situated on the banks of the Blackwater River, approximately 10 miles south of Milton and 25 miles northeast of Pensacola. The community is home to a population of approximately 500 people and is known for its rural charm and close-knit community.
History
Goulding was first settled in the early 1800s by a group of settlers from Georgia. The community was named after the original settler, William Goulding, who was a veteran of the War of 1812. The first post office was established in 1845 and the town was officially incorporated in 1887.
Goulding was a thriving agricultural community in the late 19th and early 20th centuries. The town was home to several cotton gins, a sawmill, and a grist mill. The town also had a general store, a blacksmith shop, and a school.
In the early 20th century, the town began to decline as the railroad bypassed it and the population began to move away. The town was eventually abandoned in the 1950s and the post office closed in 1960.
Geography
Goulding is located in the western part of Santa Rosa County, Florida. It is situated on the banks of the Blackwater River, approximately 10 miles south of Milton and 25 miles northeast of Pensacola. The town is surrounded by rolling hills and is home to a variety of wildlife, including deer, wild turkeys, and bald eagles.
The climate in Goulding is subtropical, with hot, humid summers and mild winters. The average annual temperature is around 70 degrees Fahrenheit. The average annual rainfall is around 55 inches.
Economy
Goulding is a small, rural community with a limited economy. The town is home to a few small businesses, including a convenience store, a gas station, and a restaurant. The town also has a few small farms and ranches.
The town is also home to a few small manufacturing companies, including a furniture manufacturer and a metal fabrication shop. The town is also home to a few small service businesses, including a landscaping company and a plumbing company.
Demographics
Goulding is home to a population of approximately 500 people. The town is predominantly white, with a small African American population. The median household income is around $35,000 and the median home value is around $100,000. The town has a low unemployment rate and a high rate of homeownership.
Common Questions
What is Per Capita Income in Goulding?
Per Capita income in Goulding is $15,399.
What is the Median Family Income in Goulding?
Median Family Income in Goulding is $34,000.
What is the Median Household income in Goulding?
Median Household Income in Goulding is $25,799.
What is Inequality or Gini Index in Goulding?
Inequality or Gini Index in Goulding is 0.43.
What is the Total Population of Goulding?
Total Population of Goulding is 3,476.
What is the Total Male Population of Goulding?
Total Male Population of Goulding is 2,260.
What is the Total Female Population of Goulding?
Total Female Population of Goulding is 1,216.
What is the Ratio of Males per 100 Females in Goulding?
There are 185.86 Males per 100 Females in Goulding.
What is the Ratio of Females per 100 Males in Goulding?
There are 53.81 Females per 100 Males in Goulding.
What is the Median Population Age in Goulding?
Median Population Age in Goulding is 39.7 Years.
What is the Average Family Size in Goulding
Average Family Size in Goulding is 3.2 People.
What is the Average Household Size in Goulding
Average Household Size in Goulding is 2.2 People.
How Large is the Labor Force in Goulding?
There are 839 People in the Labor Forcein in Goulding.
What is the Percentage of People in the Labor Force in Goulding?
26.8% of People are in the Labor Force in Goulding.
What is the Unemployment Rate in Goulding?
Unemployment Rate in Goulding is 14.7%.