Zip Codes with the Highest Percentage of Population Employed in Accommodation & Food Services in Delaware

RELATED REPORTS & OPTIONS

Accommodation & Food Services
Population
Families and Households
Female Fertility
Female Fertility (Unmarried)
Race (Community Size)
Race (Percentage)
Ancestry (Community Size)
AfghanAfricanAlaska NativeAlaskan AthabascanAlbanianAleutAlsatianAmericanApacheArabArapahoArgentineanArmenianAssyrian / Chaldean / SyriacAustralianAustrianBahamianBangladeshiBarbadianBasqueBelgianBelizeanBermudanBhutaneseBlackfeetBolivianBrazilianBritishBritish West IndianBulgarianBurmeseCajunCambodianCanadianCape VerdeanCarpatho RusynCelticCentral AmericanCentral American IndianCherokeeCheyenneChickasawChileanChineseChippewaChoctawColombianColvilleComancheCosta RicanCreeCreekCroatianCrowCubanCypriotCzechCzechoslovakianDanishDelawareDominicanDutchDutch West IndianEastern EuropeanEcuadorianEgyptianEnglishEstonianEthiopianEuropeanFijianFilipinoFinnishFrenchFrench American IndianFrench CanadianGermanGerman RussianGhanaianGreekGuamanian / ChamorroGuatemalanGuyaneseHaitianHmongHonduranHopiHoumaHungarianIcelanderIndian (Asian)IndonesianInupiatIranianIraqiIrishIroquoisIsraeliItalianJamaicanJapaneseJordanianKenyanKiowaKoreanLaotianLatvianLebaneseLiberianLithuanianLumbeeLuxembourgerMacedonianMalaysianMalteseMarshalleseMenomineeMexicanMexican American IndianMongolianMoroccanNative HawaiianNavajoNepaleseNew ZealanderNicaraguanNigerianNorthern EuropeanNorwegianOkinawanOsageOttawaPaiutePakistaniPalestinianPanamanianParaguayanPennsylvania GermanPeruvianPimaPolishPortuguesePotawatomiPuebloPuerto RicanPuget Sound SalishRomanianRussianSalvadoranSamoanScandinavianScotch-IrishScottishSeminoleSenegaleseSerbianShoshoneSierra LeoneanSiouxSlavicSlovakSloveneSomaliSouth AfricanSouth AmericanSouth American IndianSoviet UnionSpaniardSpanishSpanish AmericanSpanish American IndianSri LankanSubsaharan AfricanSudaneseSwedishSwissSyrianTaiwaneseThaiTlingit-HaidaTohono O'OdhamTonganTrinidadian and TobagonianTsimshianTurkishU.S. Virgin IslanderUgandanUkrainianUruguayanUteVenezuelanVietnameseWelshWest IndianYakamaYaquiYugoslavianYumanYup'ikZimbabwean
Ancestry (Percentage)
AfghanAfricanAlaska NativeAlaskan AthabascanAlbanianAleutAlsatianAmericanApacheArabArapahoArgentineanArmenianAssyrian / Chaldean / SyriacAustralianAustrianBahamianBangladeshiBarbadianBasqueBelgianBelizeanBermudanBhutaneseBlackfeetBolivianBrazilianBritishBritish West IndianBulgarianBurmeseCajunCambodianCanadianCape VerdeanCarpatho RusynCelticCentral AmericanCentral American IndianCherokeeCheyenneChickasawChileanChineseChippewaChoctawColombianColvilleComancheCosta RicanCreeCreekCroatianCrowCubanCypriotCzechCzechoslovakianDanishDelawareDominicanDutchDutch West IndianEastern EuropeanEcuadorianEgyptianEnglishEstonianEthiopianEuropeanFijianFilipinoFinnishFrenchFrench American IndianFrench CanadianGermanGerman RussianGhanaianGreekGuamanian / ChamorroGuatemalanGuyaneseHaitianHmongHonduranHopiHoumaHungarianIcelanderIndian (Asian)IndonesianInupiatIranianIraqiIrishIroquoisIsraeliItalianJamaicanJapaneseJordanianKenyanKiowaKoreanLaotianLatvianLebaneseLiberianLithuanianLumbeeLuxembourgerMacedonianMalaysianMalteseMarshalleseMenomineeMexicanMexican American IndianMongolianMoroccanNative HawaiianNavajoNepaleseNew ZealanderNicaraguanNigerianNorthern EuropeanNorwegianOkinawanOsageOttawaPaiutePakistaniPalestinianPanamanianParaguayanPennsylvania GermanPeruvianPimaPolishPortuguesePotawatomiPuebloPuerto RicanPuget Sound SalishRomanianRussianSalvadoranSamoanScandinavianScotch-IrishScottishSeminoleSenegaleseSerbianShoshoneSierra LeoneanSiouxSlavicSlovakSloveneSomaliSouth AfricanSouth AmericanSouth American IndianSoviet UnionSpaniardSpanishSpanish AmericanSpanish American IndianSri LankanSubsaharan AfricanSudaneseSwedishSwissSyrianTaiwaneseThaiTlingit-HaidaTohono O'OdhamTonganTrinidadian and TobagonianTsimshianTurkishU.S. Virgin IslanderUgandanUkrainianUruguayanUteVenezuelanVietnameseWelshWest IndianYakamaYaquiYugoslavianYumanYup'ikZimbabwean
Immigrant Origin (Total)
AfghanistanAfricaAlbaniaArgentinaArmeniaAsiaAustraliaAustriaAzoresBahamasBangladeshBarbadosBelarusBelgiumBelizeBoliviaBosnia and HerzegovinaBrazilBulgariaBurma / MyanmarCabo VerdeCambodiaCameroonCanadaCaribbeanCentral AmericaChileChinaColombiaCongoCosta RicaCroatiaCubaCzechoslovakiaDenmarkDominicaDominican RepublicEastern AfricaEastern AsiaEastern EuropeEcuadorEgyptEl SalvadorEnglandEritreaEthiopiaEuropeFijiFranceGermanyGhanaGreeceGrenadaGuatemalaGuyanaHaitiHondurasHong KongHungaryIndiaIndonesiaIranIraqIrelandIsraelItalyJamaicaJapanJordanKazakhstanKenyaKoreaKuwaitLaosLatin AmericaLatviaLebanonLiberiaLithuaniaMalaysiaMexicoMicronesiaMiddle AfricaMoldovaMoroccoNepalNetherlandsNicaraguaNigeriaNorth MacedoniaNorthern AfricaNorthern EuropeNorwayOceaniaPakistanPanamaPeruPhilippinesPolandPortugalRomaniaRussiaSaudi ArabiaScotlandSenegalSerbiaSierra LeoneSingaporeSomaliaSouth AfricaSouth AmericaSouth Central AsiaSouth Eastern AsiaSouthern EuropeSpainSri LankaSt. Vincent and the GrenadinesSudanSwedenSwitzerlandSyriaTaiwanThailandTrinidad and TobagoTurkeyUgandaUkraineUruguayUzbekistanVenezuelaVietnamWest IndiesWestern AfricaWestern AsiaWestern EuropeYemenZaireZimbabwe
Immigrant Origin (Percentage)
AfghanistanAfricaAlbaniaArgentinaArmeniaAsiaAustraliaAustriaAzoresBahamasBangladeshBarbadosBelarusBelgiumBelizeBoliviaBosnia and HerzegovinaBrazilBulgariaBurma / MyanmarCabo VerdeCambodiaCameroonCanadaCaribbeanCentral AmericaChileChinaColombiaCongoCosta RicaCroatiaCubaCzechoslovakiaDenmarkDominicaDominican RepublicEastern AfricaEastern AsiaEastern EuropeEcuadorEgyptEl SalvadorEnglandEritreaEthiopiaEuropeFijiFranceGermanyGhanaGreeceGrenadaGuatemalaGuyanaHaitiHondurasHong KongHungaryIndiaIndonesiaIranIraqIrelandIsraelItalyJamaicaJapanJordanKazakhstanKenyaKoreaKuwaitLaosLatin AmericaLatviaLebanonLiberiaLithuaniaMalaysiaMexicoMicronesiaMiddle AfricaMoldovaMoroccoNepalNetherlandsNicaraguaNigeriaNorth MacedoniaNorthern AfricaNorthern EuropeNorwayOceaniaPakistanPanamaPeruPhilippinesPolandPortugalRomaniaRussiaSaudi ArabiaScotlandSenegalSerbiaSierra LeoneSingaporeSomaliaSouth AfricaSouth AmericaSouth Central AsiaSouth Eastern AsiaSouthern EuropeSpainSri LankaSt. Vincent and the GrenadinesSudanSwedenSwitzerlandSyriaTaiwanThailandTrinidad and TobagoTurkeyUgandaUkraineUruguayUzbekistanVenezuelaVietnamWest IndiesWestern AfricaWestern AsiaWestern EuropeYemenZaireZimbabwe
Income
Income (Families)
Income (Households)
Poverty
Poverty (Families)
Unemployment
Employment Occupations
Employment Industries
Employer Class
Commute Time
Commute Means
School Enrollment
Education by Degree Field
Occupancy
Finances
Physical Characteristics
Delaware
Compare Zip Codes
Comparison Subject

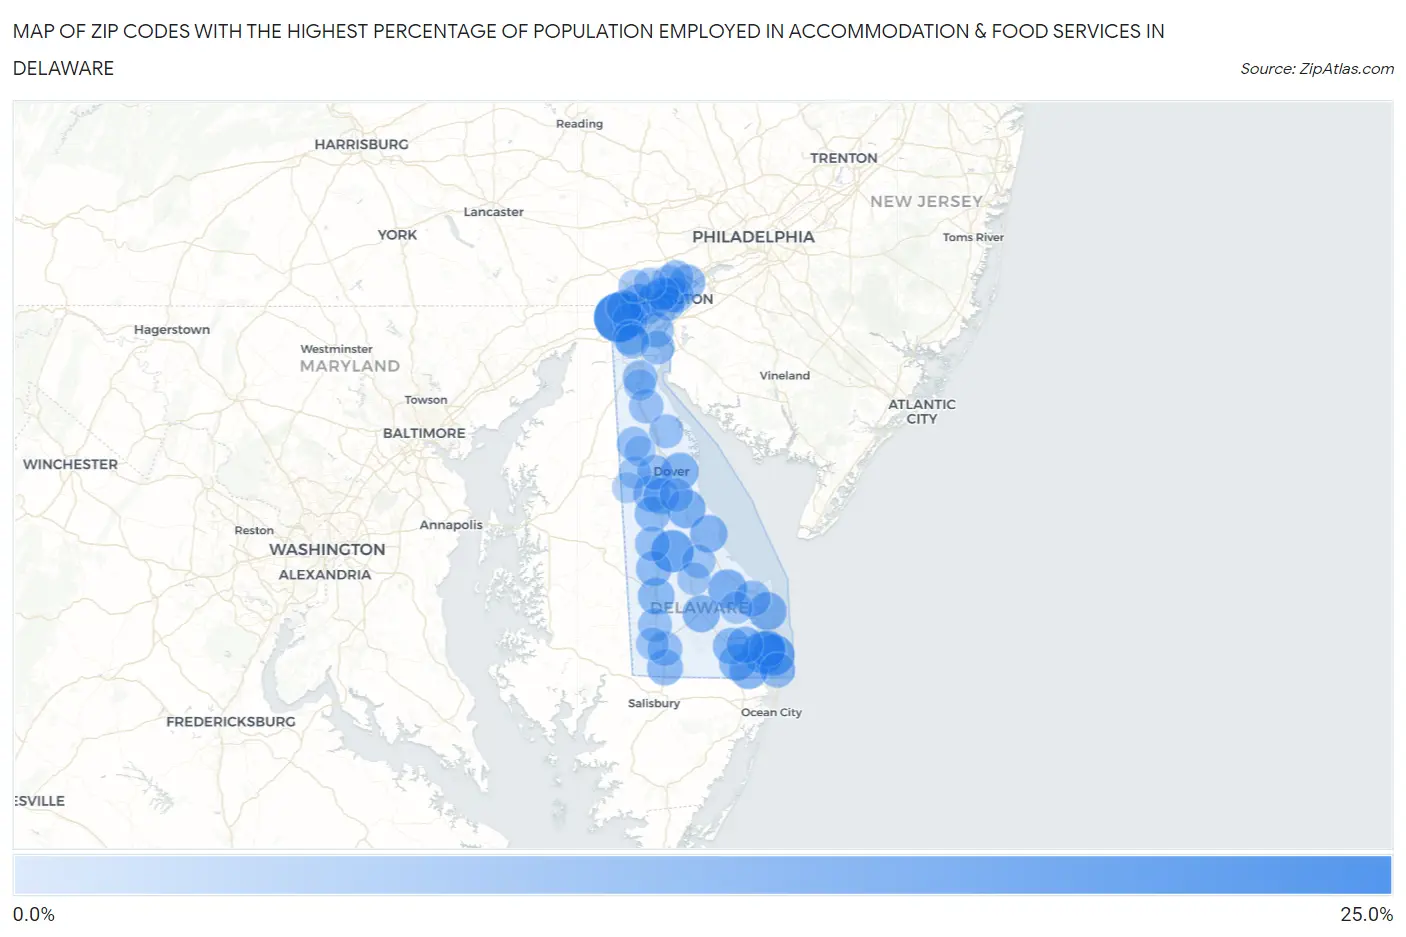
Map of Zip Codes with the Highest Percentage of Population Employed in Accommodation & Food Services in Delaware

0.0%
25.0%
Zip Codes with the Highest Percentage of Population Employed in Accommodation & Food Services in Delaware Map

Zip Codes with the Highest Percentage of Population Employed in Accommodation & Food Services in Delaware

Zip Code % Employed vs State vs National
1.1971723.9%6.3%(+17.6)#16.9%(+17.0)#566
2.1996714.8%6.3%(+8.45)#26.9%(+7.89)#1,736
3.1995414.7%6.3%(+8.41)#36.9%(+7.85)#1,750
4.1993014.2%6.3%(+7.87)#46.9%(+7.32)#1,903
5.1996810.6%6.3%(+4.28)#56.9%(+3.73)#3,876
6.1994610.4%6.3%(+4.04)#66.9%(+3.48)#4,129
7.199759.9%6.3%(+3.62)#76.9%(+3.06)#4,610
8.199719.7%6.3%(+3.42)#86.9%(+2.86)#4,866
9.199638.9%6.3%(+2.59)#96.9%(+2.03)#6,106
10.199018.7%6.3%(+2.40)#106.9%(+1.84)#6,431
11.199478.6%6.3%(+2.29)#116.9%(+1.73)#6,615
12.198088.6%6.3%(+2.25)#126.9%(+1.69)#6,692
13.199458.2%6.3%(+1.86)#136.9%(+1.30)#7,460
14.199668.0%6.3%(+1.72)#146.9%(+1.16)#7,737
15.199338.0%6.3%(+1.67)#156.9%(+1.11)#7,827
16.199708.0%6.3%(+1.63)#166.9%(+1.07)#7,911
17.199397.9%6.3%(+1.54)#176.9%(+0.980)#8,126
18.199587.5%6.3%(+1.18)#186.9%(+0.620)#8,989
19.199347.3%6.3%(+1.00)#196.9%(+0.445)#9,444
20.199807.3%6.3%(+0.968)#206.9%(+0.411)#9,560
21.199407.1%6.3%(+0.728)#216.9%(+0.170)#10,175
22.197036.8%6.3%(+0.438)#226.9%(-0.119)#11,010
23.199436.6%6.3%(+0.291)#236.9%(-0.267)#11,475
24.199506.6%6.3%(+0.239)#246.9%(-0.318)#11,642
25.198096.5%6.3%(+0.159)#256.9%(-0.398)#11,900
26.198046.4%6.3%(+0.115)#266.9%(-0.442)#12,039
27.198056.4%6.3%(+0.071)#276.9%(-0.487)#12,180
28.199446.1%6.3%(-0.226)#286.9%(-0.783)#13,146
29.199045.9%6.3%(-0.392)#296.9%(-0.949)#13,666
30.198025.9%6.3%(-0.443)#306.9%(-1.00)#13,849
31.199525.8%6.3%(-0.570)#316.9%(-1.13)#14,217
32.197135.7%6.3%(-0.583)#326.9%(-1.14)#14,258
33.197205.7%6.3%(-0.599)#336.9%(-1.16)#14,296
34.197115.6%6.3%(-0.688)#346.9%(-1.25)#14,577
35.199565.5%6.3%(-0.826)#356.9%(-1.38)#15,058
36.197025.4%6.3%(-0.902)#366.9%(-1.46)#15,325
37.197095.4%6.3%(-0.906)#376.9%(-1.46)#15,352
38.198035.4%6.3%(-0.964)#386.9%(-1.52)#15,545
39.198105.3%6.3%(-0.983)#396.9%(-1.54)#15,620
40.197345.3%6.3%(-1.07)#406.9%(-1.63)#15,946
41.198015.0%6.3%(-1.30)#416.9%(-1.85)#16,734
42.199734.8%6.3%(-1.50)#426.9%(-2.06)#17,407
43.197064.8%6.3%(-1.54)#436.9%(-2.10)#17,540
44.199774.7%6.3%(-1.66)#446.9%(-2.22)#17,950
45.198064.5%6.3%(-1.81)#456.9%(-2.37)#18,455
46.199384.5%6.3%(-1.82)#466.9%(-2.37)#18,473
47.197014.4%6.3%(-1.92)#476.9%(-2.48)#18,814
48.199624.3%6.3%(-2.05)#486.9%(-2.61)#19,271
49.199604.1%6.3%(-2.25)#496.9%(-2.81)#19,893
50.197073.7%6.3%(-2.62)#506.9%(-3.18)#21,116
51.199313.4%6.3%(-2.96)#516.9%(-3.52)#22,208
52.199413.3%6.3%(-3.07)#526.9%(-3.62)#22,536
53.199513.0%6.3%(-3.33)#536.9%(-3.88)#23,229
54.199532.9%6.3%(-3.45)#546.9%(-4.01)#23,571
55.198072.6%6.3%(-3.71)#556.9%(-4.27)#24,209
56.197301.9%6.3%(-4.42)#566.9%(-4.97)#25,736
57.199551.4%6.3%(-4.95)#576.9%(-5.51)#26,696
58.199640.94%6.3%(-5.39)#586.9%(-5.94)#27,393

Common Questions

What are the Top 10 Zip Codes with the Highest Percentage of Population Employed in Accommodation & Food Services in Delaware?
Top 10 Zip Codes with the Highest Percentage of Population Employed in Accommodation & Food Services in Delaware are:
#1
23.9%
#2
14.8%
#3
14.7%
#4
14.2%
#5
10.6%
#6
10.4%
#7
9.9%
#8
9.7%
#9
8.9%
#10
8.7%
What zip code has the Highest Percentage of Population Employed in Accommodation & Food Services in Delaware?
19717 has the Highest Percentage of Population Employed in Accommodation & Food Services in Delaware with 23.9%.
What is the Percentage of Population Employed in Accommodation & Food Services in the State of Delaware?
Percentage of Population Employed in Accommodation & Food Services in Delaware is 6.3%.
What is the Percentage of Population Employed in Accommodation & Food Services in the United States?
Percentage of Population Employed in Accommodation & Food Services in the United States is 6.9%.