Delta, CO Map & Demographics
Delta Map
Delta Overview
$29,437
PER CAPITA INCOME
$56,628
AVG FAMILY INCOME
$45,950
AVG HOUSEHOLD INCOME
16.6%
WAGE / INCOME GAP [ % ]
83.4¢/ $1
WAGE / INCOME GAP [ $ ]
0.52
INEQUALITY / GINI INDEX
9,137
TOTAL POPULATION
4,686
MALE POPULATION
4,451
FEMALE POPULATION
105.28
MALES / 100 FEMALES
94.99
FEMALES / 100 MALES
43.4
MEDIAN AGE
3.4
AVG FAMILY SIZE
2.6
AVG HOUSEHOLD SIZE
3,413
LABOR FORCE [ PEOPLE ]
48.1%
PERCENT IN LABOR FORCE
5.0%
UNEMPLOYMENT RATE
Delta Zip Codes
Delta Area Codes
Income in Delta
Income Overview in Delta
Per Capita Income in Delta is $29,437, while median incomes of families and households are $56,628 and $45,950 respectively.
| Characteristic | Number | Measure |
| Per Capita Income | 9,137 | $29,437 |
| Median Family Income | 2,083 | $56,628 |
| Mean Family Income | 2,083 | $71,810 |
| Median Household Income | 3,394 | $45,950 |
| Mean Household Income | 3,394 | $71,359 |
| Income Deficit | 2,083 | $0 |
| Wage / Income Gap (%) | 9,137 | 16.57% |
| Wage / Income Gap ($) | 9,137 | 83.43¢ per $1 |
| Gini / Inequality Index | 9,137 | 0.52 |
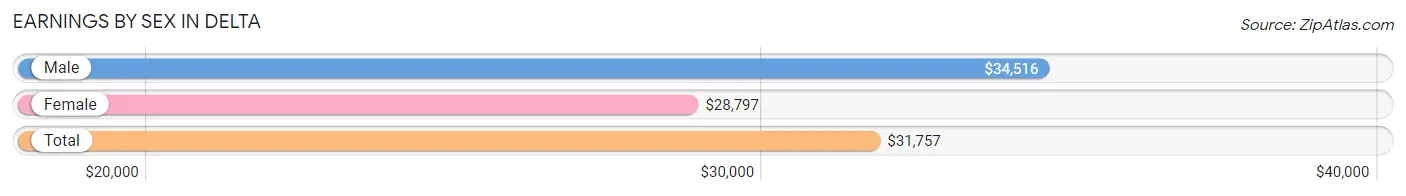
Earnings by Sex in Delta
Average Earnings in Delta are $31,757, $34,516 for men and $28,797 for women, a difference of 16.6%.
| Sex | Number | Average Earnings |
| Male | 1,948 (54.1%) | $34,516 |
| Female | 1,655 (45.9%) | $28,797 |
| Total | 3,603 (100.0%) | $31,757 |
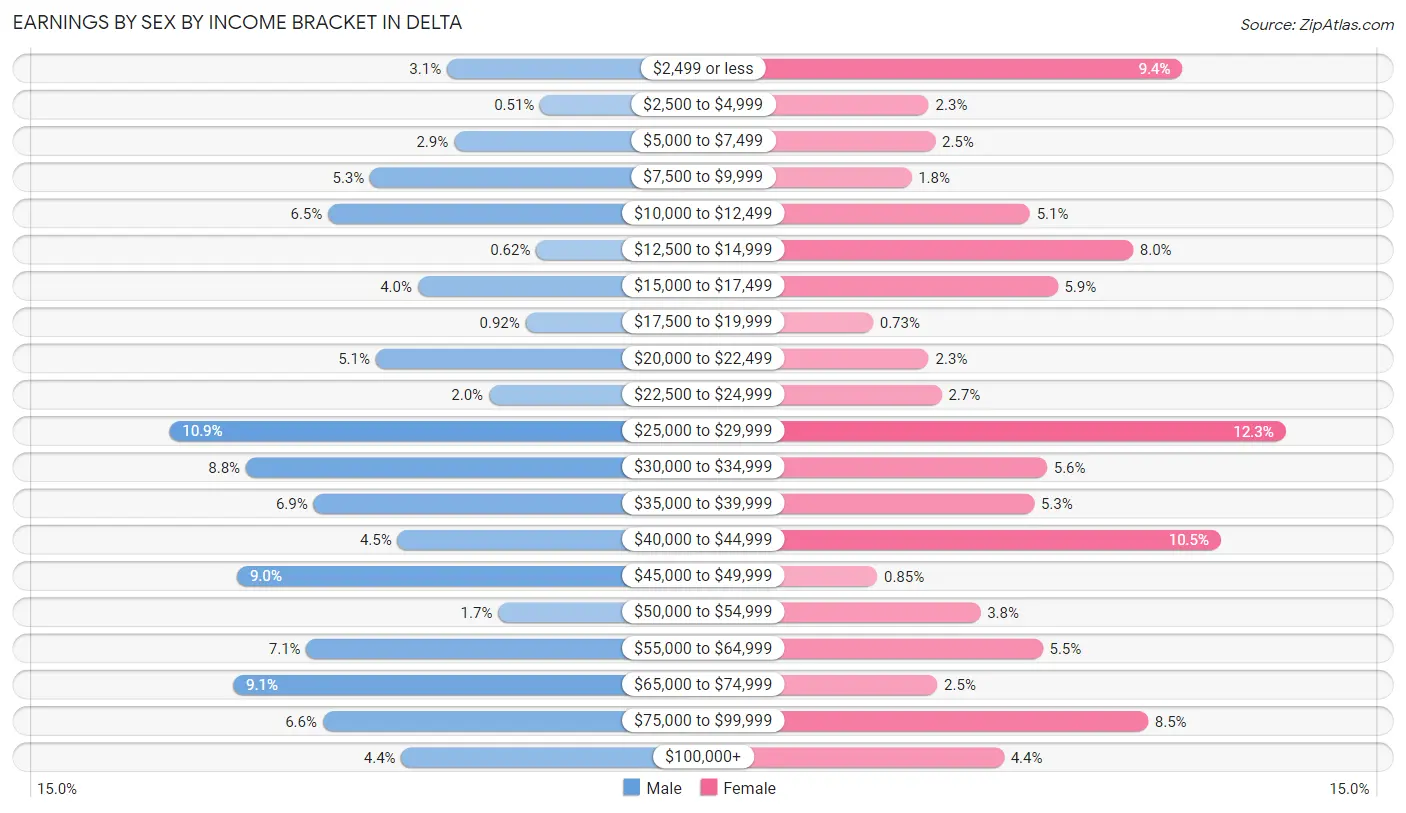
Earnings by Sex by Income Bracket in Delta
The most common earnings brackets in Delta are $25,000 to $29,999 for men (213 | 10.9%) and $25,000 to $29,999 for women (204 | 12.3%).
| Income | Male | Female |
| $2,499 or less | 61 (3.1%) | 156 (9.4%) |
| $2,500 to $4,999 | 10 (0.5%) | 38 (2.3%) |
| $5,000 to $7,499 | 57 (2.9%) | 41 (2.5%) |
| $7,500 to $9,999 | 103 (5.3%) | 30 (1.8%) |
| $10,000 to $12,499 | 126 (6.5%) | 85 (5.1%) |
| $12,500 to $14,999 | 12 (0.6%) | 133 (8.0%) |
| $15,000 to $17,499 | 77 (4.0%) | 98 (5.9%) |
| $17,500 to $19,999 | 18 (0.9%) | 12 (0.7%) |
| $20,000 to $22,499 | 100 (5.1%) | 38 (2.3%) |
| $22,500 to $24,999 | 38 (1.9%) | 44 (2.7%) |
| $25,000 to $29,999 | 213 (10.9%) | 204 (12.3%) |
| $30,000 to $34,999 | 171 (8.8%) | 93 (5.6%) |
| $35,000 to $39,999 | 134 (6.9%) | 87 (5.3%) |
| $40,000 to $44,999 | 88 (4.5%) | 174 (10.5%) |
| $45,000 to $49,999 | 176 (9.0%) | 14 (0.9%) |
| $50,000 to $54,999 | 33 (1.7%) | 62 (3.7%) |
| $55,000 to $64,999 | 138 (7.1%) | 91 (5.5%) |
| $65,000 to $74,999 | 178 (9.1%) | 42 (2.5%) |
| $75,000 to $99,999 | 129 (6.6%) | 140 (8.5%) |
| $100,000+ | 86 (4.4%) | 73 (4.4%) |
| Total | 1,948 (100.0%) | 1,655 (100.0%) |
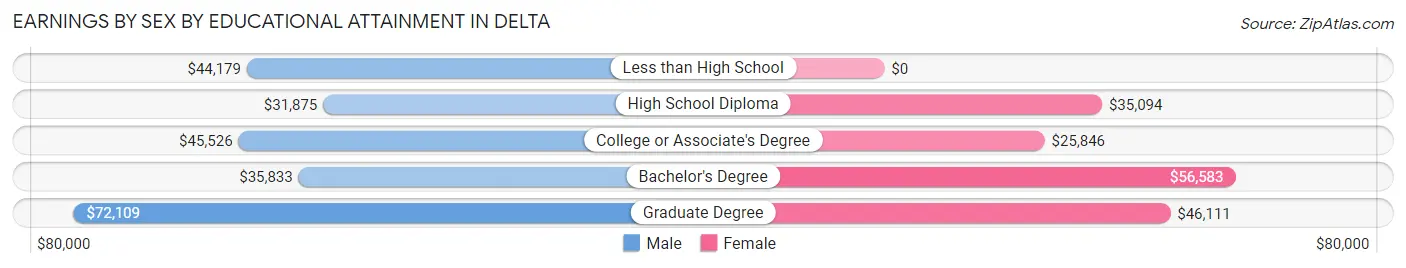
Earnings by Sex by Educational Attainment in Delta
Average earnings in Delta are $39,441 for men and $34,271 for women, a difference of 13.1%. Men with an educational attainment of graduate degree enjoy the highest average annual earnings of $72,109, while those with high school diploma education earn the least with $31,875. Women with an educational attainment of bachelor's degree earn the most with the average annual earnings of $56,583, while those with college or associate's degree education have the smallest earnings of $25,846.
| Educational Attainment | Male Income | Female Income |
| Less than High School | $44,179 | $0 |
| High School Diploma | $31,875 | $35,094 |
| College or Associate's Degree | $45,526 | $25,846 |
| Bachelor's Degree | $35,833 | $56,583 |
| Graduate Degree | $72,109 | $46,111 |
| Total | $39,441 | $34,271 |
Family Income in Delta
Family Income Brackets in Delta
According to the Delta family income data, there are 485 families falling into the $50,000 to $74,999 income range, which is the most common income bracket and makes up 23.3% of all families. Conversely, the $150,000 to $199,999 income bracket is the least frequent group with only 27 families (1.3%) belonging to this category.
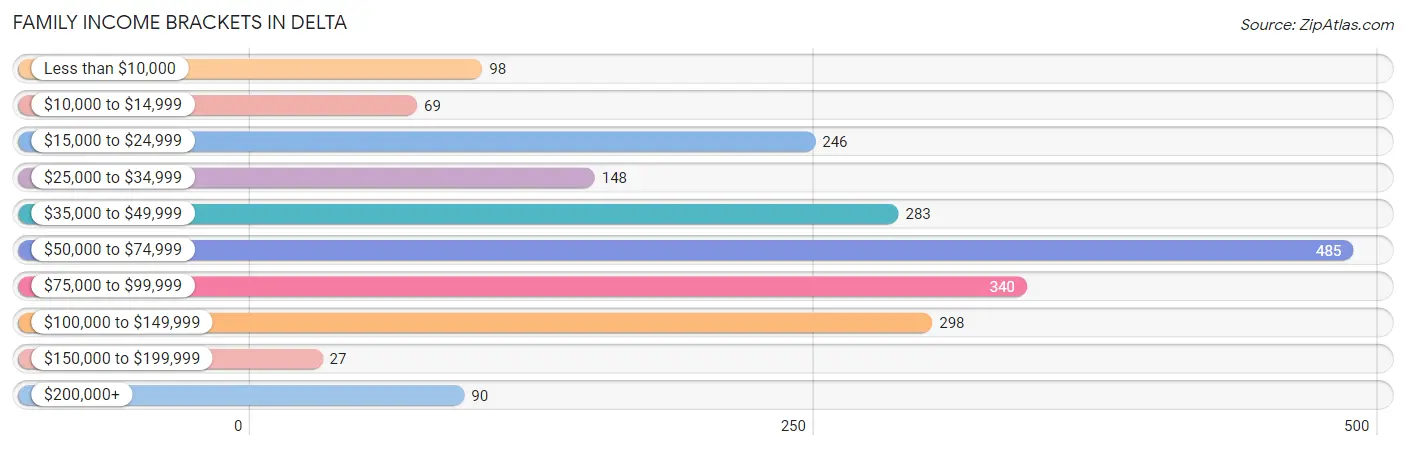
| Income Bracket | # Families | % Families |
| Less than $10,000 | 98 | 4.7% |
| $10,000 to $14,999 | 69 | 3.3% |
| $15,000 to $24,999 | 246 | 11.8% |
| $25,000 to $34,999 | 148 | 7.1% |
| $35,000 to $49,999 | 283 | 13.6% |
| $50,000 to $74,999 | 485 | 23.3% |
| $75,000 to $99,999 | 340 | 16.3% |
| $100,000 to $149,999 | 298 | 14.3% |
| $150,000 to $199,999 | 27 | 1.3% |
| $200,000+ | 90 | 4.3% |
Family Income by Famaliy Size in Delta
4-person families (295 | 14.2%) account for the highest median family income in Delta with $79,150 per family, while 2-person families (1,130 | 54.2%) have the highest median income of $24,620 per family member.
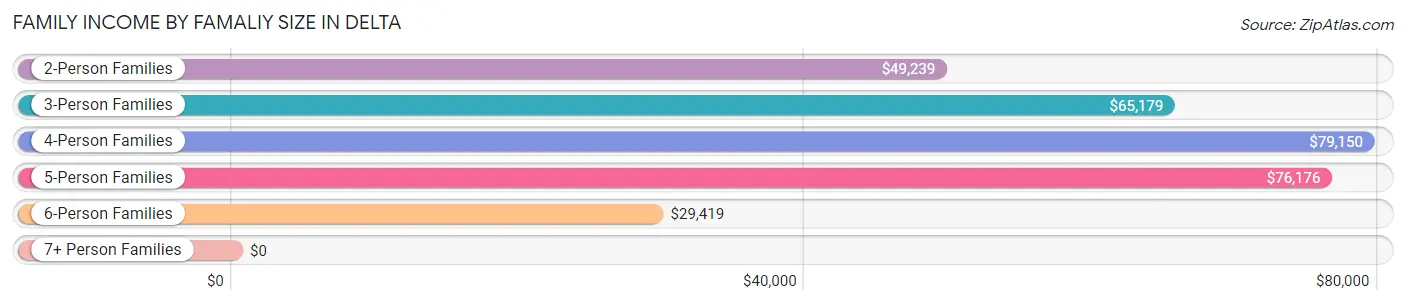
| Income Bracket | # Families | Median Income |
| 2-Person Families | 1,130 (54.2%) | $49,239 |
| 3-Person Families | 254 (12.2%) | $65,179 |
| 4-Person Families | 295 (14.2%) | $79,150 |
| 5-Person Families | 252 (12.1%) | $76,176 |
| 6-Person Families | 94 (4.5%) | $29,419 |
| 7+ Person Families | 58 (2.8%) | $0 |
| Total | 2,083 (100.0%) | $56,628 |
Family Income by Number of Earners in Delta
The median family income in Delta is $56,628, with families comprising 3+ earners (202) having the highest median family income of $105,000, while families with no earners (526) have the lowest median family income of $35,588, accounting for 9.7% and 25.3% of families, respectively.
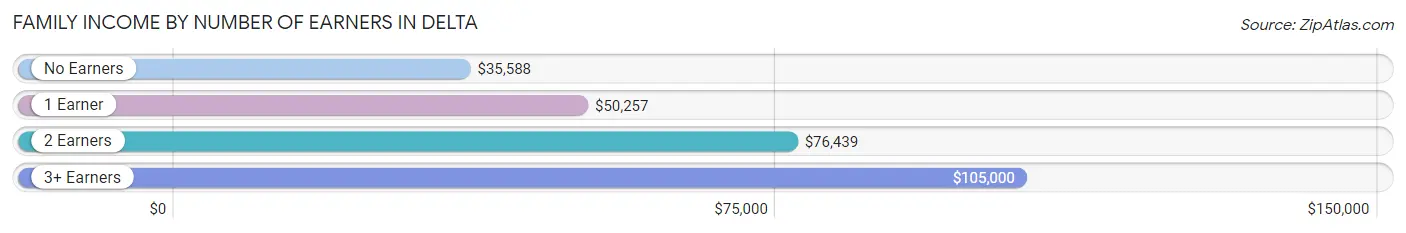
| Number of Earners | # Families | Median Income |
| No Earners | 526 (25.3%) | $35,588 |
| 1 Earner | 697 (33.5%) | $50,257 |
| 2 Earners | 658 (31.6%) | $76,439 |
| 3+ Earners | 202 (9.7%) | $105,000 |
| Total | 2,083 (100.0%) | $56,628 |
Household Income in Delta
Household Income Brackets in Delta
With 652 households falling in the category, the $50,000 to $74,999 income range is the most frequent in Delta, accounting for 19.2% of all households. In contrast, only 54 households (1.6%) fall into the $150,000 to $199,999 income bracket, making it the least populous group.
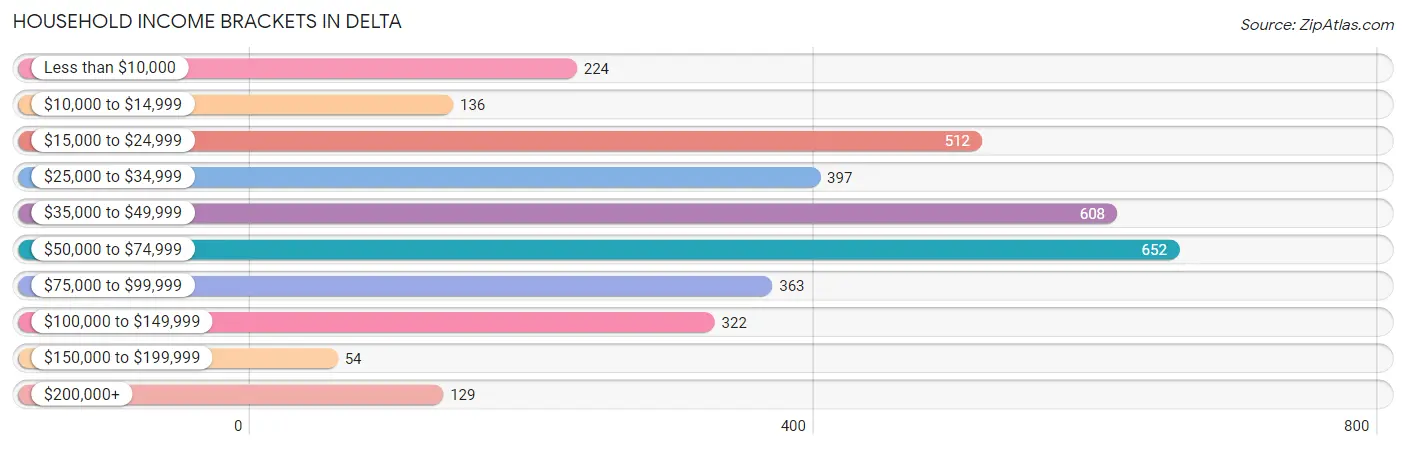
| Income Bracket | # Households | % Households |
| Less than $10,000 | 224 | 6.6% |
| $10,000 to $14,999 | 136 | 4.0% |
| $15,000 to $24,999 | 512 | 15.1% |
| $25,000 to $34,999 | 397 | 11.7% |
| $35,000 to $49,999 | 608 | 17.9% |
| $50,000 to $74,999 | 652 | 19.2% |
| $75,000 to $99,999 | 363 | 10.7% |
| $100,000 to $149,999 | 322 | 9.5% |
| $150,000 to $199,999 | 54 | 1.6% |
| $200,000+ | 129 | 3.8% |
Household Income by Householder Age in Delta
The median household income in Delta is $45,950, with the highest median household income of $61,667 found in the 25 to 44 years age bracket for the primary householder. A total of 684 households (20.2%) fall into this category. Meanwhile, the 65+ years age bracket for the primary householder has the lowest median household income of $42,737, with 1,075 households (31.7%) in this group.
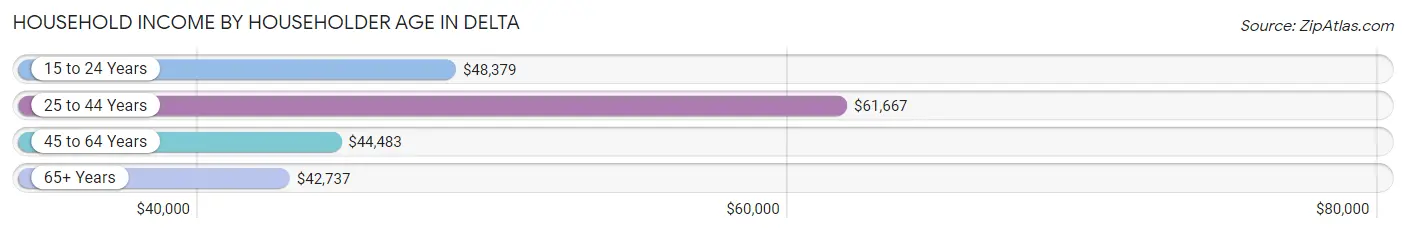
| Income Bracket | # Households | Median Income |
| 15 to 24 Years | 155 (4.6%) | $48,379 |
| 25 to 44 Years | 684 (20.2%) | $61,667 |
| 45 to 64 Years | 1,480 (43.6%) | $44,483 |
| 65+ Years | 1,075 (31.7%) | $42,737 |
| Total | 3,394 (100.0%) | $45,950 |
Poverty in Delta
Income Below Poverty by Sex and Age in Delta
With 17.1% poverty level for males and 23.9% for females among the residents of Delta, under 5 year old males and 6 to 11 year old females are the most vulnerable to poverty, with 137 males (89.0%) and 227 females (52.1%) in their respective age groups living below the poverty level.
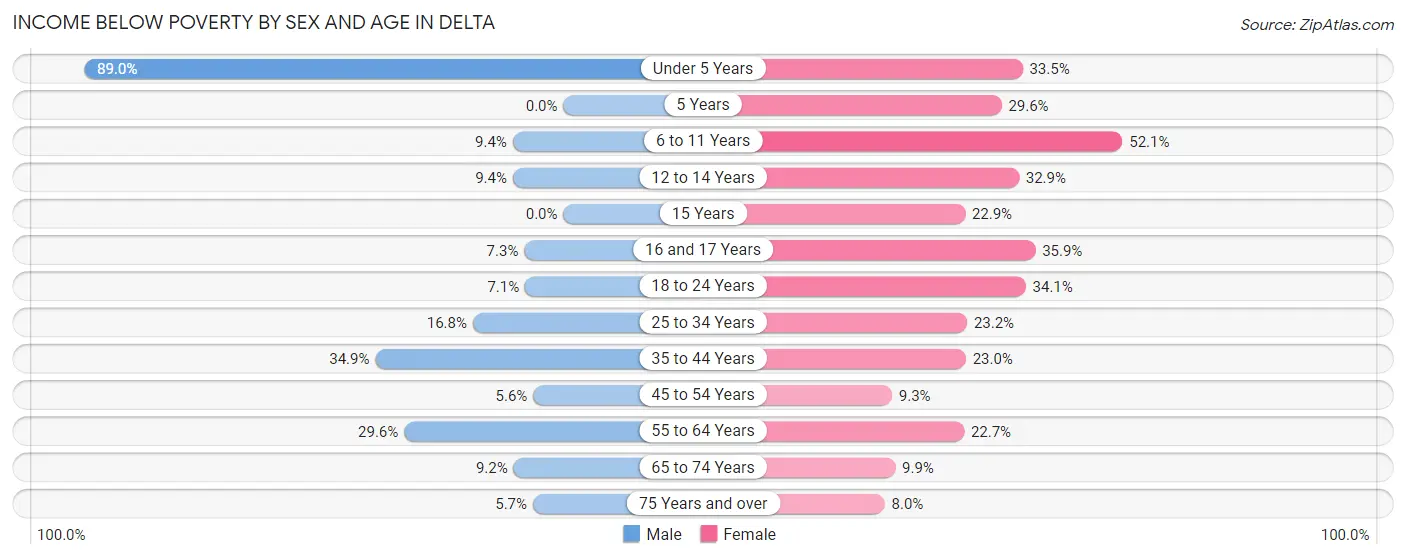
| Age Bracket | Male | Female |
| Under 5 Years | 137 (89.0%) | 108 (33.5%) |
| 5 Years | 0 (0.0%) | 8 (29.6%) |
| 6 to 11 Years | 52 (9.4%) | 227 (52.1%) |
| 12 to 14 Years | 12 (9.4%) | 90 (32.9%) |
| 15 Years | 0 (0.0%) | 8 (22.9%) |
| 16 and 17 Years | 9 (7.3%) | 42 (35.9%) |
| 18 to 24 Years | 34 (7.1%) | 101 (34.1%) |
| 25 to 34 Years | 65 (16.8%) | 69 (23.2%) |
| 35 to 44 Years | 170 (34.9%) | 109 (23.0%) |
| 45 to 54 Years | 30 (5.6%) | 42 (9.3%) |
| 55 to 64 Years | 196 (29.6%) | 156 (22.7%) |
| 65 to 74 Years | 50 (9.2%) | 60 (9.9%) |
| 75 Years and over | 26 (5.7%) | 29 (8.0%) |
| Total | 781 (17.1%) | 1,049 (23.9%) |
Income Above Poverty by Sex and Age in Delta
According to the poverty statistics in Delta, males aged 15 years and females aged 75 years and over are the age groups that are most secure financially, with 100.0% of males and 92.0% of females in these age groups living above the poverty line.
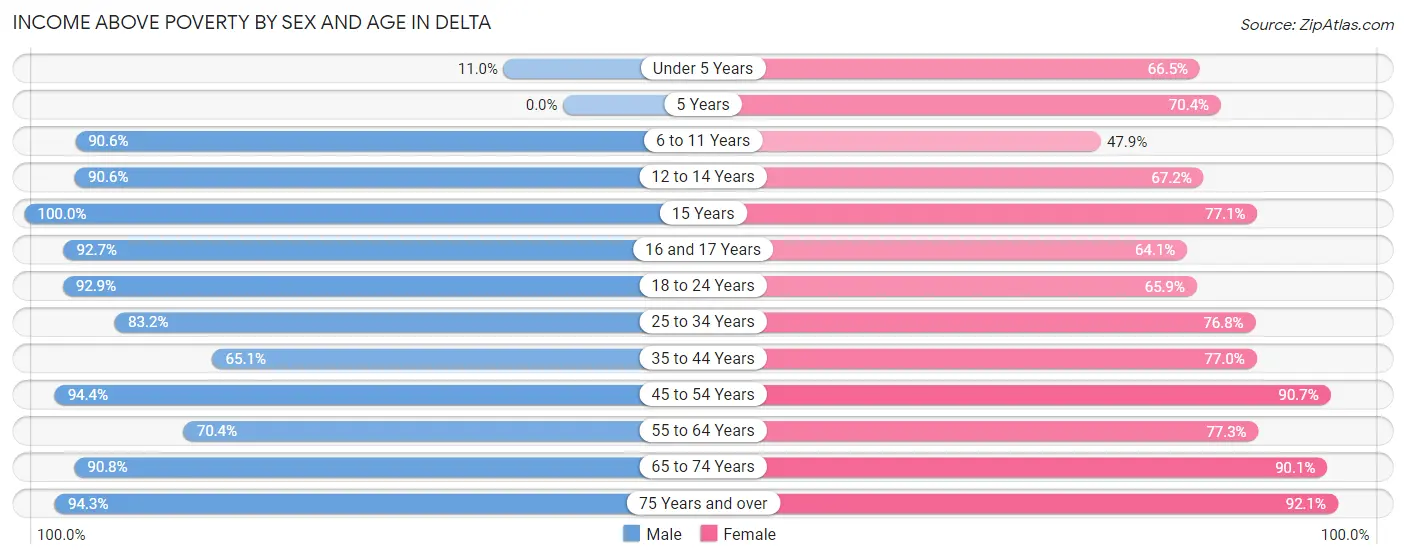
| Age Bracket | Male | Female |
| Under 5 Years | 17 (11.0%) | 214 (66.5%) |
| 5 Years | 0 (0.0%) | 19 (70.4%) |
| 6 to 11 Years | 501 (90.6%) | 209 (47.9%) |
| 12 to 14 Years | 116 (90.6%) | 184 (67.1%) |
| 15 Years | 61 (100.0%) | 27 (77.1%) |
| 16 and 17 Years | 115 (92.7%) | 75 (64.1%) |
| 18 to 24 Years | 444 (92.9%) | 195 (65.9%) |
| 25 to 34 Years | 322 (83.2%) | 228 (76.8%) |
| 35 to 44 Years | 317 (65.1%) | 365 (77.0%) |
| 45 to 54 Years | 506 (94.4%) | 410 (90.7%) |
| 55 to 64 Years | 467 (70.4%) | 532 (77.3%) |
| 65 to 74 Years | 491 (90.8%) | 546 (90.1%) |
| 75 Years and over | 433 (94.3%) | 336 (92.0%) |
| Total | 3,790 (82.9%) | 3,340 (76.1%) |
Income Below Poverty Among Married-Couple Families in Delta
The poverty statistics for married-couple families in Delta show that 11.5% or 159 of the total 1,386 families live below the poverty line. Families with 3 or 4 children have the highest poverty rate of 14.3%, comprising of 31 families. On the other hand, families with 5 or more children have the lowest poverty rate of 0.0%, which includes 0 families.
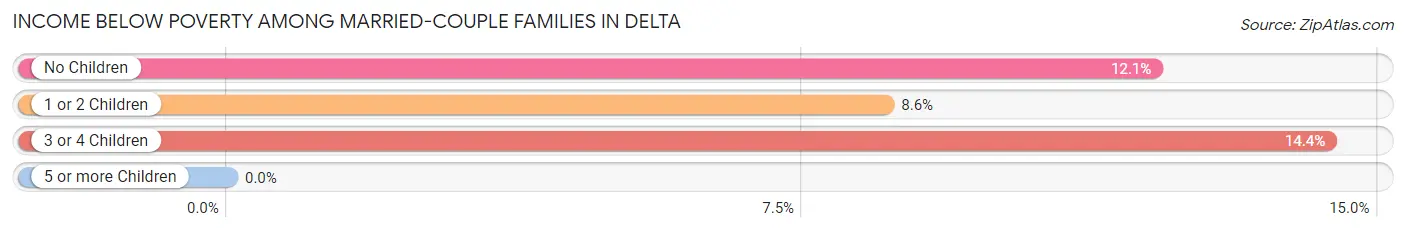
| Children | Above Poverty | Below Poverty |
| No Children | 735 (87.9%) | 101 (12.1%) |
| 1 or 2 Children | 288 (91.4%) | 27 (8.6%) |
| 3 or 4 Children | 185 (85.7%) | 31 (14.3%) |
| 5 or more Children | 19 (100.0%) | 0 (0.0%) |
| Total | 1,227 (88.5%) | 159 (11.5%) |
Income Below Poverty Among Single-Parent Households in Delta
According to the poverty data in Delta, 4.6% or 8 single-father households and 44.2% or 231 single-mother households are living below the poverty line. Among single-father households, those with no children have the highest poverty rate, with 8 households (6.0%) experiencing poverty. Likewise, among single-mother households, those with 5 or more children have the highest poverty rate, with 43 households (100.0%) falling below the poverty line.
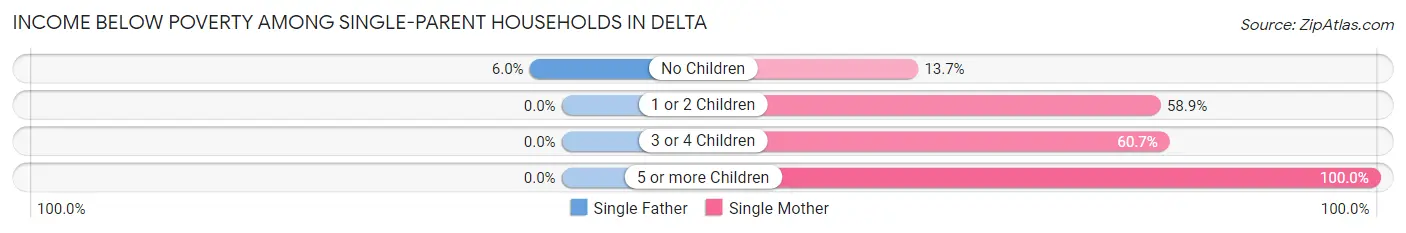
| Children | Single Father | Single Mother |
| No Children | 8 (6.0%) | 29 (13.7%) |
| 1 or 2 Children | 0 (0.0%) | 142 (58.9%) |
| 3 or 4 Children | 0 (0.0%) | 17 (60.7%) |
| 5 or more Children | 0 (0.0%) | 43 (100.0%) |
| Total | 8 (4.6%) | 231 (44.2%) |
Income Below Poverty Among Married-Couple vs Single-Parent Households in Delta
The poverty data for Delta shows that 159 of the married-couple family households (11.5%) and 239 of the single-parent households (34.3%) are living below the poverty level. Within the married-couple family households, those with 3 or 4 children have the highest poverty rate, with 31 households (14.3%) falling below the poverty line. Among the single-parent households, those with 5 or more children have the highest poverty rate, with 43 household (100.0%) living below poverty.
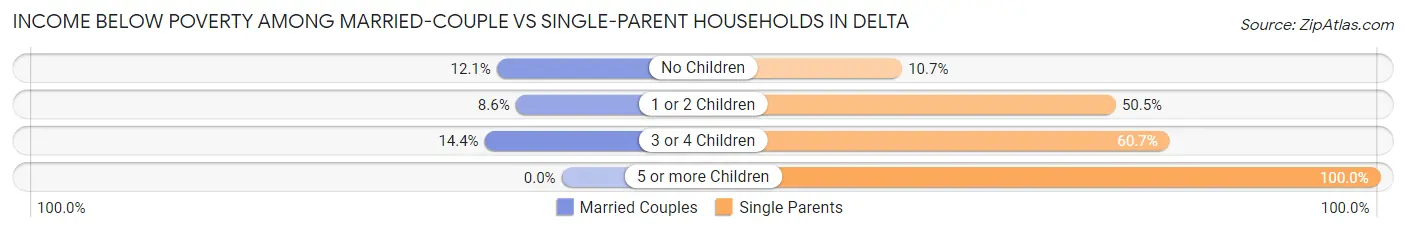
| Children | Married-Couple Families | Single-Parent Households |
| No Children | 101 (12.1%) | 37 (10.7%) |
| 1 or 2 Children | 27 (8.6%) | 142 (50.5%) |
| 3 or 4 Children | 31 (14.3%) | 17 (60.7%) |
| 5 or more Children | 0 (0.0%) | 43 (100.0%) |
| Total | 159 (11.5%) | 239 (34.3%) |
Race in Delta
The most populous races in Delta are White / Caucasian (7,288 | 79.8%), Hispanic or Latino (2,425 | 26.5%), and Two or more Races (1,315 | 14.4%).
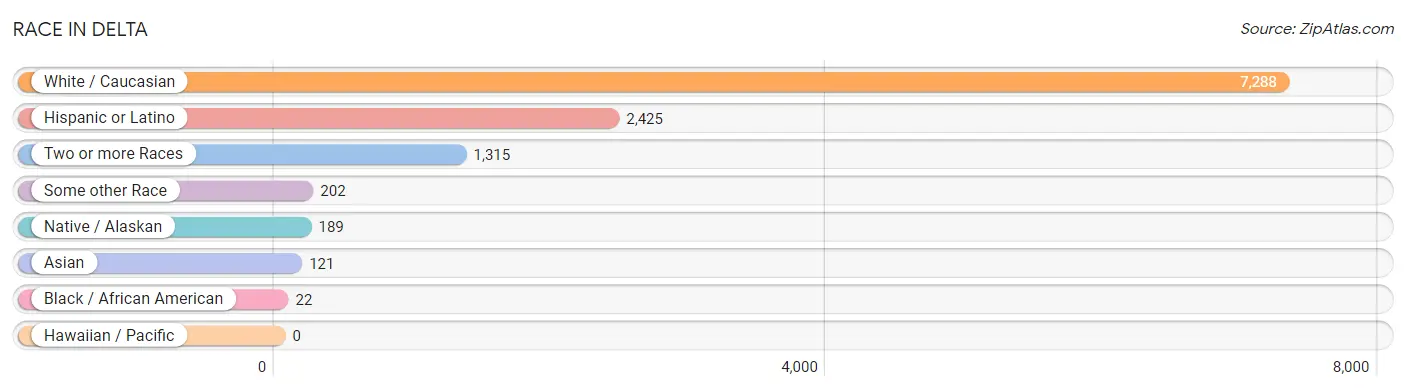
| Race | # Population | % Population |
| Asian | 121 | 1.3% |
| Black / African American | 22 | 0.2% |
| Hawaiian / Pacific | 0 | 0.0% |
| Hispanic or Latino | 2,425 | 26.5% |
| Native / Alaskan | 189 | 2.1% |
| White / Caucasian | 7,288 | 79.8% |
| Two or more Races | 1,315 | 14.4% |
| Some other Race | 202 | 2.2% |
| Total | 9,137 | 100.0% |
Ancestry in Delta
The most populous ancestries reported in Delta are Mexican (1,893 | 20.7%), German (1,107 | 12.1%), Irish (1,019 | 11.2%), English (929 | 10.2%), and American (465 | 5.1%), together accounting for 59.3% of all Delta residents.
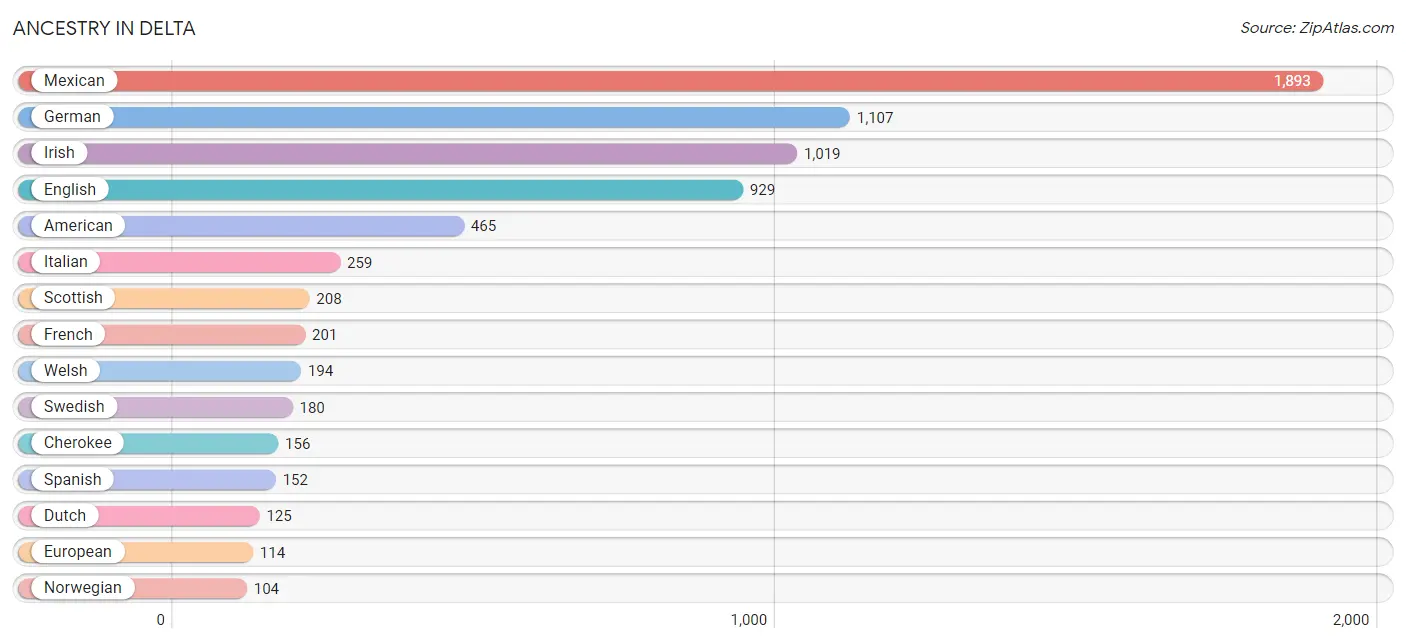
| Ancestry | # Population | % Population |
| American | 465 | 5.1% |
| Apache | 59 | 0.6% |
| Arab | 26 | 0.3% |
| Australian | 9 | 0.1% |
| Austrian | 6 | 0.1% |
| Belgian | 11 | 0.1% |
| British | 17 | 0.2% |
| Central American | 67 | 0.7% |
| Cherokee | 156 | 1.7% |
| Chippewa | 16 | 0.2% |
| Croatian | 8 | 0.1% |
| Crow | 1 | 0.0% |
| Dutch | 125 | 1.4% |
| English | 929 | 10.2% |
| Estonian | 12 | 0.1% |
| European | 114 | 1.3% |
| French | 201 | 2.2% |
| French Canadian | 79 | 0.9% |
| German | 1,107 | 12.1% |
| Guatemalan | 67 | 0.7% |
| Icelander | 12 | 0.1% |
| Indonesian | 85 | 0.9% |
| Iraqi | 26 | 0.3% |
| Irish | 1,019 | 11.2% |
| Italian | 259 | 2.8% |
| Korean | 18 | 0.2% |
| Latvian | 2 | 0.0% |
| Mexican | 1,893 | 20.7% |
| Navajo | 71 | 0.8% |
| Northern European | 23 | 0.3% |
| Norwegian | 104 | 1.1% |
| Pakistani | 18 | 0.2% |
| Pennsylvania German | 50 | 0.5% |
| Polish | 79 | 0.9% |
| Russian | 8 | 0.1% |
| Scandinavian | 42 | 0.5% |
| Scotch-Irish | 59 | 0.6% |
| Scottish | 208 | 2.3% |
| Spaniard | 65 | 0.7% |
| Spanish | 152 | 1.7% |
| Subsaharan African | 20 | 0.2% |
| Swedish | 180 | 2.0% |
| Swiss | 48 | 0.5% |
| Welsh | 194 | 2.1% | View All 44 Rows |
Immigrants in Delta
The most numerous immigrant groups reported in Delta came from Central America (336 | 3.7%), Latin America (336 | 3.7%), Mexico (336 | 3.7%), Asia (103 | 1.1%), and South Eastern Asia (103 | 1.1%), together accounting for 13.3% of all Delta residents.
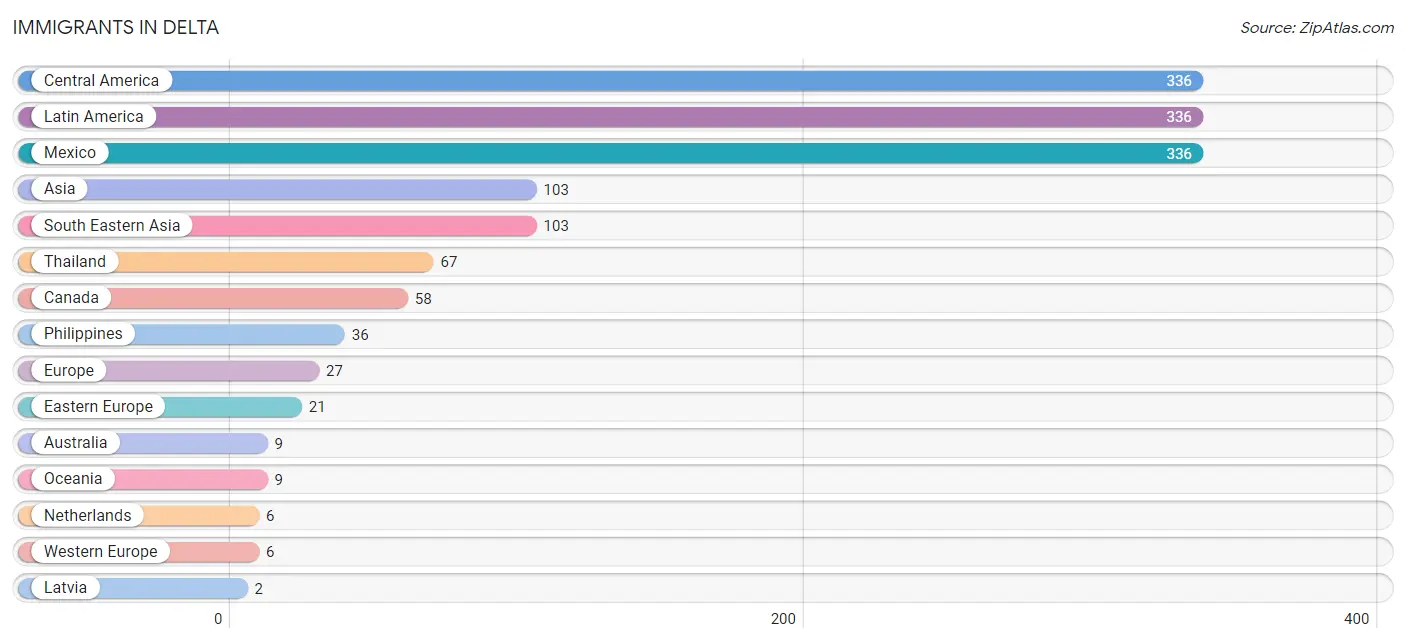
| Immigration Origin | # Population | % Population |
| Asia | 103 | 1.1% |
| Australia | 9 | 0.1% |
| Canada | 58 | 0.6% |
| Central America | 336 | 3.7% |
| Eastern Europe | 21 | 0.2% |
| Europe | 27 | 0.3% |
| Latin America | 336 | 3.7% |
| Latvia | 2 | 0.0% |
| Mexico | 336 | 3.7% |
| Netherlands | 6 | 0.1% |
| Oceania | 9 | 0.1% |
| Philippines | 36 | 0.4% |
| South Eastern Asia | 103 | 1.1% |
| Thailand | 67 | 0.7% |
| Western Europe | 6 | 0.1% | View All 15 Rows |
Sex and Age in Delta
Sex and Age in Delta
The most populous age groups in Delta are 60 to 64 Years (468 | 10.0%) for men and 65 to 69 Years (424 | 9.5%) for women.
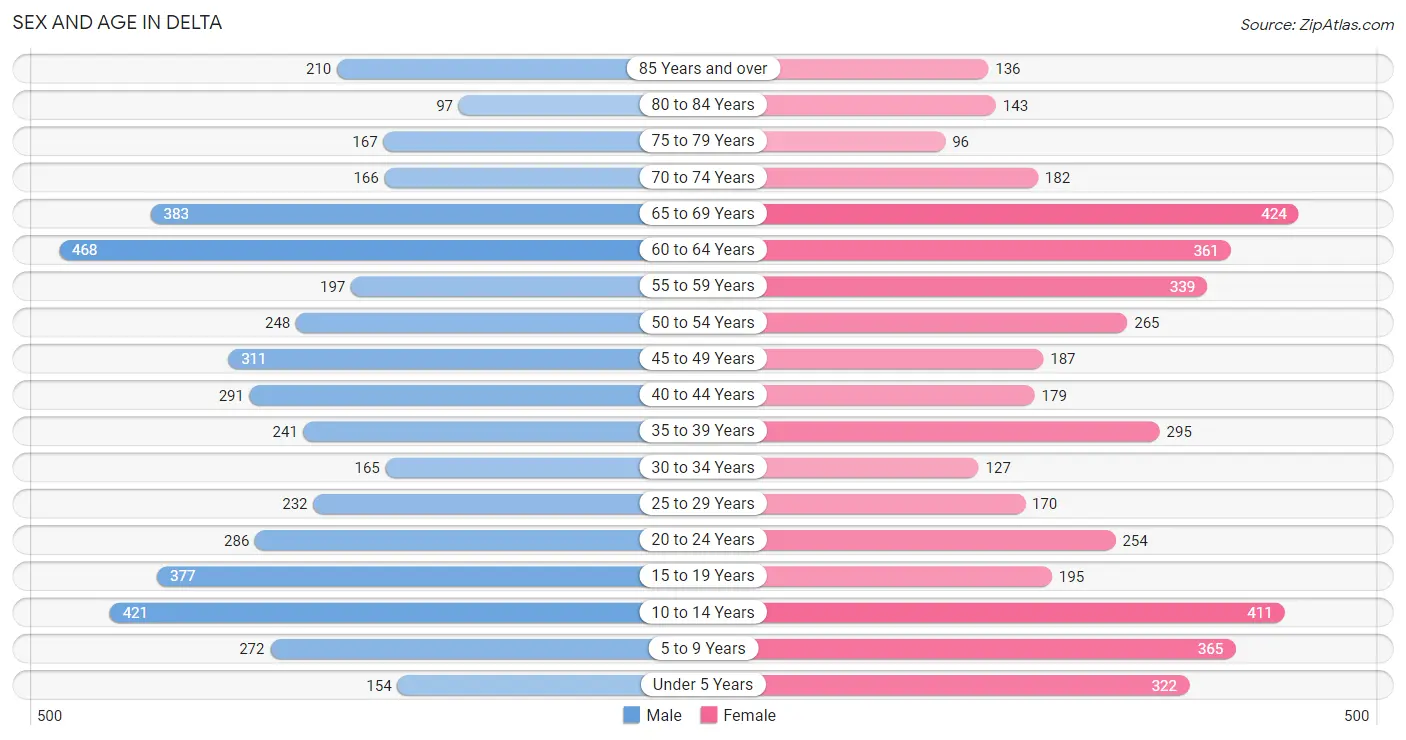
| Age Bracket | Male | Female |
| Under 5 Years | 154 (3.3%) | 322 (7.2%) |
| 5 to 9 Years | 272 (5.8%) | 365 (8.2%) |
| 10 to 14 Years | 421 (9.0%) | 411 (9.2%) |
| 15 to 19 Years | 377 (8.1%) | 195 (4.4%) |
| 20 to 24 Years | 286 (6.1%) | 254 (5.7%) |
| 25 to 29 Years | 232 (5.0%) | 170 (3.8%) |
| 30 to 34 Years | 165 (3.5%) | 127 (2.9%) |
| 35 to 39 Years | 241 (5.1%) | 295 (6.6%) |
| 40 to 44 Years | 291 (6.2%) | 179 (4.0%) |
| 45 to 49 Years | 311 (6.6%) | 187 (4.2%) |
| 50 to 54 Years | 248 (5.3%) | 265 (5.9%) |
| 55 to 59 Years | 197 (4.2%) | 339 (7.6%) |
| 60 to 64 Years | 468 (10.0%) | 361 (8.1%) |
| 65 to 69 Years | 383 (8.2%) | 424 (9.5%) |
| 70 to 74 Years | 166 (3.5%) | 182 (4.1%) |
| 75 to 79 Years | 167 (3.6%) | 96 (2.2%) |
| 80 to 84 Years | 97 (2.1%) | 143 (3.2%) |
| 85 Years and over | 210 (4.5%) | 136 (3.1%) |
| Total | 4,686 (100.0%) | 4,451 (100.0%) |
Families and Households in Delta
Median Family Size in Delta
The median family size in Delta is 3.42 persons per family, with married-couple families (1,386 | 66.5%) accounting for the largest median family size of 3.53 persons per family. On the other hand, single male/father families (174 | 8.4%) represent the smallest median family size with 3.20 persons per family.
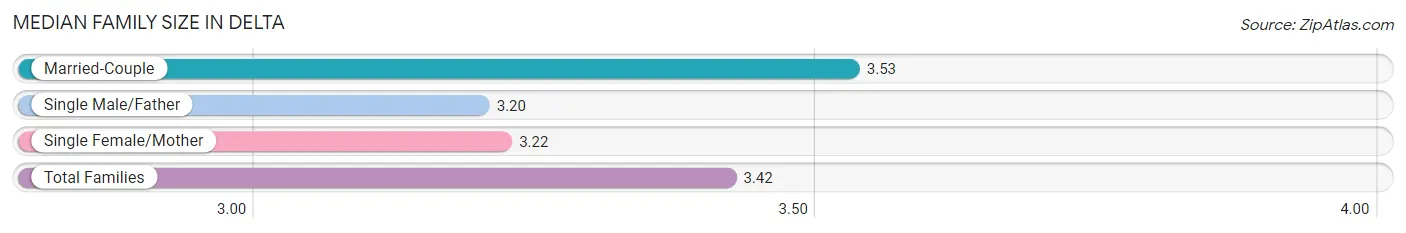
| Family Type | # Families | Family Size |
| Married-Couple | 1,386 (66.5%) | 3.53 |
| Single Male/Father | 174 (8.4%) | 3.20 |
| Single Female/Mother | 523 (25.1%) | 3.22 |
| Total Families | 2,083 (100.0%) | 3.42 |
Median Household Size in Delta
The median household size in Delta is 2.62 persons per household, with married-couple households (1,386 | 40.8%) accounting for the largest median household size of 3.54 persons per household. non-family households (1,311 | 38.6%) represent the smallest median household size with 1.23 persons per household.
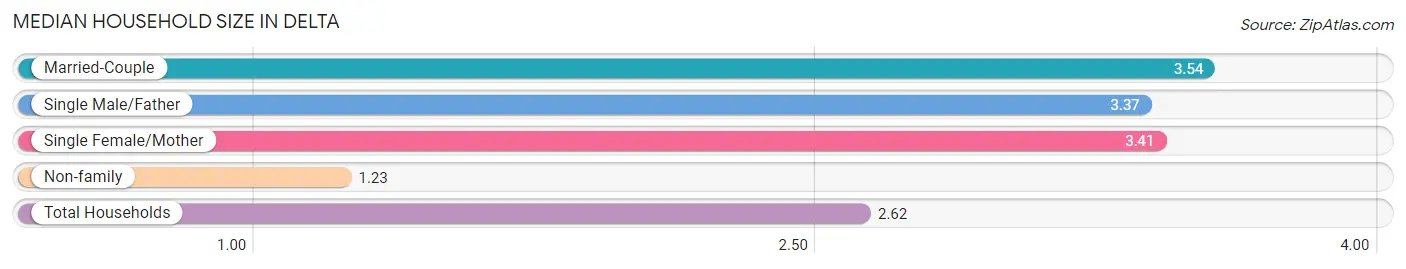
| Household Type | # Households | Household Size |
| Married-Couple | 1,386 (40.8%) | 3.54 |
| Single Male/Father | 174 (5.1%) | 3.37 |
| Single Female/Mother | 523 (15.4%) | 3.41 |
| Non-family | 1,311 (38.6%) | 1.23 |
| Total Households | 3,394 (100.0%) | 2.62 |
Household Size by Marriage Status in Delta
Out of a total of 3,394 households in Delta, 2,083 (61.4%) are family households, while 1,311 (38.6%) are nonfamily households. The most numerous type of family households are 2-person households, comprising 1,059, and the most common type of nonfamily households are 1-person households, comprising 1,154.
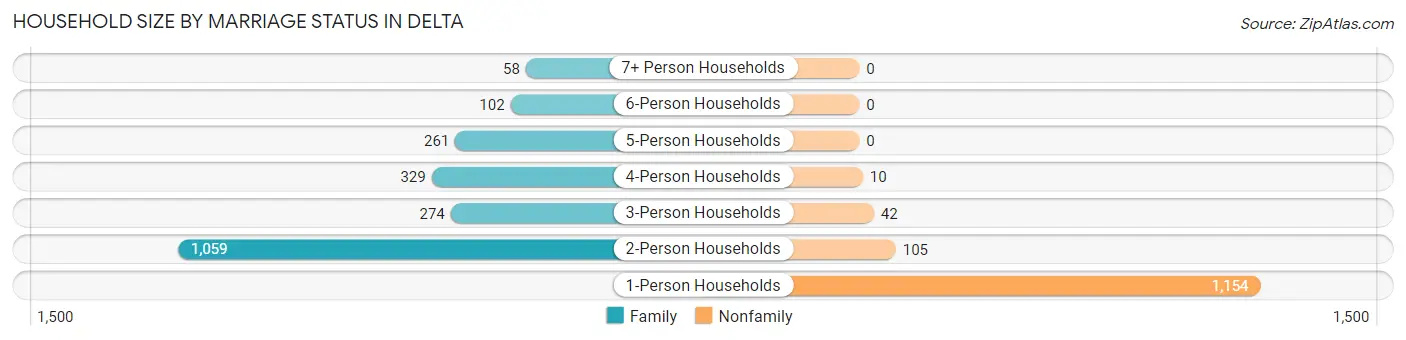
| Household Size | Family Households | Nonfamily Households |
| 1-Person Households | - | 1,154 (34.0%) |
| 2-Person Households | 1,059 (31.2%) | 105 (3.1%) |
| 3-Person Households | 274 (8.1%) | 42 (1.2%) |
| 4-Person Households | 329 (9.7%) | 10 (0.3%) |
| 5-Person Households | 261 (7.7%) | 0 (0.0%) |
| 6-Person Households | 102 (3.0%) | 0 (0.0%) |
| 7+ Person Households | 58 (1.7%) | 0 (0.0%) |
| Total | 2,083 (61.4%) | 1,311 (38.6%) |
Female Fertility in Delta
Fertility by Age in Delta
Average fertility rate in Delta is 42.0 births per 1,000 women. Women in the age bracket of 20 to 34 years have the highest fertility rate with 64.0 births per 1,000 women. Women in the age bracket of 20 to 34 years acount for 56.5% of all women with births.
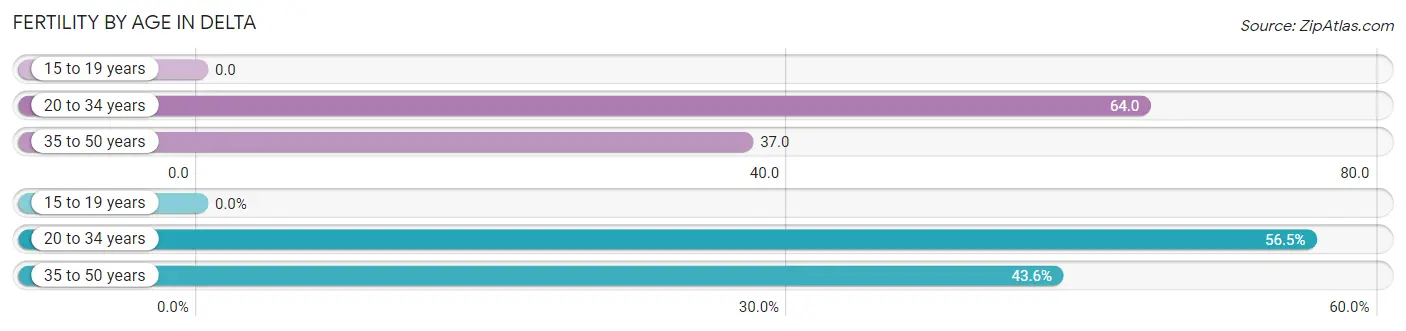
| Age Bracket | Women with Births | Births / 1,000 Women |
| 15 to 19 years | 0 (0.0%) | 0.0 |
| 20 to 34 years | 35 (56.5%) | 64.0 |
| 35 to 50 years | 27 (43.5%) | 37.0 |
| Total | 62 (100.0%) | 42.0 |
Fertility by Age by Marriage Status in Delta
72.6% of women with births (62) in Delta are married. The highest percentage of unmarried women with births falls into 35 to 50 years age bracket with 29.6% of them unmarried at the time of birth, while the lowest percentage of unmarried women with births belong to 20 to 34 years age bracket with 25.7% of them unmarried.
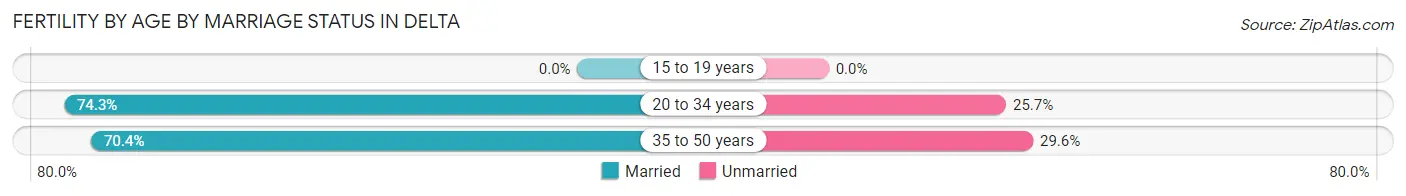
| Age Bracket | Married | Unmarried |
| 15 to 19 years | 0 (0.0%) | 0 (0.0%) |
| 20 to 34 years | 26 (74.3%) | 9 (25.7%) |
| 35 to 50 years | 19 (70.4%) | 8 (29.6%) |
| Total | 45 (72.6%) | 17 (27.4%) |
Fertility by Education in Delta
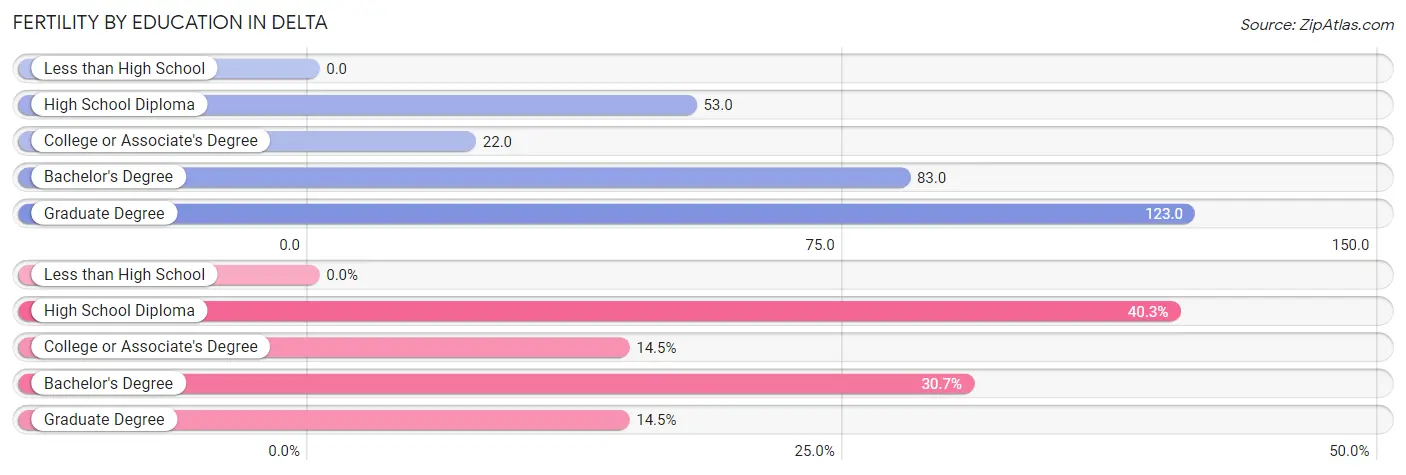
| Educational Attainment | Women with Births | Births / 1,000 Women |
| Less than High School | 0 (0.0%) | 0.0 |
| High School Diploma | 25 (40.3%) | 53.0 |
| College or Associate's Degree | 9 (14.5%) | 22.0 |
| Bachelor's Degree | 19 (30.6%) | 83.0 |
| Graduate Degree | 9 (14.5%) | 123.0 |
| Total | 62 (100.0%) | 42.0 |
Fertility by Education by Marriage Status in Delta
27.4% of women with births in Delta are unmarried. Women with the educational attainment of bachelor's degree are most likely to be married with 100.0% of them married at childbirth, while women with the educational attainment of college or associate's degree are least likely to be married with 100.0% of them unmarried at childbirth.
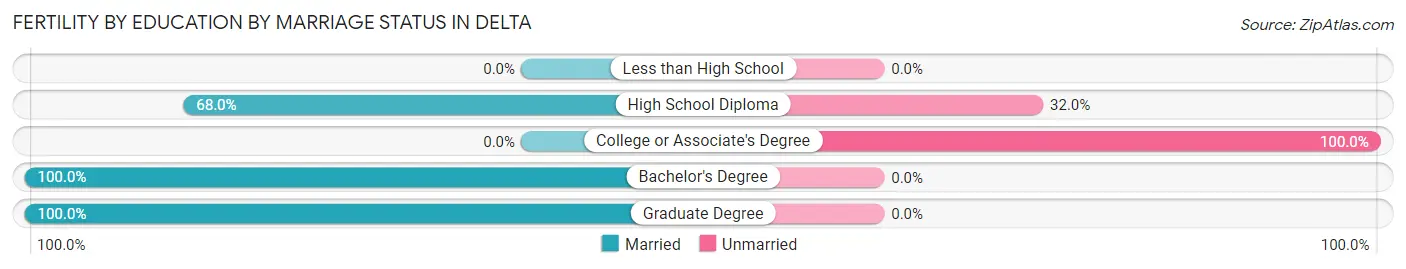
| Educational Attainment | Married | Unmarried |
| Less than High School | 0 (0.0%) | 0 (0.0%) |
| High School Diploma | 17 (68.0%) | 8 (32.0%) |
| College or Associate's Degree | 0 (0.0%) | 9 (100.0%) |
| Bachelor's Degree | 19 (100.0%) | 0 (0.0%) |
| Graduate Degree | 9 (100.0%) | 0 (0.0%) |
| Total | 45 (72.6%) | 17 (27.4%) |
Employment Characteristics in Delta
Employment by Class of Employer in Delta
Among the 3,178 employed individuals in Delta, private company employees (2,071 | 65.2%), local government employees (372 | 11.7%), and not-for-profit organizations (230 | 7.2%) make up the most common classes of employment.
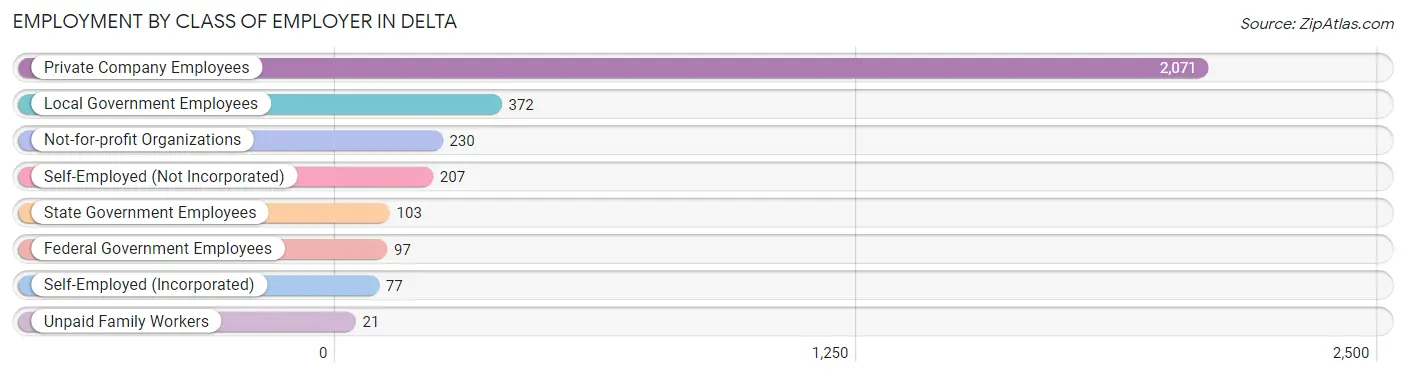
| Employer Class | # Employees | % Employees |
| Private Company Employees | 2,071 | 65.2% |
| Self-Employed (Incorporated) | 77 | 2.4% |
| Self-Employed (Not Incorporated) | 207 | 6.5% |
| Not-for-profit Organizations | 230 | 7.2% |
| Local Government Employees | 372 | 11.7% |
| State Government Employees | 103 | 3.2% |
| Federal Government Employees | 97 | 3.0% |
| Unpaid Family Workers | 21 | 0.7% |
| Total | 3,178 | 100.0% |
Employment Status by Age in Delta
According to the labor force statistics for Delta, out of the total population over 16 years of age (7,096), 48.1% or 3,413 individuals are in the labor force, with 5.0% or 171 of them unemployed. The age group with the highest labor force participation rate is 20 to 24 years, with 86.3% or 466 individuals in the labor force. Within the labor force, the 45 to 54 years age range has the highest percentage of unemployed individuals, with 12.9% or 90 of them being unemployed.
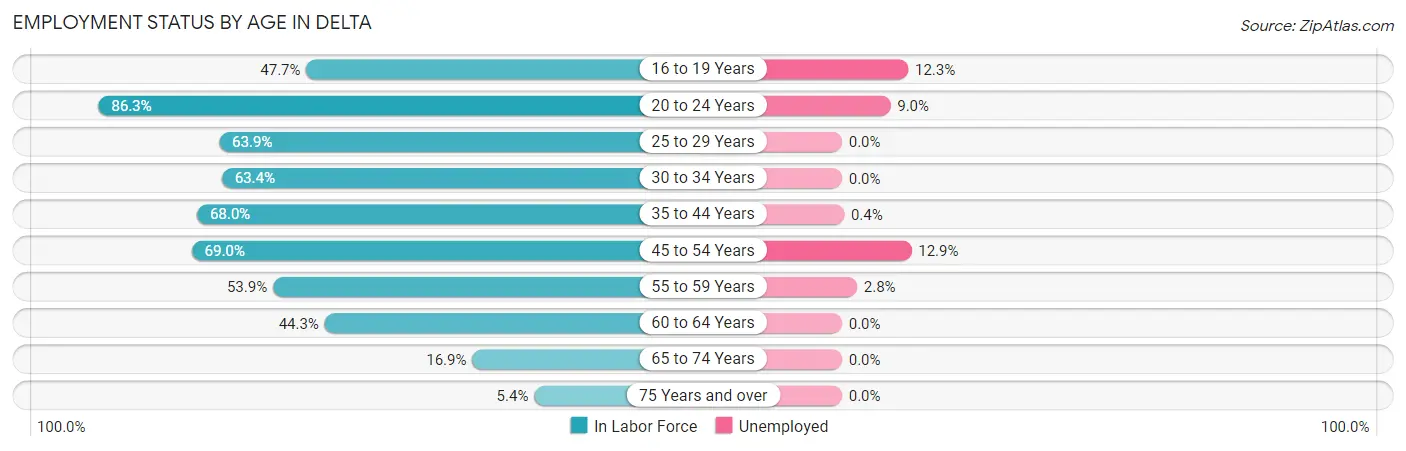
| Age Bracket | In Labor Force | Unemployed |
| 16 to 19 Years | 227 (47.7%) | 28 (12.3%) |
| 20 to 24 Years | 466 (86.3%) | 42 (9.0%) |
| 25 to 29 Years | 257 (63.9%) | 0 (0.0%) |
| 30 to 34 Years | 185 (63.4%) | 0 (0.0%) |
| 35 to 44 Years | 684 (68.0%) | 3 (0.4%) |
| 45 to 54 Years | 698 (69.0%) | 90 (12.9%) |
| 55 to 59 Years | 289 (53.9%) | 8 (2.8%) |
| 60 to 64 Years | 367 (44.3%) | 0 (0.0%) |
| 65 to 74 Years | 195 (16.9%) | 0 (0.0%) |
| 75 Years and over | 46 (5.4%) | 0 (0.0%) |
| Total | 3,413 (48.1%) | 171 (5.0%) |
Employment Status by Educational Attainment in Delta
According to labor force statistics for Delta, 60.8% of individuals (2,478) out of the total population between 25 and 64 years of age (4,076) are in the labor force, with 4.1% or 102 of them being unemployed. The group with the highest labor force participation rate are those with the educational attainment of bachelor's degree or higher, with 77.9% or 571 individuals in the labor force. Within the labor force, individuals with high school diploma education have the highest percentage of unemployment, with 7.3% or 77 of them being unemployed.
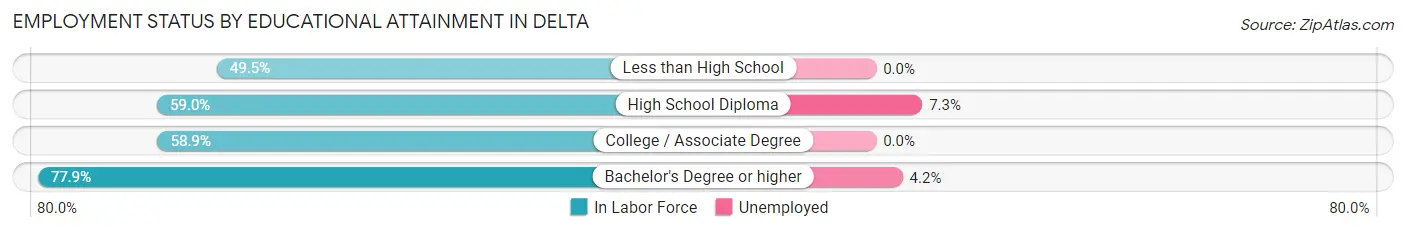
| Educational Attainment | In Labor Force | Unemployed |
| Less than High School | 330 (49.5%) | 0 (0.0%) |
| High School Diploma | 1,053 (59.0%) | 130 (7.3%) |
| College / Associate Degree | 526 (58.9%) | 0 (0.0%) |
| Bachelor's Degree or higher | 571 (77.9%) | 31 (4.2%) |
| Total | 2,478 (60.8%) | 167 (4.1%) |
Employment Occupations by Sex in Delta
Management, Business, Science and Arts Occupations
The most common Management, Business, Science and Arts occupations in Delta are Management (298 | 9.2%), Community & Social Service (256 | 7.9%), Health Diagnosing & Treating (181 | 5.6%), Education Instruction & Library (130 | 4.0%), and Health Technologists (91 | 2.8%).

Management, Business, Science and Arts Occupations by Sex
Within the Management, Business, Science and Arts occupations in Delta, the most male-oriented occupations are Architecture & Engineering (100.0%), Computers, Engineering & Science (72.3%), and Management (66.1%), while the most female-oriented occupations are Arts, Media & Entertainment (100.0%), Health Diagnosing & Treating (92.8%), and Health Technologists (85.7%).
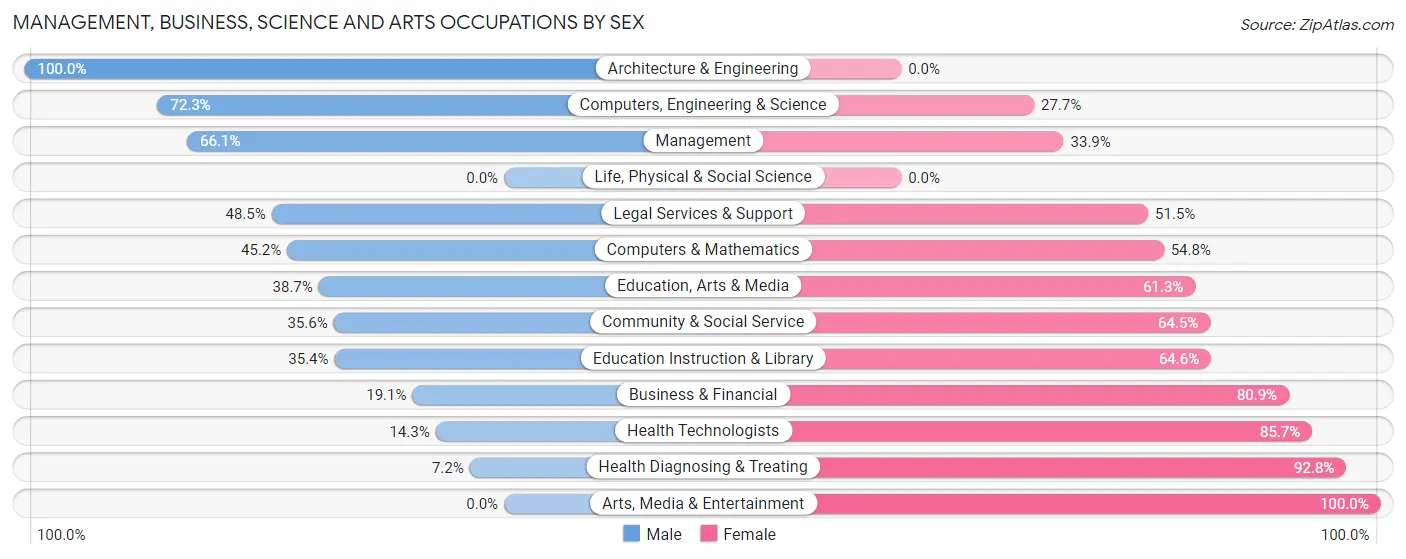
| Occupation | Male | Female |
| Management | 197 (66.1%) | 101 (33.9%) |
| Business & Financial | 13 (19.1%) | 55 (80.9%) |
| Computers, Engineering & Science | 60 (72.3%) | 23 (27.7%) |
| Computers & Mathematics | 19 (45.2%) | 23 (54.8%) |
| Architecture & Engineering | 41 (100.0%) | 0 (0.0%) |
| Life, Physical & Social Science | 0 (0.0%) | 0 (0.0%) |
| Community & Social Service | 91 (35.5%) | 165 (64.4%) |
| Education, Arts & Media | 29 (38.7%) | 46 (61.3%) |
| Legal Services & Support | 16 (48.5%) | 17 (51.5%) |
| Education Instruction & Library | 46 (35.4%) | 84 (64.6%) |
| Arts, Media & Entertainment | 0 (0.0%) | 18 (100.0%) |
| Health Diagnosing & Treating | 13 (7.2%) | 168 (92.8%) |
| Health Technologists | 13 (14.3%) | 78 (85.7%) |
| Total (Category) | 374 (42.2%) | 512 (57.8%) |
| Total (Overall) | 1,693 (52.2%) | 1,550 (47.8%) |
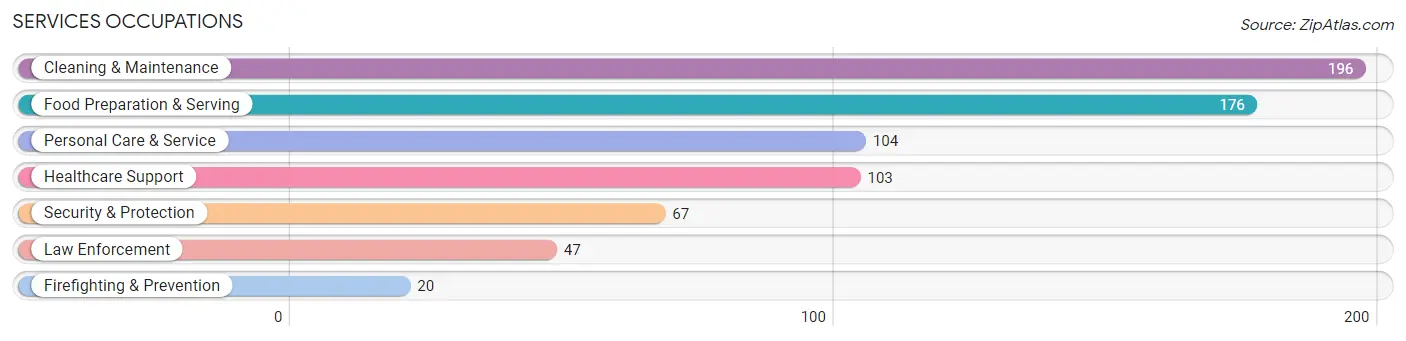
Services Occupations
The most common Services occupations in Delta are Cleaning & Maintenance (196 | 6.0%), Food Preparation & Serving (176 | 5.4%), Personal Care & Service (104 | 3.2%), Healthcare Support (103 | 3.2%), and Security & Protection (67 | 2.1%).
Services Occupations by Sex
Within the Services occupations in Delta, the most male-oriented occupations are Law Enforcement (63.8%), Security & Protection (55.2%), and Cleaning & Maintenance (38.3%), while the most female-oriented occupations are Healthcare Support (100.0%), Personal Care & Service (100.0%), and Food Preparation & Serving (88.6%).
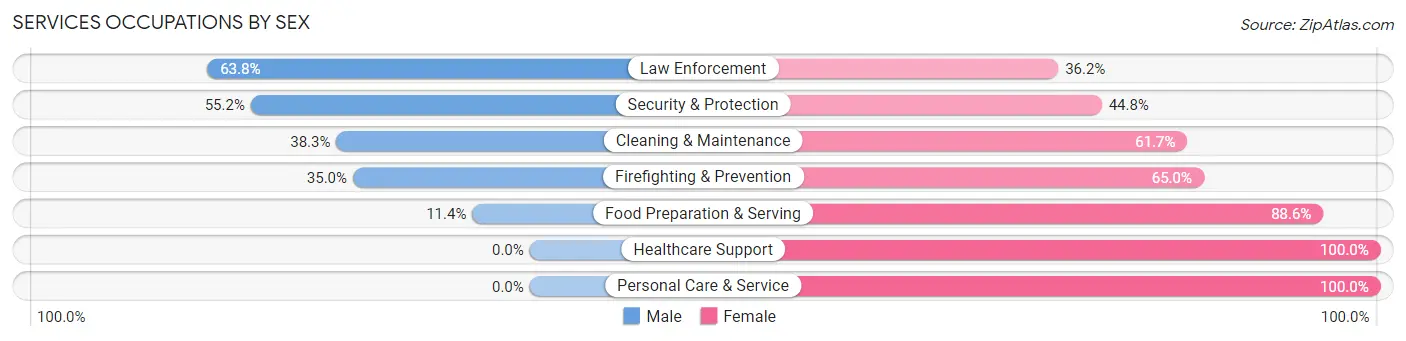
| Occupation | Male | Female |
| Healthcare Support | 0 (0.0%) | 103 (100.0%) |
| Security & Protection | 37 (55.2%) | 30 (44.8%) |
| Firefighting & Prevention | 7 (35.0%) | 13 (65.0%) |
| Law Enforcement | 30 (63.8%) | 17 (36.2%) |
| Food Preparation & Serving | 20 (11.4%) | 156 (88.6%) |
| Cleaning & Maintenance | 75 (38.3%) | 121 (61.7%) |
| Personal Care & Service | 0 (0.0%) | 104 (100.0%) |
| Total (Category) | 132 (20.4%) | 514 (79.6%) |
| Total (Overall) | 1,693 (52.2%) | 1,550 (47.8%) |
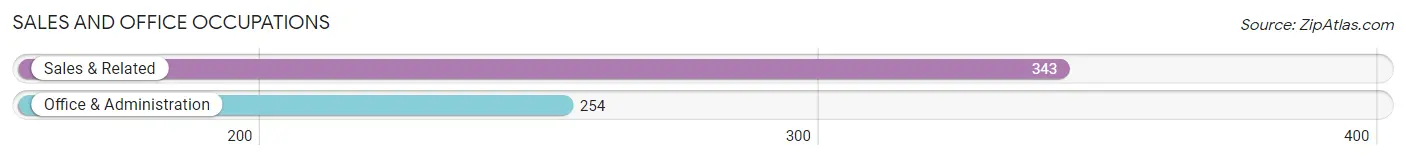
Sales and Office Occupations
The most common Sales and Office occupations in Delta are Sales & Related (343 | 10.6%), and Office & Administration (254 | 7.8%).
Sales and Office Occupations by Sex
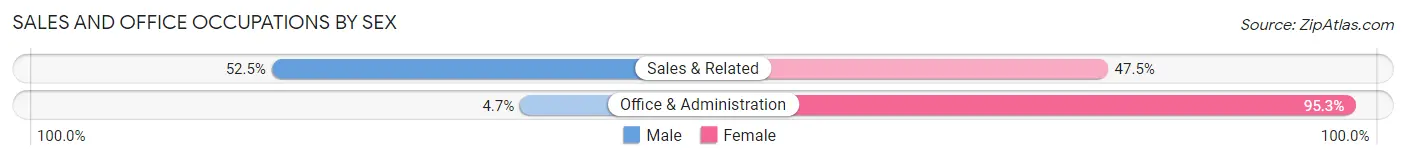
| Occupation | Male | Female |
| Sales & Related | 180 (52.5%) | 163 (47.5%) |
| Office & Administration | 12 (4.7%) | 242 (95.3%) |
| Total (Category) | 192 (32.2%) | 405 (67.8%) |
| Total (Overall) | 1,693 (52.2%) | 1,550 (47.8%) |
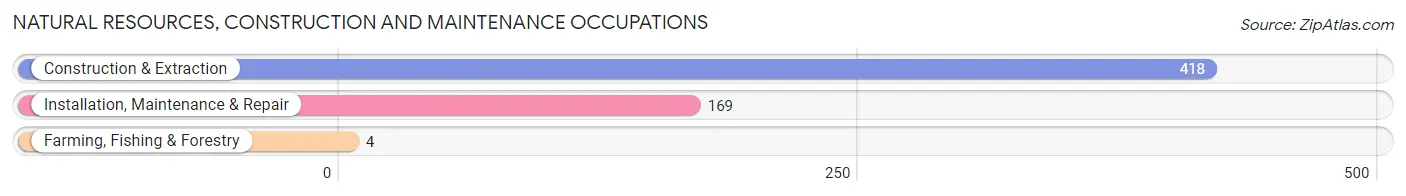
Natural Resources, Construction and Maintenance Occupations
The most common Natural Resources, Construction and Maintenance occupations in Delta are Construction & Extraction (418 | 12.9%), Installation, Maintenance & Repair (169 | 5.2%), and Farming, Fishing & Forestry (4 | 0.1%).
Natural Resources, Construction and Maintenance Occupations by Sex
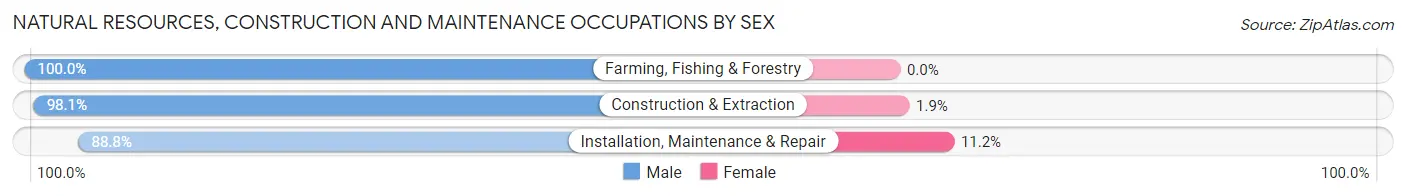
| Occupation | Male | Female |
| Farming, Fishing & Forestry | 4 (100.0%) | 0 (0.0%) |
| Construction & Extraction | 410 (98.1%) | 8 (1.9%) |
| Installation, Maintenance & Repair | 150 (88.8%) | 19 (11.2%) |
| Total (Category) | 564 (95.4%) | 27 (4.6%) |
| Total (Overall) | 1,693 (52.2%) | 1,550 (47.8%) |
Production, Transportation and Moving Occupations
The most common Production, Transportation and Moving occupations in Delta are Production (324 | 10.0%), Material Moving (107 | 3.3%), and Transportation (92 | 2.8%).
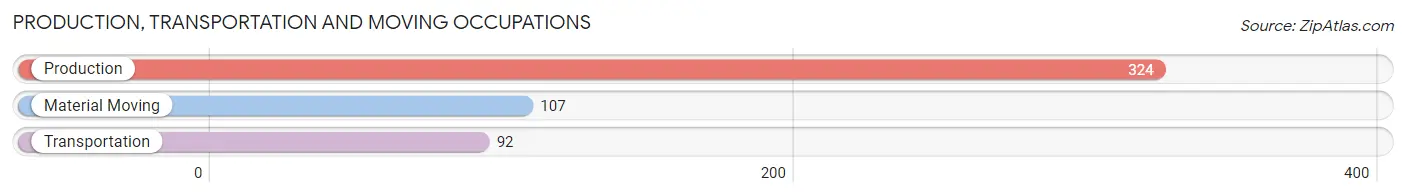
Production, Transportation and Moving Occupations by Sex
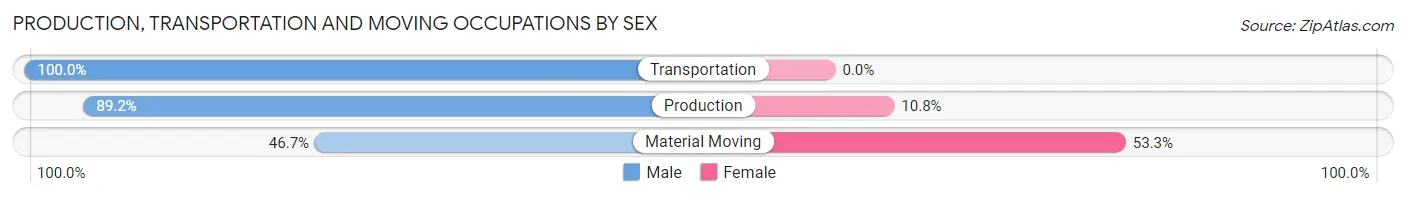
| Occupation | Male | Female |
| Production | 289 (89.2%) | 35 (10.8%) |
| Transportation | 92 (100.0%) | 0 (0.0%) |
| Material Moving | 50 (46.7%) | 57 (53.3%) |
| Total (Category) | 431 (82.4%) | 92 (17.6%) |
| Total (Overall) | 1,693 (52.2%) | 1,550 (47.8%) |
Employment Industries by Sex in Delta
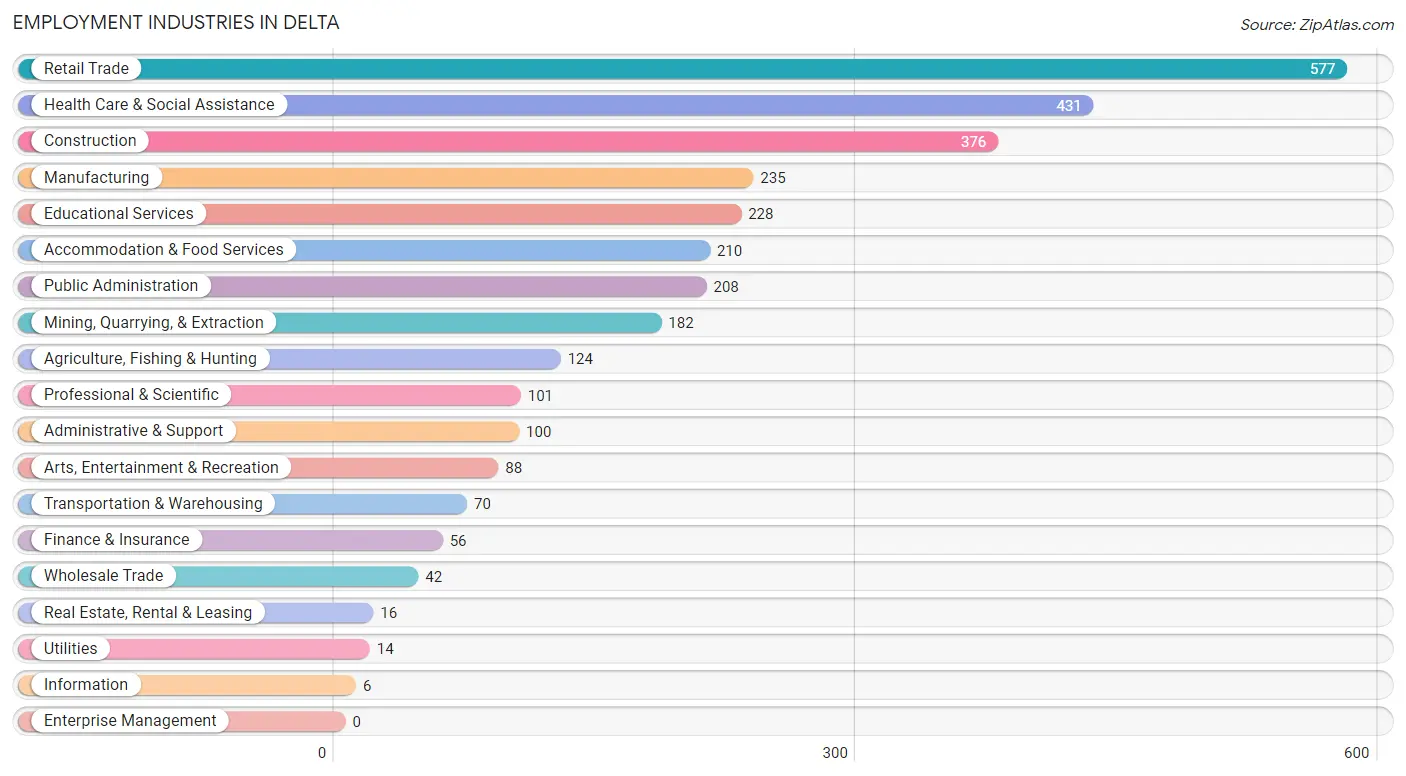
Employment Industries in Delta
The major employment industries in Delta include Retail Trade (577 | 17.8%), Health Care & Social Assistance (431 | 13.3%), Construction (376 | 11.6%), Manufacturing (235 | 7.2%), and Educational Services (228 | 7.0%).
Employment Industries by Sex in Delta
The Delta industries that see more men than women are Wholesale Trade (100.0%), Construction (93.9%), and Manufacturing (82.1%), whereas the industries that tend to have a higher number of women are Utilities (100.0%), Information (100.0%), and Real Estate, Rental & Leasing (100.0%).
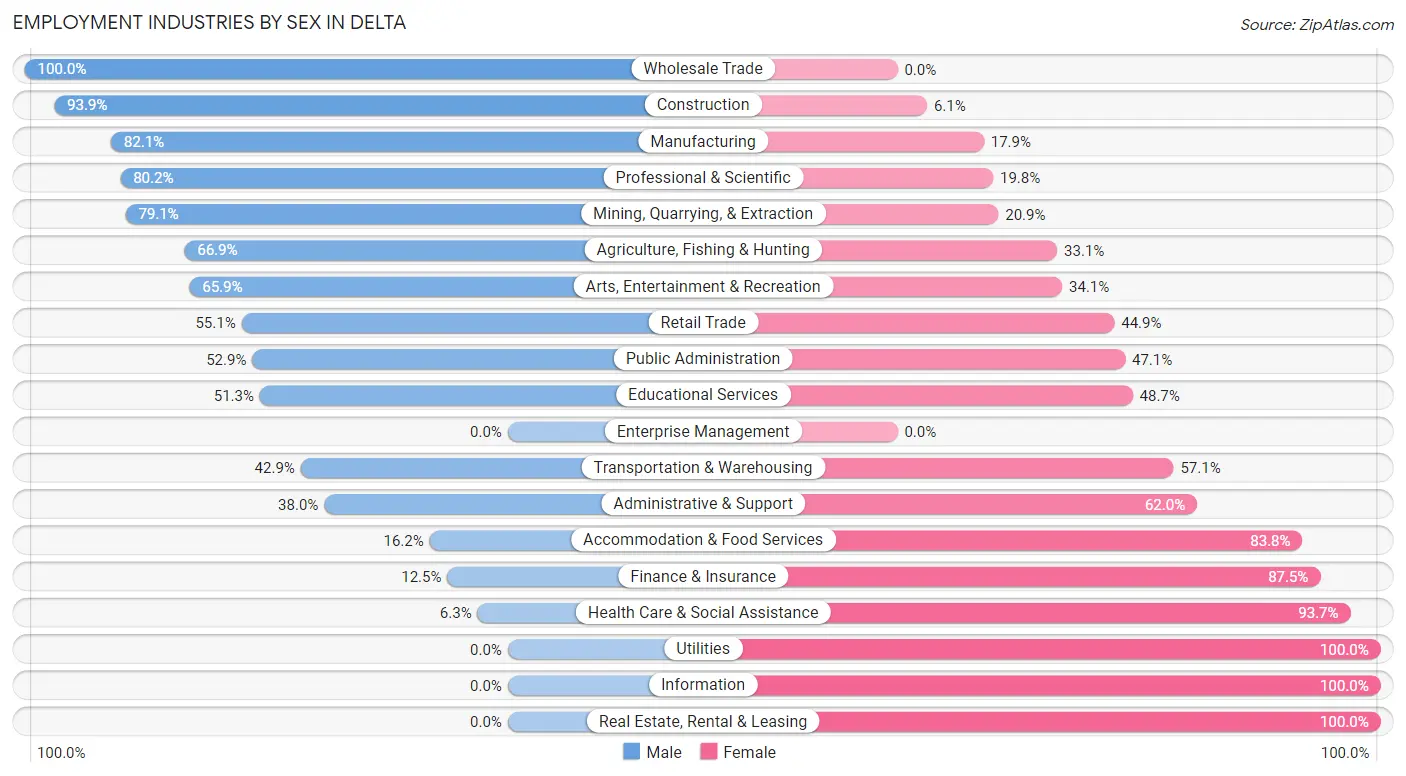
| Industry | Male | Female |
| Agriculture, Fishing & Hunting | 83 (66.9%) | 41 (33.1%) |
| Mining, Quarrying, & Extraction | 144 (79.1%) | 38 (20.9%) |
| Construction | 353 (93.9%) | 23 (6.1%) |
| Manufacturing | 193 (82.1%) | 42 (17.9%) |
| Wholesale Trade | 42 (100.0%) | 0 (0.0%) |
| Retail Trade | 318 (55.1%) | 259 (44.9%) |
| Transportation & Warehousing | 30 (42.9%) | 40 (57.1%) |
| Utilities | 0 (0.0%) | 14 (100.0%) |
| Information | 0 (0.0%) | 6 (100.0%) |
| Finance & Insurance | 7 (12.5%) | 49 (87.5%) |
| Real Estate, Rental & Leasing | 0 (0.0%) | 16 (100.0%) |
| Professional & Scientific | 81 (80.2%) | 20 (19.8%) |
| Enterprise Management | 0 (0.0%) | 0 (0.0%) |
| Administrative & Support | 38 (38.0%) | 62 (62.0%) |
| Educational Services | 117 (51.3%) | 111 (48.7%) |
| Health Care & Social Assistance | 27 (6.3%) | 404 (93.7%) |
| Arts, Entertainment & Recreation | 58 (65.9%) | 30 (34.1%) |
| Accommodation & Food Services | 34 (16.2%) | 176 (83.8%) |
| Public Administration | 110 (52.9%) | 98 (47.1%) |
| Total | 1,693 (52.2%) | 1,550 (47.8%) |
Education in Delta
School Enrollment in Delta
The most common levels of schooling among the 2,087 students in Delta are elementary school (723 | 34.6%), middle school (599 | 28.7%), and high school (400 | 19.2%).
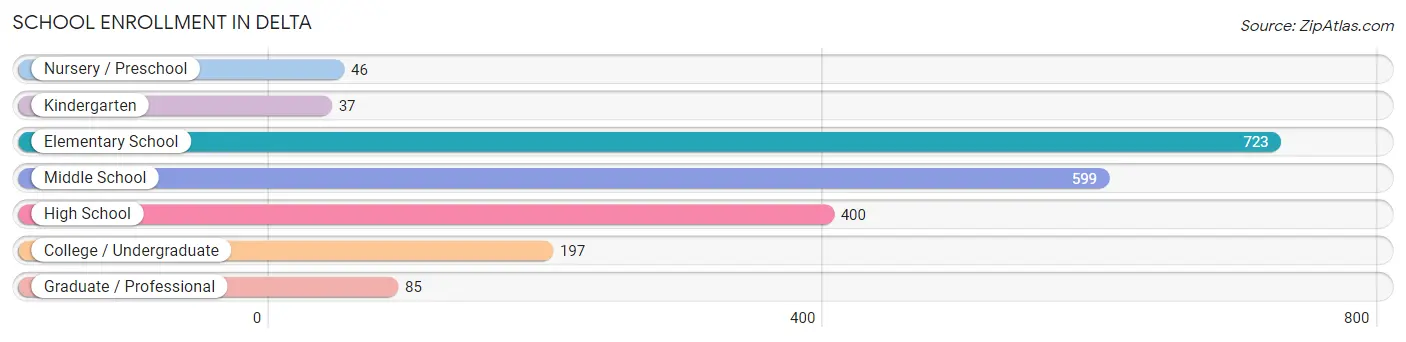
| School Level | # Students | % Students |
| Nursery / Preschool | 46 | 2.2% |
| Kindergarten | 37 | 1.8% |
| Elementary School | 723 | 34.6% |
| Middle School | 599 | 28.7% |
| High School | 400 | 19.2% |
| College / Undergraduate | 197 | 9.4% |
| Graduate / Professional | 85 | 4.1% |
| Total | 2,087 | 100.0% |
School Enrollment by Age by Funding Source in Delta
Out of a total of 2,087 students who are enrolled in schools in Delta, 202 (9.7%) attend a private institution, while the remaining 1,885 (90.3%) are enrolled in public schools. The age group of 3 to 4 year olds has the highest likelihood of being enrolled in private schools, with 13 (36.1% in the age bracket) enrolled. Conversely, the age group of 18 to 19 year olds has the lowest likelihood of being enrolled in a private school, with 54 (100.0% in the age bracket) attending a public institution.
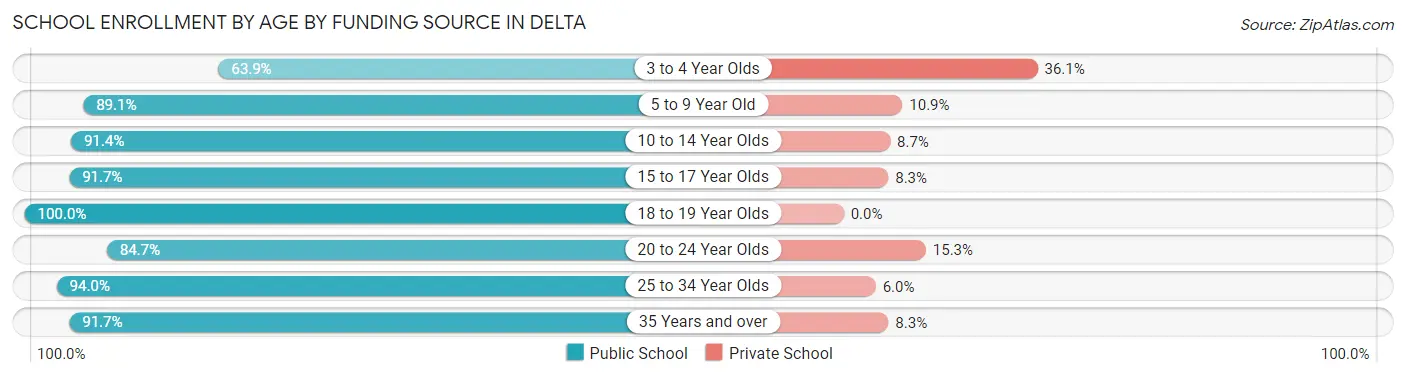
| Age Bracket | Public School | Private School |
| 3 to 4 Year Olds | 23 (63.9%) | 13 (36.1%) |
| 5 to 9 Year Old | 505 (89.1%) | 62 (10.9%) |
| 10 to 14 Year Olds | 760 (91.3%) | 72 (8.6%) |
| 15 to 17 Year Olds | 309 (91.7%) | 28 (8.3%) |
| 18 to 19 Year Olds | 54 (100.0%) | 0 (0.0%) |
| 20 to 24 Year Olds | 83 (84.7%) | 15 (15.3%) |
| 25 to 34 Year Olds | 63 (94.0%) | 4 (6.0%) |
| 35 Years and over | 88 (91.7%) | 8 (8.3%) |
| Total | 1,885 (90.3%) | 202 (9.7%) |
Educational Attainment by Field of Study in Delta
Education (234 | 21.1%), bio, nature & agricultural (160 | 14.4%), science & technology (137 | 12.3%), business (131 | 11.8%), and liberal arts & history (112 | 10.1%) are the most common fields of study among 1,111 individuals in Delta who have obtained a bachelor's degree or higher.
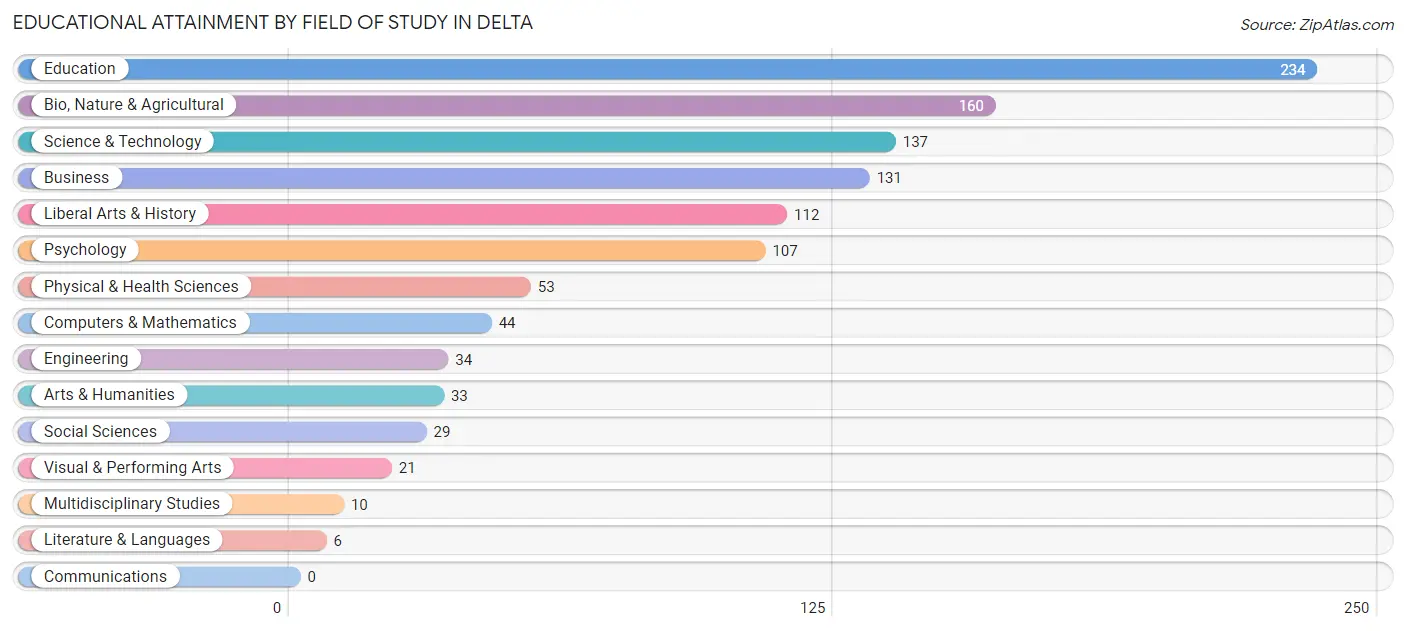
| Field of Study | # Graduates | % Graduates |
| Computers & Mathematics | 44 | 4.0% |
| Bio, Nature & Agricultural | 160 | 14.4% |
| Physical & Health Sciences | 53 | 4.8% |
| Psychology | 107 | 9.6% |
| Social Sciences | 29 | 2.6% |
| Engineering | 34 | 3.1% |
| Multidisciplinary Studies | 10 | 0.9% |
| Science & Technology | 137 | 12.3% |
| Business | 131 | 11.8% |
| Education | 234 | 21.1% |
| Literature & Languages | 6 | 0.5% |
| Liberal Arts & History | 112 | 10.1% |
| Visual & Performing Arts | 21 | 1.9% |
| Communications | 0 | 0.0% |
| Arts & Humanities | 33 | 3.0% |
| Total | 1,111 | 100.0% |
Transportation & Commute in Delta
Vehicle Availability by Sex in Delta
The most prevalent vehicle ownership categories in Delta are males with 3 vehicles (632, accounting for 38.7%) and females with 3 vehicles (405, making up 41.7%).
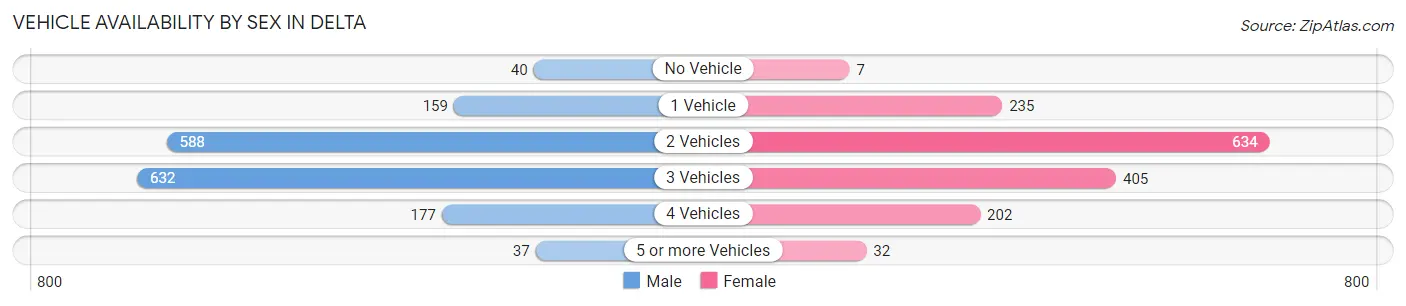
| Vehicles Available | Male | Female |
| No Vehicle | 40 (2.5%) | 7 (0.5%) |
| 1 Vehicle | 159 (9.7%) | 235 (15.5%) |
| 2 Vehicles | 588 (36.0%) | 634 (41.8%) |
| 3 Vehicles | 632 (38.7%) | 405 (26.7%) |
| 4 Vehicles | 177 (10.8%) | 202 (13.3%) |
| 5 or more Vehicles | 37 (2.3%) | 32 (2.1%) |
| Total | 1,633 (100.0%) | 1,515 (100.0%) |
Commute Time in Delta
The most frequently occuring commute durations in Delta are 5 to 9 minutes (798 commuters, 26.7%), 10 to 14 minutes (560 commuters, 18.8%), and 30 to 34 minutes (303 commuters, 10.2%).
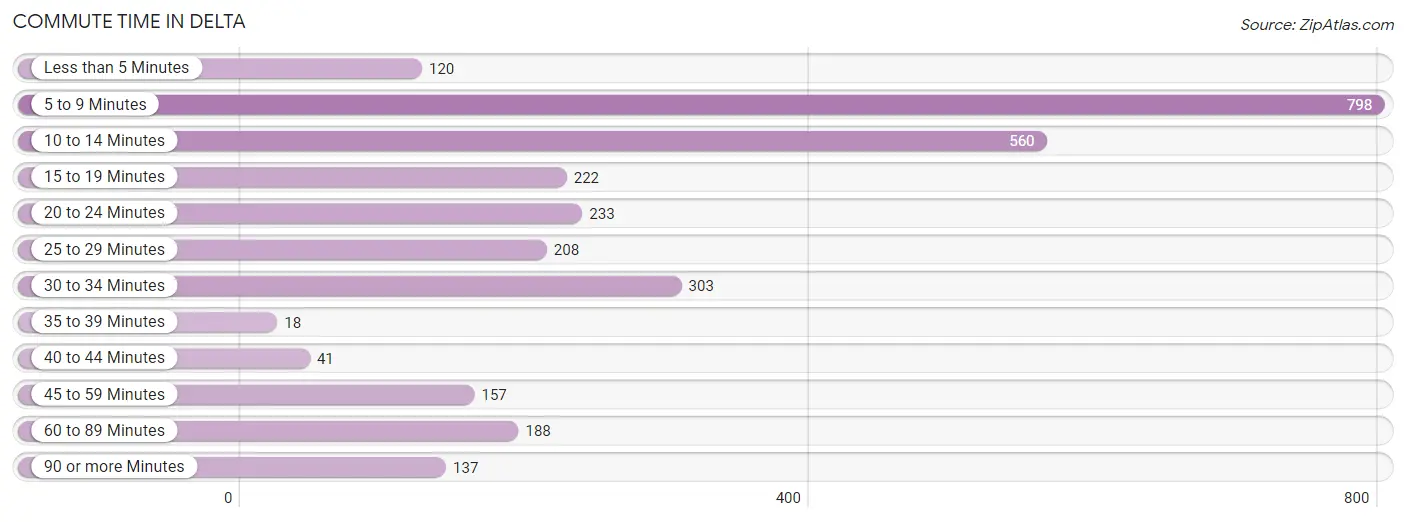
| Commute Time | # Commuters | % Commuters |
| Less than 5 Minutes | 120 | 4.0% |
| 5 to 9 Minutes | 798 | 26.7% |
| 10 to 14 Minutes | 560 | 18.8% |
| 15 to 19 Minutes | 222 | 7.4% |
| 20 to 24 Minutes | 233 | 7.8% |
| 25 to 29 Minutes | 208 | 7.0% |
| 30 to 34 Minutes | 303 | 10.2% |
| 35 to 39 Minutes | 18 | 0.6% |
| 40 to 44 Minutes | 41 | 1.4% |
| 45 to 59 Minutes | 157 | 5.3% |
| 60 to 89 Minutes | 188 | 6.3% |
| 90 or more Minutes | 137 | 4.6% |
Commute Time by Sex in Delta
The most common commute times in Delta are 5 to 9 minutes (247 commuters, 16.3%) for males and 5 to 9 minutes (551 commuters, 37.6%) for females.
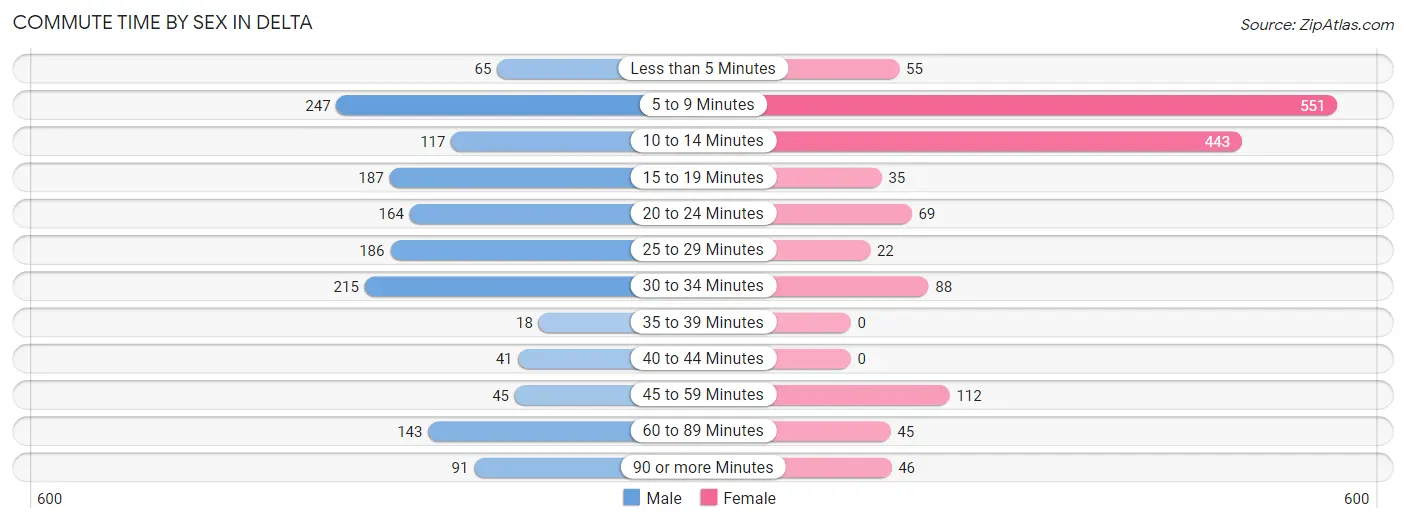
| Commute Time | Male | Female |
| Less than 5 Minutes | 65 (4.3%) | 55 (3.7%) |
| 5 to 9 Minutes | 247 (16.3%) | 551 (37.6%) |
| 10 to 14 Minutes | 117 (7.7%) | 443 (30.2%) |
| 15 to 19 Minutes | 187 (12.3%) | 35 (2.4%) |
| 20 to 24 Minutes | 164 (10.8%) | 69 (4.7%) |
| 25 to 29 Minutes | 186 (12.2%) | 22 (1.5%) |
| 30 to 34 Minutes | 215 (14.1%) | 88 (6.0%) |
| 35 to 39 Minutes | 18 (1.2%) | 0 (0.0%) |
| 40 to 44 Minutes | 41 (2.7%) | 0 (0.0%) |
| 45 to 59 Minutes | 45 (3.0%) | 112 (7.6%) |
| 60 to 89 Minutes | 143 (9.4%) | 45 (3.1%) |
| 90 or more Minutes | 91 (6.0%) | 46 (3.1%) |
Time of Departure to Work by Sex in Delta
The most frequent times of departure to work in Delta are 12:00 AM to 4:59 AM (379, 24.9%) for males and 7:30 AM to 7:59 AM (353, 24.1%) for females.
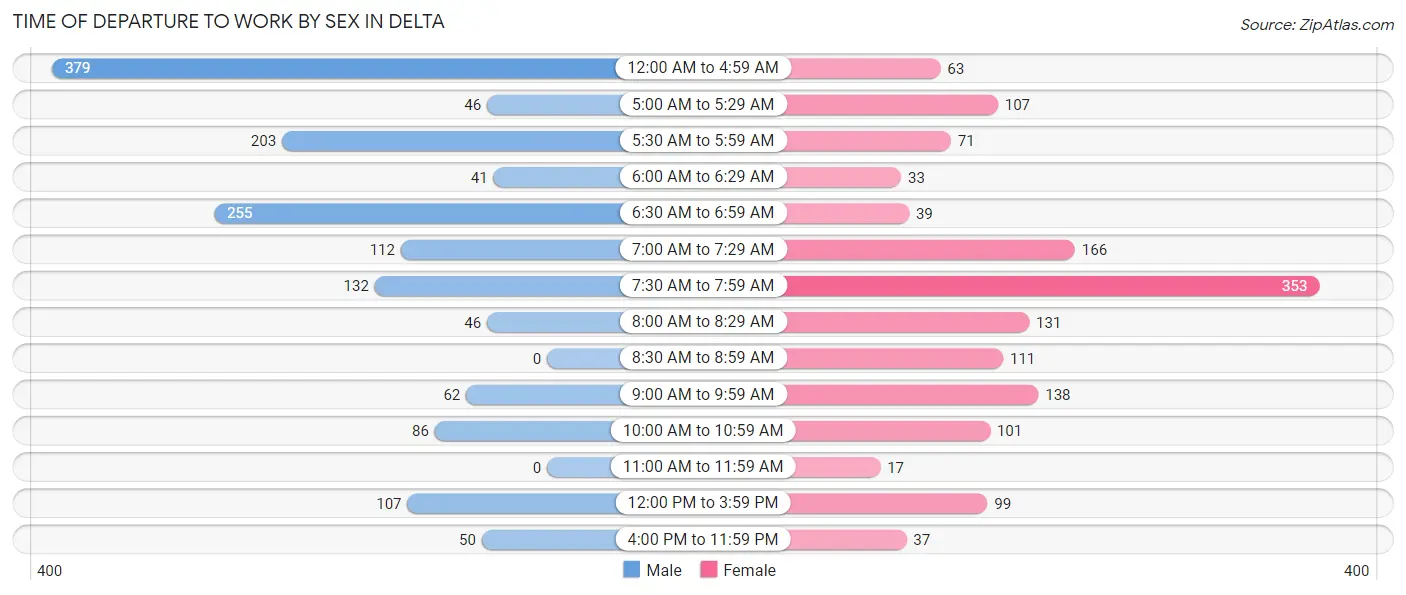
| Time of Departure | Male | Female |
| 12:00 AM to 4:59 AM | 379 (24.9%) | 63 (4.3%) |
| 5:00 AM to 5:29 AM | 46 (3.0%) | 107 (7.3%) |
| 5:30 AM to 5:59 AM | 203 (13.4%) | 71 (4.8%) |
| 6:00 AM to 6:29 AM | 41 (2.7%) | 33 (2.2%) |
| 6:30 AM to 6:59 AM | 255 (16.8%) | 39 (2.7%) |
| 7:00 AM to 7:29 AM | 112 (7.4%) | 166 (11.3%) |
| 7:30 AM to 7:59 AM | 132 (8.7%) | 353 (24.1%) |
| 8:00 AM to 8:29 AM | 46 (3.0%) | 131 (8.9%) |
| 8:30 AM to 8:59 AM | 0 (0.0%) | 111 (7.6%) |
| 9:00 AM to 9:59 AM | 62 (4.1%) | 138 (9.4%) |
| 10:00 AM to 10:59 AM | 86 (5.7%) | 101 (6.9%) |
| 11:00 AM to 11:59 AM | 0 (0.0%) | 17 (1.2%) |
| 12:00 PM to 3:59 PM | 107 (7.0%) | 99 (6.8%) |
| 4:00 PM to 11:59 PM | 50 (3.3%) | 37 (2.5%) |
| Total | 1,519 (100.0%) | 1,466 (100.0%) |
Housing Occupancy in Delta
Occupancy by Ownership in Delta
Of the total 3,394 dwellings in Delta, owner-occupied units account for 2,134 (62.9%), while renter-occupied units make up 1,260 (37.1%).
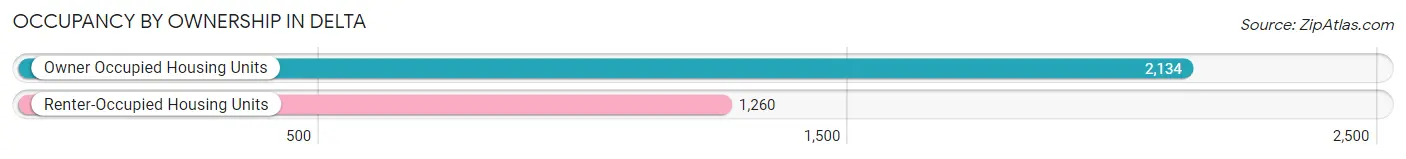
| Occupancy | # Housing Units | % Housing Units |
| Owner Occupied Housing Units | 2,134 | 62.9% |
| Renter-Occupied Housing Units | 1,260 | 37.1% |
| Total Occupied Housing Units | 3,394 | 100.0% |
Occupancy by Household Size in Delta
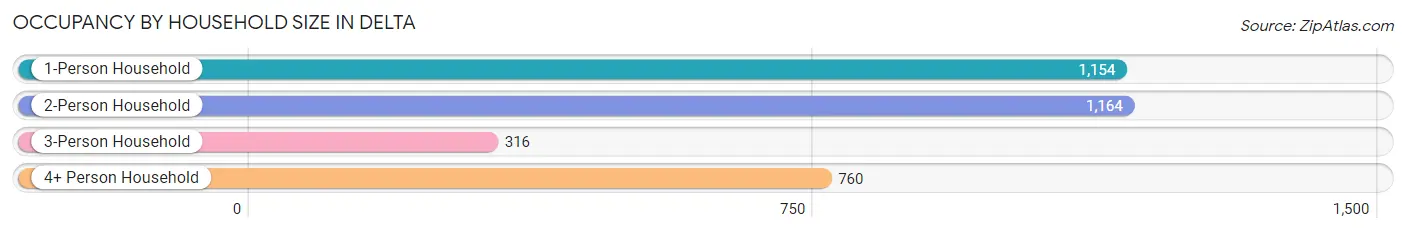
| Household Size | # Housing Units | % Housing Units |
| 1-Person Household | 1,154 | 34.0% |
| 2-Person Household | 1,164 | 34.3% |
| 3-Person Household | 316 | 9.3% |
| 4+ Person Household | 760 | 22.4% |
| Total Housing Units | 3,394 | 100.0% |
Occupancy by Ownership by Household Size in Delta
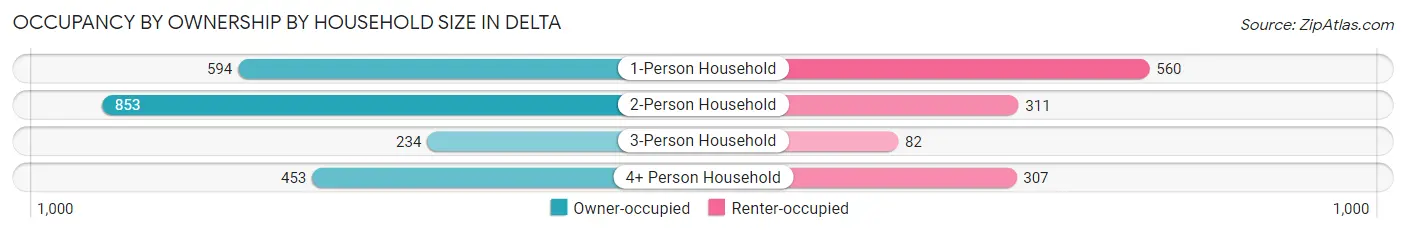
| Household Size | Owner-occupied | Renter-occupied |
| 1-Person Household | 594 (51.5%) | 560 (48.5%) |
| 2-Person Household | 853 (73.3%) | 311 (26.7%) |
| 3-Person Household | 234 (74.1%) | 82 (26.0%) |
| 4+ Person Household | 453 (59.6%) | 307 (40.4%) |
| Total Housing Units | 2,134 (62.9%) | 1,260 (37.1%) |
Occupancy by Educational Attainment in Delta
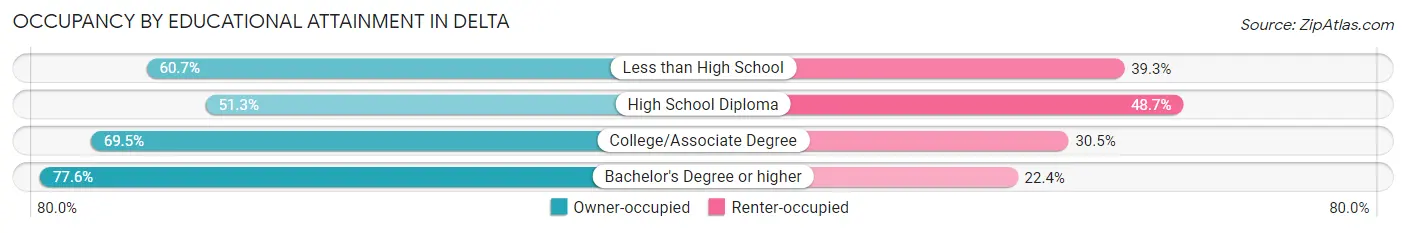
| Household Size | Owner-occupied | Renter-occupied |
| Less than High School | 293 (60.7%) | 190 (39.3%) |
| High School Diploma | 673 (51.3%) | 639 (48.7%) |
| College/Associate Degree | 622 (69.5%) | 273 (30.5%) |
| Bachelor's Degree or higher | 546 (77.6%) | 158 (22.4%) |
Occupancy by Age of Householder in Delta
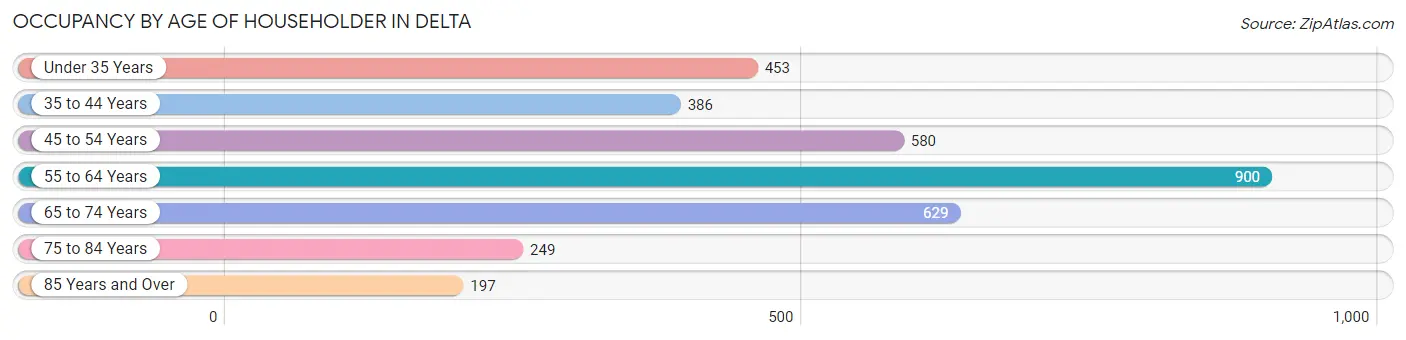
| Age Bracket | # Households | % Households |
| Under 35 Years | 453 | 13.4% |
| 35 to 44 Years | 386 | 11.4% |
| 45 to 54 Years | 580 | 17.1% |
| 55 to 64 Years | 900 | 26.5% |
| 65 to 74 Years | 629 | 18.5% |
| 75 to 84 Years | 249 | 7.3% |
| 85 Years and Over | 197 | 5.8% |
| Total | 3,394 | 100.0% |
Housing Finances in Delta
Median Income by Occupancy in Delta
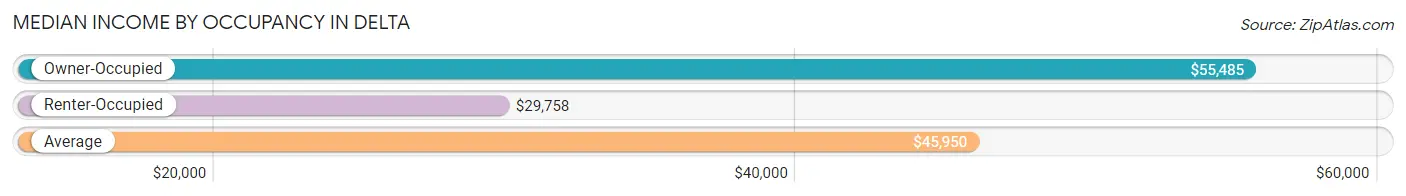
| Occupancy Type | # Households | Median Income |
| Owner-Occupied | 2,134 (62.9%) | $55,485 |
| Renter-Occupied | 1,260 (37.1%) | $29,758 |
| Average | 3,394 (100.0%) | $45,950 |
Occupancy by Householder Income Bracket in Delta
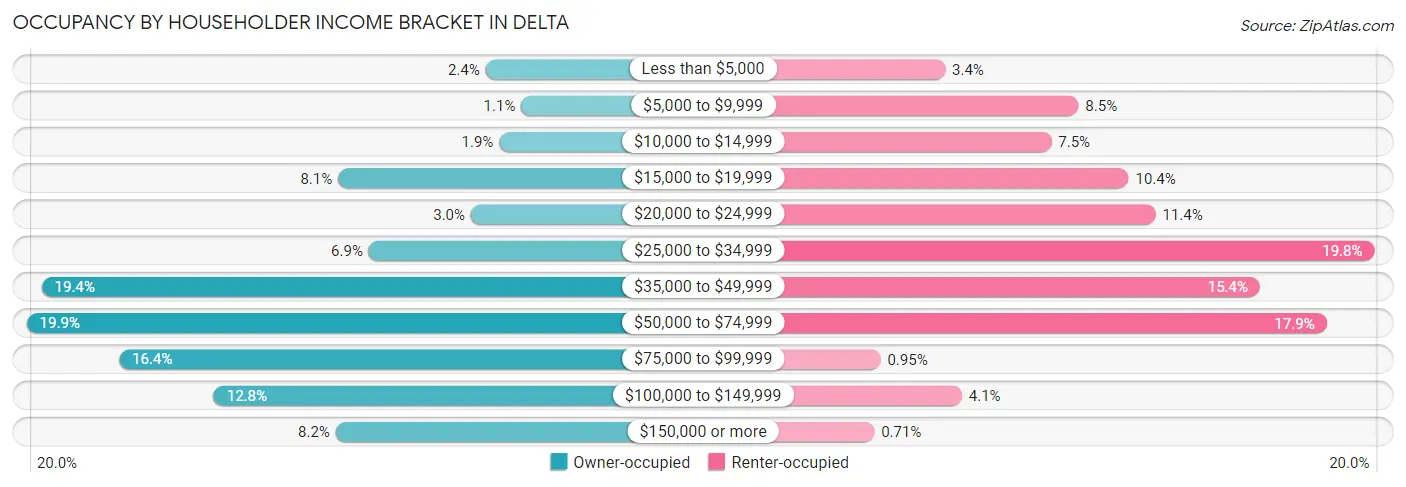
| Income Bracket | Owner-occupied | Renter-occupied |
| Less than $5,000 | 52 (2.4%) | 43 (3.4%) |
| $5,000 to $9,999 | 23 (1.1%) | 107 (8.5%) |
| $10,000 to $14,999 | 41 (1.9%) | 94 (7.5%) |
| $15,000 to $19,999 | 172 (8.1%) | 131 (10.4%) |
| $20,000 to $24,999 | 64 (3.0%) | 144 (11.4%) |
| $25,000 to $34,999 | 147 (6.9%) | 249 (19.8%) |
| $35,000 to $49,999 | 413 (19.4%) | 194 (15.4%) |
| $50,000 to $74,999 | 425 (19.9%) | 226 (17.9%) |
| $75,000 to $99,999 | 350 (16.4%) | 12 (0.9%) |
| $100,000 to $149,999 | 273 (12.8%) | 51 (4.1%) |
| $150,000 or more | 174 (8.2%) | 9 (0.7%) |
| Total | 2,134 (100.0%) | 1,260 (100.0%) |
Monthly Housing Cost Tiers in Delta
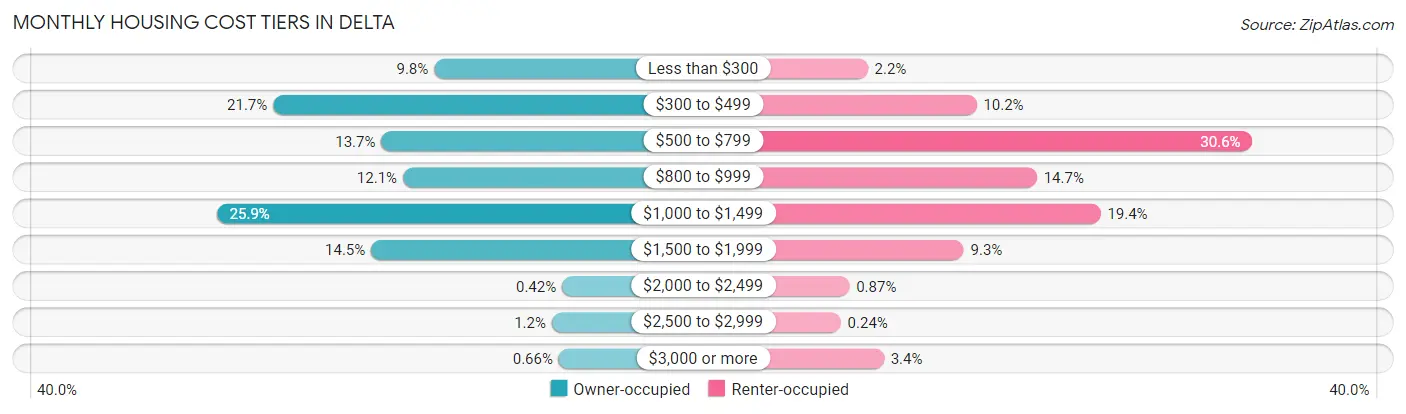
| Monthly Cost | Owner-occupied | Renter-occupied |
| Less than $300 | 210 (9.8%) | 28 (2.2%) |
| $300 to $499 | 463 (21.7%) | 129 (10.2%) |
| $500 to $799 | 293 (13.7%) | 385 (30.6%) |
| $800 to $999 | 259 (12.1%) | 185 (14.7%) |
| $1,000 to $1,499 | 552 (25.9%) | 244 (19.4%) |
| $1,500 to $1,999 | 309 (14.5%) | 117 (9.3%) |
| $2,000 to $2,499 | 9 (0.4%) | 11 (0.9%) |
| $2,500 to $2,999 | 25 (1.2%) | 3 (0.2%) |
| $3,000 or more | 14 (0.7%) | 43 (3.4%) |
| Total | 2,134 (100.0%) | 1,260 (100.0%) |
Physical Housing Characteristics in Delta
Housing Structures in Delta
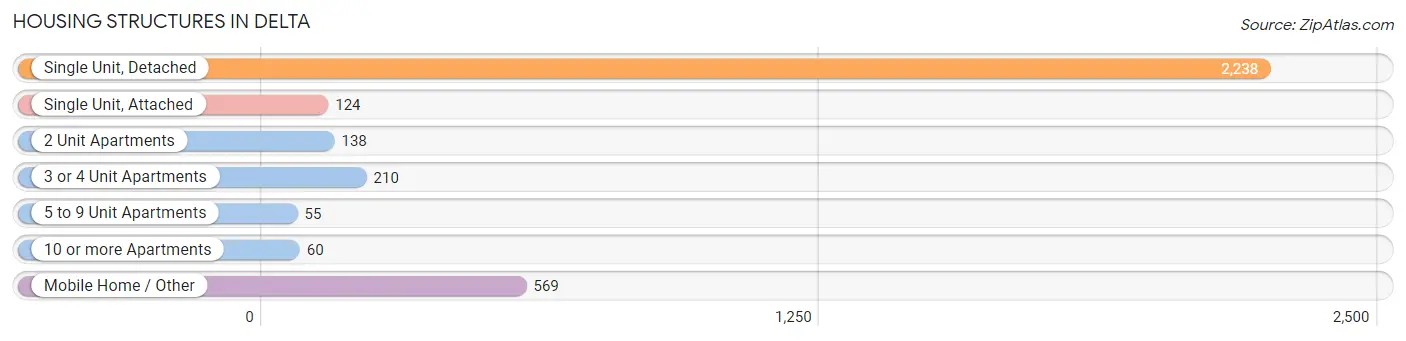
| Structure Type | # Housing Units | % Housing Units |
| Single Unit, Detached | 2,238 | 65.9% |
| Single Unit, Attached | 124 | 3.6% |
| 2 Unit Apartments | 138 | 4.1% |
| 3 or 4 Unit Apartments | 210 | 6.2% |
| 5 to 9 Unit Apartments | 55 | 1.6% |
| 10 or more Apartments | 60 | 1.8% |
| Mobile Home / Other | 569 | 16.8% |
| Total | 3,394 | 100.0% |
Housing Structures by Occupancy in Delta
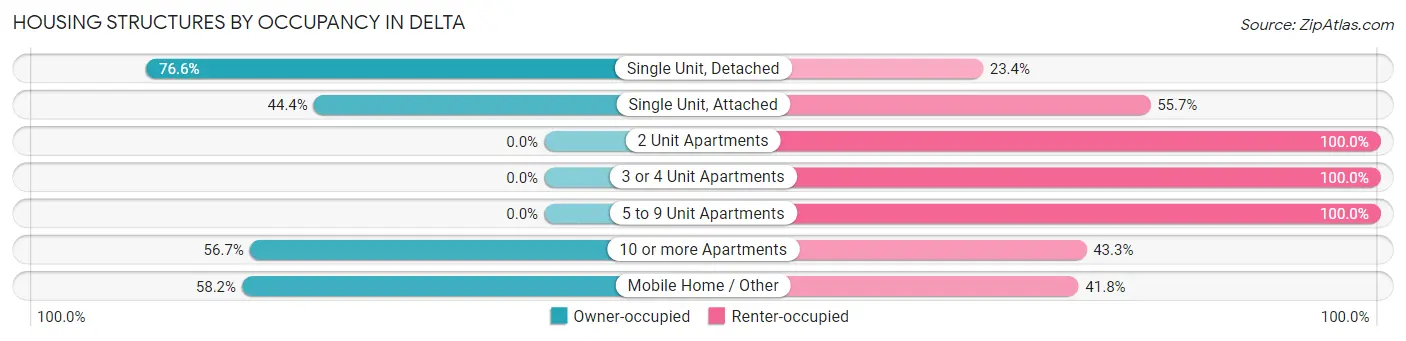
| Structure Type | Owner-occupied | Renter-occupied |
| Single Unit, Detached | 1,714 (76.6%) | 524 (23.4%) |
| Single Unit, Attached | 55 (44.4%) | 69 (55.6%) |
| 2 Unit Apartments | 0 (0.0%) | 138 (100.0%) |
| 3 or 4 Unit Apartments | 0 (0.0%) | 210 (100.0%) |
| 5 to 9 Unit Apartments | 0 (0.0%) | 55 (100.0%) |
| 10 or more Apartments | 34 (56.7%) | 26 (43.3%) |
| Mobile Home / Other | 331 (58.2%) | 238 (41.8%) |
| Total | 2,134 (62.9%) | 1,260 (37.1%) |
Housing Structures by Number of Rooms in Delta
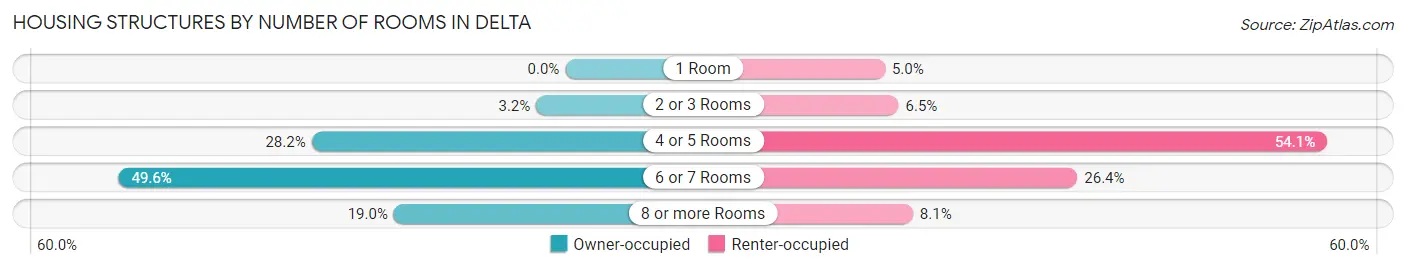
| Number of Rooms | Owner-occupied | Renter-occupied |
| 1 Room | 0 (0.0%) | 63 (5.0%) |
| 2 or 3 Rooms | 69 (3.2%) | 82 (6.5%) |
| 4 or 5 Rooms | 601 (28.2%) | 681 (54.0%) |
| 6 or 7 Rooms | 1,058 (49.6%) | 332 (26.4%) |
| 8 or more Rooms | 406 (19.0%) | 102 (8.1%) |
| Total | 2,134 (100.0%) | 1,260 (100.0%) |
Housing Structure by Heating Type in Delta
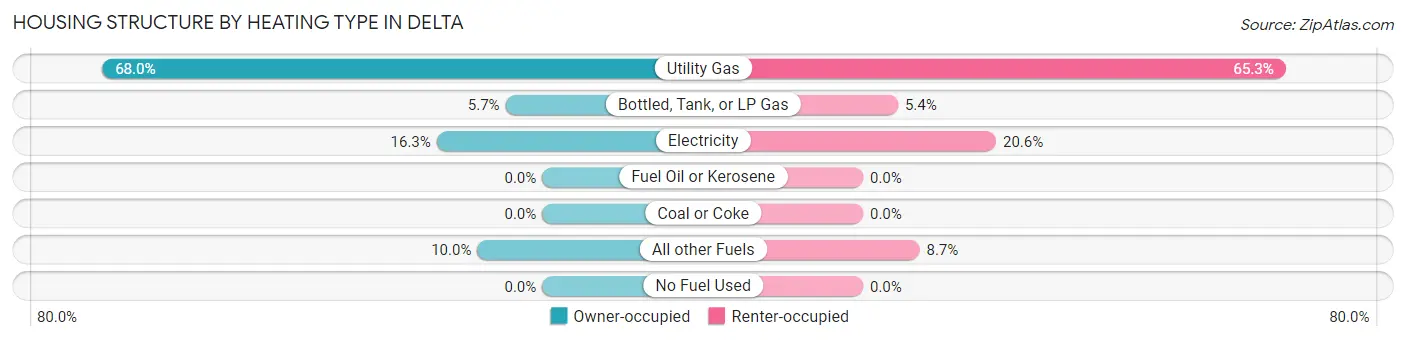
| Heating Type | Owner-occupied | Renter-occupied |
| Utility Gas | 1,451 (68.0%) | 823 (65.3%) |
| Bottled, Tank, or LP Gas | 121 (5.7%) | 68 (5.4%) |
| Electricity | 348 (16.3%) | 259 (20.6%) |
| Fuel Oil or Kerosene | 0 (0.0%) | 0 (0.0%) |
| Coal or Coke | 0 (0.0%) | 0 (0.0%) |
| All other Fuels | 214 (10.0%) | 110 (8.7%) |
| No Fuel Used | 0 (0.0%) | 0 (0.0%) |
| Total | 2,134 (100.0%) | 1,260 (100.0%) |
Household Vehicle Usage in Delta
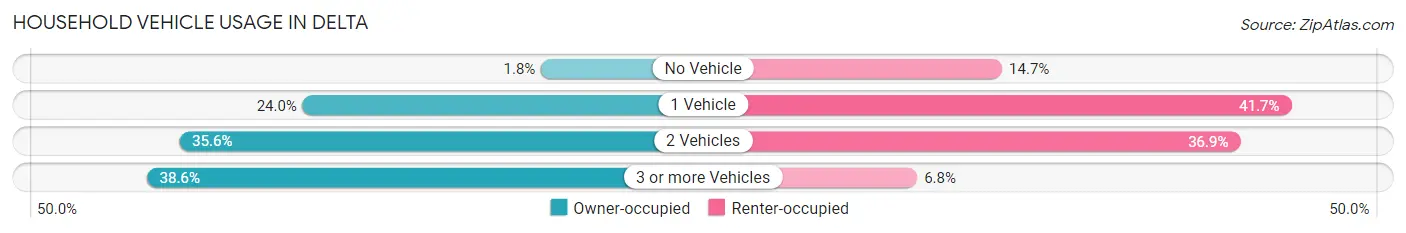
| Vehicles per Household | Owner-occupied | Renter-occupied |
| No Vehicle | 38 (1.8%) | 185 (14.7%) |
| 1 Vehicle | 513 (24.0%) | 525 (41.7%) |
| 2 Vehicles | 759 (35.6%) | 465 (36.9%) |
| 3 or more Vehicles | 824 (38.6%) | 85 (6.8%) |
| Total | 2,134 (100.0%) | 1,260 (100.0%) |
Real Estate & Mortgages in Delta
Real Estate and Mortgage Overview in Delta
| Characteristic | Without Mortgage | With Mortgage |
| Housing Units | 863 | 1,271 |
| Median Property Value | $249,800 | $210,100 |
| Median Household Income | $46,928 | $136 |
| Monthly Housing Costs | $383 | $14 |
| Real Estate Taxes | $636 | $0 |
Property Value by Mortgage Status in Delta
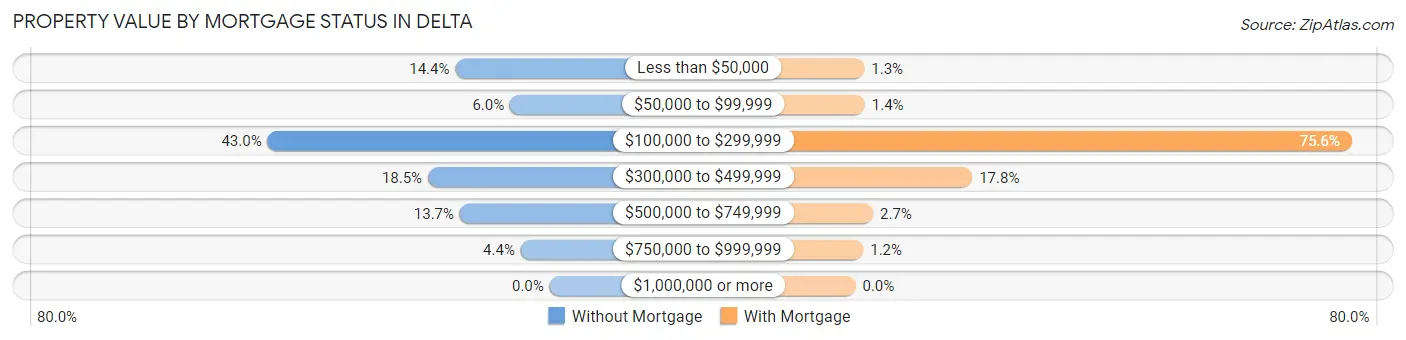
| Property Value | Without Mortgage | With Mortgage |
| Less than $50,000 | 124 (14.4%) | 17 (1.3%) |
| $50,000 to $99,999 | 52 (6.0%) | 18 (1.4%) |
| $100,000 to $299,999 | 371 (43.0%) | 961 (75.6%) |
| $300,000 to $499,999 | 160 (18.5%) | 226 (17.8%) |
| $500,000 to $749,999 | 118 (13.7%) | 34 (2.7%) |
| $750,000 to $999,999 | 38 (4.4%) | 15 (1.2%) |
| $1,000,000 or more | 0 (0.0%) | 0 (0.0%) |
| Total | 863 (100.0%) | 1,271 (100.0%) |
Household Income by Mortgage Status in Delta
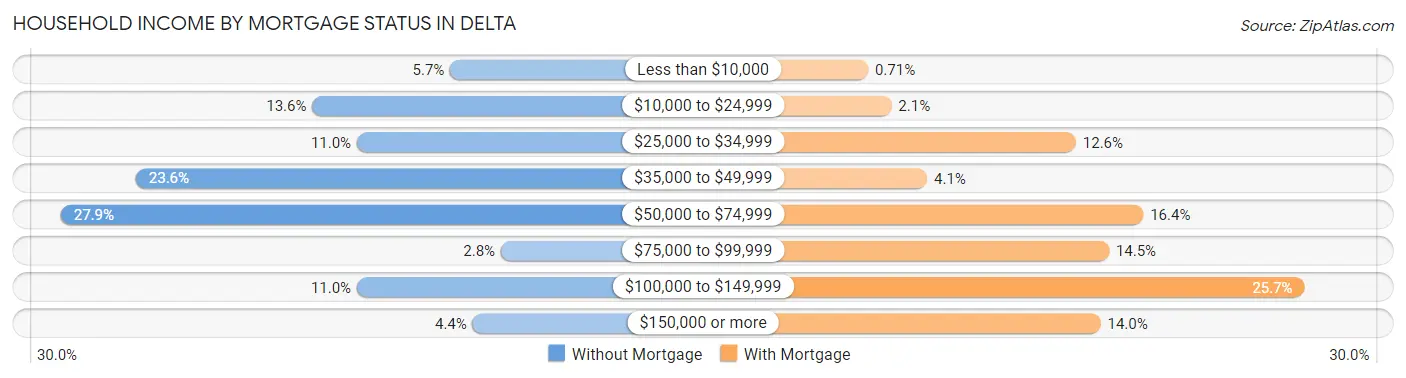
| Household Income | Without Mortgage | With Mortgage |
| Less than $10,000 | 49 (5.7%) | 9 (0.7%) |
| $10,000 to $24,999 | 117 (13.6%) | 26 (2.1%) |
| $25,000 to $34,999 | 95 (11.0%) | 160 (12.6%) |
| $35,000 to $49,999 | 204 (23.6%) | 52 (4.1%) |
| $50,000 to $74,999 | 241 (27.9%) | 209 (16.4%) |
| $75,000 to $99,999 | 24 (2.8%) | 184 (14.5%) |
| $100,000 to $149,999 | 95 (11.0%) | 326 (25.7%) |
| $150,000 or more | 38 (4.4%) | 178 (14.0%) |
| Total | 863 (100.0%) | 1,271 (100.0%) |
Property Value to Household Income Ratio in Delta
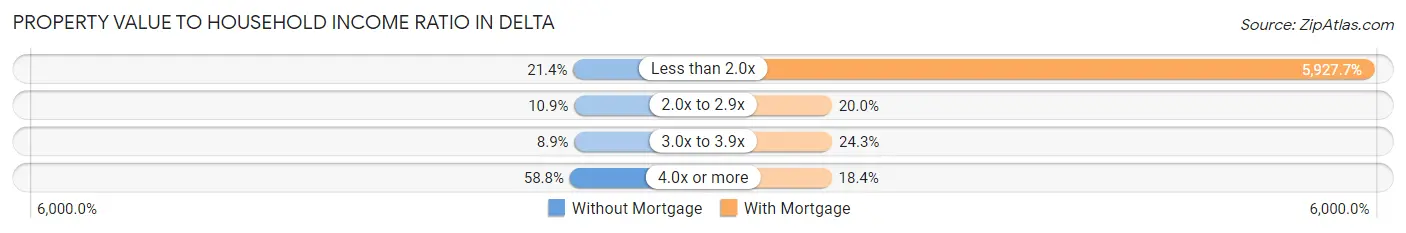
| Value-to-Income Ratio | Without Mortgage | With Mortgage |
| Less than 2.0x | 185 (21.4%) | 75,341 (5,927.7%) |
| 2.0x to 2.9x | 94 (10.9%) | 254 (20.0%) |
| 3.0x to 3.9x | 77 (8.9%) | 309 (24.3%) |
| 4.0x or more | 507 (58.8%) | 234 (18.4%) |
| Total | 863 (100.0%) | 1,271 (100.0%) |
Real Estate Taxes by Mortgage Status in Delta
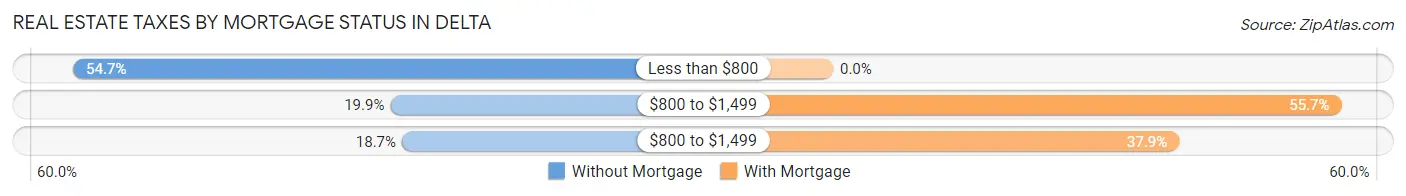
| Property Taxes | Without Mortgage | With Mortgage |
| Less than $800 | 472 (54.7%) | 0 (0.0%) |
| $800 to $1,499 | 172 (19.9%) | 708 (55.7%) |
| $800 to $1,499 | 161 (18.7%) | 482 (37.9%) |
| Total | 863 (100.0%) | 1,271 (100.0%) |
Health & Disability in Delta
Health Insurance Coverage by Age in Delta
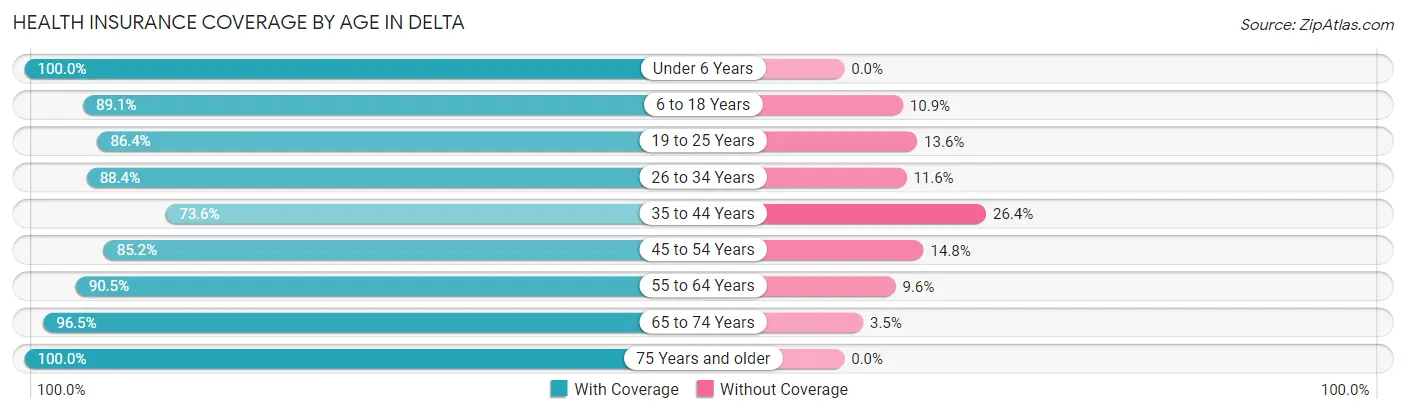
| Age Bracket | With Coverage | Without Coverage |
| Under 6 Years | 503 (100.0%) | 0 (0.0%) |
| 6 to 18 Years | 1,654 (89.1%) | 203 (10.9%) |
| 19 to 25 Years | 655 (86.4%) | 103 (13.6%) |
| 26 to 34 Years | 549 (88.4%) | 72 (11.6%) |
| 35 to 44 Years | 707 (73.6%) | 254 (26.4%) |
| 45 to 54 Years | 842 (85.2%) | 146 (14.8%) |
| 55 to 64 Years | 1,222 (90.4%) | 129 (9.6%) |
| 65 to 74 Years | 1,107 (96.5%) | 40 (3.5%) |
| 75 Years and older | 824 (100.0%) | 0 (0.0%) |
| Total | 8,063 (89.5%) | 947 (10.5%) |
Health Insurance Coverage by Citizenship Status in Delta
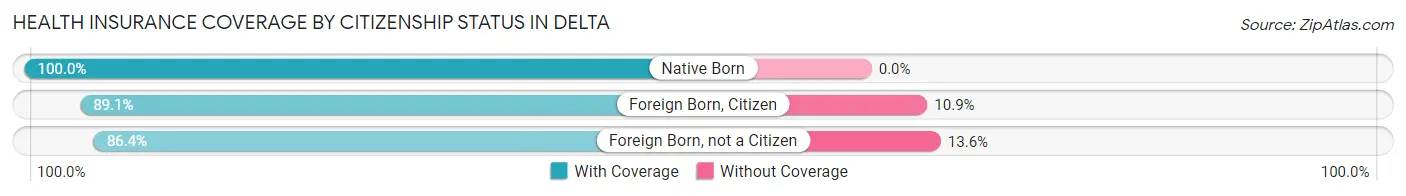
| Citizenship Status | With Coverage | Without Coverage |
| Native Born | 503 (100.0%) | 0 (0.0%) |
| Foreign Born, Citizen | 1,654 (89.1%) | 203 (10.9%) |
| Foreign Born, not a Citizen | 655 (86.4%) | 103 (13.6%) |
Health Insurance Coverage by Household Income in Delta
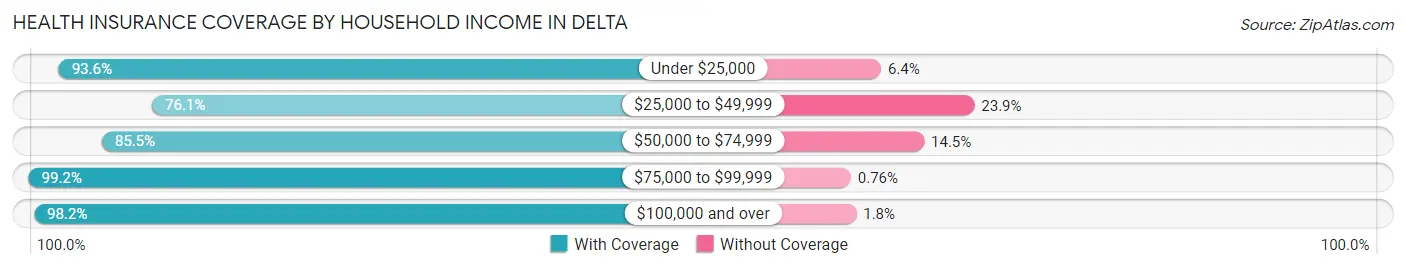
| Household Income | With Coverage | Without Coverage |
| Under $25,000 | 1,595 (93.6%) | 109 (6.4%) |
| $25,000 to $49,999 | 1,605 (76.1%) | 504 (23.9%) |
| $50,000 to $74,999 | 1,606 (85.5%) | 272 (14.5%) |
| $75,000 to $99,999 | 1,047 (99.2%) | 8 (0.8%) |
| $100,000 and over | 2,093 (98.2%) | 38 (1.8%) |
Public vs Private Health Insurance Coverage by Age in Delta
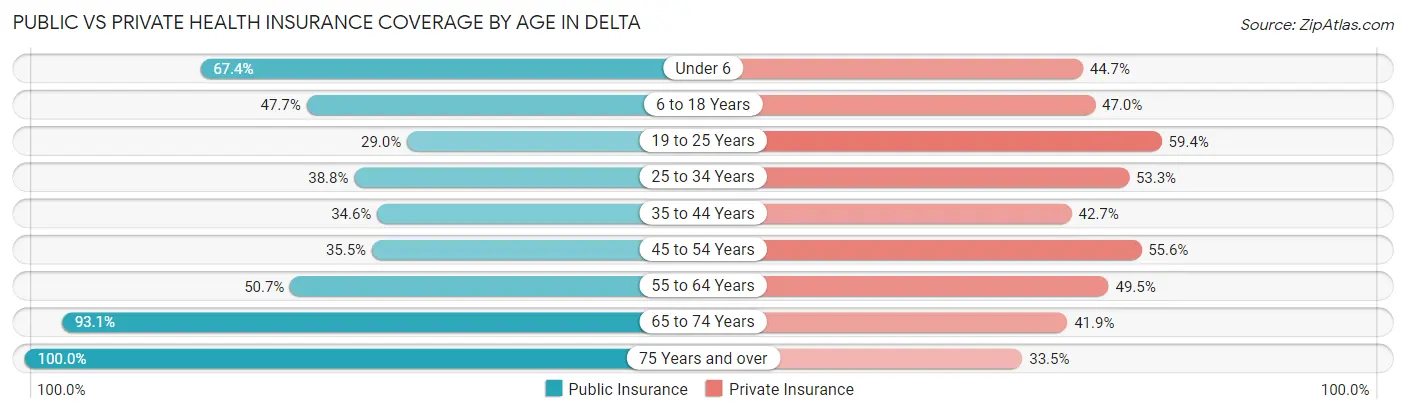
| Age Bracket | Public Insurance | Private Insurance |
| Under 6 | 339 (67.4%) | 225 (44.7%) |
| 6 to 18 Years | 885 (47.7%) | 873 (47.0%) |
| 19 to 25 Years | 220 (29.0%) | 450 (59.4%) |
| 25 to 34 Years | 241 (38.8%) | 331 (53.3%) |
| 35 to 44 Years | 332 (34.5%) | 410 (42.7%) |
| 45 to 54 Years | 351 (35.5%) | 549 (55.6%) |
| 55 to 64 Years | 685 (50.7%) | 669 (49.5%) |
| 65 to 74 Years | 1,068 (93.1%) | 480 (41.8%) |
| 75 Years and over | 824 (100.0%) | 276 (33.5%) |
| Total | 4,945 (54.9%) | 4,263 (47.3%) |
Disability Status by Sex by Age in Delta
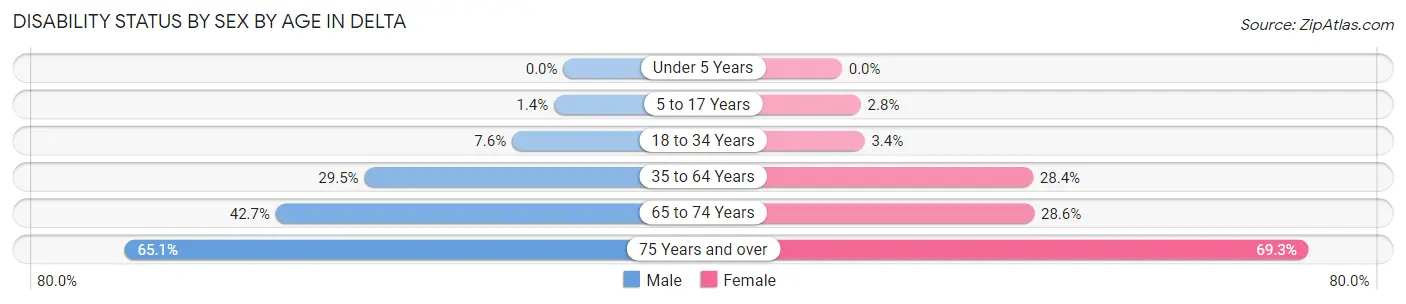
| Age Bracket | Male | Female |
| Under 5 Years | 0 (0.0%) | 0 (0.0%) |
| 5 to 17 Years | 12 (1.4%) | 26 (2.8%) |
| 18 to 34 Years | 66 (7.6%) | 20 (3.4%) |
| 35 to 64 Years | 498 (29.5%) | 458 (28.4%) |
| 65 to 74 Years | 231 (42.7%) | 173 (28.5%) |
| 75 Years and over | 299 (65.1%) | 253 (69.3%) |
Disability Class by Sex by Age in Delta
Disability Class: Hearing Difficulty
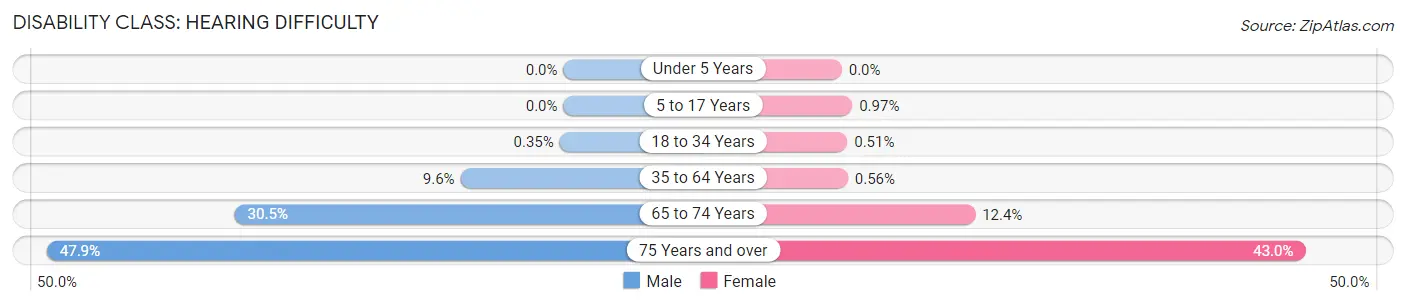
| Age Bracket | Male | Female |
| Under 5 Years | 0 (0.0%) | 0 (0.0%) |
| 5 to 17 Years | 0 (0.0%) | 9 (1.0%) |
| 18 to 34 Years | 3 (0.4%) | 3 (0.5%) |
| 35 to 64 Years | 161 (9.6%) | 9 (0.6%) |
| 65 to 74 Years | 165 (30.5%) | 75 (12.4%) |
| 75 Years and over | 220 (47.9%) | 157 (43.0%) |
Disability Class: Vision Difficulty
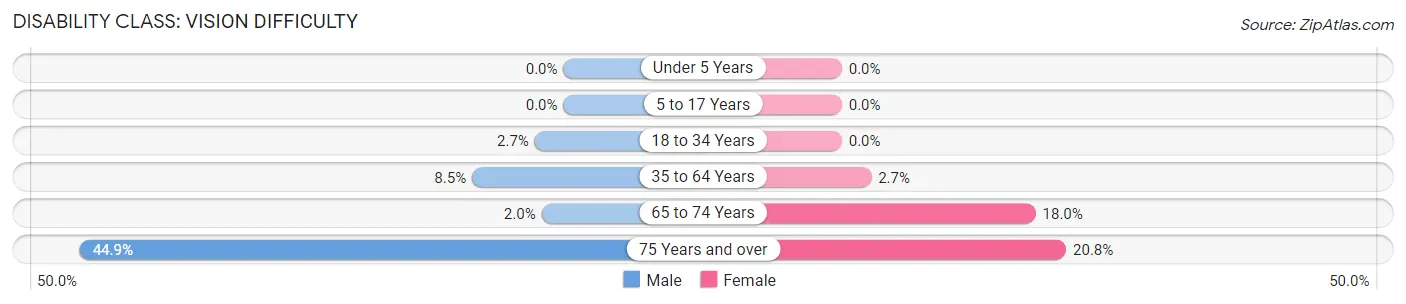
| Age Bracket | Male | Female |
| Under 5 Years | 0 (0.0%) | 0 (0.0%) |
| 5 to 17 Years | 0 (0.0%) | 0 (0.0%) |
| 18 to 34 Years | 23 (2.7%) | 0 (0.0%) |
| 35 to 64 Years | 143 (8.5%) | 44 (2.7%) |
| 65 to 74 Years | 11 (2.0%) | 109 (18.0%) |
| 75 Years and over | 206 (44.9%) | 76 (20.8%) |
Disability Class: Cognitive Difficulty
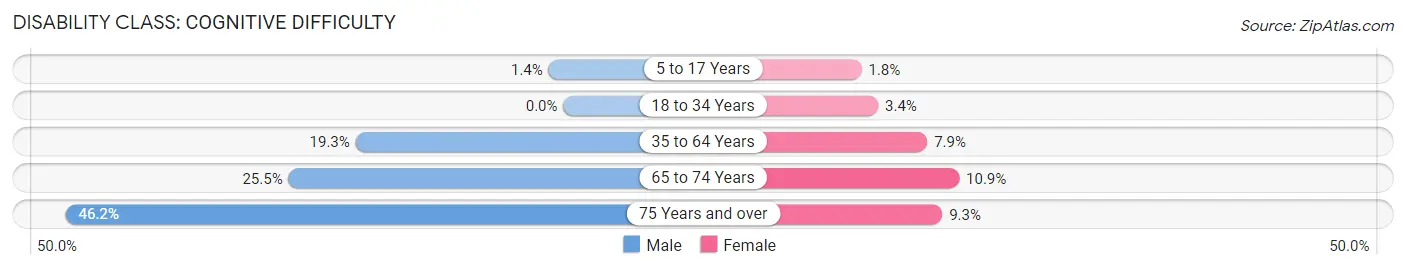
| Age Bracket | Male | Female |
| 5 to 17 Years | 12 (1.4%) | 17 (1.8%) |
| 18 to 34 Years | 0 (0.0%) | 20 (3.4%) |
| 35 to 64 Years | 325 (19.3%) | 128 (7.9%) |
| 65 to 74 Years | 138 (25.5%) | 66 (10.9%) |
| 75 Years and over | 212 (46.2%) | 34 (9.3%) |
Disability Class: Ambulatory Difficulty
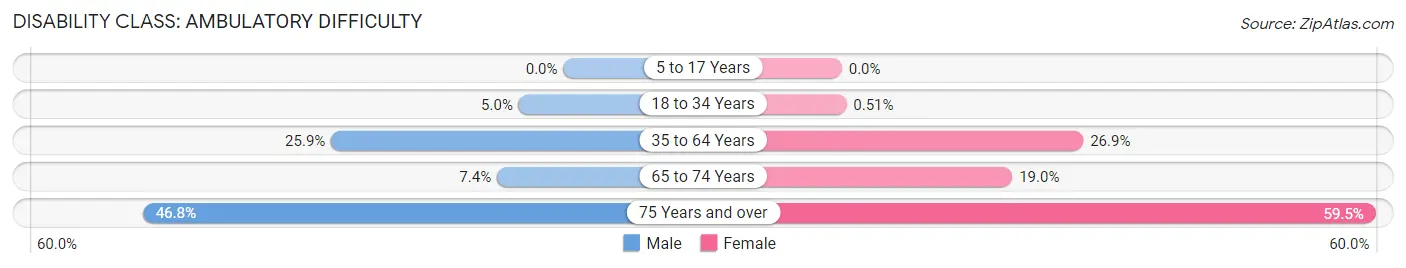
| Age Bracket | Male | Female |
| 5 to 17 Years | 0 (0.0%) | 0 (0.0%) |
| 18 to 34 Years | 43 (5.0%) | 3 (0.5%) |
| 35 to 64 Years | 436 (25.9%) | 434 (26.9%) |
| 65 to 74 Years | 40 (7.4%) | 115 (19.0%) |
| 75 Years and over | 215 (46.8%) | 217 (59.5%) |
Disability Class: Self-Care Difficulty
| Age Bracket | Male | Female |
| 5 to 17 Years | 0 (0.0%) | 0 (0.0%) |
| 18 to 34 Years | 0 (0.0%) | 3 (0.5%) |
| 35 to 64 Years | 154 (9.1%) | 98 (6.1%) |
| 65 to 74 Years | 3 (0.5%) | 48 (7.9%) |
| 75 Years and over | 155 (33.8%) | 21 (5.8%) |
Technology Access in Delta
Computing Device Access in Delta
| Device Type | # Households | % Households |
| Desktop or Laptop | 2,336 | 68.8% |
| Smartphone | 2,303 | 67.9% |
| Tablet | 1,564 | 46.1% |
| No Computing Device | 562 | 16.6% |
| Total | 3,394 | 100.0% |
Internet Access in Delta
| Internet Type | # Households | % Households |
| Dial-Up Internet | 18 | 0.5% |
| Broadband Home | 1,764 | 52.0% |
| Cellular Data Only | 376 | 11.1% |
| Satellite Internet | 306 | 9.0% |
| No Internet | 989 | 29.1% |
| Total | 3,394 | 100.0% |
Delta Summary
Delta is a city located in the state of Colorado in the United States of America. It is the county seat of Delta County and is located in the western part of the state. The city has a population of 8,915 as of the 2020 census.
Geography
Delta is located in the Grand Valley of western Colorado, at the confluence of the Gunnison and Uncompahgre Rivers. The city is situated at an elevation of 4,890 feet (1,490 m) above sea level. The city is surrounded by the Grand Mesa to the east, the Uncompahgre Plateau to the west, and the West Elk Mountains to the south.
Climate
Delta has a semi-arid climate, with hot summers and cold winters. The average annual temperature is 52.2°F (11.2°C). The average annual precipitation is 11.2 inches (284 mm).
History
Delta was founded in 1882 as a railroad town. The city was named after the Greek letter delta, which is the fourth letter of the Greek alphabet. The city was incorporated in 1883.
In the early 1900s, Delta was a major agricultural center, with a large number of farms and ranches in the area. The city was also a major center for the mining industry, with several mines in the area.
In the 1950s, Delta began to experience a population decline as the mining industry declined and the agricultural industry shifted to other areas. The city has since experienced a resurgence in population, with the population increasing from 6,400 in 2000 to 8,915 in 2020.
Economy
Delta's economy is largely based on agriculture and tourism. The city is home to several large farms and ranches, as well as a number of smaller farms and ranches. The city is also home to several wineries and vineyards.
The city is also a major tourist destination, with a number of attractions in the area, including the Grand Mesa National Forest, the Black Canyon of the Gunnison National Park, and the Colorado National Monument.
Demographics
As of the 2020 census, Delta had a population of 8,915. The racial makeup of the city was 87.2% White, 0.7% African American, 0.7% Native American, 0.4% Asian, 0.1% Pacific Islander, 8.7% from other races, and 2.2% from two or more races. Hispanic or Latino of any race were 20.2% of the population.
The median household income in Delta was $45,945, and the median family income was $51,945. The per capita income in Delta was $22,945. About 11.2% of the population was below the poverty line.
Conclusion
Delta is a city located in the state of Colorado in the United States of America. It is the county seat of Delta County and is located in the western part of the state. The city has a population of 8,915 as of the 2020 census. Delta has a semi-arid climate, with hot summers and cold winters. The city's economy is largely based on agriculture and tourism. As of the 2020 census, Delta had a population of 8,915, with a median household income of $45,945 and a median family income of $51,945.
Common Questions
What is Per Capita Income in Delta?
Per Capita income in Delta is $29,437.
What is the Median Family Income in Delta?
Median Family Income in Delta is $56,628.
What is the Median Household income in Delta?
Median Household Income in Delta is $45,950.
What is Income or Wage Gap in Delta?
Income or Wage Gap in Delta is 16.6%.
Women in Delta earn 83.4 cents for every dollar earned by a man.
What is Inequality or Gini Index in Delta?
Inequality or Gini Index in Delta is 0.52.
What is the Total Population of Delta?
Total Population of Delta is 9,137.
What is the Total Male Population of Delta?
Total Male Population of Delta is 4,686.
What is the Total Female Population of Delta?
Total Female Population of Delta is 4,451.
What is the Ratio of Males per 100 Females in Delta?
There are 105.28 Males per 100 Females in Delta.
What is the Ratio of Females per 100 Males in Delta?
There are 94.99 Females per 100 Males in Delta.
What is the Median Population Age in Delta?
Median Population Age in Delta is 43.4 Years.
What is the Average Family Size in Delta
Average Family Size in Delta is 3.4 People.
What is the Average Household Size in Delta
Average Household Size in Delta is 2.6 People.
How Large is the Labor Force in Delta?
There are 3,413 People in the Labor Forcein in Delta.
What is the Percentage of People in the Labor Force in Delta?
48.1% of People are in the Labor Force in Delta.
What is the Unemployment Rate in Delta?
Unemployment Rate in Delta is 5.0%.