Shaw Heights, CO Map & Demographics
Shaw Heights Map
Shaw Heights Overview
$36,195
PER CAPITA INCOME
$87,750
AVG FAMILY INCOME
$89,125
AVG HOUSEHOLD INCOME
14.3%
WAGE / INCOME GAP [ % ]
85.7¢/ $1
WAGE / INCOME GAP [ $ ]
0.44
INEQUALITY / GINI INDEX
5,458
TOTAL POPULATION
2,889
MALE POPULATION
2,569
FEMALE POPULATION
112.46
MALES / 100 FEMALES
88.92
FEMALES / 100 MALES
34.1
MEDIAN AGE
3.8
AVG FAMILY SIZE
3.3
AVG HOUSEHOLD SIZE
2,950
LABOR FORCE [ PEOPLE ]
67.6%
PERCENT IN LABOR FORCE
2.8%
UNEMPLOYMENT RATE
Income in Shaw Heights
Income Overview in Shaw Heights
Per Capita Income in Shaw Heights is $36,195, while median incomes of families and households are $87,750 and $89,125 respectively.
| Characteristic | Number | Measure |
| Per Capita Income | 5,458 | $36,195 |
| Median Family Income | 1,160 | $87,750 |
| Mean Family Income | 1,160 | $128,005 |
| Median Household Income | 1,666 | $89,125 |
| Mean Household Income | 1,666 | $113,972 |
| Income Deficit | 1,160 | $0 |
| Wage / Income Gap (%) | 5,458 | 14.26% |
| Wage / Income Gap ($) | 5,458 | 85.74¢ per $1 |
| Gini / Inequality Index | 5,458 | 0.44 |
Earnings by Sex in Shaw Heights
Average Earnings in Shaw Heights are $40,786, $42,483 for men and $36,424 for women, a difference of 14.3%.
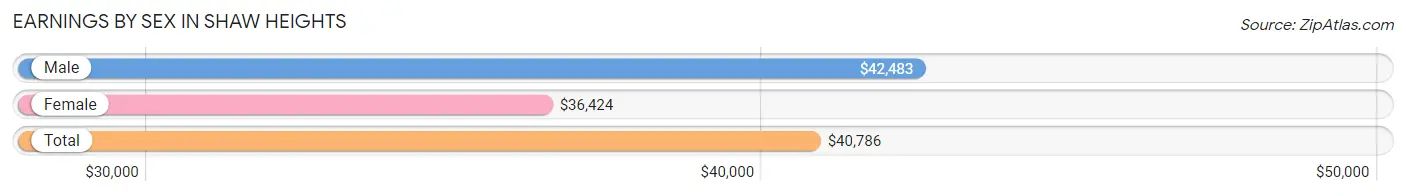
| Sex | Number | Average Earnings |
| Male | 1,682 (56.5%) | $42,483 |
| Female | 1,293 (43.5%) | $36,424 |
| Total | 2,975 (100.0%) | $40,786 |
Earnings by Sex by Income Bracket in Shaw Heights
The most common earnings brackets in Shaw Heights are $55,000 to $64,999 for men (220 | 13.1%) and $40,000 to $44,999 for women (157 | 12.1%).
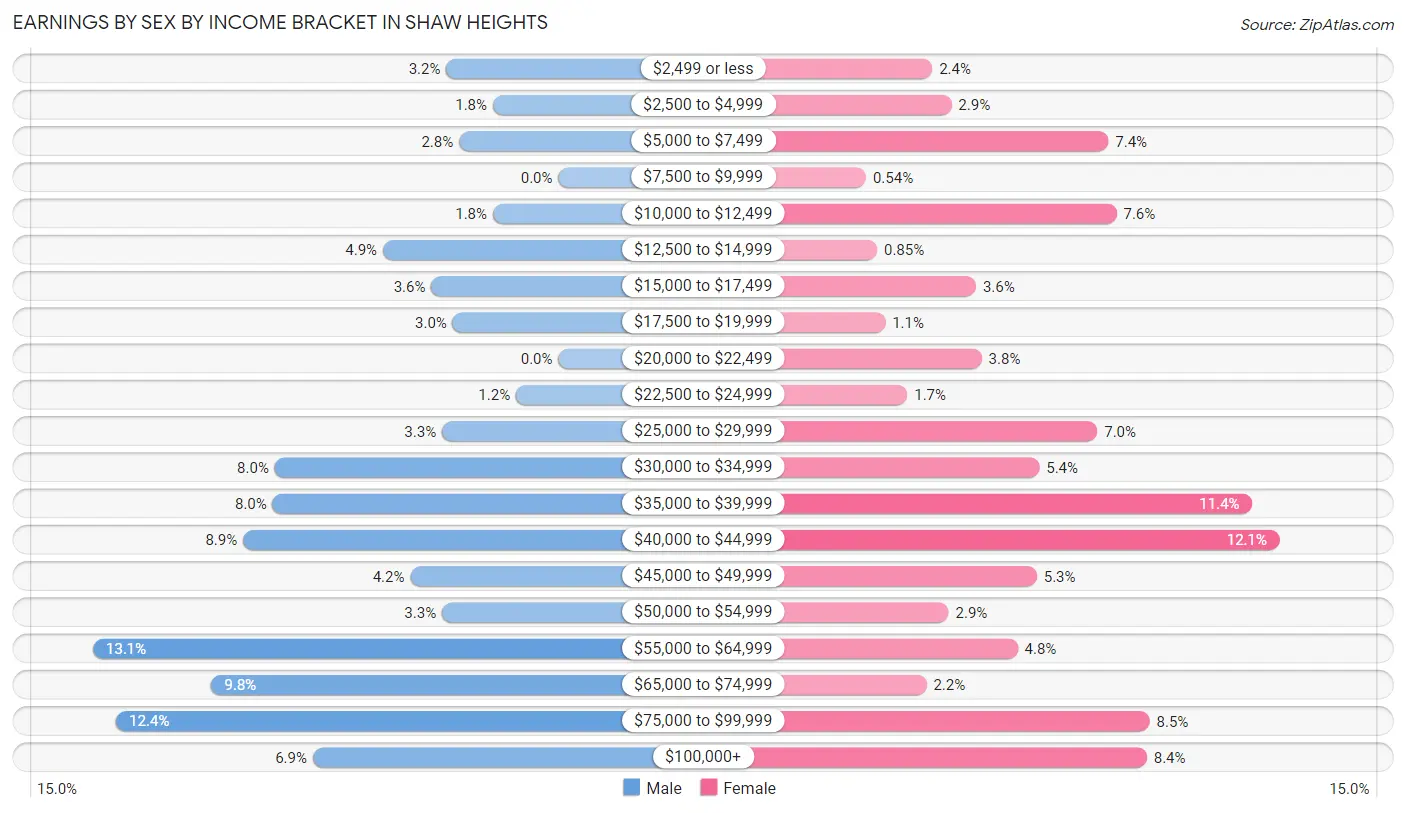
| Income | Male | Female |
| $2,499 or less | 53 (3.2%) | 31 (2.4%) |
| $2,500 to $4,999 | 31 (1.8%) | 38 (2.9%) |
| $5,000 to $7,499 | 47 (2.8%) | 95 (7.3%) |
| $7,500 to $9,999 | 0 (0.0%) | 7 (0.5%) |
| $10,000 to $12,499 | 31 (1.8%) | 98 (7.6%) |
| $12,500 to $14,999 | 83 (4.9%) | 11 (0.9%) |
| $15,000 to $17,499 | 60 (3.6%) | 47 (3.6%) |
| $17,500 to $19,999 | 50 (3.0%) | 14 (1.1%) |
| $20,000 to $22,499 | 0 (0.0%) | 49 (3.8%) |
| $22,500 to $24,999 | 20 (1.2%) | 22 (1.7%) |
| $25,000 to $29,999 | 55 (3.3%) | 91 (7.0%) |
| $30,000 to $34,999 | 134 (8.0%) | 70 (5.4%) |
| $35,000 to $39,999 | 135 (8.0%) | 147 (11.4%) |
| $40,000 to $44,999 | 149 (8.9%) | 157 (12.1%) |
| $45,000 to $49,999 | 70 (4.2%) | 69 (5.3%) |
| $50,000 to $54,999 | 55 (3.3%) | 37 (2.9%) |
| $55,000 to $64,999 | 220 (13.1%) | 62 (4.8%) |
| $65,000 to $74,999 | 164 (9.8%) | 29 (2.2%) |
| $75,000 to $99,999 | 209 (12.4%) | 110 (8.5%) |
| $100,000+ | 116 (6.9%) | 109 (8.4%) |
| Total | 1,682 (100.0%) | 1,293 (100.0%) |
Earnings by Sex by Educational Attainment in Shaw Heights
Average earnings in Shaw Heights are $50,642 for men and $37,064 for women, a difference of 26.8%. Men with an educational attainment of bachelor's degree enjoy the highest average annual earnings of $70,143, while those with high school diploma education earn the least with $41,440. Women with an educational attainment of bachelor's degree earn the most with the average annual earnings of $61,389, while those with less than high school education have the smallest earnings of $20,888.
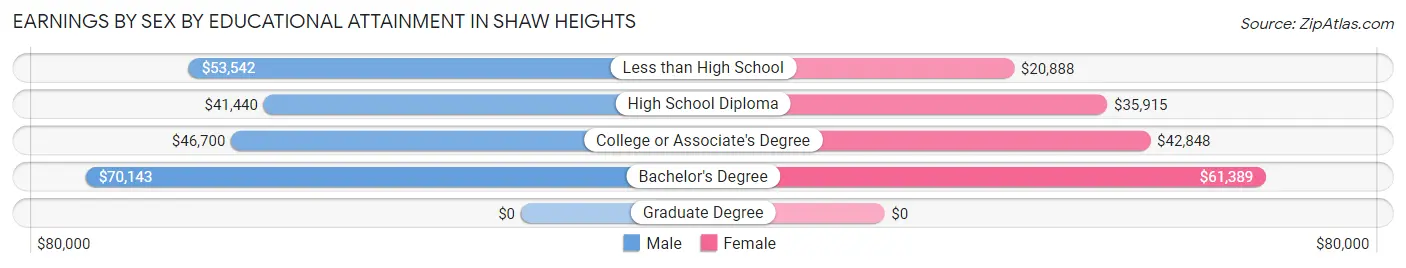
| Educational Attainment | Male Income | Female Income |
| Less than High School | $53,542 | $20,888 |
| High School Diploma | $41,440 | $35,915 |
| College or Associate's Degree | $46,700 | $42,848 |
| Bachelor's Degree | $70,143 | $61,389 |
| Graduate Degree | - | - |
| Total | $50,642 | $37,064 |
Family Income in Shaw Heights
Family Income Brackets in Shaw Heights
According to the Shaw Heights family income data, there are 347 families falling into the $50,000 to $74,999 income range, which is the most common income bracket and makes up 29.9% of all families.
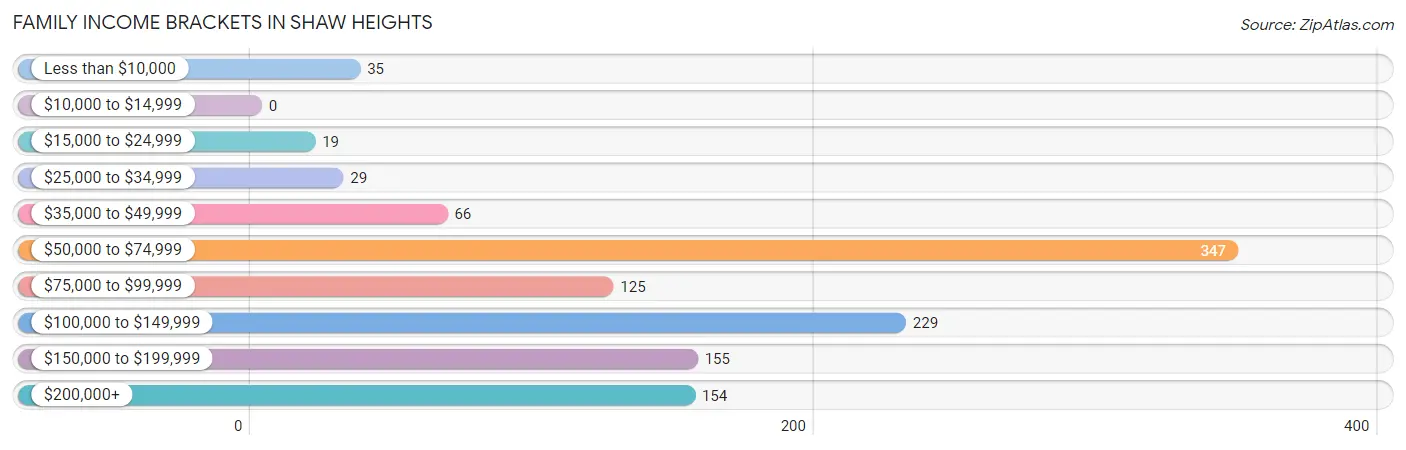
| Income Bracket | # Families | % Families |
| Less than $10,000 | 35 | 3.0% |
| $10,000 to $14,999 | 0 | 0.0% |
| $15,000 to $24,999 | 19 | 1.6% |
| $25,000 to $34,999 | 29 | 2.5% |
| $35,000 to $49,999 | 66 | 5.7% |
| $50,000 to $74,999 | 347 | 29.9% |
| $75,000 to $99,999 | 125 | 10.8% |
| $100,000 to $149,999 | 229 | 19.7% |
| $150,000 to $199,999 | 155 | 13.4% |
| $200,000+ | 154 | 13.3% |
Family Income by Famaliy Size in Shaw Heights
7+ person families (75 | 6.5%) account for the highest median family income in Shaw Heights with $233,144 per family, while 3-person families (235 | 20.3%) have the highest median income of $40,737 per family member.
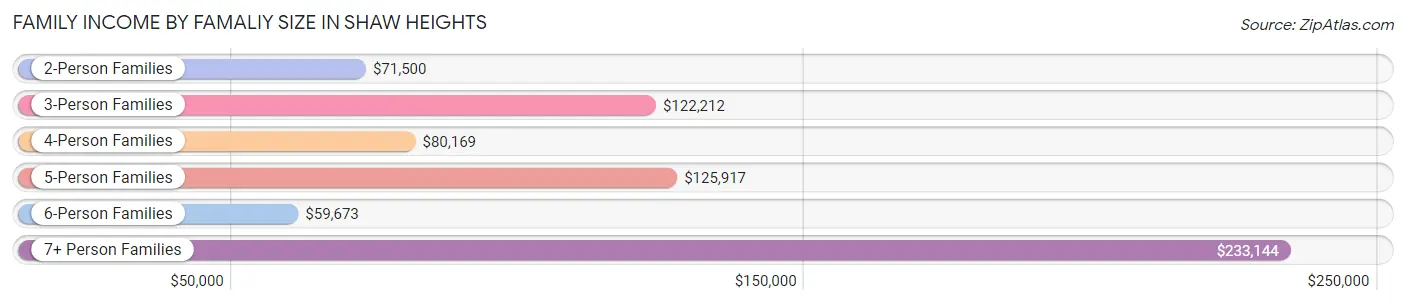
| Income Bracket | # Families | Median Income |
| 2-Person Families | 428 (36.9%) | $71,500 |
| 3-Person Families | 235 (20.3%) | $122,212 |
| 4-Person Families | 285 (24.6%) | $80,169 |
| 5-Person Families | 64 (5.5%) | $125,917 |
| 6-Person Families | 73 (6.3%) | $59,673 |
| 7+ Person Families | 75 (6.5%) | $233,144 |
| Total | 1,160 (100.0%) | $87,750 |
Family Income by Number of Earners in Shaw Heights
The median family income in Shaw Heights is $87,750, with families comprising 3+ earners (168) having the highest median family income of $173,250, while families with no earners (147) have the lowest median family income of $52,868, accounting for 14.5% and 12.7% of families, respectively.
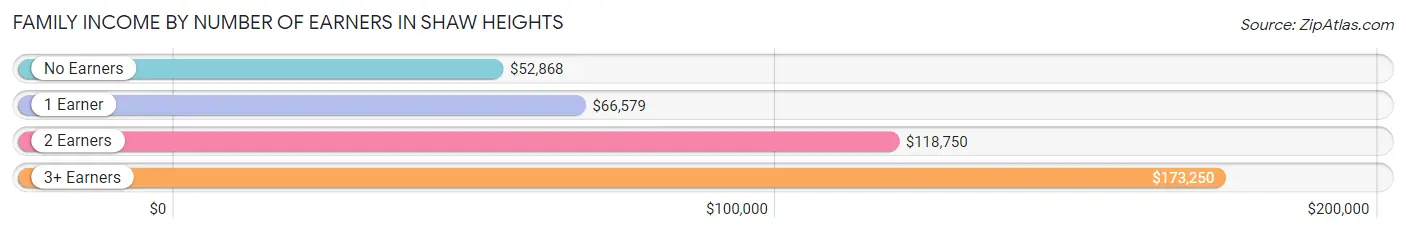
| Number of Earners | # Families | Median Income |
| No Earners | 147 (12.7%) | $52,868 |
| 1 Earner | 320 (27.6%) | $66,579 |
| 2 Earners | 525 (45.3%) | $118,750 |
| 3+ Earners | 168 (14.5%) | $173,250 |
| Total | 1,160 (100.0%) | $87,750 |
Household Income in Shaw Heights
Household Income Brackets in Shaw Heights
With 363 households falling in the category, the $100,000 to $149,999 income range is the most frequent in Shaw Heights, accounting for 21.8% of all households. In contrast, only 25 households (1.5%) fall into the $10,000 to $14,999 income bracket, making it the least populous group.
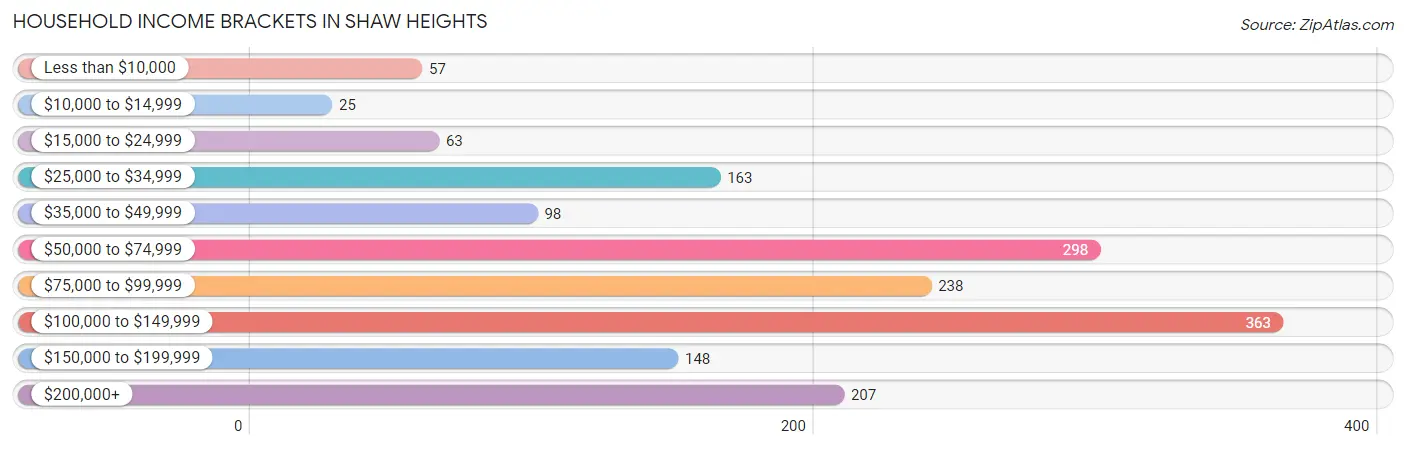
| Income Bracket | # Households | % Households |
| Less than $10,000 | 57 | 3.4% |
| $10,000 to $14,999 | 25 | 1.5% |
| $15,000 to $24,999 | 63 | 3.8% |
| $25,000 to $34,999 | 163 | 9.8% |
| $35,000 to $49,999 | 98 | 5.9% |
| $50,000 to $74,999 | 298 | 17.9% |
| $75,000 to $99,999 | 238 | 14.3% |
| $100,000 to $149,999 | 363 | 21.8% |
| $150,000 to $199,999 | 148 | 8.9% |
| $200,000+ | 207 | 12.4% |
Household Income by Householder Age in Shaw Heights
The median household income in Shaw Heights is $89,125, with the highest median household income of $110,792 found in the 25 to 44 years age bracket for the primary householder. A total of 643 households (38.6%) fall into this category. Meanwhile, the 15 to 24 years age bracket for the primary householder has the lowest median household income of $0, with 14 households (0.8%) in this group.
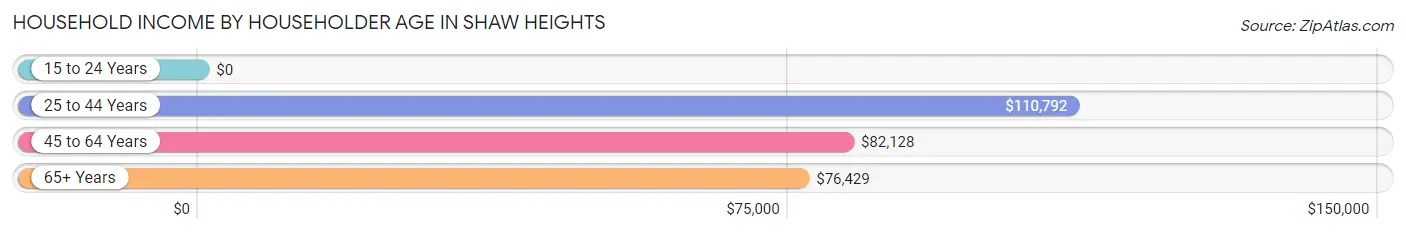
| Income Bracket | # Households | Median Income |
| 15 to 24 Years | 14 (0.8%) | $0 |
| 25 to 44 Years | 643 (38.6%) | $110,792 |
| 45 to 64 Years | 541 (32.5%) | $82,128 |
| 65+ Years | 468 (28.1%) | $76,429 |
| Total | 1,666 (100.0%) | $89,125 |
Poverty in Shaw Heights
Income Below Poverty by Sex and Age in Shaw Heights
With 5.2% poverty level for males and 6.0% for females among the residents of Shaw Heights, 16 and 17 year old males and 16 and 17 year old females are the most vulnerable to poverty, with 15 males (13.0%) and 40 females (18.9%) in their respective age groups living below the poverty level.
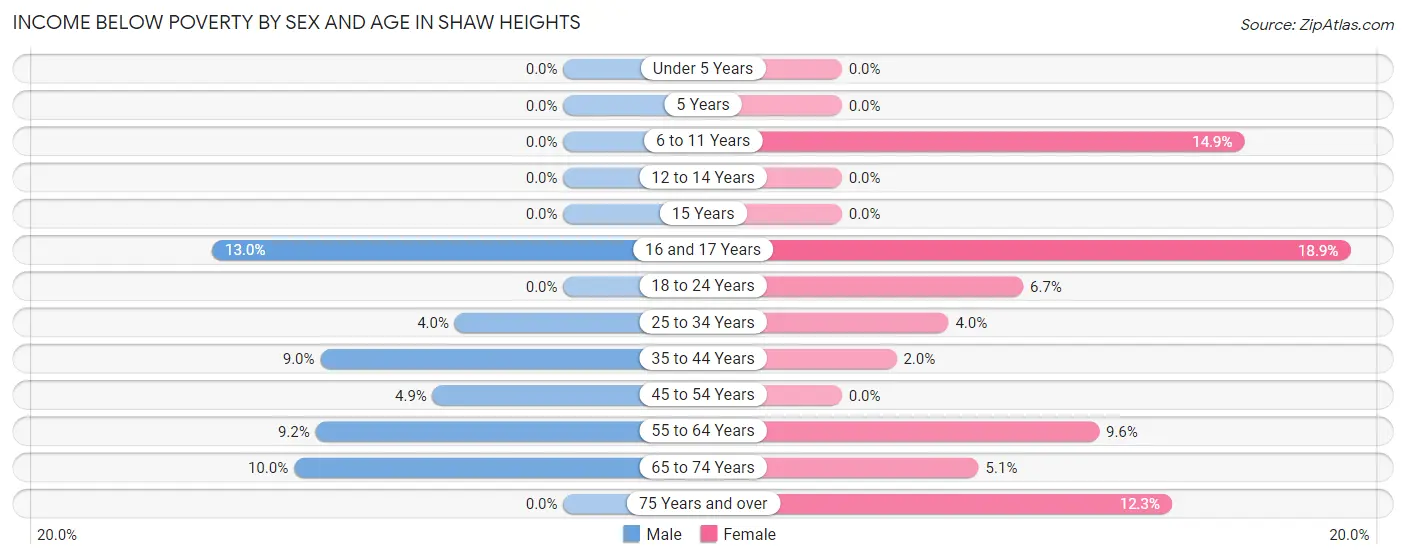
| Age Bracket | Male | Female |
| Under 5 Years | 0 (0.0%) | 0 (0.0%) |
| 5 Years | 0 (0.0%) | 0 (0.0%) |
| 6 to 11 Years | 0 (0.0%) | 13 (14.9%) |
| 12 to 14 Years | 0 (0.0%) | 0 (0.0%) |
| 15 Years | 0 (0.0%) | 0 (0.0%) |
| 16 and 17 Years | 15 (13.0%) | 40 (18.9%) |
| 18 to 24 Years | 0 (0.0%) | 20 (6.7%) |
| 25 to 34 Years | 24 (4.0%) | 13 (4.0%) |
| 35 to 44 Years | 47 (9.0%) | 7 (2.0%) |
| 45 to 54 Years | 8 (4.9%) | 0 (0.0%) |
| 55 to 64 Years | 38 (9.2%) | 21 (9.6%) |
| 65 to 74 Years | 18 (10.0%) | 13 (5.1%) |
| 75 Years and over | 0 (0.0%) | 25 (12.2%) |
| Total | 150 (5.2%) | 152 (6.0%) |
Income Above Poverty by Sex and Age in Shaw Heights
According to the poverty statistics in Shaw Heights, males aged under 5 years and females aged under 5 years are the age groups that are most secure financially, with 100.0% of males and 100.0% of females in these age groups living above the poverty line.
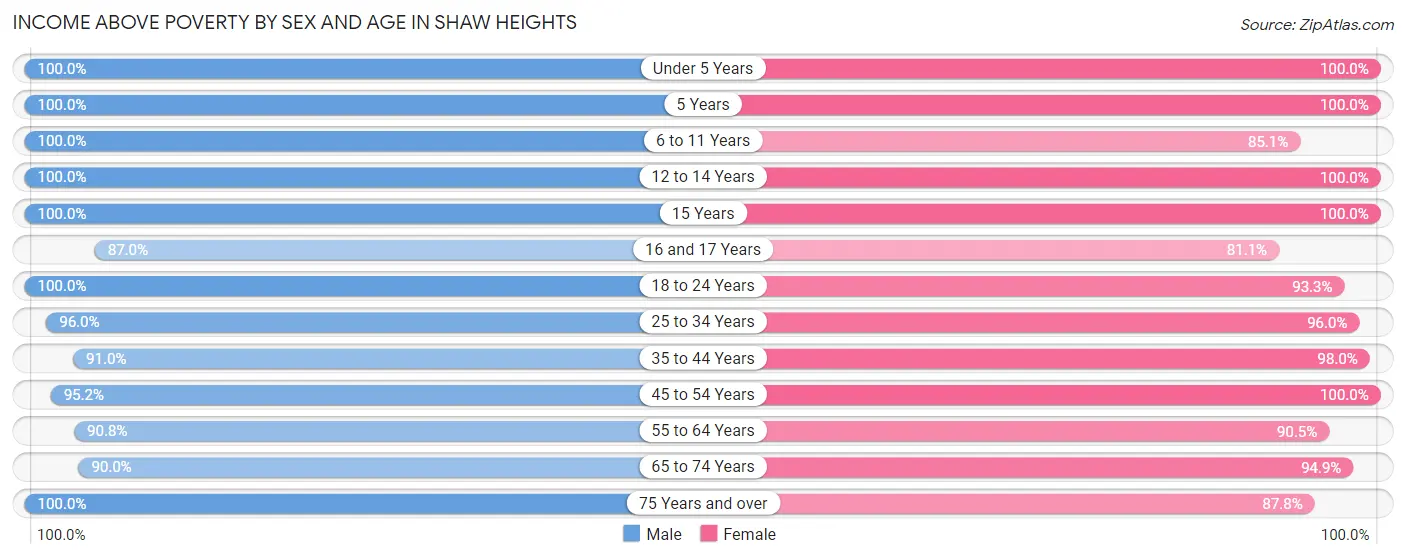
| Age Bracket | Male | Female |
| Under 5 Years | 220 (100.0%) | 275 (100.0%) |
| 5 Years | 3 (100.0%) | 36 (100.0%) |
| 6 to 11 Years | 196 (100.0%) | 74 (85.1%) |
| 12 to 14 Years | 108 (100.0%) | 50 (100.0%) |
| 15 Years | 50 (100.0%) | 44 (100.0%) |
| 16 and 17 Years | 100 (87.0%) | 172 (81.1%) |
| 18 to 24 Years | 190 (100.0%) | 277 (93.3%) |
| 25 to 34 Years | 571 (96.0%) | 315 (96.0%) |
| 35 to 44 Years | 474 (91.0%) | 338 (98.0%) |
| 45 to 54 Years | 157 (95.2%) | 198 (100.0%) |
| 55 to 64 Years | 375 (90.8%) | 199 (90.4%) |
| 65 to 74 Years | 162 (90.0%) | 243 (94.9%) |
| 75 Years and over | 124 (100.0%) | 179 (87.7%) |
| Total | 2,730 (94.8%) | 2,400 (94.0%) |
Income Below Poverty Among Married-Couple Families in Shaw Heights
The poverty statistics for married-couple families in Shaw Heights show that 2.8% or 22 of the total 782 families live below the poverty line. Families with 1 or 2 children have the highest poverty rate of 4.3%, comprising of 14 families. On the other hand, families with 3 or 4 children have the lowest poverty rate of 0.0%, which includes 0 families.
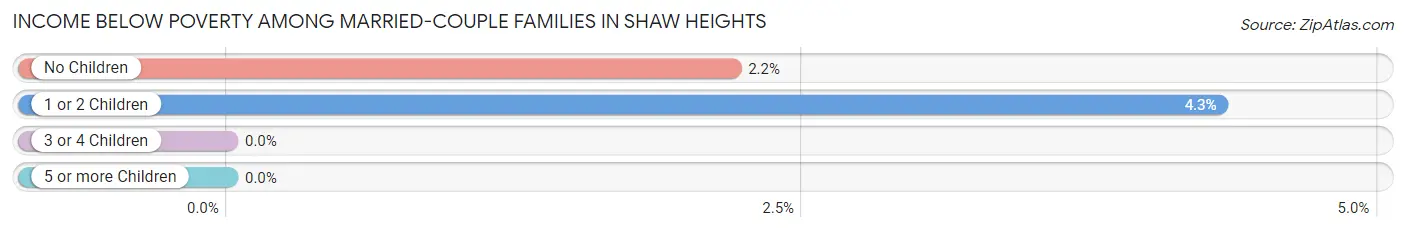
| Children | Above Poverty | Below Poverty |
| No Children | 357 (97.8%) | 8 (2.2%) |
| 1 or 2 Children | 311 (95.7%) | 14 (4.3%) |
| 3 or 4 Children | 92 (100.0%) | 0 (0.0%) |
| 5 or more Children | 0 (0.0%) | 0 (0.0%) |
| Total | 760 (97.2%) | 22 (2.8%) |
Income Below Poverty Among Single-Parent Households in Shaw Heights
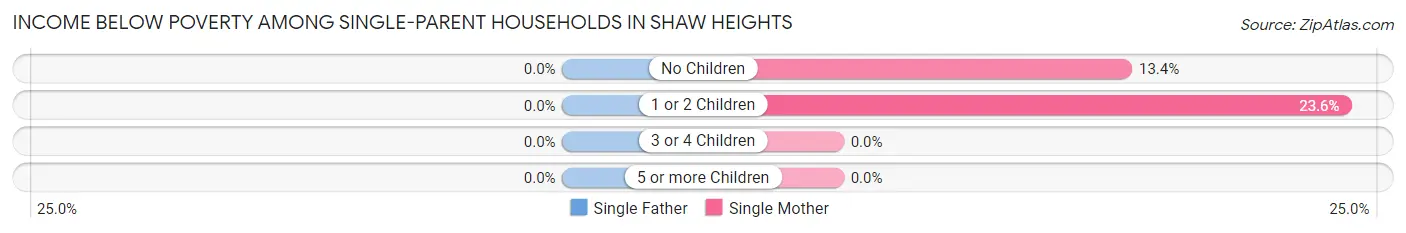
| Children | Single Father | Single Mother |
| No Children | 0 (0.0%) | 18 (13.4%) |
| 1 or 2 Children | 0 (0.0%) | 13 (23.6%) |
| 3 or 4 Children | 0 (0.0%) | 0 (0.0%) |
| 5 or more Children | 0 (0.0%) | 0 (0.0%) |
| Total | 0 (0.0%) | 31 (16.4%) |
Income Below Poverty Among Married-Couple vs Single-Parent Households in Shaw Heights
The poverty data for Shaw Heights shows that 22 of the married-couple family households (2.8%) and 31 of the single-parent households (8.2%) are living below the poverty level. Within the married-couple family households, those with 1 or 2 children have the highest poverty rate, with 14 households (4.3%) falling below the poverty line. Among the single-parent households, those with no children have the highest poverty rate, with 18 household (10.6%) living below poverty.
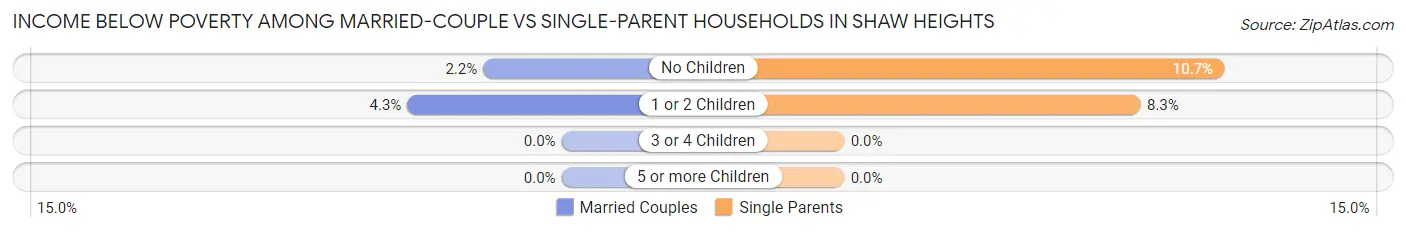
| Children | Married-Couple Families | Single-Parent Households |
| No Children | 8 (2.2%) | 18 (10.6%) |
| 1 or 2 Children | 14 (4.3%) | 13 (8.3%) |
| 3 or 4 Children | 0 (0.0%) | 0 (0.0%) |
| 5 or more Children | 0 (0.0%) | 0 (0.0%) |
| Total | 22 (2.8%) | 31 (8.2%) |
Race in Shaw Heights
The most populous races in Shaw Heights are White / Caucasian (3,430 | 62.8%), Hispanic or Latino (2,636 | 48.3%), and Two or more Races (1,309 | 24.0%).
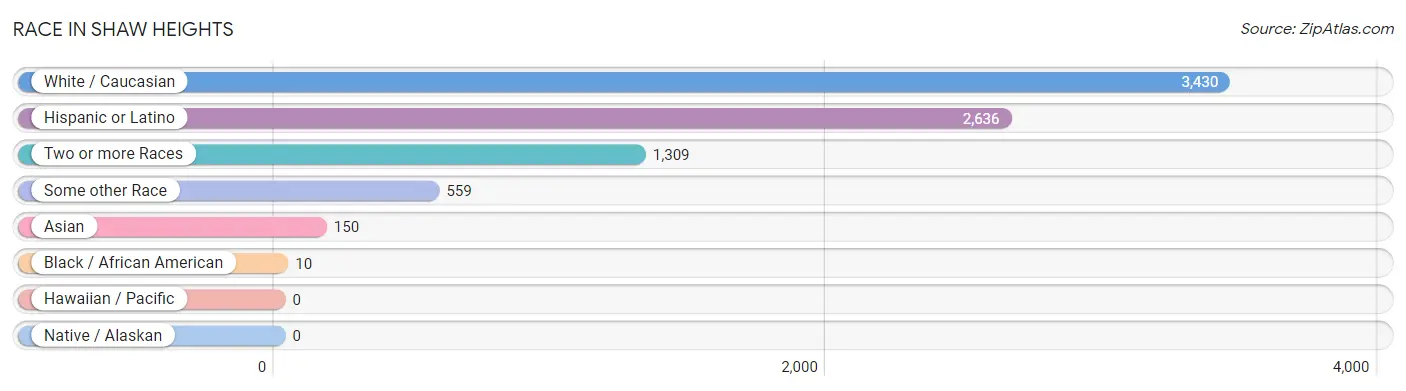
| Race | # Population | % Population |
| Asian | 150 | 2.8% |
| Black / African American | 10 | 0.2% |
| Hawaiian / Pacific | 0 | 0.0% |
| Hispanic or Latino | 2,636 | 48.3% |
| Native / Alaskan | 0 | 0.0% |
| White / Caucasian | 3,430 | 62.8% |
| Two or more Races | 1,309 | 24.0% |
| Some other Race | 559 | 10.2% |
| Total | 5,458 | 100.0% |
Ancestry in Shaw Heights
The most populous ancestries reported in Shaw Heights are Mexican (2,347 | 43.0%), German (931 | 17.1%), Irish (407 | 7.5%), English (200 | 3.7%), and Polish (199 | 3.6%), together accounting for 74.8% of all Shaw Heights residents.
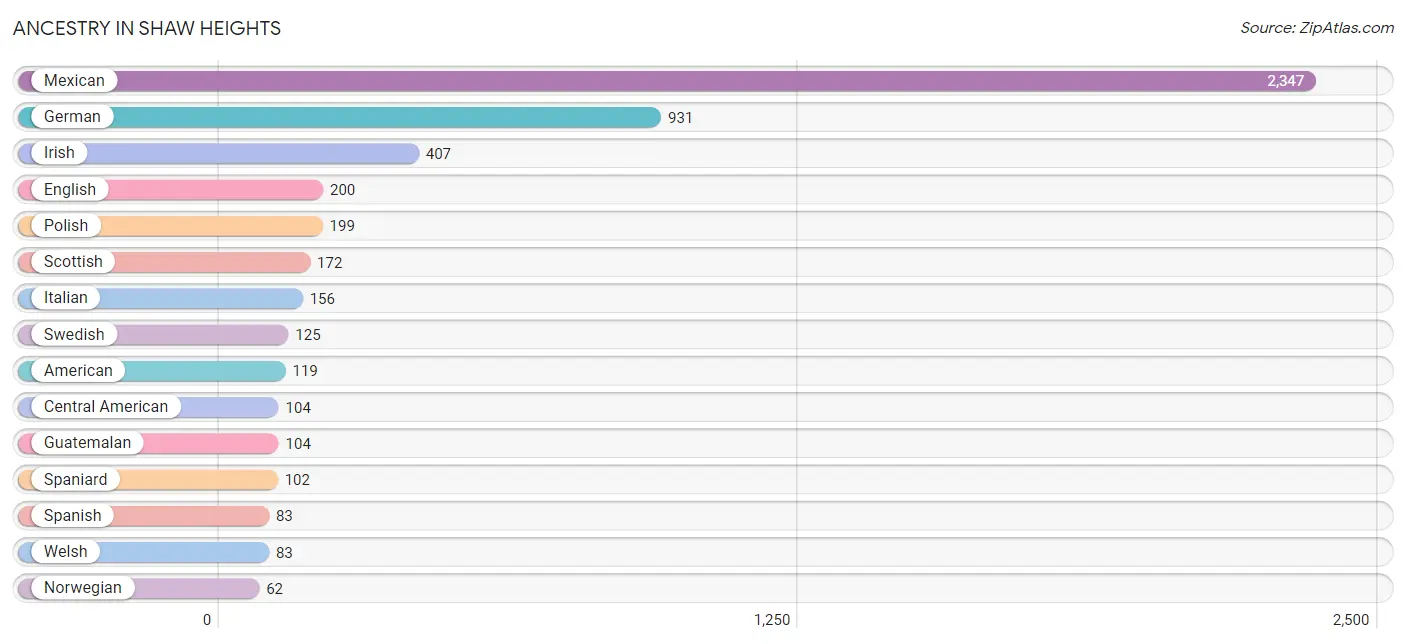
| Ancestry | # Population | % Population |
| American | 119 | 2.2% |
| Arab | 7 | 0.1% |
| Bhutanese | 7 | 0.1% |
| Bulgarian | 24 | 0.4% |
| Burmese | 27 | 0.5% |
| Central American | 104 | 1.9% |
| Czech | 30 | 0.5% |
| Danish | 8 | 0.2% |
| Dutch | 50 | 0.9% |
| English | 200 | 3.7% |
| European | 20 | 0.4% |
| Filipino | 8 | 0.2% |
| Finnish | 6 | 0.1% |
| French | 24 | 0.4% |
| French Canadian | 8 | 0.2% |
| German | 931 | 17.1% |
| Guatemalan | 104 | 1.9% |
| Indian (Asian) | 13 | 0.2% |
| Irish | 407 | 7.5% |
| Italian | 156 | 2.9% |
| Japanese | 57 | 1.0% |
| Korean | 1 | 0.0% |
| Lebanese | 7 | 0.1% |
| Lithuanian | 7 | 0.1% |
| Malaysian | 36 | 0.7% |
| Mexican | 2,347 | 43.0% |
| Northern European | 11 | 0.2% |
| Norwegian | 62 | 1.1% |
| Polish | 199 | 3.6% |
| Russian | 26 | 0.5% |
| Scotch-Irish | 45 | 0.8% |
| Scottish | 172 | 3.2% |
| Sioux | 14 | 0.3% |
| Spaniard | 102 | 1.9% |
| Spanish | 83 | 1.5% |
| Sri Lankan | 24 | 0.4% |
| Swedish | 125 | 2.3% |
| Ukrainian | 40 | 0.7% |
| Welsh | 83 | 1.5% |
| Yugoslavian | 14 | 0.3% | View All 40 Rows |
Immigrants in Shaw Heights
The most numerous immigrant groups reported in Shaw Heights came from Latin America (651 | 11.9%), Central America (645 | 11.8%), Mexico (541 | 9.9%), Guatemala (104 | 1.9%), and Asia (64 | 1.2%), together accounting for 36.7% of all Shaw Heights residents.
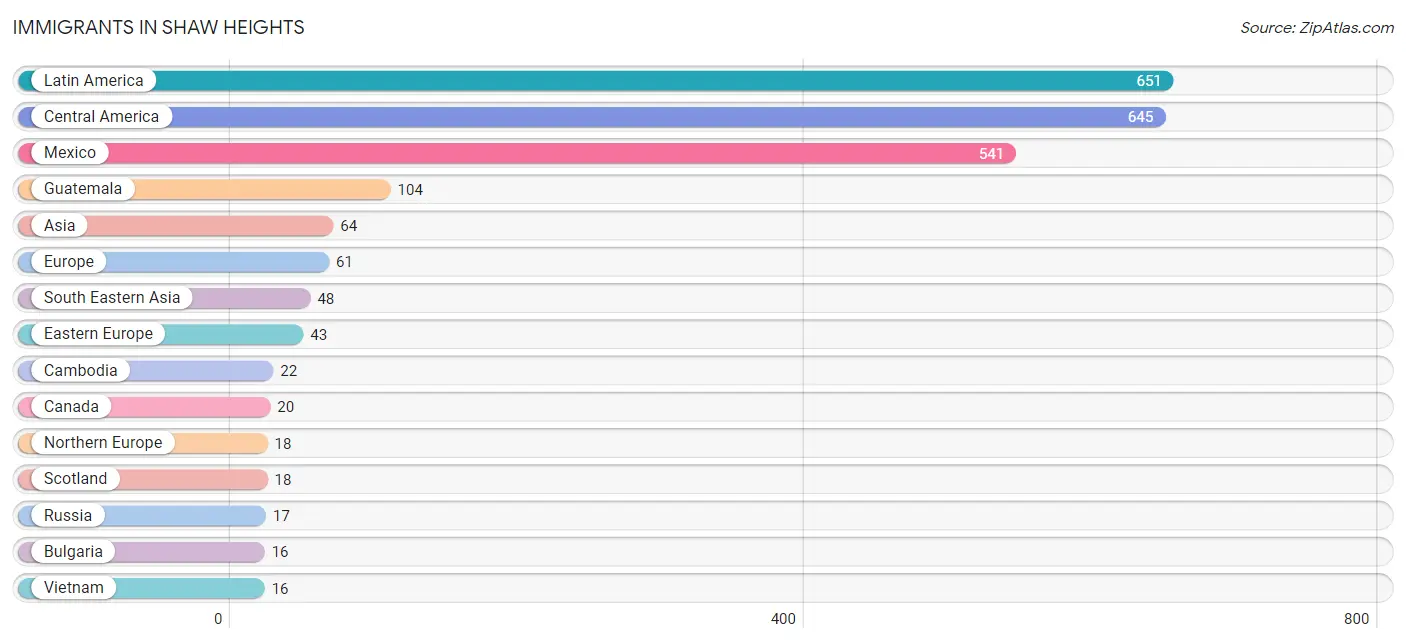
| Immigration Origin | # Population | % Population |
| Asia | 64 | 1.2% |
| Brazil | 6 | 0.1% |
| Bulgaria | 16 | 0.3% |
| Cambodia | 22 | 0.4% |
| Canada | 20 | 0.4% |
| Central America | 645 | 11.8% |
| Eastern Asia | 13 | 0.2% |
| Eastern Europe | 43 | 0.8% |
| Europe | 61 | 1.1% |
| Guatemala | 104 | 1.9% |
| Iran | 3 | 0.1% |
| Korea | 13 | 0.2% |
| Laos | 7 | 0.1% |
| Latin America | 651 | 11.9% |
| Mexico | 541 | 9.9% |
| Northern Europe | 18 | 0.3% |
| Russia | 17 | 0.3% |
| Scotland | 18 | 0.3% |
| South America | 6 | 0.1% |
| South Central Asia | 3 | 0.1% |
| South Eastern Asia | 48 | 0.9% |
| Thailand | 3 | 0.1% |
| Ukraine | 10 | 0.2% |
| Vietnam | 16 | 0.3% | View All 24 Rows |
Sex and Age in Shaw Heights
Sex and Age in Shaw Heights
The most populous age groups in Shaw Heights are 40 to 44 Years (388 | 13.4%) for men and 20 to 24 Years (297 | 11.6%) for women.
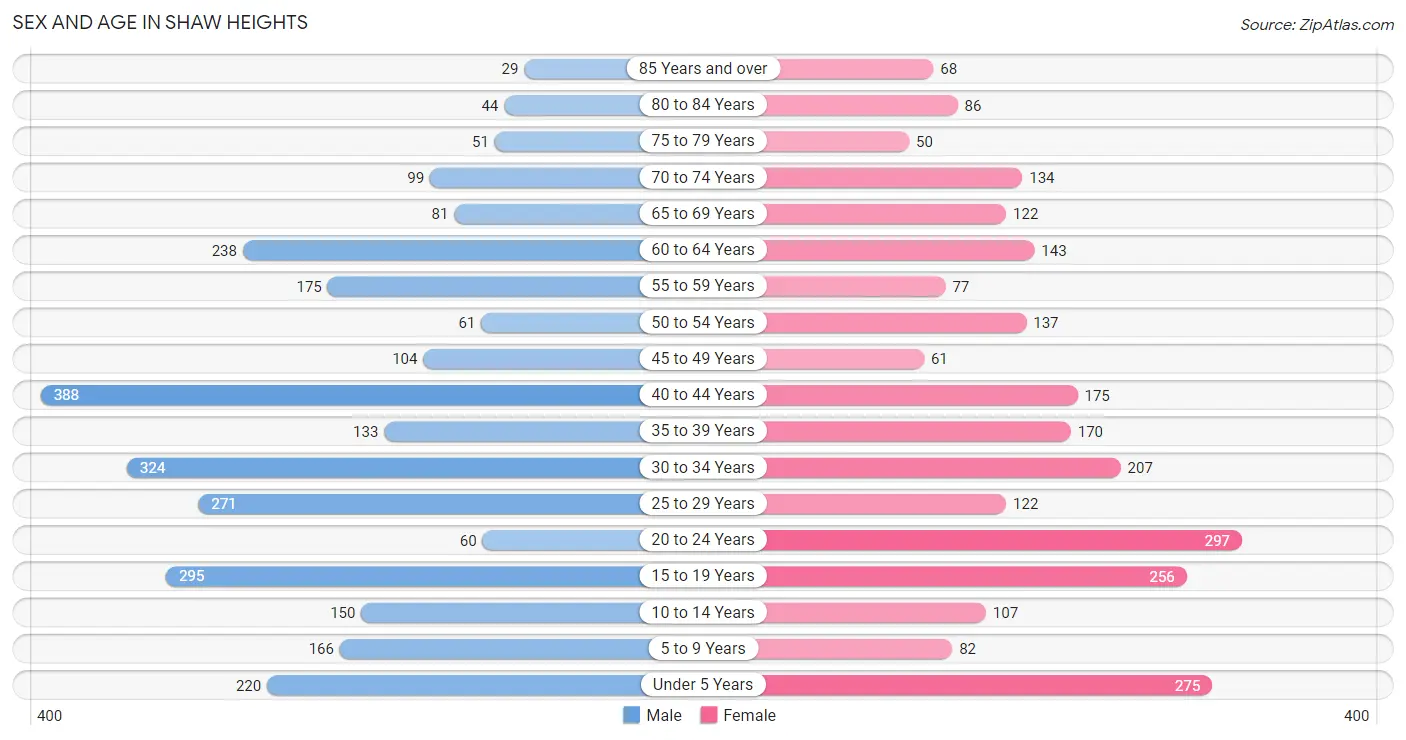
| Age Bracket | Male | Female |
| Under 5 Years | 220 (7.6%) | 275 (10.7%) |
| 5 to 9 Years | 166 (5.8%) | 82 (3.2%) |
| 10 to 14 Years | 150 (5.2%) | 107 (4.2%) |
| 15 to 19 Years | 295 (10.2%) | 256 (10.0%) |
| 20 to 24 Years | 60 (2.1%) | 297 (11.6%) |
| 25 to 29 Years | 271 (9.4%) | 122 (4.8%) |
| 30 to 34 Years | 324 (11.2%) | 207 (8.1%) |
| 35 to 39 Years | 133 (4.6%) | 170 (6.6%) |
| 40 to 44 Years | 388 (13.4%) | 175 (6.8%) |
| 45 to 49 Years | 104 (3.6%) | 61 (2.4%) |
| 50 to 54 Years | 61 (2.1%) | 137 (5.3%) |
| 55 to 59 Years | 175 (6.1%) | 77 (3.0%) |
| 60 to 64 Years | 238 (8.2%) | 143 (5.6%) |
| 65 to 69 Years | 81 (2.8%) | 122 (4.8%) |
| 70 to 74 Years | 99 (3.4%) | 134 (5.2%) |
| 75 to 79 Years | 51 (1.8%) | 50 (1.9%) |
| 80 to 84 Years | 44 (1.5%) | 86 (3.4%) |
| 85 Years and over | 29 (1.0%) | 68 (2.6%) |
| Total | 2,889 (100.0%) | 2,569 (100.0%) |
Families and Households in Shaw Heights
Median Family Size in Shaw Heights
The median family size in Shaw Heights is 3.79 persons per family, with married-couple families (782 | 67.4%) accounting for the largest median family size of 4.34 persons per family. On the other hand, single female/mother families (189 | 16.3%) represent the smallest median family size with 2.38 persons per family.
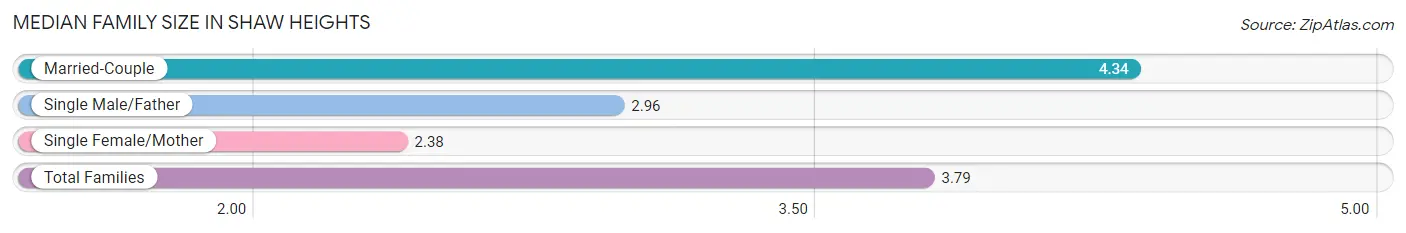
| Family Type | # Families | Family Size |
| Married-Couple | 782 (67.4%) | 4.34 |
| Single Male/Father | 189 (16.3%) | 2.96 |
| Single Female/Mother | 189 (16.3%) | 2.38 |
| Total Families | 1,160 (100.0%) | 3.79 |
Median Household Size in Shaw Heights
The median household size in Shaw Heights is 3.28 persons per household, with married-couple households (782 | 46.9%) accounting for the largest median household size of 4.42 persons per household. non-family households (506 | 30.4%) represent the smallest median household size with 1.40 persons per household.
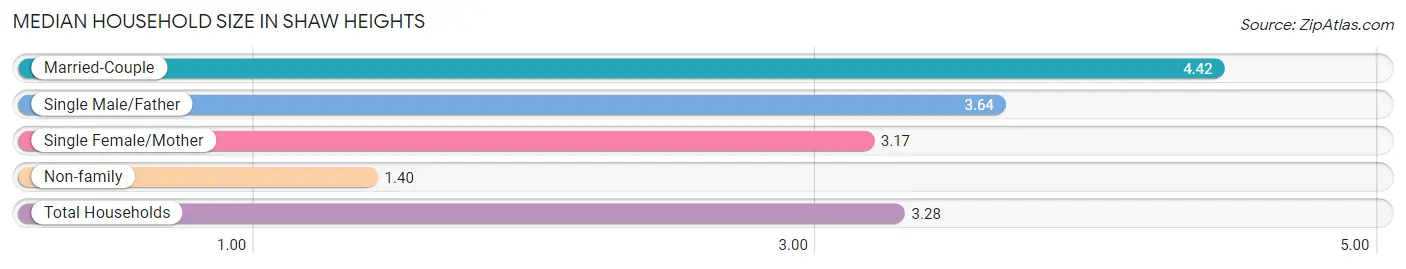
| Household Type | # Households | Household Size |
| Married-Couple | 782 (46.9%) | 4.42 |
| Single Male/Father | 189 (11.3%) | 3.64 |
| Single Female/Mother | 189 (11.3%) | 3.17 |
| Non-family | 506 (30.4%) | 1.40 |
| Total Households | 1,666 (100.0%) | 3.28 |
Household Size by Marriage Status in Shaw Heights
Out of a total of 1,666 households in Shaw Heights, 1,160 (69.6%) are family households, while 506 (30.4%) are nonfamily households. The most numerous type of family households are 4-person households, comprising 330, and the most common type of nonfamily households are 1-person households, comprising 382.
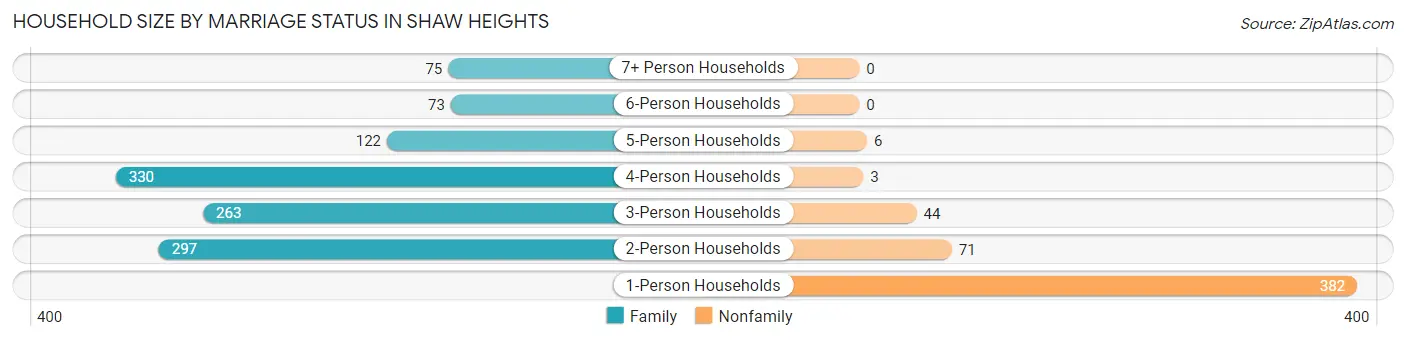
| Household Size | Family Households | Nonfamily Households |
| 1-Person Households | - | 382 (22.9%) |
| 2-Person Households | 297 (17.8%) | 71 (4.3%) |
| 3-Person Households | 263 (15.8%) | 44 (2.6%) |
| 4-Person Households | 330 (19.8%) | 3 (0.2%) |
| 5-Person Households | 122 (7.3%) | 6 (0.4%) |
| 6-Person Households | 73 (4.4%) | 0 (0.0%) |
| 7+ Person Households | 75 (4.5%) | 0 (0.0%) |
| Total | 1,160 (69.6%) | 506 (30.4%) |
Female Fertility in Shaw Heights
Fertility by Age in Shaw Heights
Average fertility rate in Shaw Heights is 74.0 births per 1,000 women. Women in the age bracket of 20 to 34 years have the highest fertility rate with 129.0 births per 1,000 women. Women in the age bracket of 20 to 34 years acount for 81.8% of all women with births.
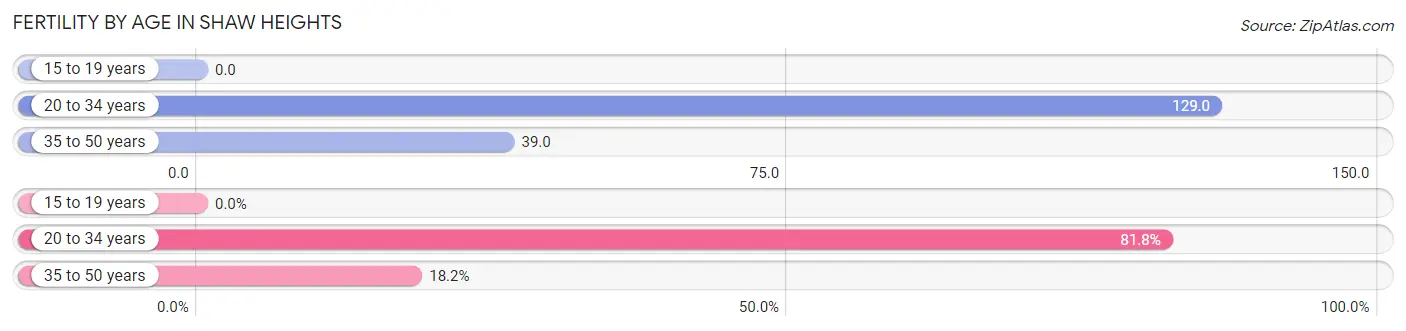
| Age Bracket | Women with Births | Births / 1,000 Women |
| 15 to 19 years | 0 (0.0%) | 0.0 |
| 20 to 34 years | 81 (81.8%) | 129.0 |
| 35 to 50 years | 18 (18.2%) | 39.0 |
| Total | 99 (100.0%) | 74.0 |
Fertility by Age by Marriage Status in Shaw Heights
25.3% of women with births (99) in Shaw Heights are married. The highest percentage of unmarried women with births falls into 20 to 34 years age bracket with 91.4% of them unmarried at the time of birth, while the lowest percentage of unmarried women with births belong to 35 to 50 years age bracket with 0.0% of them unmarried.
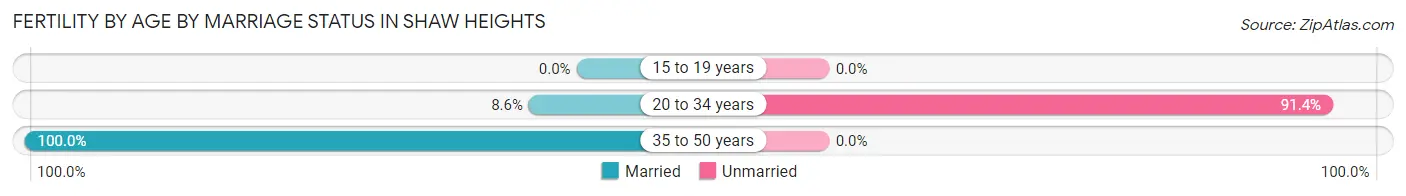
| Age Bracket | Married | Unmarried |
| 15 to 19 years | 0 (0.0%) | 0 (0.0%) |
| 20 to 34 years | 7 (8.6%) | 74 (91.4%) |
| 35 to 50 years | 18 (100.0%) | 0 (0.0%) |
| Total | 25 (25.3%) | 74 (74.8%) |
Fertility by Education in Shaw Heights
Average fertility rate in Shaw Heights is 74.0 births per 1,000 women. Women with the education attainment of bachelor's degree have the highest fertility rate of 235.0 births per 1,000 women, while women with the education attainment of less than high school have the lowest fertility at 26.0 births per 1,000 women. Women with the education attainment of bachelor's degree represent 61.6% of all women with births.
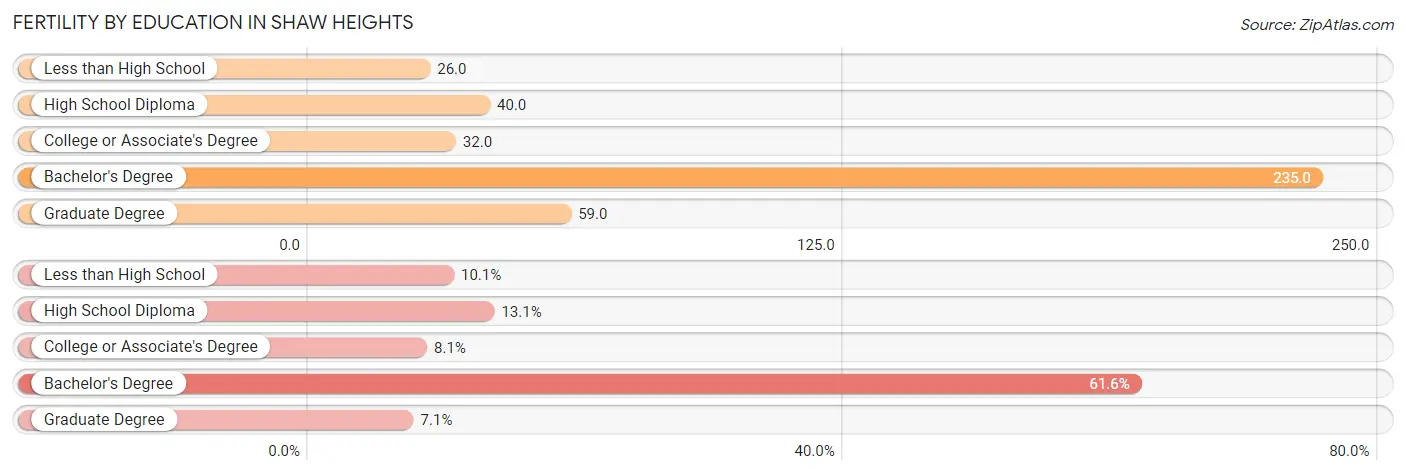
| Educational Attainment | Women with Births | Births / 1,000 Women |
| Less than High School | 10 (10.1%) | 26.0 |
| High School Diploma | 13 (13.1%) | 40.0 |
| College or Associate's Degree | 8 (8.1%) | 32.0 |
| Bachelor's Degree | 61 (61.6%) | 235.0 |
| Graduate Degree | 7 (7.1%) | 59.0 |
| Total | 99 (100.0%) | 74.0 |
Fertility by Education by Marriage Status in Shaw Heights
74.8% of women with births in Shaw Heights are unmarried. Women with the educational attainment of less than high school are most likely to be married with 100.0% of them married at childbirth, while women with the educational attainment of high school diploma are least likely to be married with 100.0% of them unmarried at childbirth.
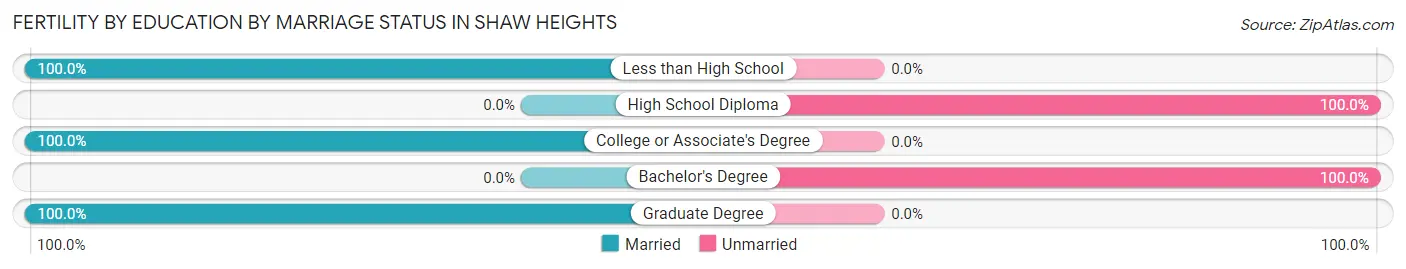
| Educational Attainment | Married | Unmarried |
| Less than High School | 10 (100.0%) | 0 (0.0%) |
| High School Diploma | 0 (0.0%) | 13 (100.0%) |
| College or Associate's Degree | 8 (100.0%) | 0 (0.0%) |
| Bachelor's Degree | 0 (0.0%) | 61 (100.0%) |
| Graduate Degree | 7 (100.0%) | 0 (0.0%) |
| Total | 25 (25.3%) | 74 (74.8%) |
Employment Characteristics in Shaw Heights
Employment by Class of Employer in Shaw Heights
Among the 2,663 employed individuals in Shaw Heights, private company employees (2,168 | 81.4%), not-for-profit organizations (139 | 5.2%), and local government employees (128 | 4.8%) make up the most common classes of employment.
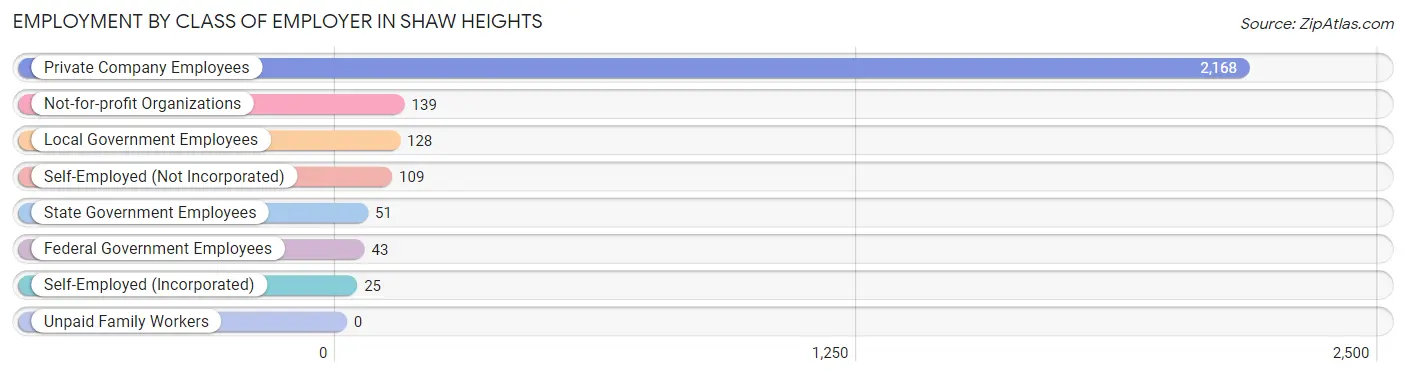
| Employer Class | # Employees | % Employees |
| Private Company Employees | 2,168 | 81.4% |
| Self-Employed (Incorporated) | 25 | 0.9% |
| Self-Employed (Not Incorporated) | 109 | 4.1% |
| Not-for-profit Organizations | 139 | 5.2% |
| Local Government Employees | 128 | 4.8% |
| State Government Employees | 51 | 1.9% |
| Federal Government Employees | 43 | 1.6% |
| Unpaid Family Workers | 0 | 0.0% |
| Total | 2,663 | 100.0% |
Employment Status by Age in Shaw Heights
According to the labor force statistics for Shaw Heights, out of the total population over 16 years of age (4,364), 67.6% or 2,950 individuals are in the labor force, with 2.8% or 83 of them unemployed. The age group with the highest labor force participation rate is 25 to 29 years, with 99.7% or 392 individuals in the labor force. Within the labor force, the 45 to 54 years age range has the highest percentage of unemployed individuals, with 10.2% or 33 of them being unemployed.
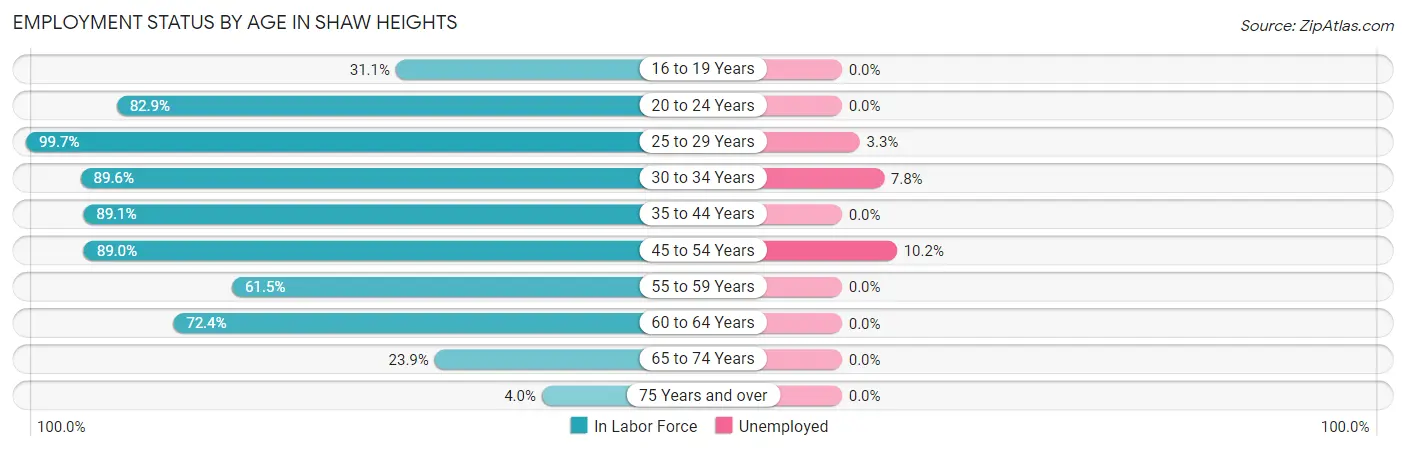
| Age Bracket | In Labor Force | Unemployed |
| 16 to 19 Years | 142 (31.1%) | 0 (0.0%) |
| 20 to 24 Years | 296 (82.9%) | 0 (0.0%) |
| 25 to 29 Years | 392 (99.7%) | 13 (3.3%) |
| 30 to 34 Years | 476 (89.6%) | 37 (7.8%) |
| 35 to 44 Years | 772 (89.1%) | 0 (0.0%) |
| 45 to 54 Years | 323 (89.0%) | 33 (10.2%) |
| 55 to 59 Years | 155 (61.5%) | 0 (0.0%) |
| 60 to 64 Years | 276 (72.4%) | 0 (0.0%) |
| 65 to 74 Years | 104 (23.9%) | 0 (0.0%) |
| 75 Years and over | 13 (4.0%) | 0 (0.0%) |
| Total | 2,950 (67.6%) | 83 (2.8%) |
Employment Status by Educational Attainment in Shaw Heights
According to labor force statistics for Shaw Heights, 85.9% of individuals (2,393) out of the total population between 25 and 64 years of age (2,786) are in the labor force, with 3.5% or 84 of them being unemployed. The group with the highest labor force participation rate are those with the educational attainment of bachelor's degree or higher, with 96.2% or 626 individuals in the labor force. Within the labor force, individuals with bachelor's degree or higher education have the highest percentage of unemployment, with 4.5% or 28 of them being unemployed.
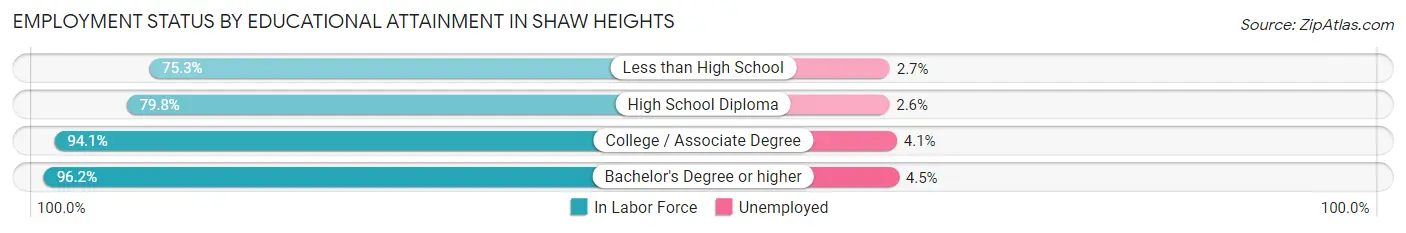
| Educational Attainment | In Labor Force | Unemployed |
| Less than High School | 484 (75.3%) | 17 (2.7%) |
| High School Diploma | 667 (79.8%) | 22 (2.6%) |
| College / Associate Degree | 617 (94.1%) | 27 (4.1%) |
| Bachelor's Degree or higher | 626 (96.2%) | 29 (4.5%) |
| Total | 2,393 (85.9%) | 98 (3.5%) |
Employment Occupations by Sex in Shaw Heights
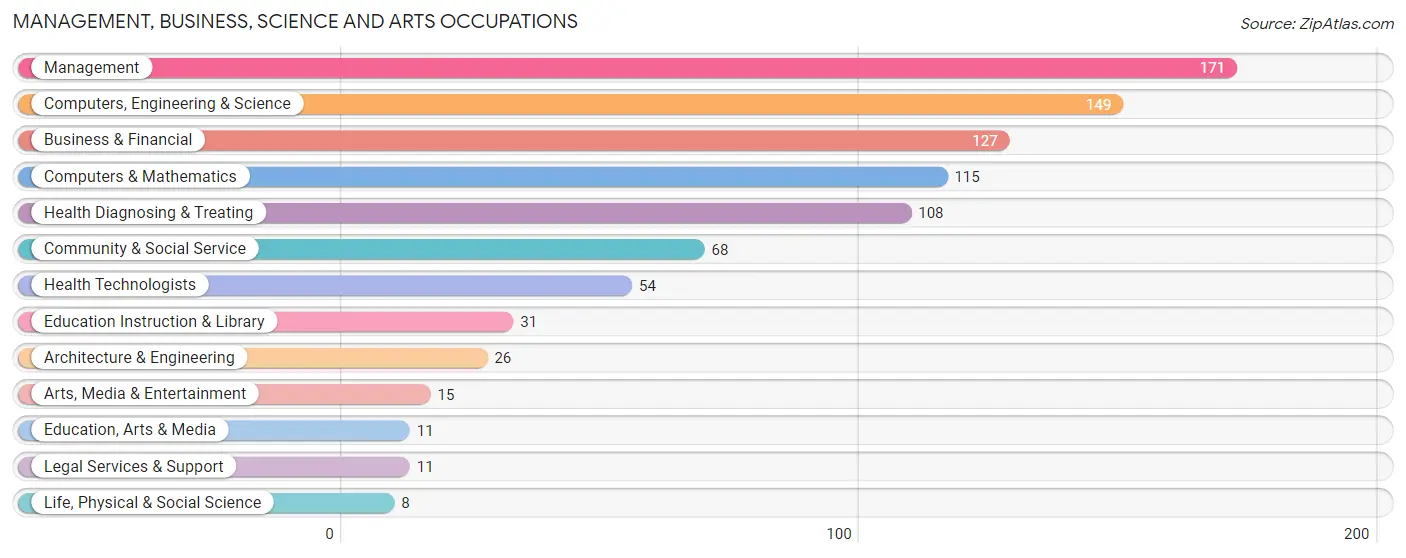
Management, Business, Science and Arts Occupations
The most common Management, Business, Science and Arts occupations in Shaw Heights are Management (171 | 6.0%), Computers, Engineering & Science (149 | 5.2%), Business & Financial (127 | 4.4%), Computers & Mathematics (115 | 4.0%), and Health Diagnosing & Treating (108 | 3.8%).
Management, Business, Science and Arts Occupations by Sex
Within the Management, Business, Science and Arts occupations in Shaw Heights, the most male-oriented occupations are Architecture & Engineering (100.0%), Life, Physical & Social Science (100.0%), and Arts, Media & Entertainment (100.0%), while the most female-oriented occupations are Education, Arts & Media (100.0%), Legal Services & Support (100.0%), and Education Instruction & Library (100.0%).
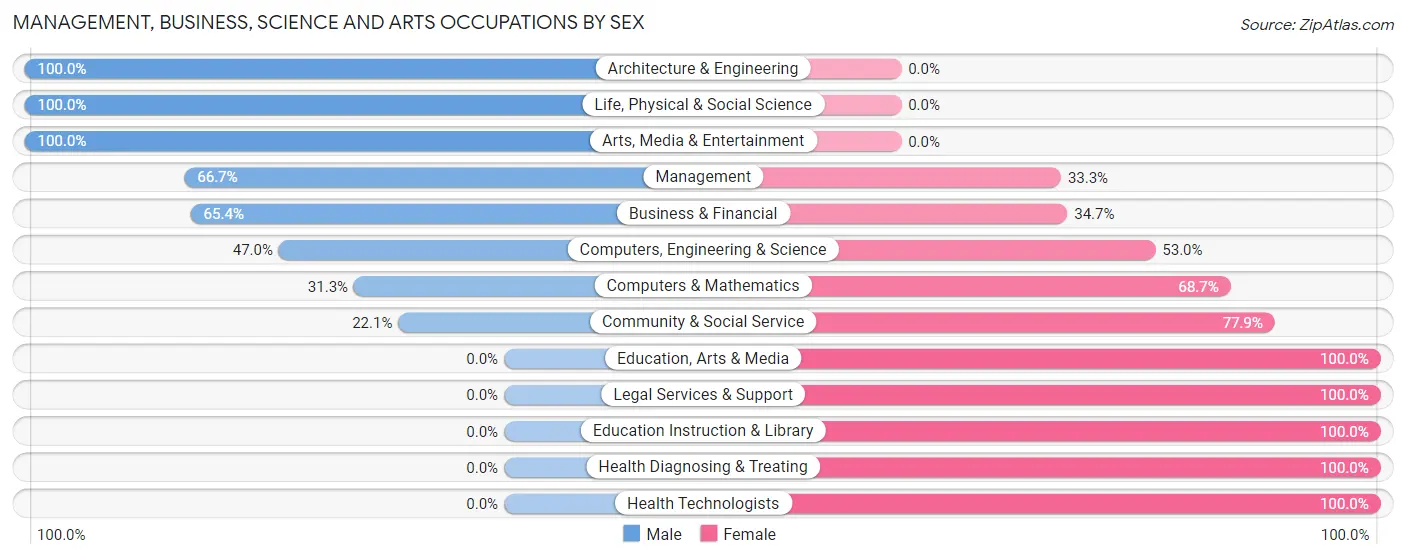
| Occupation | Male | Female |
| Management | 114 (66.7%) | 57 (33.3%) |
| Business & Financial | 83 (65.3%) | 44 (34.6%) |
| Computers, Engineering & Science | 70 (47.0%) | 79 (53.0%) |
| Computers & Mathematics | 36 (31.3%) | 79 (68.7%) |
| Architecture & Engineering | 26 (100.0%) | 0 (0.0%) |
| Life, Physical & Social Science | 8 (100.0%) | 0 (0.0%) |
| Community & Social Service | 15 (22.1%) | 53 (77.9%) |
| Education, Arts & Media | 0 (0.0%) | 11 (100.0%) |
| Legal Services & Support | 0 (0.0%) | 11 (100.0%) |
| Education Instruction & Library | 0 (0.0%) | 31 (100.0%) |
| Arts, Media & Entertainment | 15 (100.0%) | 0 (0.0%) |
| Health Diagnosing & Treating | 0 (0.0%) | 108 (100.0%) |
| Health Technologists | 0 (0.0%) | 54 (100.0%) |
| Total (Category) | 282 (45.3%) | 341 (54.7%) |
| Total (Overall) | 1,609 (56.2%) | 1,253 (43.8%) |
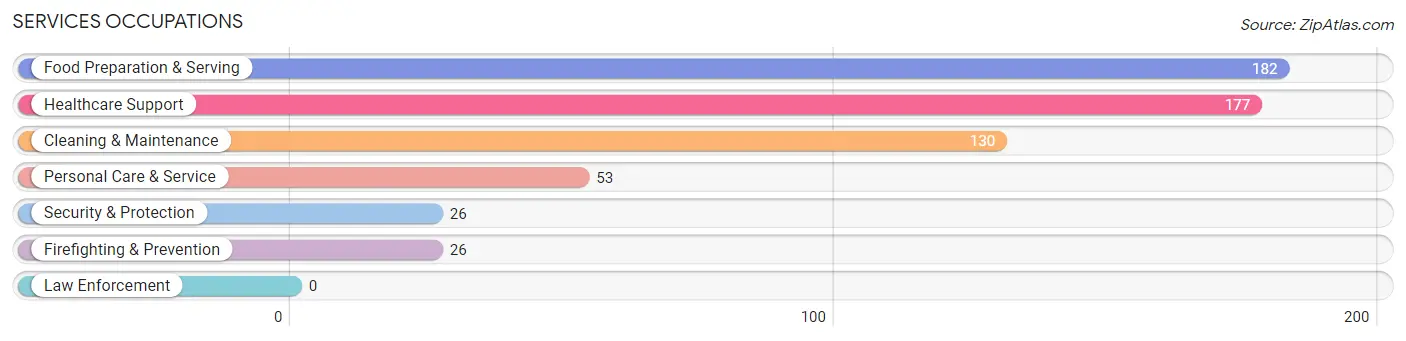
Services Occupations
The most common Services occupations in Shaw Heights are Food Preparation & Serving (182 | 6.4%), Healthcare Support (177 | 6.2%), Cleaning & Maintenance (130 | 4.5%), Personal Care & Service (53 | 1.8%), and Security & Protection (26 | 0.9%).
Services Occupations by Sex
Within the Services occupations in Shaw Heights, the most male-oriented occupations are Security & Protection (100.0%), Firefighting & Prevention (100.0%), and Food Preparation & Serving (68.1%), while the most female-oriented occupations are Personal Care & Service (100.0%), Healthcare Support (94.9%), and Cleaning & Maintenance (65.4%).
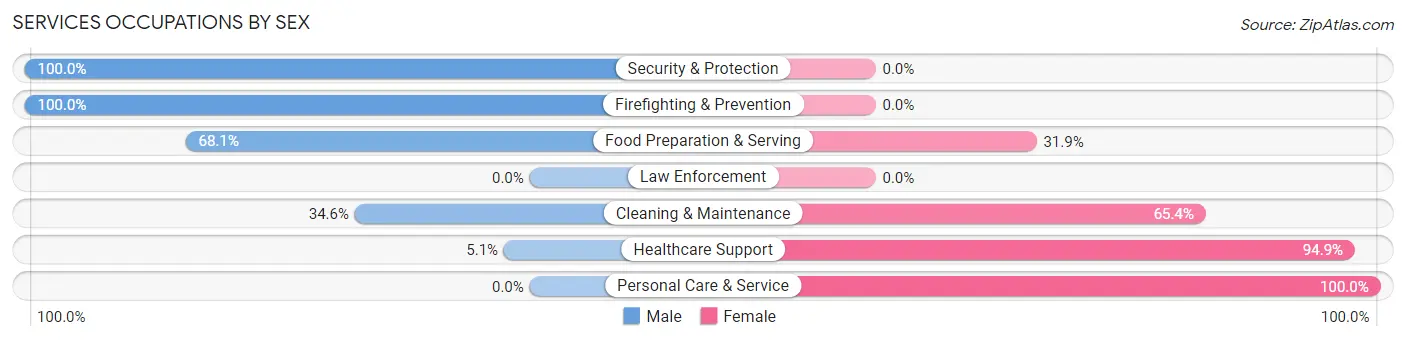
| Occupation | Male | Female |
| Healthcare Support | 9 (5.1%) | 168 (94.9%) |
| Security & Protection | 26 (100.0%) | 0 (0.0%) |
| Firefighting & Prevention | 26 (100.0%) | 0 (0.0%) |
| Law Enforcement | 0 (0.0%) | 0 (0.0%) |
| Food Preparation & Serving | 124 (68.1%) | 58 (31.9%) |
| Cleaning & Maintenance | 45 (34.6%) | 85 (65.4%) |
| Personal Care & Service | 0 (0.0%) | 53 (100.0%) |
| Total (Category) | 204 (35.9%) | 364 (64.1%) |
| Total (Overall) | 1,609 (56.2%) | 1,253 (43.8%) |
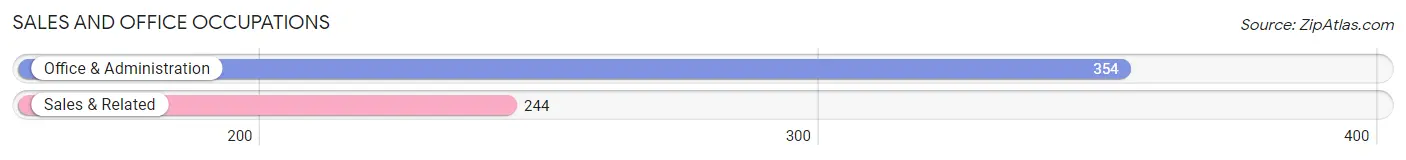
Sales and Office Occupations
The most common Sales and Office occupations in Shaw Heights are Office & Administration (354 | 12.4%), and Sales & Related (244 | 8.5%).
Sales and Office Occupations by Sex
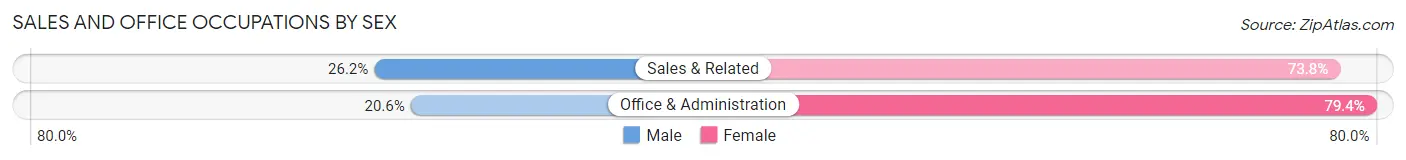
| Occupation | Male | Female |
| Sales & Related | 64 (26.2%) | 180 (73.8%) |
| Office & Administration | 73 (20.6%) | 281 (79.4%) |
| Total (Category) | 137 (22.9%) | 461 (77.1%) |
| Total (Overall) | 1,609 (56.2%) | 1,253 (43.8%) |
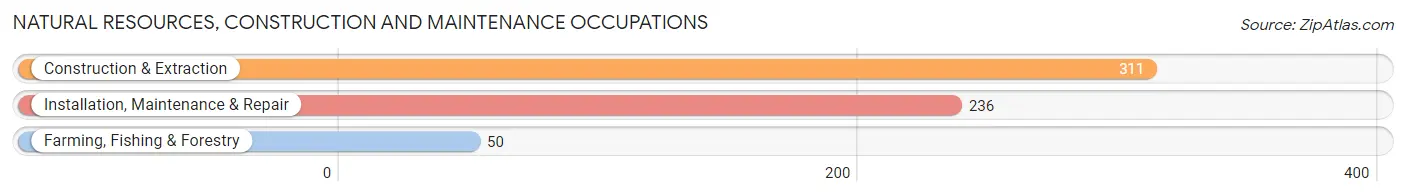
Natural Resources, Construction and Maintenance Occupations
The most common Natural Resources, Construction and Maintenance occupations in Shaw Heights are Construction & Extraction (311 | 10.9%), Installation, Maintenance & Repair (236 | 8.3%), and Farming, Fishing & Forestry (50 | 1.8%).
Natural Resources, Construction and Maintenance Occupations by Sex
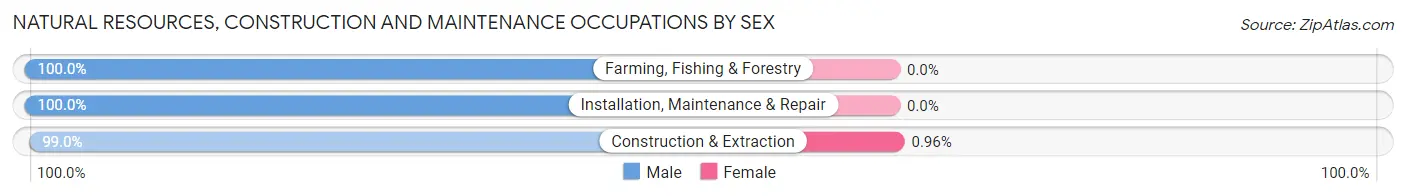
| Occupation | Male | Female |
| Farming, Fishing & Forestry | 50 (100.0%) | 0 (0.0%) |
| Construction & Extraction | 308 (99.0%) | 3 (1.0%) |
| Installation, Maintenance & Repair | 236 (100.0%) | 0 (0.0%) |
| Total (Category) | 594 (99.5%) | 3 (0.5%) |
| Total (Overall) | 1,609 (56.2%) | 1,253 (43.8%) |
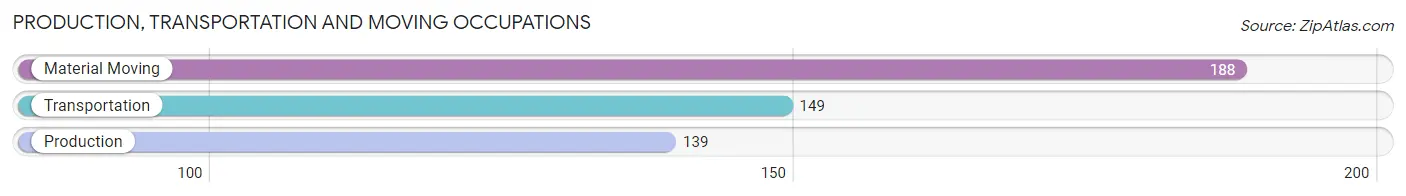
Production, Transportation and Moving Occupations
The most common Production, Transportation and Moving occupations in Shaw Heights are Material Moving (188 | 6.6%), Transportation (149 | 5.2%), and Production (139 | 4.9%).
Production, Transportation and Moving Occupations by Sex
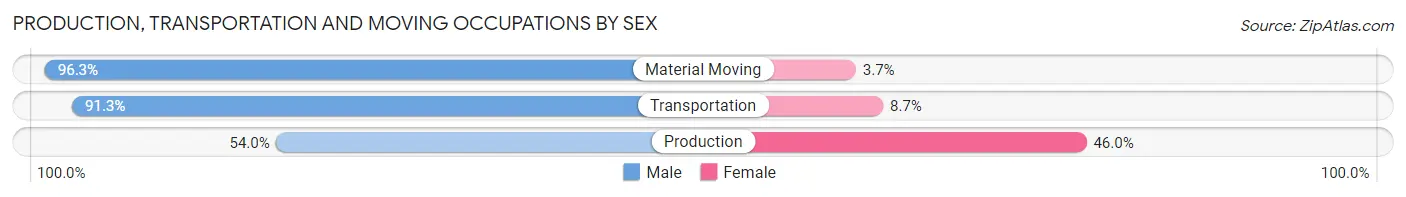
| Occupation | Male | Female |
| Production | 75 (54.0%) | 64 (46.0%) |
| Transportation | 136 (91.3%) | 13 (8.7%) |
| Material Moving | 181 (96.3%) | 7 (3.7%) |
| Total (Category) | 392 (82.4%) | 84 (17.6%) |
| Total (Overall) | 1,609 (56.2%) | 1,253 (43.8%) |
Employment Industries by Sex in Shaw Heights
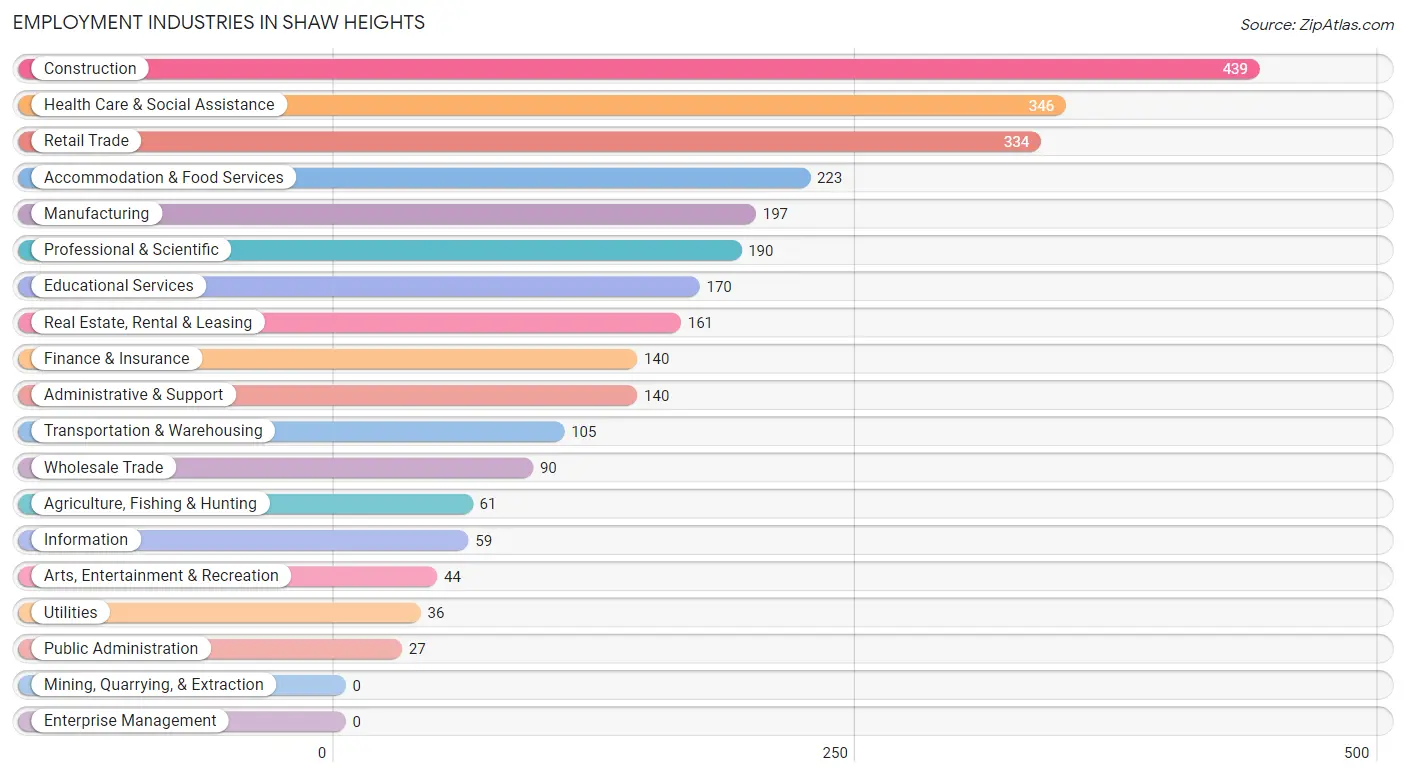
Employment Industries in Shaw Heights
The major employment industries in Shaw Heights include Construction (439 | 15.3%), Health Care & Social Assistance (346 | 12.1%), Retail Trade (334 | 11.7%), Accommodation & Food Services (223 | 7.8%), and Manufacturing (197 | 6.9%).
Employment Industries by Sex in Shaw Heights
The Shaw Heights industries that see more men than women are Construction (97.3%), Real Estate, Rental & Leasing (88.2%), and Wholesale Trade (82.2%), whereas the industries that tend to have a higher number of women are Utilities (100.0%), Finance & Insurance (95.0%), and Health Care & Social Assistance (87.9%).
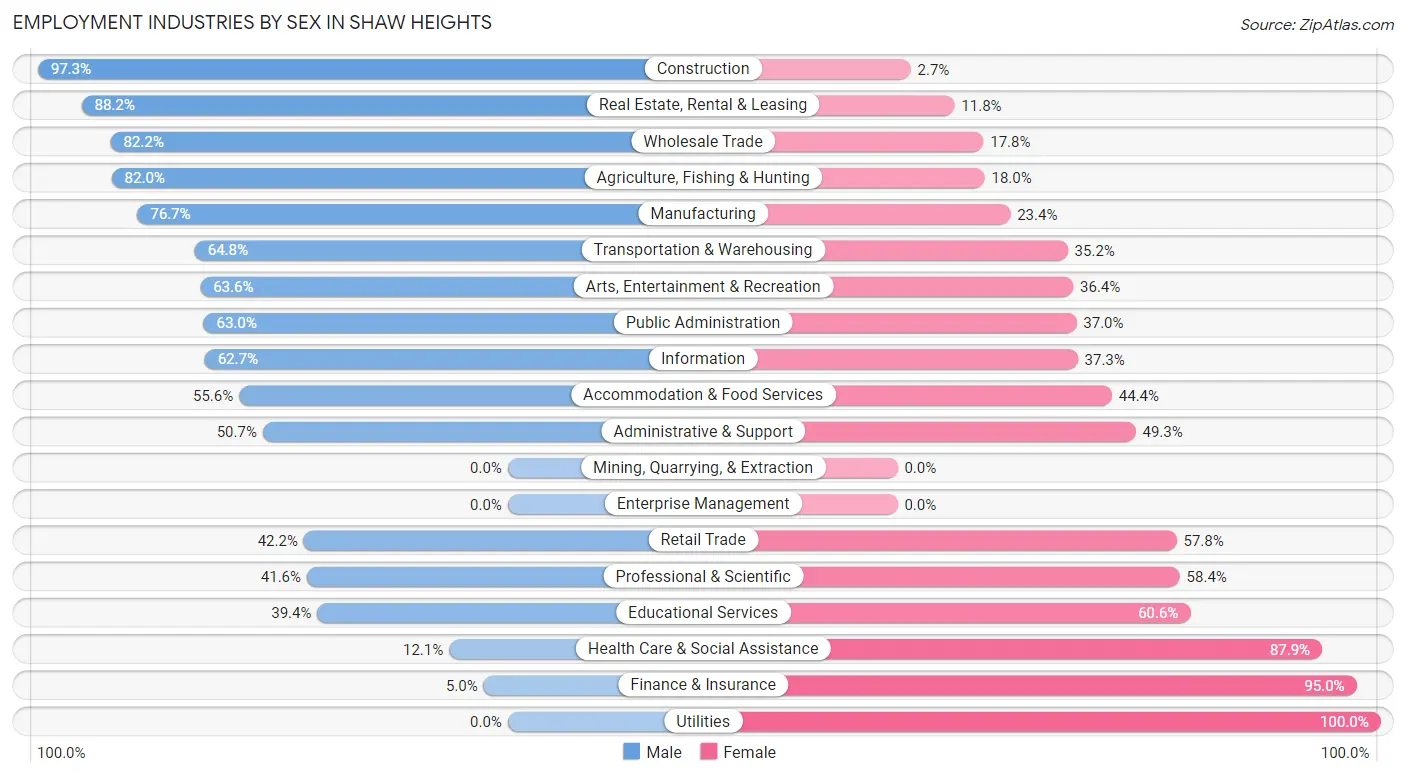
| Industry | Male | Female |
| Agriculture, Fishing & Hunting | 50 (82.0%) | 11 (18.0%) |
| Mining, Quarrying, & Extraction | 0 (0.0%) | 0 (0.0%) |
| Construction | 427 (97.3%) | 12 (2.7%) |
| Manufacturing | 151 (76.6%) | 46 (23.4%) |
| Wholesale Trade | 74 (82.2%) | 16 (17.8%) |
| Retail Trade | 141 (42.2%) | 193 (57.8%) |
| Transportation & Warehousing | 68 (64.8%) | 37 (35.2%) |
| Utilities | 0 (0.0%) | 36 (100.0%) |
| Information | 37 (62.7%) | 22 (37.3%) |
| Finance & Insurance | 7 (5.0%) | 133 (95.0%) |
| Real Estate, Rental & Leasing | 142 (88.2%) | 19 (11.8%) |
| Professional & Scientific | 79 (41.6%) | 111 (58.4%) |
| Enterprise Management | 0 (0.0%) | 0 (0.0%) |
| Administrative & Support | 71 (50.7%) | 69 (49.3%) |
| Educational Services | 67 (39.4%) | 103 (60.6%) |
| Health Care & Social Assistance | 42 (12.1%) | 304 (87.9%) |
| Arts, Entertainment & Recreation | 28 (63.6%) | 16 (36.4%) |
| Accommodation & Food Services | 124 (55.6%) | 99 (44.4%) |
| Public Administration | 17 (63.0%) | 10 (37.0%) |
| Total | 1,609 (56.2%) | 1,253 (43.8%) |
Education in Shaw Heights
School Enrollment in Shaw Heights
The most common levels of schooling among the 1,198 students in Shaw Heights are high school (413 | 34.5%), middle school (218 | 18.2%), and college / undergraduate (176 | 14.7%).
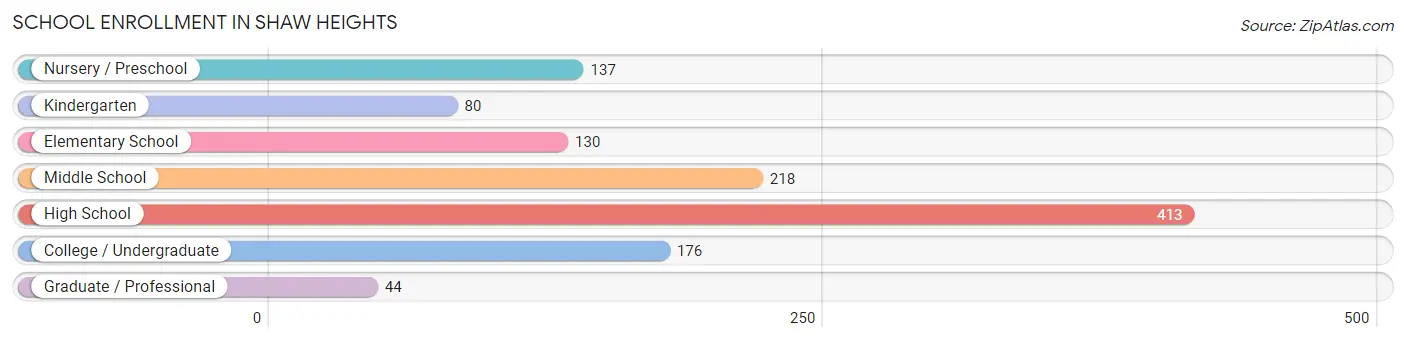
| School Level | # Students | % Students |
| Nursery / Preschool | 137 | 11.4% |
| Kindergarten | 80 | 6.7% |
| Elementary School | 130 | 10.8% |
| Middle School | 218 | 18.2% |
| High School | 413 | 34.5% |
| College / Undergraduate | 176 | 14.7% |
| Graduate / Professional | 44 | 3.7% |
| Total | 1,198 | 100.0% |
School Enrollment by Age by Funding Source in Shaw Heights
Out of a total of 1,198 students who are enrolled in schools in Shaw Heights, 107 (8.9%) attend a private institution, while the remaining 1,091 (91.1%) are enrolled in public schools. The age group of 20 to 24 year olds has the highest likelihood of being enrolled in private schools, with 20 (21.3% in the age bracket) enrolled. Conversely, the age group of 3 to 4 year olds has the lowest likelihood of being enrolled in a private school, with 92 (100.0% in the age bracket) attending a public institution.
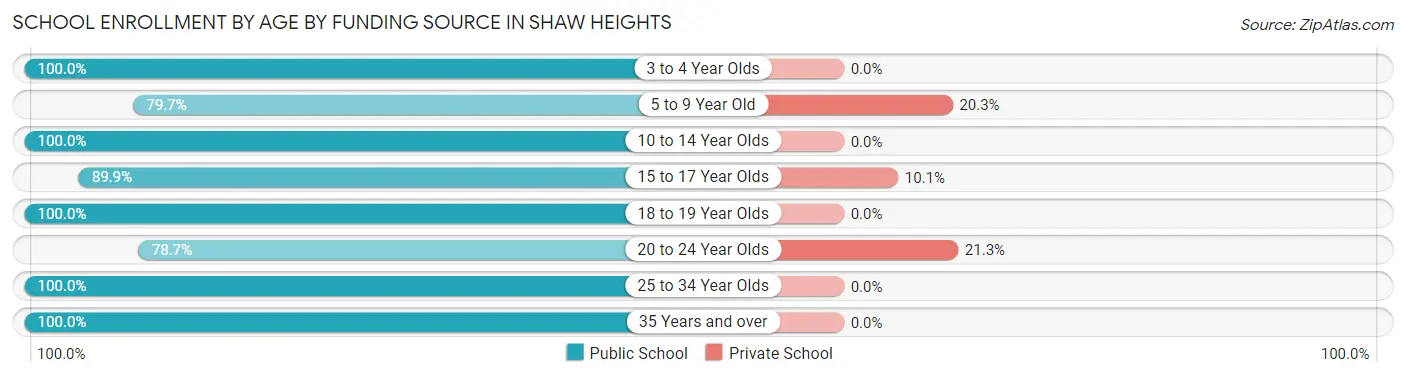
| Age Bracket | Public School | Private School |
| 3 to 4 Year Olds | 92 (100.0%) | 0 (0.0%) |
| 5 to 9 Year Old | 185 (79.7%) | 47 (20.3%) |
| 10 to 14 Year Olds | 241 (100.0%) | 0 (0.0%) |
| 15 to 17 Year Olds | 356 (89.9%) | 40 (10.1%) |
| 18 to 19 Year Olds | 44 (100.0%) | 0 (0.0%) |
| 20 to 24 Year Olds | 74 (78.7%) | 20 (21.3%) |
| 25 to 34 Year Olds | 11 (100.0%) | 0 (0.0%) |
| 35 Years and over | 88 (100.0%) | 0 (0.0%) |
| Total | 1,091 (91.1%) | 107 (8.9%) |
Educational Attainment by Field of Study in Shaw Heights
Education (158 | 18.0%), business (140 | 16.0%), liberal arts & history (86 | 9.8%), arts & humanities (81 | 9.2%), and engineering (73 | 8.3%) are the most common fields of study among 878 individuals in Shaw Heights who have obtained a bachelor's degree or higher.
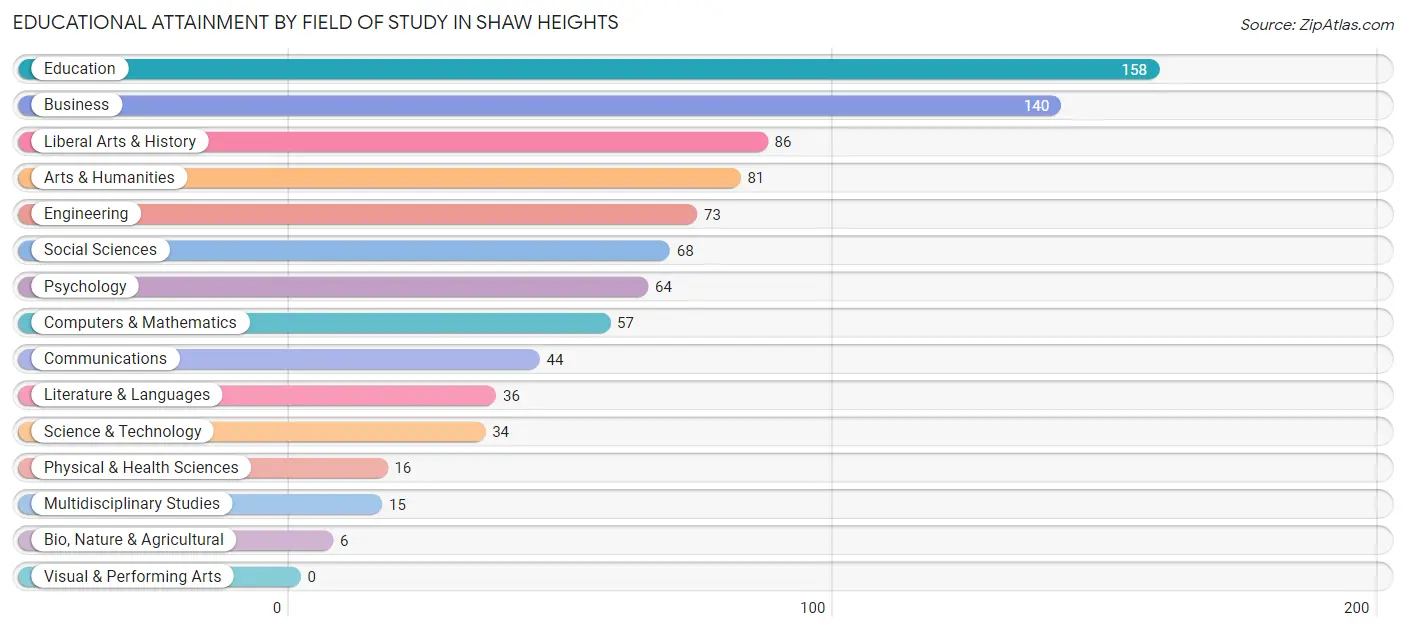
| Field of Study | # Graduates | % Graduates |
| Computers & Mathematics | 57 | 6.5% |
| Bio, Nature & Agricultural | 6 | 0.7% |
| Physical & Health Sciences | 16 | 1.8% |
| Psychology | 64 | 7.3% |
| Social Sciences | 68 | 7.7% |
| Engineering | 73 | 8.3% |
| Multidisciplinary Studies | 15 | 1.7% |
| Science & Technology | 34 | 3.9% |
| Business | 140 | 16.0% |
| Education | 158 | 18.0% |
| Literature & Languages | 36 | 4.1% |
| Liberal Arts & History | 86 | 9.8% |
| Visual & Performing Arts | 0 | 0.0% |
| Communications | 44 | 5.0% |
| Arts & Humanities | 81 | 9.2% |
| Total | 878 | 100.0% |
Transportation & Commute in Shaw Heights
Vehicle Availability by Sex in Shaw Heights
The most prevalent vehicle ownership categories in Shaw Heights are males with 3 vehicles (590, accounting for 39.7%) and females with 3 vehicles (324, making up 50.2%).
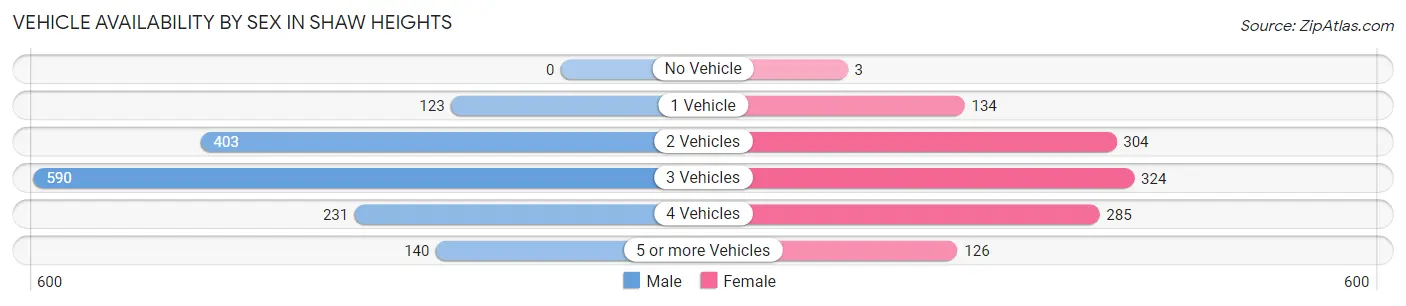
| Vehicles Available | Male | Female |
| No Vehicle | 0 (0.0%) | 3 (0.3%) |
| 1 Vehicle | 123 (8.3%) | 134 (11.4%) |
| 2 Vehicles | 403 (27.1%) | 304 (25.9%) |
| 3 Vehicles | 590 (39.7%) | 324 (27.6%) |
| 4 Vehicles | 231 (15.5%) | 285 (24.2%) |
| 5 or more Vehicles | 140 (9.4%) | 126 (10.7%) |
| Total | 1,487 (100.0%) | 1,176 (100.0%) |
Commute Time in Shaw Heights
The most frequently occuring commute durations in Shaw Heights are 30 to 34 minutes (401 commuters, 17.4%), 15 to 19 minutes (366 commuters, 15.9%), and 20 to 24 minutes (325 commuters, 14.1%).
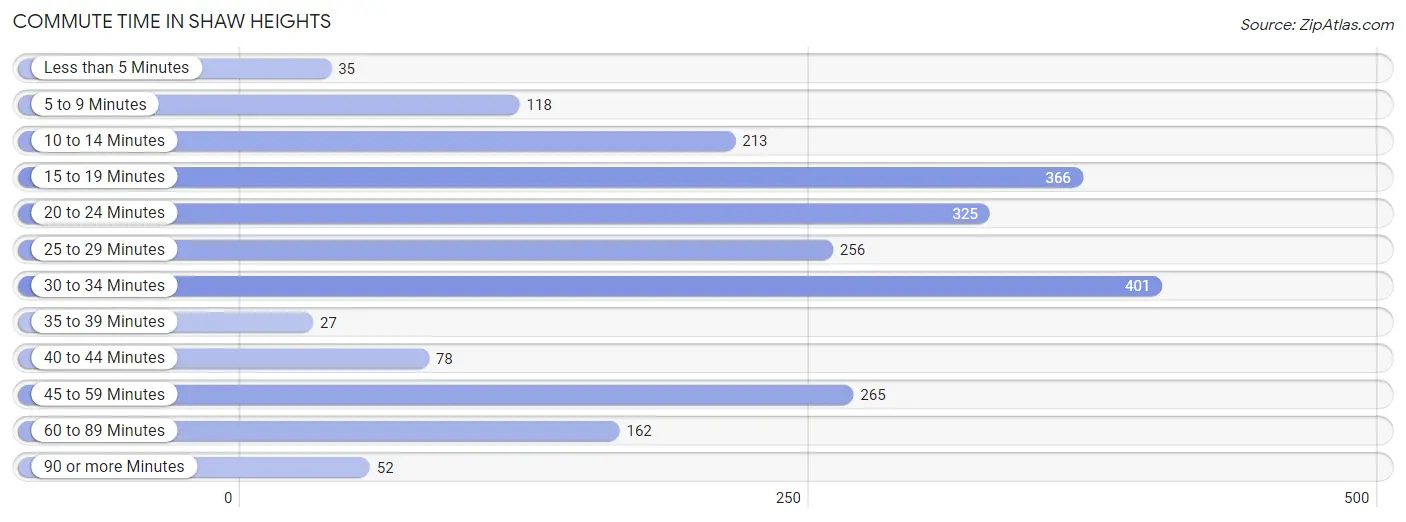
| Commute Time | # Commuters | % Commuters |
| Less than 5 Minutes | 35 | 1.5% |
| 5 to 9 Minutes | 118 | 5.1% |
| 10 to 14 Minutes | 213 | 9.3% |
| 15 to 19 Minutes | 366 | 15.9% |
| 20 to 24 Minutes | 325 | 14.1% |
| 25 to 29 Minutes | 256 | 11.1% |
| 30 to 34 Minutes | 401 | 17.4% |
| 35 to 39 Minutes | 27 | 1.2% |
| 40 to 44 Minutes | 78 | 3.4% |
| 45 to 59 Minutes | 265 | 11.5% |
| 60 to 89 Minutes | 162 | 7.0% |
| 90 or more Minutes | 52 | 2.3% |
Commute Time by Sex in Shaw Heights
The most common commute times in Shaw Heights are 30 to 34 minutes (246 commuters, 18.1%) for males and 20 to 24 minutes (167 commuters, 17.8%) for females.
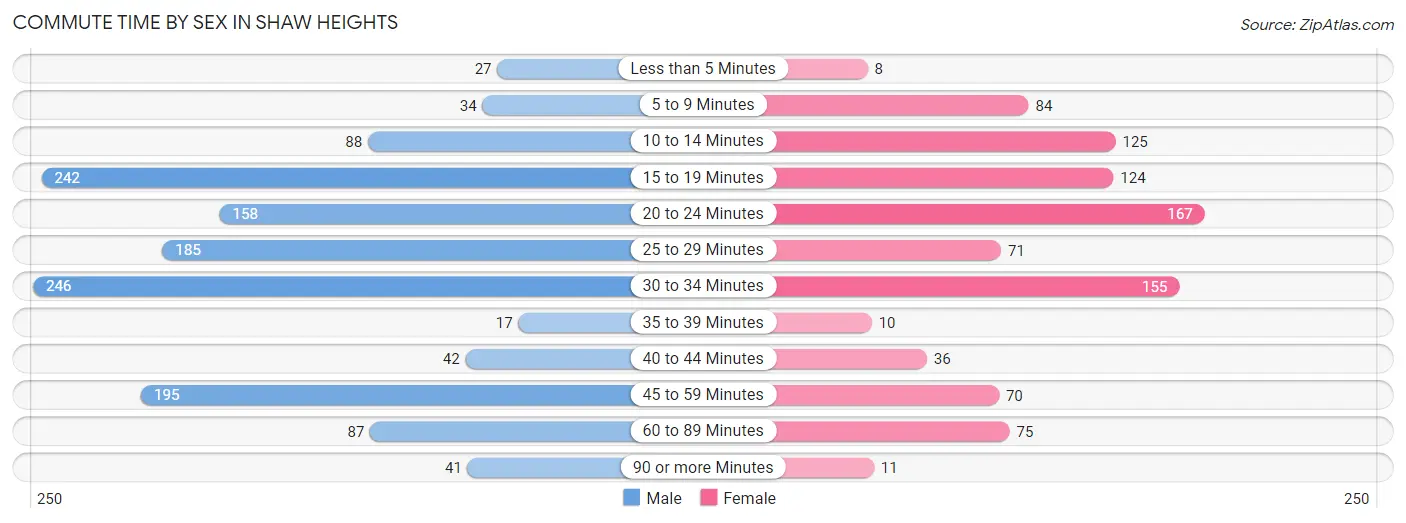
| Commute Time | Male | Female |
| Less than 5 Minutes | 27 (2.0%) | 8 (0.9%) |
| 5 to 9 Minutes | 34 (2.5%) | 84 (9.0%) |
| 10 to 14 Minutes | 88 (6.5%) | 125 (13.4%) |
| 15 to 19 Minutes | 242 (17.8%) | 124 (13.3%) |
| 20 to 24 Minutes | 158 (11.6%) | 167 (17.8%) |
| 25 to 29 Minutes | 185 (13.6%) | 71 (7.6%) |
| 30 to 34 Minutes | 246 (18.1%) | 155 (16.6%) |
| 35 to 39 Minutes | 17 (1.3%) | 10 (1.1%) |
| 40 to 44 Minutes | 42 (3.1%) | 36 (3.8%) |
| 45 to 59 Minutes | 195 (14.3%) | 70 (7.5%) |
| 60 to 89 Minutes | 87 (6.4%) | 75 (8.0%) |
| 90 or more Minutes | 41 (3.0%) | 11 (1.2%) |
Time of Departure to Work by Sex in Shaw Heights
The most frequent times of departure to work in Shaw Heights are 7:00 AM to 7:29 AM (340, 25.0%) for males and 7:00 AM to 7:29 AM (165, 17.6%) for females.
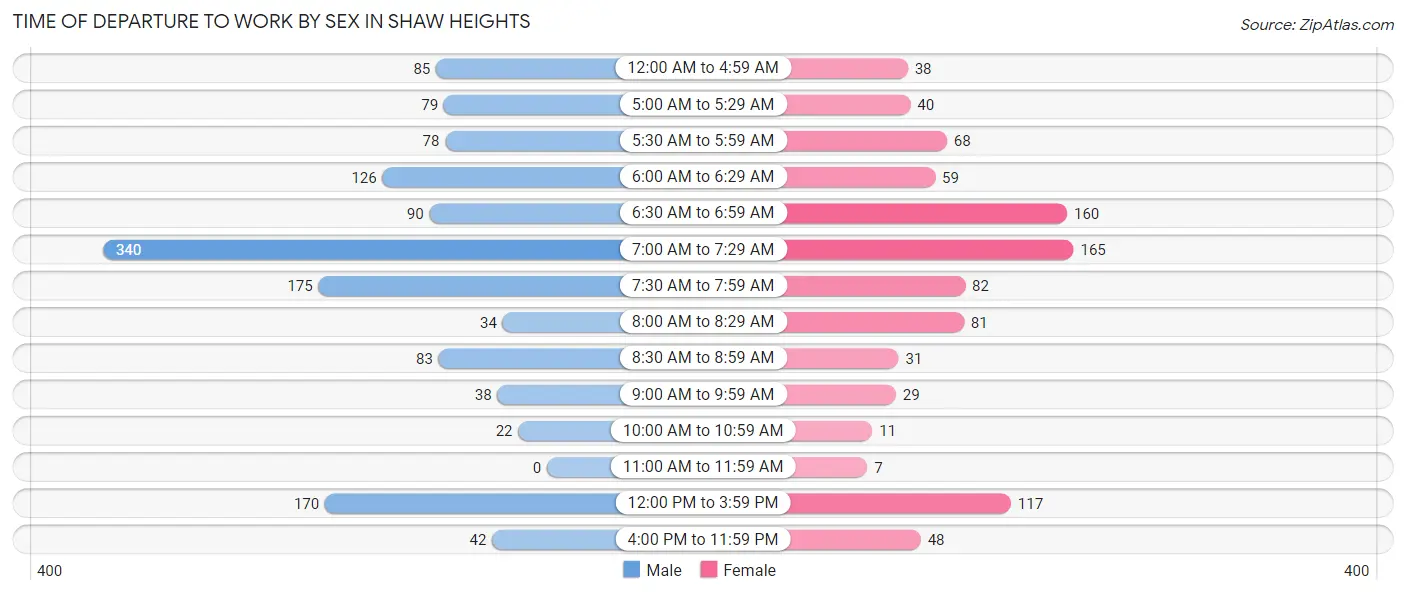
| Time of Departure | Male | Female |
| 12:00 AM to 4:59 AM | 85 (6.2%) | 38 (4.1%) |
| 5:00 AM to 5:29 AM | 79 (5.8%) | 40 (4.3%) |
| 5:30 AM to 5:59 AM | 78 (5.7%) | 68 (7.3%) |
| 6:00 AM to 6:29 AM | 126 (9.2%) | 59 (6.3%) |
| 6:30 AM to 6:59 AM | 90 (6.6%) | 160 (17.1%) |
| 7:00 AM to 7:29 AM | 340 (25.0%) | 165 (17.6%) |
| 7:30 AM to 7:59 AM | 175 (12.9%) | 82 (8.8%) |
| 8:00 AM to 8:29 AM | 34 (2.5%) | 81 (8.6%) |
| 8:30 AM to 8:59 AM | 83 (6.1%) | 31 (3.3%) |
| 9:00 AM to 9:59 AM | 38 (2.8%) | 29 (3.1%) |
| 10:00 AM to 10:59 AM | 22 (1.6%) | 11 (1.2%) |
| 11:00 AM to 11:59 AM | 0 (0.0%) | 7 (0.7%) |
| 12:00 PM to 3:59 PM | 170 (12.5%) | 117 (12.5%) |
| 4:00 PM to 11:59 PM | 42 (3.1%) | 48 (5.1%) |
| Total | 1,362 (100.0%) | 936 (100.0%) |
Housing Occupancy in Shaw Heights
Occupancy by Ownership in Shaw Heights
Of the total 1,666 dwellings in Shaw Heights, owner-occupied units account for 1,326 (79.6%), while renter-occupied units make up 340 (20.4%).
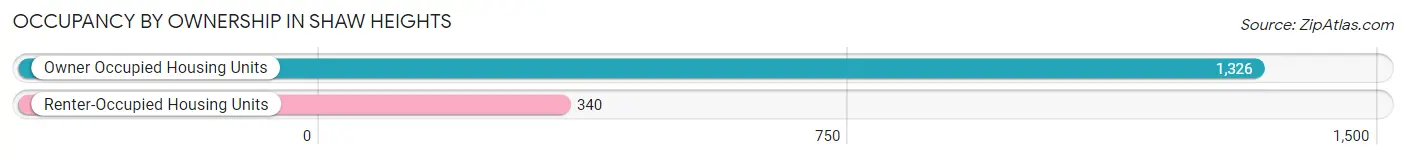
| Occupancy | # Housing Units | % Housing Units |
| Owner Occupied Housing Units | 1,326 | 79.6% |
| Renter-Occupied Housing Units | 340 | 20.4% |
| Total Occupied Housing Units | 1,666 | 100.0% |
Occupancy by Household Size in Shaw Heights
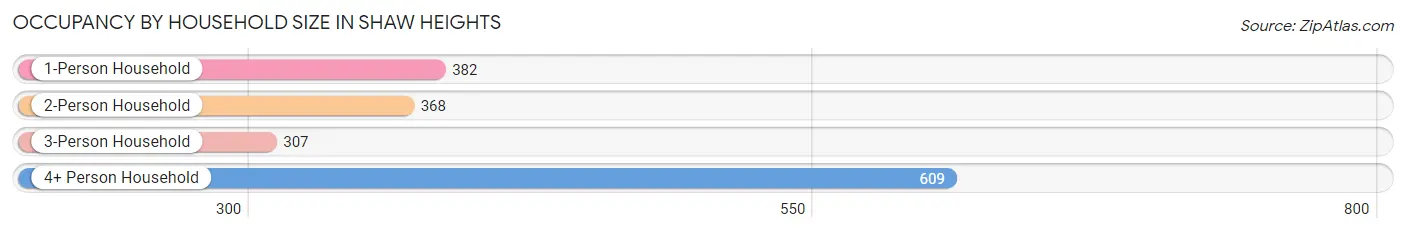
| Household Size | # Housing Units | % Housing Units |
| 1-Person Household | 382 | 22.9% |
| 2-Person Household | 368 | 22.1% |
| 3-Person Household | 307 | 18.4% |
| 4+ Person Household | 609 | 36.5% |
| Total Housing Units | 1,666 | 100.0% |
Occupancy by Ownership by Household Size in Shaw Heights
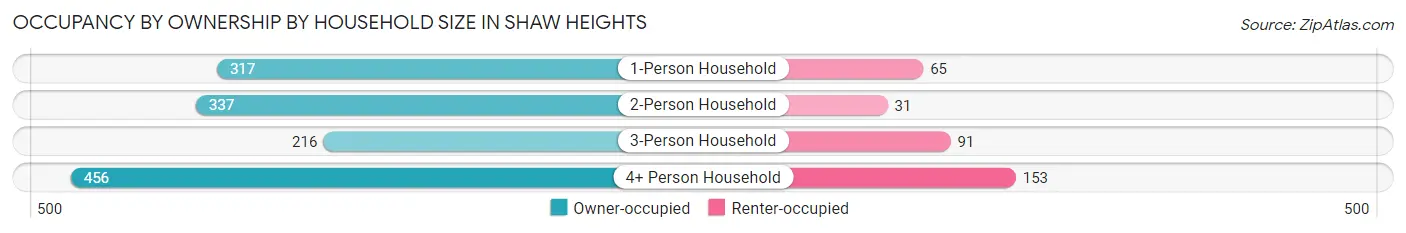
| Household Size | Owner-occupied | Renter-occupied |
| 1-Person Household | 317 (83.0%) | 65 (17.0%) |
| 2-Person Household | 337 (91.6%) | 31 (8.4%) |
| 3-Person Household | 216 (70.4%) | 91 (29.6%) |
| 4+ Person Household | 456 (74.9%) | 153 (25.1%) |
| Total Housing Units | 1,326 (79.6%) | 340 (20.4%) |
Occupancy by Educational Attainment in Shaw Heights
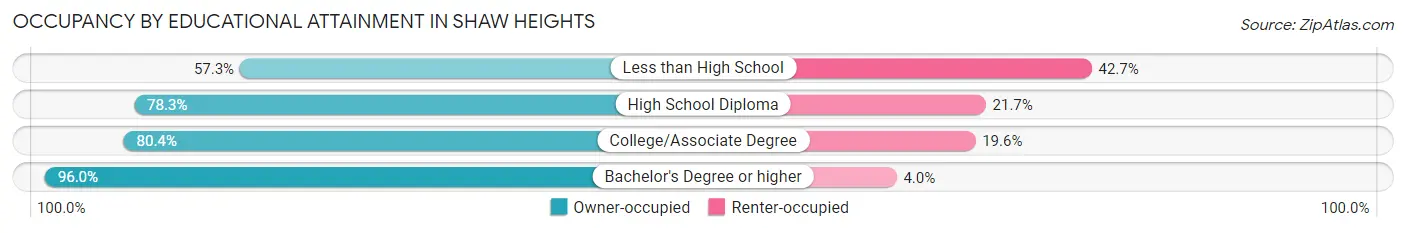
| Household Size | Owner-occupied | Renter-occupied |
| Less than High School | 161 (57.3%) | 120 (42.7%) |
| High School Diploma | 386 (78.3%) | 107 (21.7%) |
| College/Associate Degree | 397 (80.4%) | 97 (19.6%) |
| Bachelor's Degree or higher | 382 (96.0%) | 16 (4.0%) |
Occupancy by Age of Householder in Shaw Heights
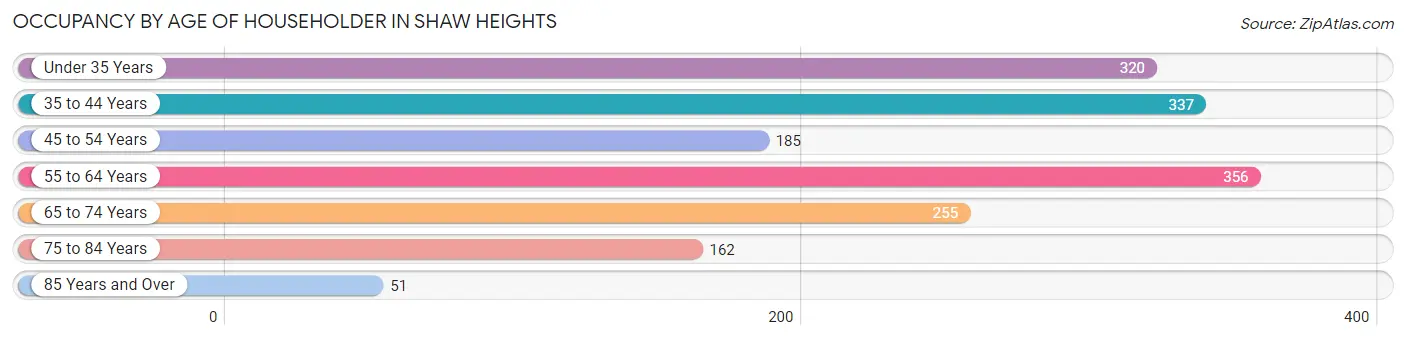
| Age Bracket | # Households | % Households |
| Under 35 Years | 320 | 19.2% |
| 35 to 44 Years | 337 | 20.2% |
| 45 to 54 Years | 185 | 11.1% |
| 55 to 64 Years | 356 | 21.4% |
| 65 to 74 Years | 255 | 15.3% |
| 75 to 84 Years | 162 | 9.7% |
| 85 Years and Over | 51 | 3.1% |
| Total | 1,666 | 100.0% |
Housing Finances in Shaw Heights
Median Income by Occupancy in Shaw Heights
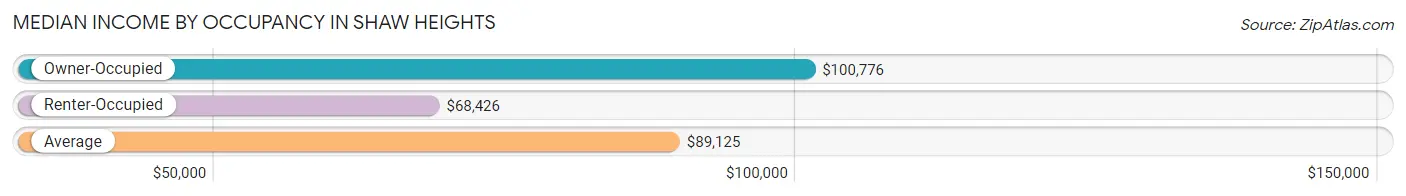
| Occupancy Type | # Households | Median Income |
| Owner-Occupied | 1,326 (79.6%) | $100,776 |
| Renter-Occupied | 340 (20.4%) | $68,426 |
| Average | 1,666 (100.0%) | $89,125 |
Occupancy by Householder Income Bracket in Shaw Heights
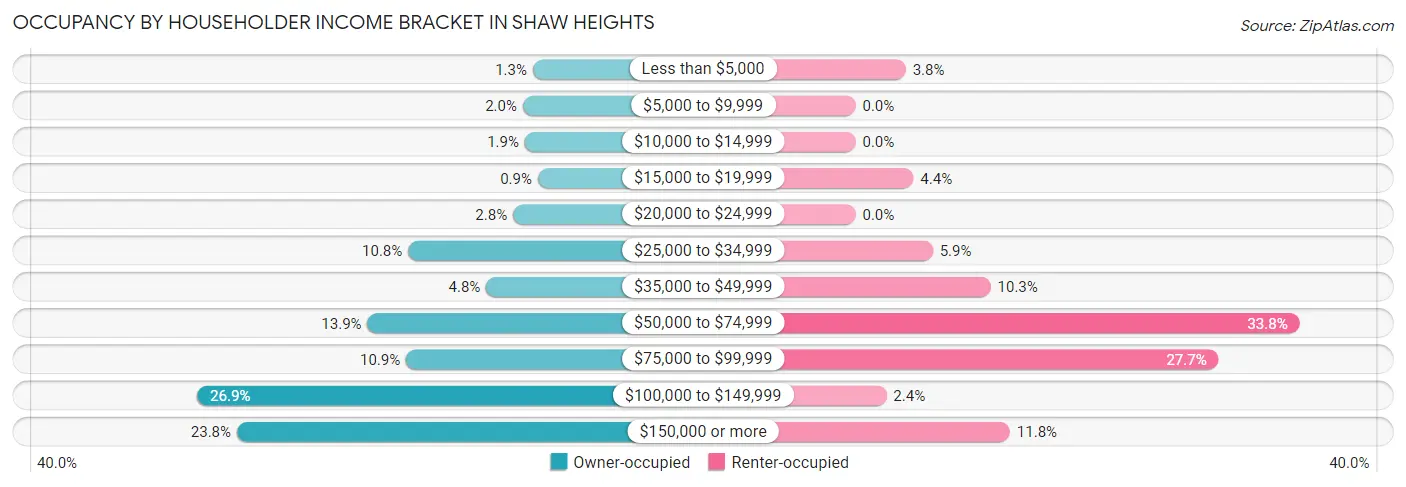
| Income Bracket | Owner-occupied | Renter-occupied |
| Less than $5,000 | 17 (1.3%) | 13 (3.8%) |
| $5,000 to $9,999 | 27 (2.0%) | 0 (0.0%) |
| $10,000 to $14,999 | 25 (1.9%) | 0 (0.0%) |
| $15,000 to $19,999 | 12 (0.9%) | 15 (4.4%) |
| $20,000 to $24,999 | 37 (2.8%) | 0 (0.0%) |
| $25,000 to $34,999 | 143 (10.8%) | 20 (5.9%) |
| $35,000 to $49,999 | 64 (4.8%) | 35 (10.3%) |
| $50,000 to $74,999 | 184 (13.9%) | 115 (33.8%) |
| $75,000 to $99,999 | 145 (10.9%) | 94 (27.7%) |
| $100,000 to $149,999 | 356 (26.9%) | 8 (2.4%) |
| $150,000 or more | 316 (23.8%) | 40 (11.8%) |
| Total | 1,326 (100.0%) | 340 (100.0%) |
Monthly Housing Cost Tiers in Shaw Heights
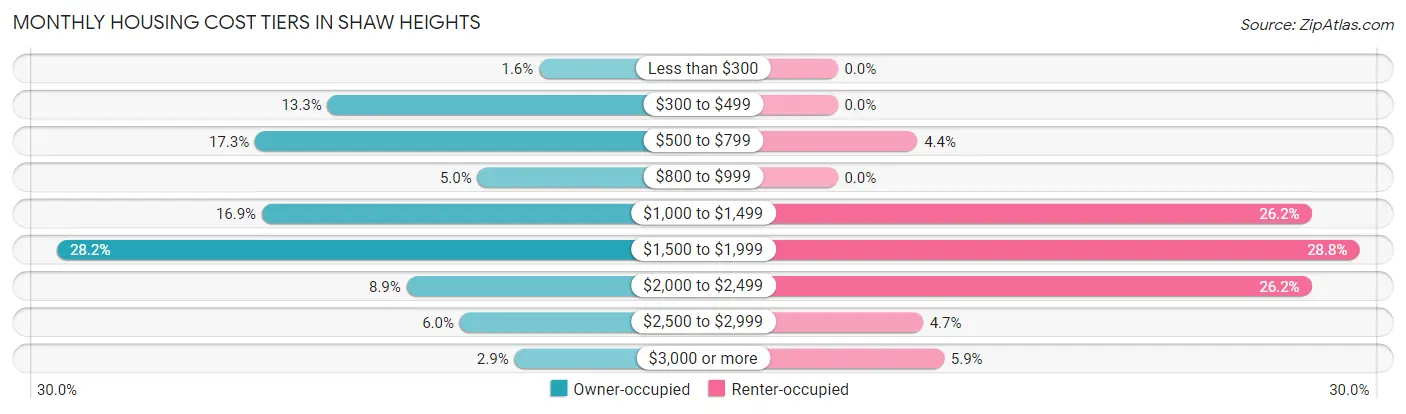
| Monthly Cost | Owner-occupied | Renter-occupied |
| Less than $300 | 21 (1.6%) | 0 (0.0%) |
| $300 to $499 | 176 (13.3%) | 0 (0.0%) |
| $500 to $799 | 229 (17.3%) | 15 (4.4%) |
| $800 to $999 | 66 (5.0%) | 0 (0.0%) |
| $1,000 to $1,499 | 224 (16.9%) | 89 (26.2%) |
| $1,500 to $1,999 | 374 (28.2%) | 98 (28.8%) |
| $2,000 to $2,499 | 118 (8.9%) | 89 (26.2%) |
| $2,500 to $2,999 | 79 (6.0%) | 16 (4.7%) |
| $3,000 or more | 39 (2.9%) | 20 (5.9%) |
| Total | 1,326 (100.0%) | 340 (100.0%) |
Physical Housing Characteristics in Shaw Heights
Housing Structures in Shaw Heights
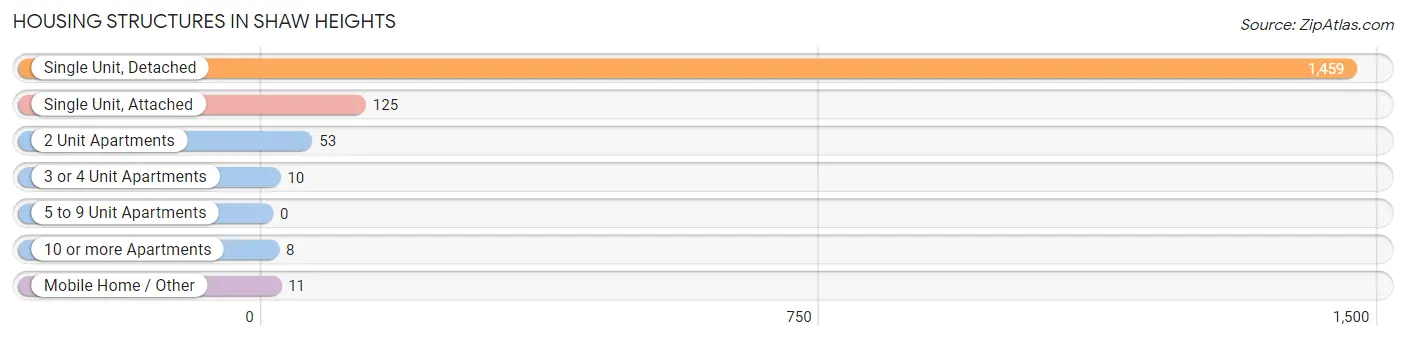
| Structure Type | # Housing Units | % Housing Units |
| Single Unit, Detached | 1,459 | 87.6% |
| Single Unit, Attached | 125 | 7.5% |
| 2 Unit Apartments | 53 | 3.2% |
| 3 or 4 Unit Apartments | 10 | 0.6% |
| 5 to 9 Unit Apartments | 0 | 0.0% |
| 10 or more Apartments | 8 | 0.5% |
| Mobile Home / Other | 11 | 0.7% |
| Total | 1,666 | 100.0% |
Housing Structures by Occupancy in Shaw Heights
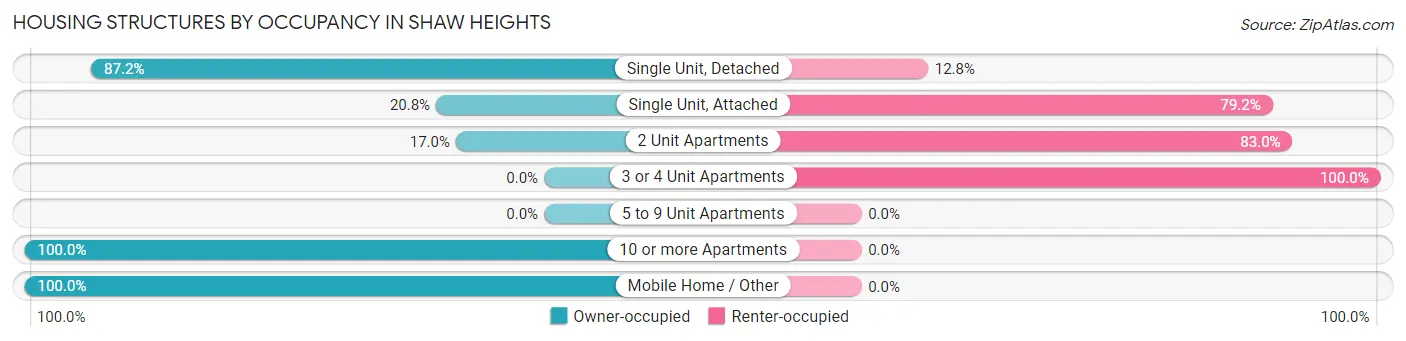
| Structure Type | Owner-occupied | Renter-occupied |
| Single Unit, Detached | 1,272 (87.2%) | 187 (12.8%) |
| Single Unit, Attached | 26 (20.8%) | 99 (79.2%) |
| 2 Unit Apartments | 9 (17.0%) | 44 (83.0%) |
| 3 or 4 Unit Apartments | 0 (0.0%) | 10 (100.0%) |
| 5 to 9 Unit Apartments | 0 (0.0%) | 0 (0.0%) |
| 10 or more Apartments | 8 (100.0%) | 0 (0.0%) |
| Mobile Home / Other | 11 (100.0%) | 0 (0.0%) |
| Total | 1,326 (79.6%) | 340 (20.4%) |
Housing Structures by Number of Rooms in Shaw Heights
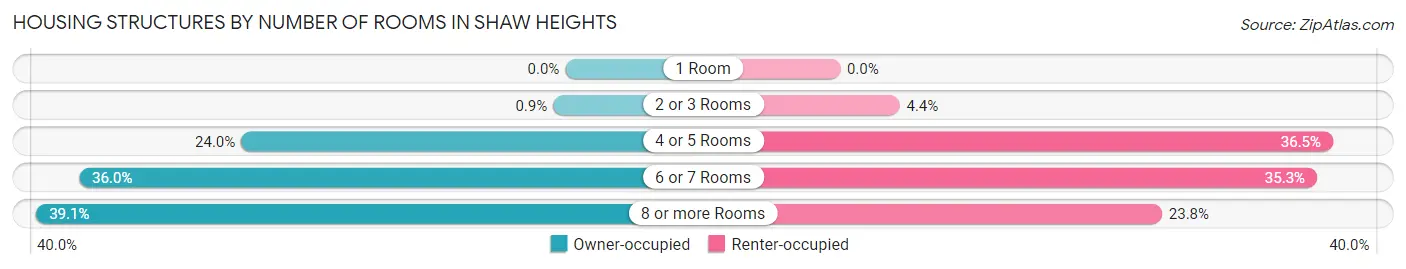
| Number of Rooms | Owner-occupied | Renter-occupied |
| 1 Room | 0 (0.0%) | 0 (0.0%) |
| 2 or 3 Rooms | 12 (0.9%) | 15 (4.4%) |
| 4 or 5 Rooms | 318 (24.0%) | 124 (36.5%) |
| 6 or 7 Rooms | 477 (36.0%) | 120 (35.3%) |
| 8 or more Rooms | 519 (39.1%) | 81 (23.8%) |
| Total | 1,326 (100.0%) | 340 (100.0%) |
Housing Structure by Heating Type in Shaw Heights
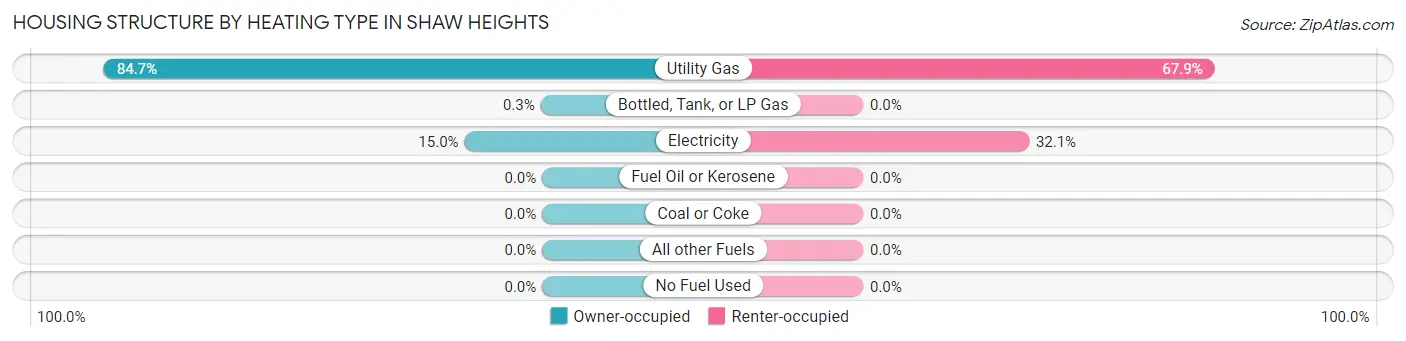
| Heating Type | Owner-occupied | Renter-occupied |
| Utility Gas | 1,123 (84.7%) | 231 (67.9%) |
| Bottled, Tank, or LP Gas | 4 (0.3%) | 0 (0.0%) |
| Electricity | 199 (15.0%) | 109 (32.1%) |
| Fuel Oil or Kerosene | 0 (0.0%) | 0 (0.0%) |
| Coal or Coke | 0 (0.0%) | 0 (0.0%) |
| All other Fuels | 0 (0.0%) | 0 (0.0%) |
| No Fuel Used | 0 (0.0%) | 0 (0.0%) |
| Total | 1,326 (100.0%) | 340 (100.0%) |
Household Vehicle Usage in Shaw Heights
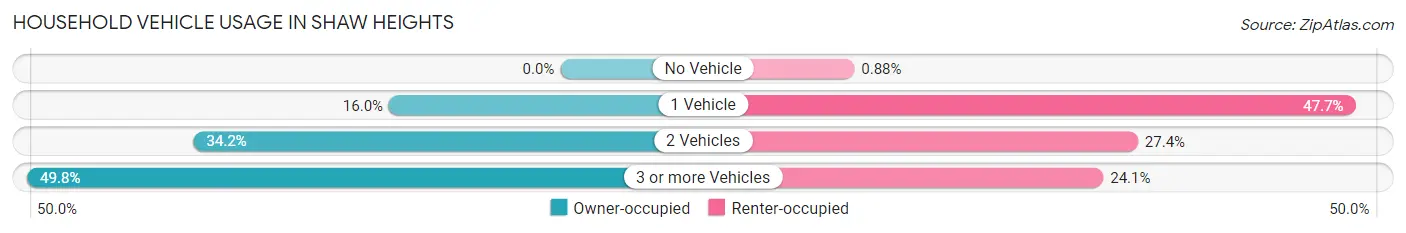
| Vehicles per Household | Owner-occupied | Renter-occupied |
| No Vehicle | 0 (0.0%) | 3 (0.9%) |
| 1 Vehicle | 212 (16.0%) | 162 (47.6%) |
| 2 Vehicles | 454 (34.2%) | 93 (27.4%) |
| 3 or more Vehicles | 660 (49.8%) | 82 (24.1%) |
| Total | 1,326 (100.0%) | 340 (100.0%) |
Real Estate & Mortgages in Shaw Heights
Real Estate and Mortgage Overview in Shaw Heights
| Characteristic | Without Mortgage | With Mortgage |
| Housing Units | 451 | 875 |
| Median Property Value | $423,100 | $410,200 |
| Median Household Income | $43,795 | $224 |
| Monthly Housing Costs | $521 | $39 |
| Real Estate Taxes | $2,483 | $42 |
Property Value by Mortgage Status in Shaw Heights
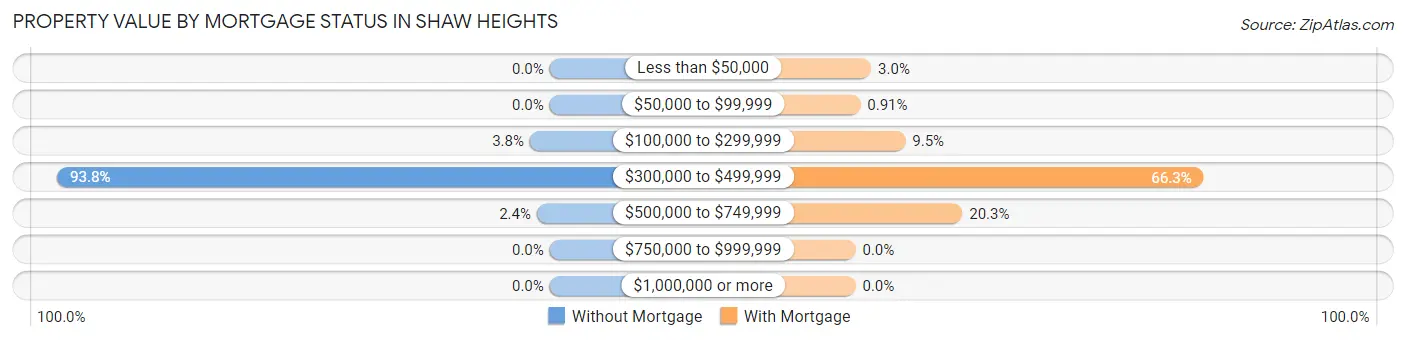
| Property Value | Without Mortgage | With Mortgage |
| Less than $50,000 | 0 (0.0%) | 26 (3.0%) |
| $50,000 to $99,999 | 0 (0.0%) | 8 (0.9%) |
| $100,000 to $299,999 | 17 (3.8%) | 83 (9.5%) |
| $300,000 to $499,999 | 423 (93.8%) | 580 (66.3%) |
| $500,000 to $749,999 | 11 (2.4%) | 178 (20.3%) |
| $750,000 to $999,999 | 0 (0.0%) | 0 (0.0%) |
| $1,000,000 or more | 0 (0.0%) | 0 (0.0%) |
| Total | 451 (100.0%) | 875 (100.0%) |
Household Income by Mortgage Status in Shaw Heights
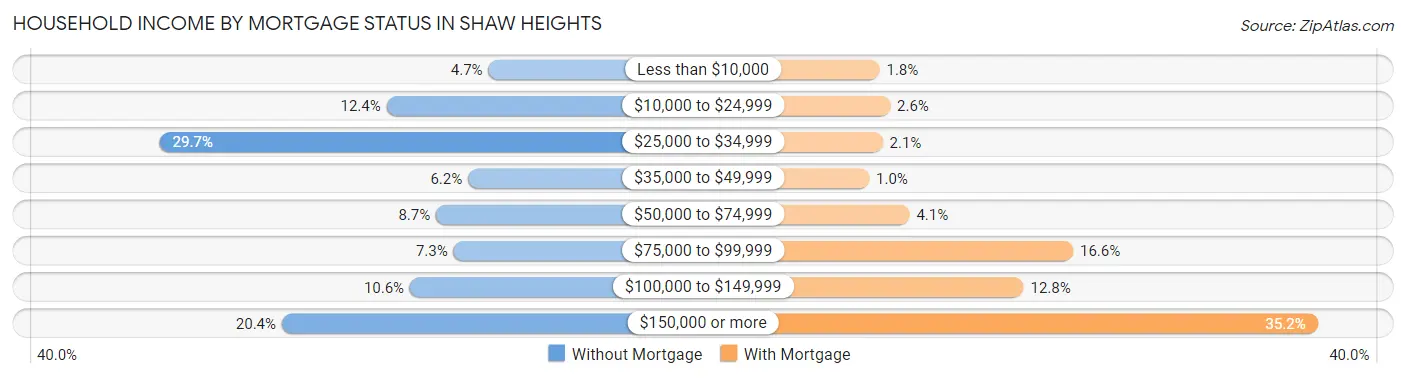
| Household Income | Without Mortgage | With Mortgage |
| Less than $10,000 | 21 (4.7%) | 16 (1.8%) |
| $10,000 to $24,999 | 56 (12.4%) | 23 (2.6%) |
| $25,000 to $34,999 | 134 (29.7%) | 18 (2.1%) |
| $35,000 to $49,999 | 28 (6.2%) | 9 (1.0%) |
| $50,000 to $74,999 | 39 (8.6%) | 36 (4.1%) |
| $75,000 to $99,999 | 33 (7.3%) | 145 (16.6%) |
| $100,000 to $149,999 | 48 (10.6%) | 112 (12.8%) |
| $150,000 or more | 92 (20.4%) | 308 (35.2%) |
| Total | 451 (100.0%) | 875 (100.0%) |
Property Value to Household Income Ratio in Shaw Heights
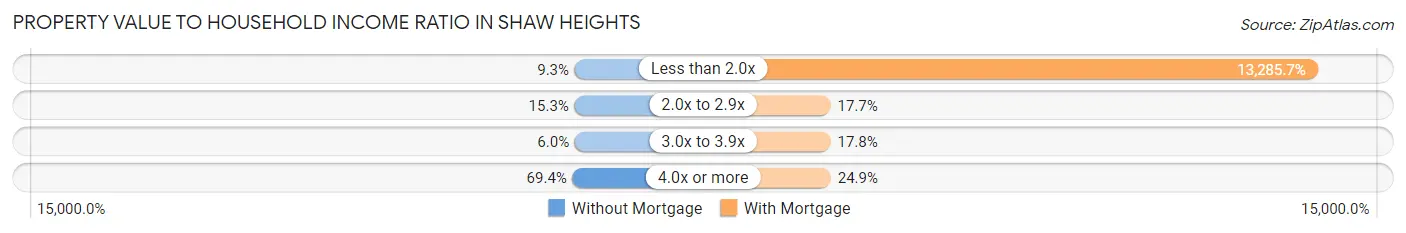
| Value-to-Income Ratio | Without Mortgage | With Mortgage |
| Less than 2.0x | 42 (9.3%) | 116,250 (13,285.7%) |
| 2.0x to 2.9x | 69 (15.3%) | 155 (17.7%) |
| 3.0x to 3.9x | 27 (6.0%) | 156 (17.8%) |
| 4.0x or more | 313 (69.4%) | 218 (24.9%) |
| Total | 451 (100.0%) | 875 (100.0%) |
Real Estate Taxes by Mortgage Status in Shaw Heights
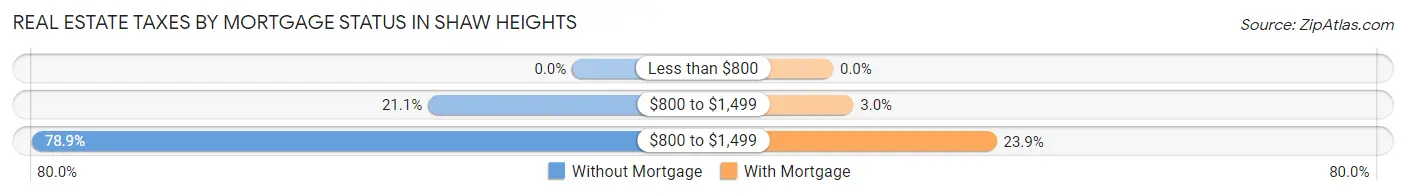
| Property Taxes | Without Mortgage | With Mortgage |
| Less than $800 | 0 (0.0%) | 0 (0.0%) |
| $800 to $1,499 | 95 (21.1%) | 26 (3.0%) |
| $800 to $1,499 | 356 (78.9%) | 209 (23.9%) |
| Total | 451 (100.0%) | 875 (100.0%) |
Health & Disability in Shaw Heights
Health Insurance Coverage by Age in Shaw Heights
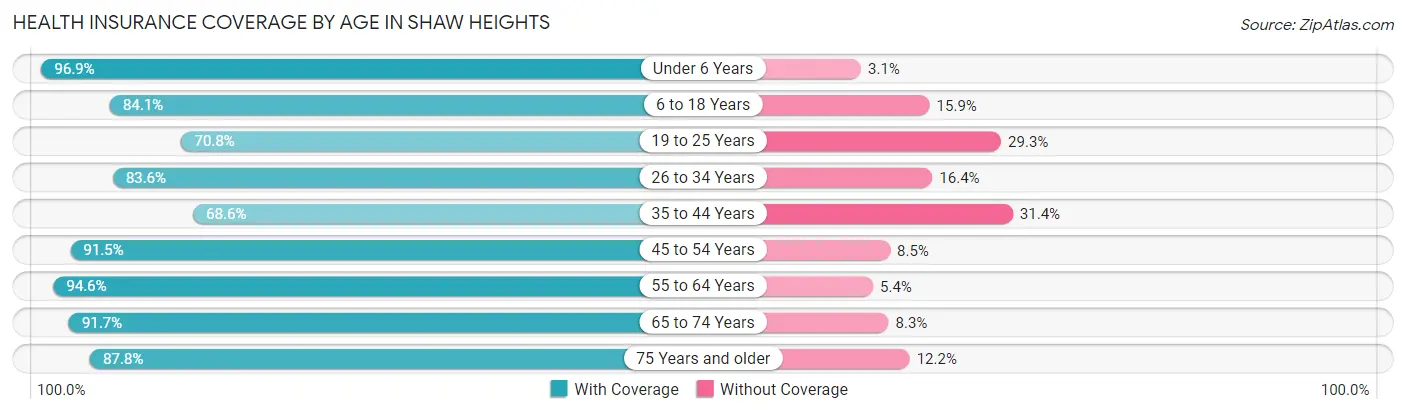
| Age Bracket | With Coverage | Without Coverage |
| Under 6 Years | 526 (96.9%) | 17 (3.1%) |
| 6 to 18 Years | 792 (84.1%) | 150 (15.9%) |
| 19 to 25 Years | 358 (70.8%) | 148 (29.2%) |
| 26 to 34 Years | 702 (83.6%) | 138 (16.4%) |
| 35 to 44 Years | 591 (68.6%) | 271 (31.4%) |
| 45 to 54 Years | 332 (91.5%) | 31 (8.5%) |
| 55 to 64 Years | 599 (94.6%) | 34 (5.4%) |
| 65 to 74 Years | 400 (91.7%) | 36 (8.3%) |
| 75 Years and older | 288 (87.8%) | 40 (12.2%) |
| Total | 4,588 (84.1%) | 865 (15.9%) |
Health Insurance Coverage by Citizenship Status in Shaw Heights
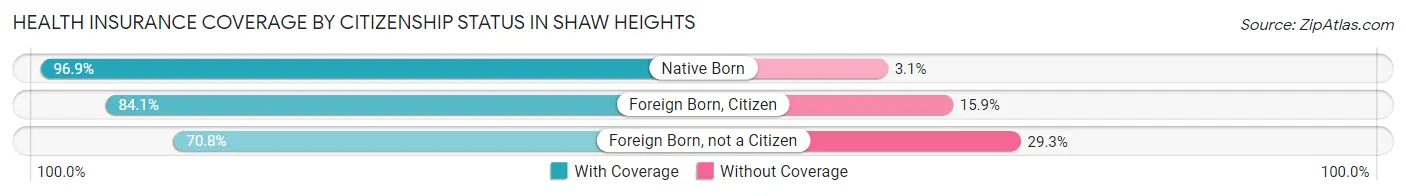
| Citizenship Status | With Coverage | Without Coverage |
| Native Born | 526 (96.9%) | 17 (3.1%) |
| Foreign Born, Citizen | 792 (84.1%) | 150 (15.9%) |
| Foreign Born, not a Citizen | 358 (70.8%) | 148 (29.2%) |
Health Insurance Coverage by Household Income in Shaw Heights
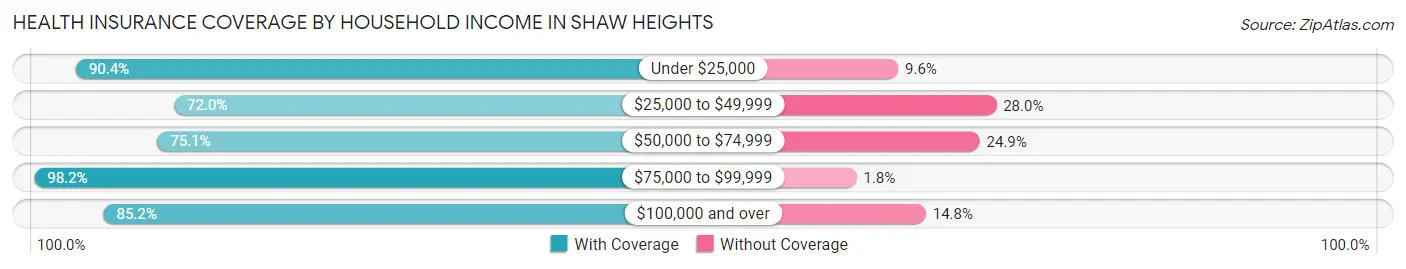
| Household Income | With Coverage | Without Coverage |
| Under $25,000 | 216 (90.4%) | 23 (9.6%) |
| $25,000 to $49,999 | 306 (72.0%) | 119 (28.0%) |
| $50,000 to $74,999 | 797 (75.1%) | 264 (24.9%) |
| $75,000 to $99,999 | 701 (98.2%) | 13 (1.8%) |
| $100,000 and over | 2,568 (85.2%) | 446 (14.8%) |
Public vs Private Health Insurance Coverage by Age in Shaw Heights
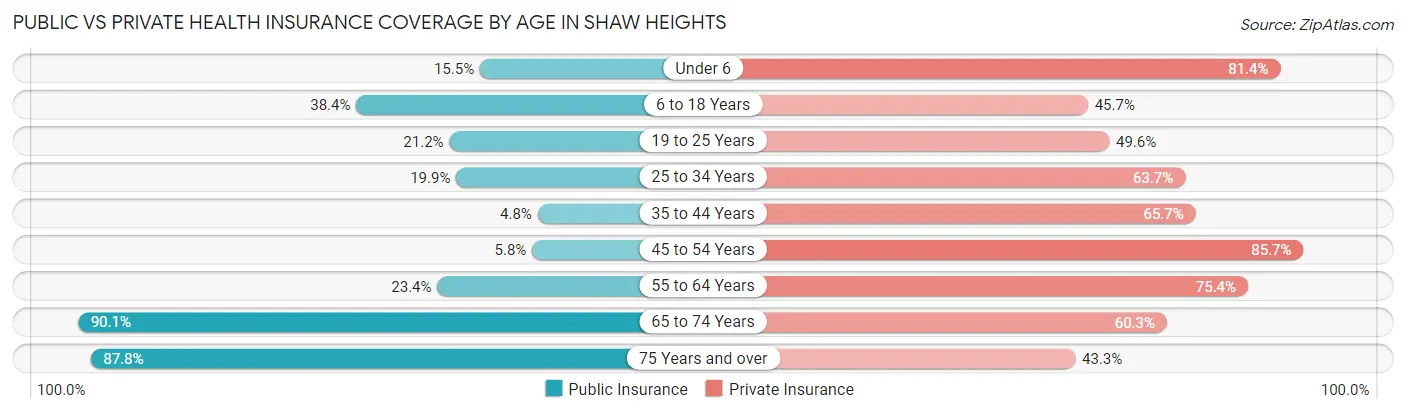
| Age Bracket | Public Insurance | Private Insurance |
| Under 6 | 84 (15.5%) | 442 (81.4%) |
| 6 to 18 Years | 362 (38.4%) | 430 (45.7%) |
| 19 to 25 Years | 107 (21.1%) | 251 (49.6%) |
| 25 to 34 Years | 167 (19.9%) | 535 (63.7%) |
| 35 to 44 Years | 41 (4.8%) | 566 (65.7%) |
| 45 to 54 Years | 21 (5.8%) | 311 (85.7%) |
| 55 to 64 Years | 148 (23.4%) | 477 (75.4%) |
| 65 to 74 Years | 393 (90.1%) | 263 (60.3%) |
| 75 Years and over | 288 (87.8%) | 142 (43.3%) |
| Total | 1,611 (29.5%) | 3,417 (62.7%) |
Disability Status by Sex by Age in Shaw Heights
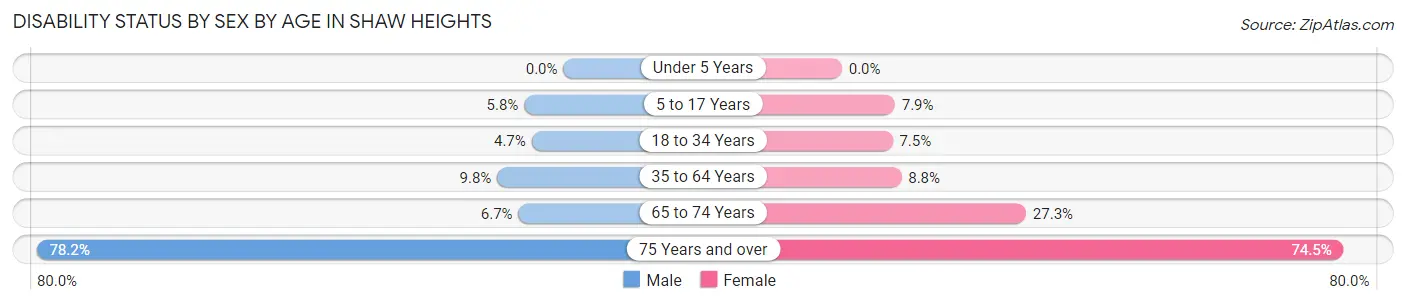
| Age Bracket | Male | Female |
| Under 5 Years | 0 (0.0%) | 0 (0.0%) |
| 5 to 17 Years | 28 (5.8%) | 35 (7.9%) |
| 18 to 34 Years | 37 (4.7%) | 47 (7.5%) |
| 35 to 64 Years | 108 (9.8%) | 67 (8.8%) |
| 65 to 74 Years | 12 (6.7%) | 70 (27.3%) |
| 75 Years and over | 97 (78.2%) | 152 (74.5%) |
Disability Class by Sex by Age in Shaw Heights
Disability Class: Hearing Difficulty
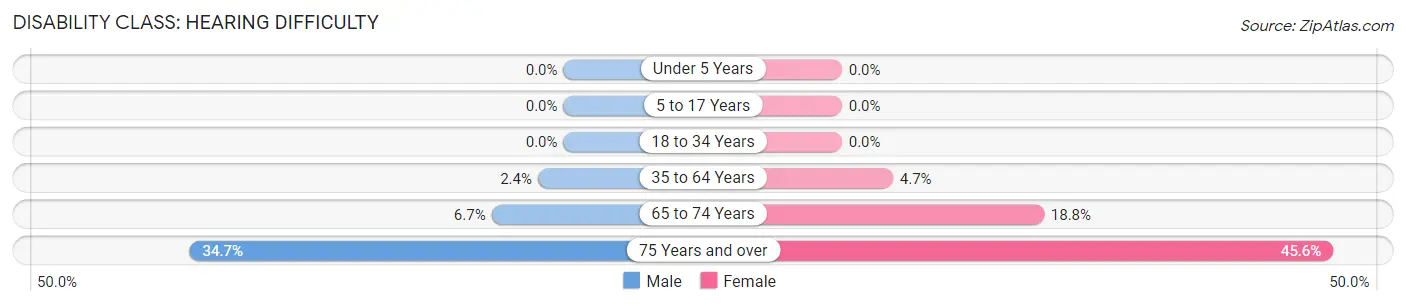
| Age Bracket | Male | Female |
| Under 5 Years | 0 (0.0%) | 0 (0.0%) |
| 5 to 17 Years | 0 (0.0%) | 0 (0.0%) |
| 18 to 34 Years | 0 (0.0%) | 0 (0.0%) |
| 35 to 64 Years | 26 (2.4%) | 36 (4.7%) |
| 65 to 74 Years | 12 (6.7%) | 48 (18.8%) |
| 75 Years and over | 43 (34.7%) | 93 (45.6%) |
Disability Class: Vision Difficulty
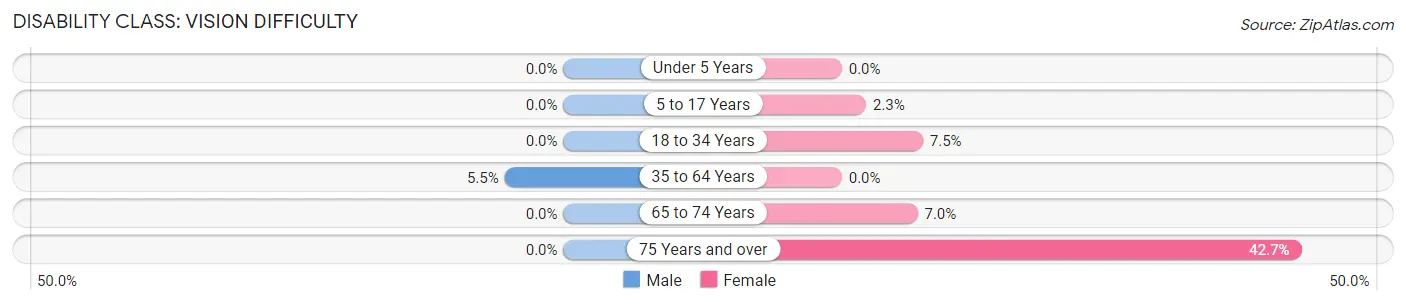
| Age Bracket | Male | Female |
| Under 5 Years | 0 (0.0%) | 0 (0.0%) |
| 5 to 17 Years | 0 (0.0%) | 10 (2.2%) |
| 18 to 34 Years | 0 (0.0%) | 47 (7.5%) |
| 35 to 64 Years | 60 (5.5%) | 0 (0.0%) |
| 65 to 74 Years | 0 (0.0%) | 18 (7.0%) |
| 75 Years and over | 0 (0.0%) | 87 (42.6%) |
Disability Class: Cognitive Difficulty
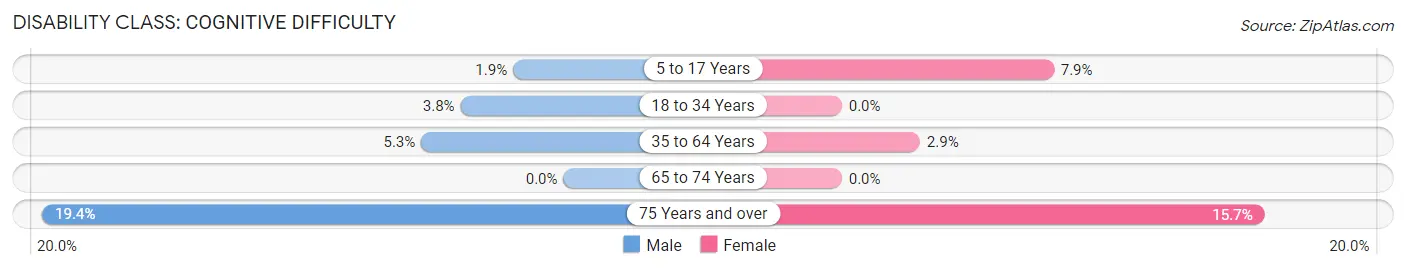
| Age Bracket | Male | Female |
| 5 to 17 Years | 9 (1.9%) | 35 (7.9%) |
| 18 to 34 Years | 30 (3.8%) | 0 (0.0%) |
| 35 to 64 Years | 58 (5.3%) | 22 (2.9%) |
| 65 to 74 Years | 0 (0.0%) | 0 (0.0%) |
| 75 Years and over | 24 (19.4%) | 32 (15.7%) |
Disability Class: Ambulatory Difficulty
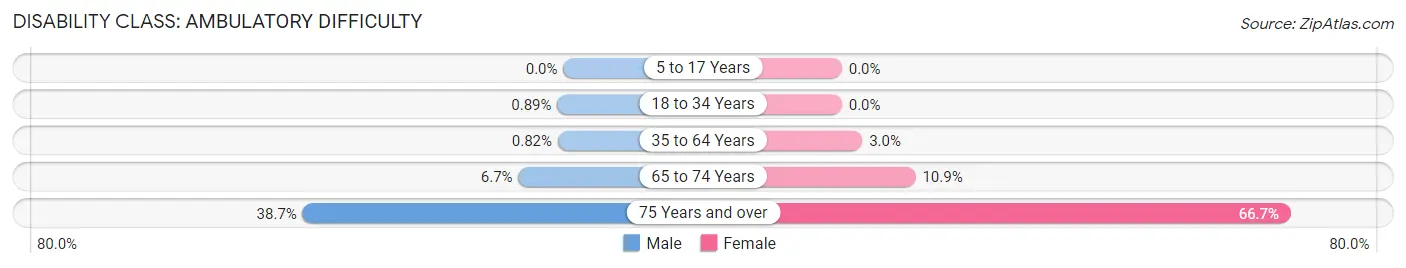
| Age Bracket | Male | Female |
| 5 to 17 Years | 0 (0.0%) | 0 (0.0%) |
| 18 to 34 Years | 7 (0.9%) | 0 (0.0%) |
| 35 to 64 Years | 9 (0.8%) | 23 (3.0%) |
| 65 to 74 Years | 12 (6.7%) | 28 (10.9%) |
| 75 Years and over | 48 (38.7%) | 136 (66.7%) |
Disability Class: Self-Care Difficulty
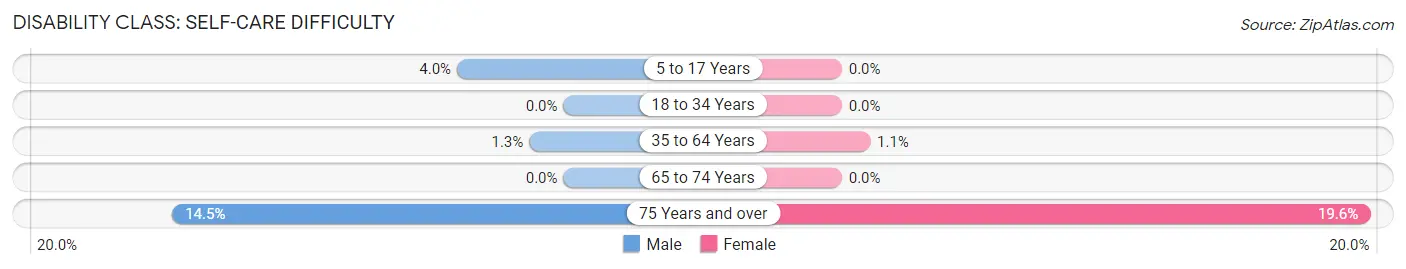
| Age Bracket | Male | Female |
| 5 to 17 Years | 19 (4.0%) | 0 (0.0%) |
| 18 to 34 Years | 0 (0.0%) | 0 (0.0%) |
| 35 to 64 Years | 14 (1.3%) | 8 (1.1%) |
| 65 to 74 Years | 0 (0.0%) | 0 (0.0%) |
| 75 Years and over | 18 (14.5%) | 40 (19.6%) |
Technology Access in Shaw Heights
Computing Device Access in Shaw Heights
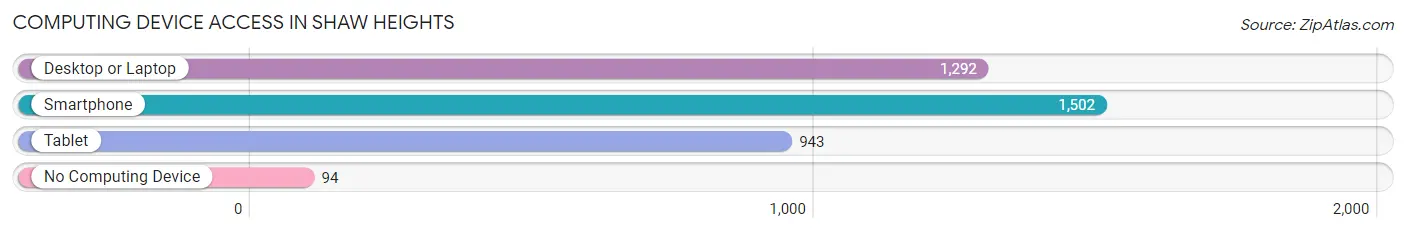
| Device Type | # Households | % Households |
| Desktop or Laptop | 1,292 | 77.5% |
| Smartphone | 1,502 | 90.2% |
| Tablet | 943 | 56.6% |
| No Computing Device | 94 | 5.6% |
| Total | 1,666 | 100.0% |
Internet Access in Shaw Heights
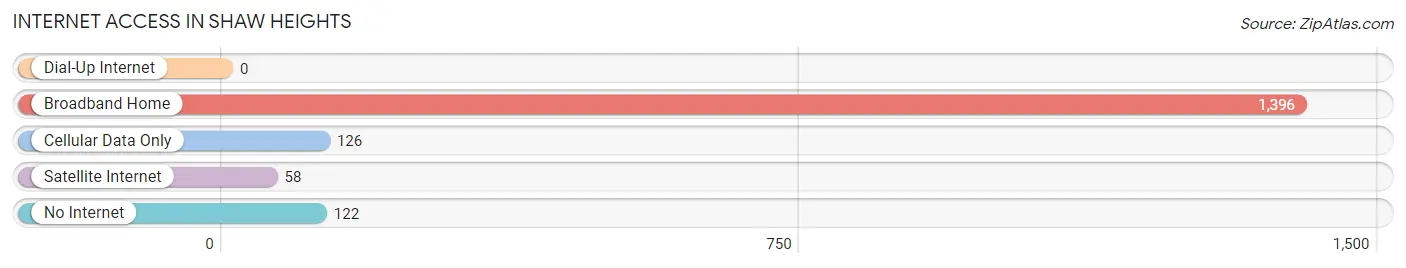
| Internet Type | # Households | % Households |
| Dial-Up Internet | 0 | 0.0% |
| Broadband Home | 1,396 | 83.8% |
| Cellular Data Only | 126 | 7.6% |
| Satellite Internet | 58 | 3.5% |
| No Internet | 122 | 7.3% |
| Total | 1,666 | 100.0% |
Shaw Heights Summary
Shaw Heights is a small, unincorporated community located in Adams County, Colorado, United States. It is situated in the northwest corner of the county, just south of the city of Westminster. The community is bordered by the cities of Westminster, Thornton, and Northglenn. The population of Shaw Heights was estimated to be 2,845 in 2019.
History
Shaw Heights was founded in the late 1950s by the Shaw family, who purchased the land from the federal government. The family had previously owned a farm in the area and wanted to develop the land for residential use. The community was named after the Shaw family and was incorporated in 1959.
The community was initially developed as a residential area, with single-family homes and small businesses. In the 1970s, the area began to experience rapid growth, with the construction of several apartment complexes and shopping centers. This growth continued into the 1980s and 1990s, with the addition of several new businesses and residential developments.
Geography
Shaw Heights is located in the northwest corner of Adams County, Colorado, just south of the city of Westminster. The community is bordered by the cities of Westminster, Thornton, and Northglenn. The area is characterized by rolling hills and open spaces, with the Rocky Mountains visible in the distance.
The climate in Shaw Heights is semi-arid, with hot summers and cold winters. The average annual temperature is around 50°F (10°C), with an average high of around 75°F (24°C) in the summer and an average low of around 25°F (-4°C) in the winter.
Economy
Shaw Heights is primarily a residential community, with a few small businesses located in the area. The largest employers in the area are the local school district and the city of Westminster. Other businesses in the area include restaurants, retail stores, and medical offices.
Demographics
As of 2019, the population of Shaw Heights was estimated to be 2,845. The racial makeup of the community was 79.3% White, 8.2% Hispanic or Latino, 6.2% African American, 3.2% Asian, and 2.9% other. The median household income was $60,945, and the median home value was $323,000.
Conclusion
Shaw Heights is a small, unincorporated community located in Adams County, Colorado. It was founded in the late 1950s by the Shaw family and has since grown into a residential area with a few small businesses. The population of Shaw Heights was estimated to be 2,845 in 2019, with a median household income of $60,945 and a median home value of $323,000. The area is characterized by rolling hills and open spaces, with the Rocky Mountains visible in the distance.
Common Questions
What is Per Capita Income in Shaw Heights?
Per Capita income in Shaw Heights is $36,195.
What is the Median Family Income in Shaw Heights?
Median Family Income in Shaw Heights is $87,750.
What is the Median Household income in Shaw Heights?
Median Household Income in Shaw Heights is $89,125.
What is Income or Wage Gap in Shaw Heights?
Income or Wage Gap in Shaw Heights is 14.3%.
Women in Shaw Heights earn 85.7 cents for every dollar earned by a man.
What is Inequality or Gini Index in Shaw Heights?
Inequality or Gini Index in Shaw Heights is 0.44.
What is the Total Population of Shaw Heights?
Total Population of Shaw Heights is 5,458.
What is the Total Male Population of Shaw Heights?
Total Male Population of Shaw Heights is 2,889.
What is the Total Female Population of Shaw Heights?
Total Female Population of Shaw Heights is 2,569.
What is the Ratio of Males per 100 Females in Shaw Heights?
There are 112.46 Males per 100 Females in Shaw Heights.
What is the Ratio of Females per 100 Males in Shaw Heights?
There are 88.92 Females per 100 Males in Shaw Heights.
What is the Median Population Age in Shaw Heights?
Median Population Age in Shaw Heights is 34.1 Years.
What is the Average Family Size in Shaw Heights
Average Family Size in Shaw Heights is 3.8 People.
What is the Average Household Size in Shaw Heights
Average Household Size in Shaw Heights is 3.3 People.
How Large is the Labor Force in Shaw Heights?
There are 2,950 People in the Labor Forcein in Shaw Heights.
What is the Percentage of People in the Labor Force in Shaw Heights?
67.6% of People are in the Labor Force in Shaw Heights.
What is the Unemployment Rate in Shaw Heights?
Unemployment Rate in Shaw Heights is 2.8%.