Strasburg, CO Map & Demographics
Strasburg Map
Strasburg Overview
$41,050
PER CAPITA INCOME
$110,417
AVG FAMILY INCOME
$88,482
AVG HOUSEHOLD INCOME
52.1%
WAGE / INCOME GAP [ % ]
47.9¢/ $1
WAGE / INCOME GAP [ $ ]
0.50
INEQUALITY / GINI INDEX
3,149
TOTAL POPULATION
1,636
MALE POPULATION
1,513
FEMALE POPULATION
108.13
MALES / 100 FEMALES
92.48
FEMALES / 100 MALES
32.5
MEDIAN AGE
3.8
AVG FAMILY SIZE
3.0
AVG HOUSEHOLD SIZE
1,557
LABOR FORCE [ PEOPLE ]
67.4%
PERCENT IN LABOR FORCE
6.1%
UNEMPLOYMENT RATE
Strasburg Zip Codes
Strasburg Area Codes
Income in Strasburg
Income Overview in Strasburg
Per Capita Income in Strasburg is $41,050, while median incomes of families and households are $110,417 and $88,482 respectively.
| Characteristic | Number | Measure |
| Per Capita Income | 3,149 | $41,050 |
| Median Family Income | 679 | $110,417 |
| Mean Family Income | 679 | $147,934 |
| Median Household Income | 1,060 | $88,482 |
| Mean Household Income | 1,060 | $116,342 |
| Income Deficit | 679 | $0 |
| Wage / Income Gap (%) | 3,149 | 52.13% |
| Wage / Income Gap ($) | 3,149 | 47.87¢ per $1 |
| Gini / Inequality Index | 3,149 | 0.50 |
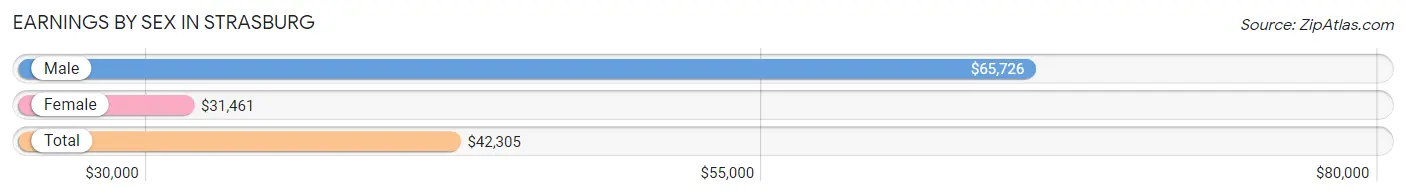
Earnings by Sex in Strasburg
Average Earnings in Strasburg are $42,305, $65,726 for men and $31,461 for women, a difference of 52.1%.
| Sex | Number | Average Earnings |
| Male | 982 (56.4%) | $65,726 |
| Female | 759 (43.6%) | $31,461 |
| Total | 1,741 (100.0%) | $42,305 |
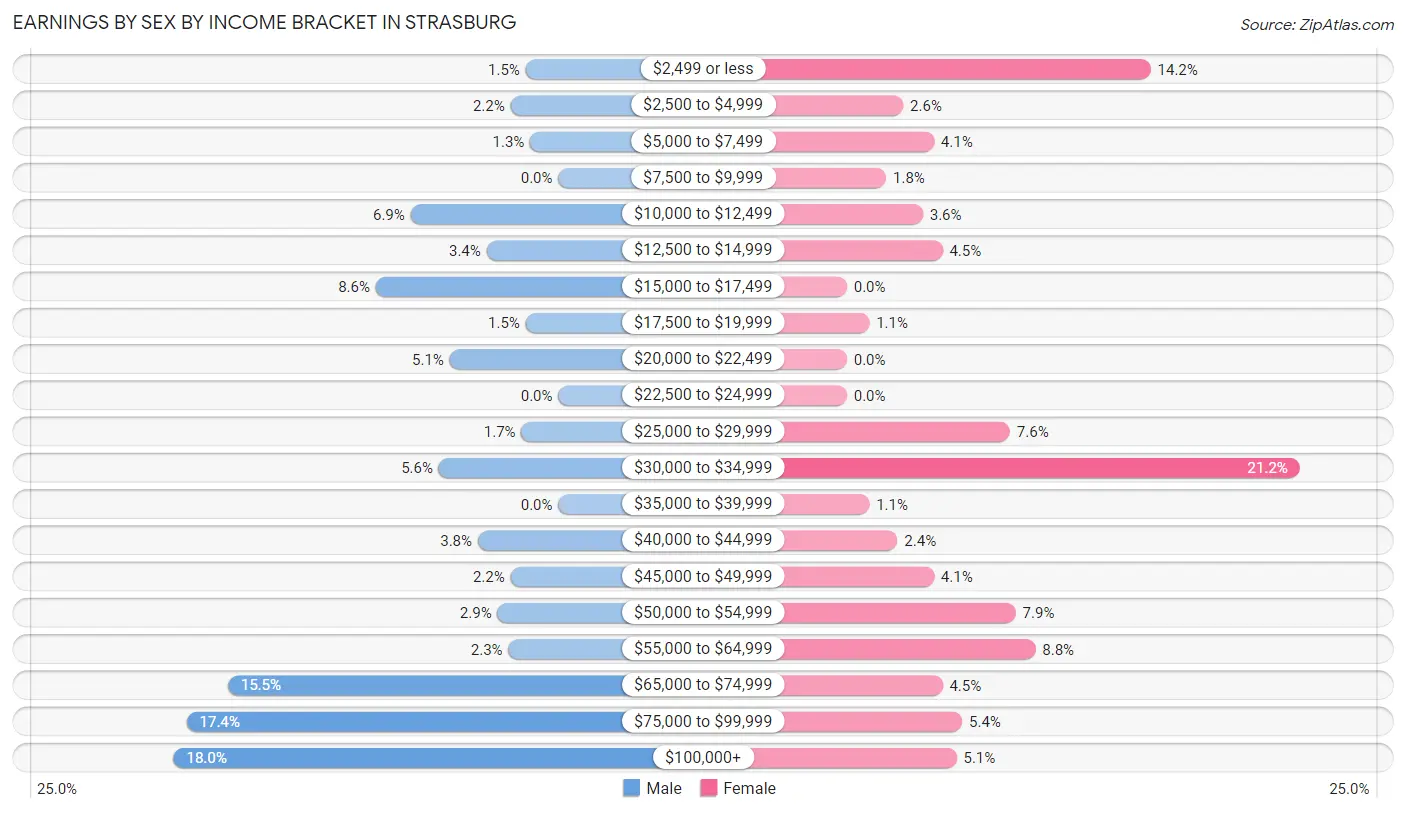
Earnings by Sex by Income Bracket in Strasburg
The most common earnings brackets in Strasburg are $100,000+ for men (177 | 18.0%) and $30,000 to $34,999 for women (161 | 21.2%).
| Income | Male | Female |
| $2,499 or less | 15 (1.5%) | 108 (14.2%) |
| $2,500 to $4,999 | 22 (2.2%) | 20 (2.6%) |
| $5,000 to $7,499 | 13 (1.3%) | 31 (4.1%) |
| $7,500 to $9,999 | 0 (0.0%) | 14 (1.8%) |
| $10,000 to $12,499 | 68 (6.9%) | 27 (3.6%) |
| $12,500 to $14,999 | 33 (3.4%) | 34 (4.5%) |
| $15,000 to $17,499 | 84 (8.6%) | 0 (0.0%) |
| $17,500 to $19,999 | 15 (1.5%) | 8 (1.1%) |
| $20,000 to $22,499 | 50 (5.1%) | 0 (0.0%) |
| $22,500 to $24,999 | 0 (0.0%) | 0 (0.0%) |
| $25,000 to $29,999 | 17 (1.7%) | 58 (7.6%) |
| $30,000 to $34,999 | 55 (5.6%) | 161 (21.2%) |
| $35,000 to $39,999 | 0 (0.0%) | 8 (1.1%) |
| $40,000 to $44,999 | 37 (3.8%) | 18 (2.4%) |
| $45,000 to $49,999 | 22 (2.2%) | 31 (4.1%) |
| $50,000 to $54,999 | 28 (2.9%) | 60 (7.9%) |
| $55,000 to $64,999 | 23 (2.3%) | 67 (8.8%) |
| $65,000 to $74,999 | 152 (15.5%) | 34 (4.5%) |
| $75,000 to $99,999 | 171 (17.4%) | 41 (5.4%) |
| $100,000+ | 177 (18.0%) | 39 (5.1%) |
| Total | 982 (100.0%) | 759 (100.0%) |
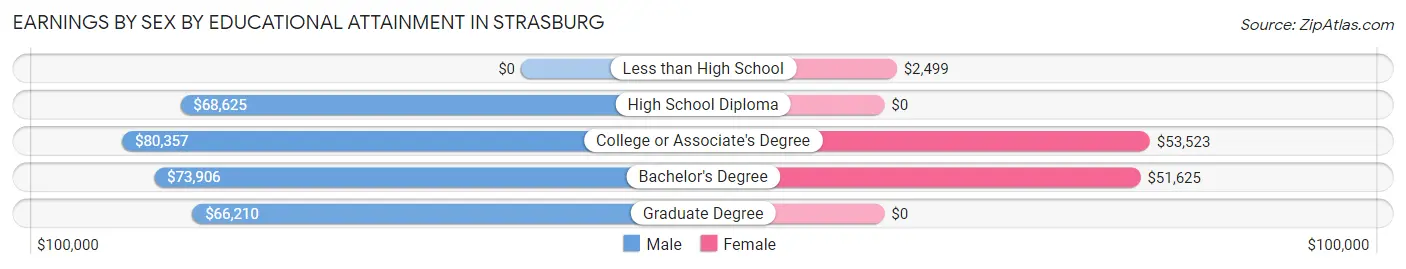
Earnings by Sex by Educational Attainment in Strasburg
Average earnings in Strasburg are $73,125 for men and $34,350 for women, a difference of 53.0%. Men with an educational attainment of college or associate's degree enjoy the highest average annual earnings of $80,357, while those with graduate degree education earn the least with $66,210. Women with an educational attainment of college or associate's degree earn the most with the average annual earnings of $53,523, while those with less than high school education have the smallest earnings of $2,499.
| Educational Attainment | Male Income | Female Income |
| Less than High School | - | - |
| High School Diploma | $68,625 | $0 |
| College or Associate's Degree | $80,357 | $53,523 |
| Bachelor's Degree | $73,906 | $51,625 |
| Graduate Degree | $66,210 | $0 |
| Total | $73,125 | $34,350 |
Family Income in Strasburg
Family Income Brackets in Strasburg
According to the Strasburg family income data, there are 213 families falling into the $100,000 to $149,999 income range, which is the most common income bracket and makes up 31.4% of all families.
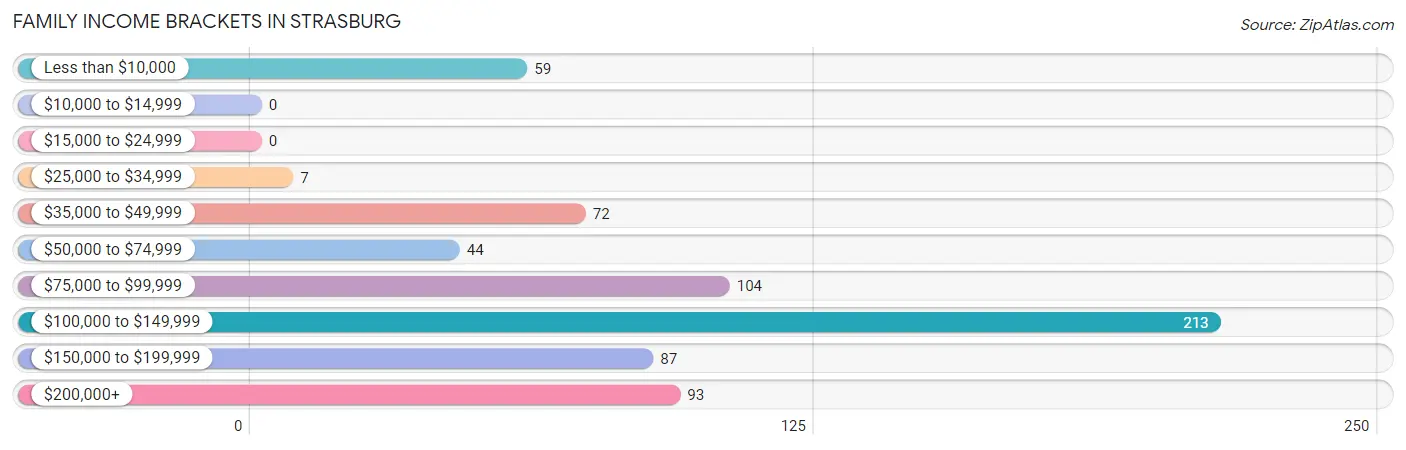
| Income Bracket | # Families | % Families |
| Less than $10,000 | 59 | 8.7% |
| $10,000 to $14,999 | 0 | 0.0% |
| $15,000 to $24,999 | 0 | 0.0% |
| $25,000 to $34,999 | 7 | 1.0% |
| $35,000 to $49,999 | 72 | 10.6% |
| $50,000 to $74,999 | 44 | 6.5% |
| $75,000 to $99,999 | 104 | 15.3% |
| $100,000 to $149,999 | 213 | 31.4% |
| $150,000 to $199,999 | 87 | 12.8% |
| $200,000+ | 93 | 13.7% |
Family Income by Famaliy Size in Strasburg
4-person families (58 | 8.5%) account for the highest median family income in Strasburg with $145,500 per family, while 2-person families (231 | 34.0%) have the highest median income of $61,766 per family member.
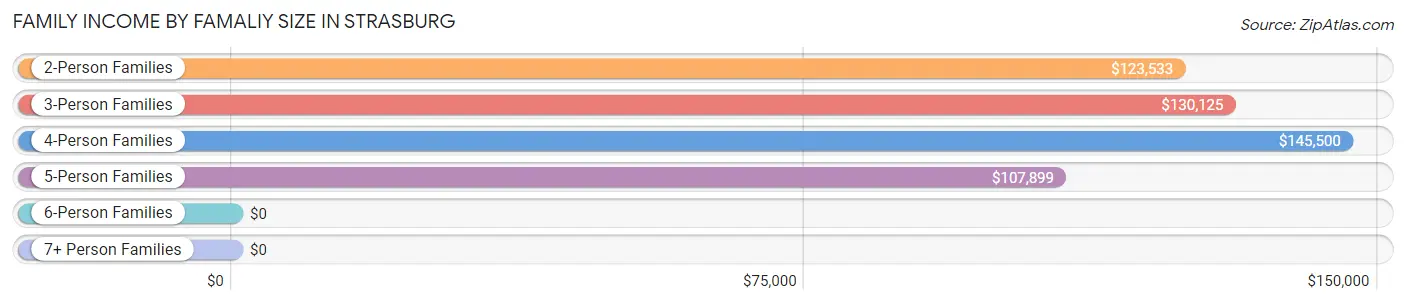
| Income Bracket | # Families | Median Income |
| 2-Person Families | 231 (34.0%) | $123,533 |
| 3-Person Families | 132 (19.4%) | $130,125 |
| 4-Person Families | 58 (8.5%) | $145,500 |
| 5-Person Families | 215 (31.7%) | $107,899 |
| 6-Person Families | 43 (6.3%) | $0 |
| 7+ Person Families | 0 (0.0%) | $0 |
| Total | 679 (100.0%) | $110,417 |
Family Income by Number of Earners in Strasburg
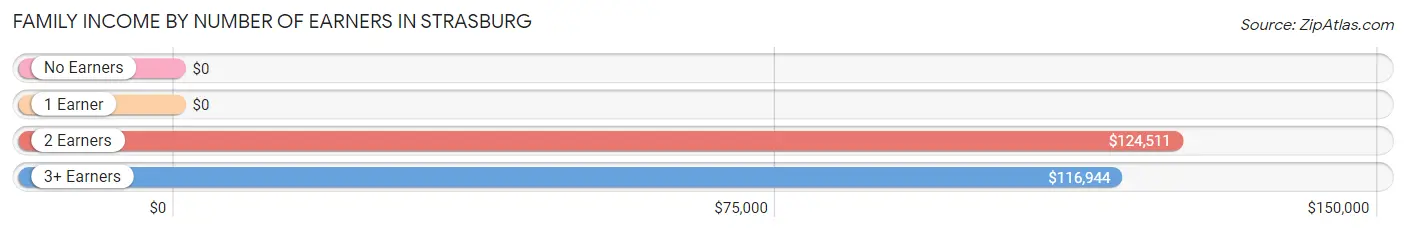
| Number of Earners | # Families | Median Income |
| No Earners | 70 (10.3%) | $0 |
| 1 Earner | 132 (19.4%) | $0 |
| 2 Earners | 299 (44.0%) | $124,511 |
| 3+ Earners | 178 (26.2%) | $116,944 |
| Total | 679 (100.0%) | $110,417 |
Household Income in Strasburg
Household Income Brackets in Strasburg
With 302 households falling in the category, the $100,000 to $149,999 income range is the most frequent in Strasburg, accounting for 28.5% of all households. In contrast, only 16 households (1.5%) fall into the $10,000 to $14,999 income bracket, making it the least populous group.
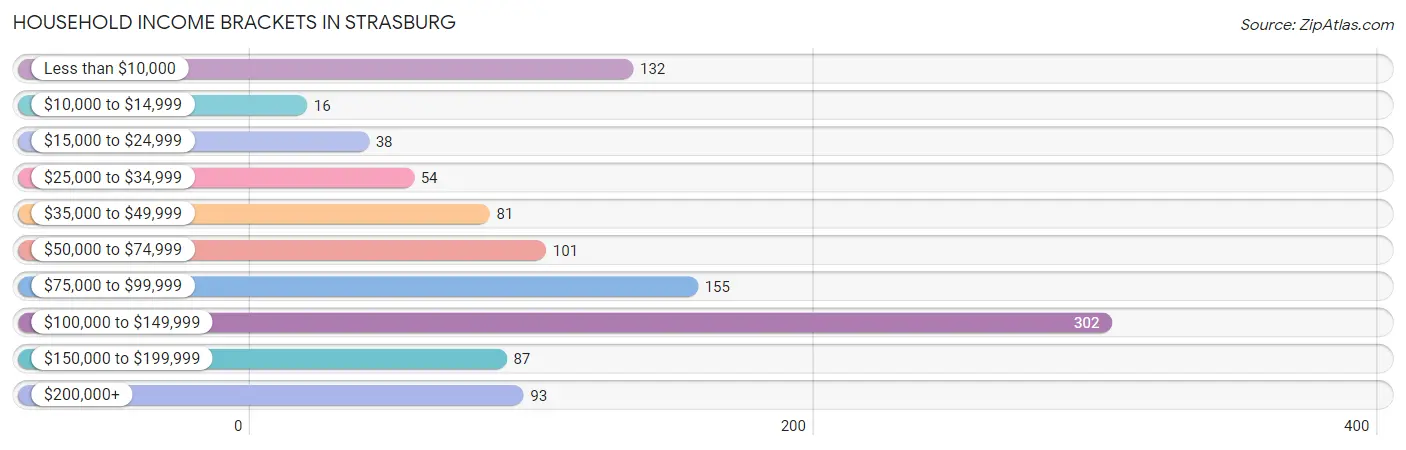
| Income Bracket | # Households | % Households |
| Less than $10,000 | 132 | 12.5% |
| $10,000 to $14,999 | 16 | 1.5% |
| $15,000 to $24,999 | 38 | 3.6% |
| $25,000 to $34,999 | 54 | 5.1% |
| $35,000 to $49,999 | 81 | 7.6% |
| $50,000 to $74,999 | 101 | 9.5% |
| $75,000 to $99,999 | 155 | 14.6% |
| $100,000 to $149,999 | 302 | 28.5% |
| $150,000 to $199,999 | 87 | 8.2% |
| $200,000+ | 93 | 8.8% |
Household Income by Householder Age in Strasburg
The median household income in Strasburg is $88,482, with the highest median household income of $115,556 found in the 25 to 44 years age bracket for the primary householder. A total of 256 households (24.1%) fall into this category.
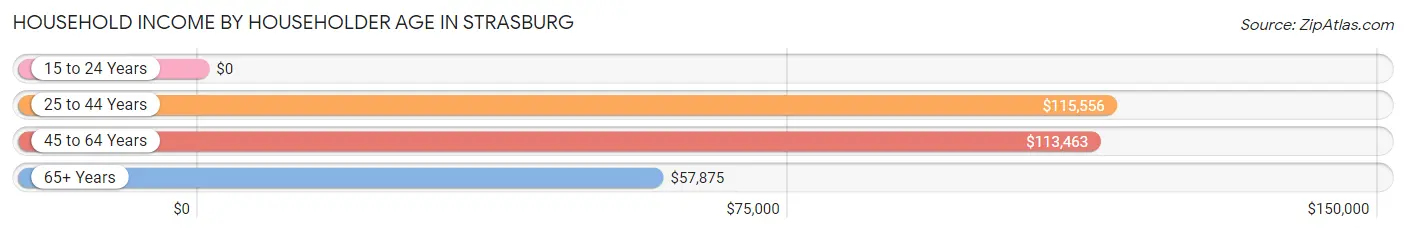
| Income Bracket | # Households | Median Income |
| 15 to 24 Years | 0 (0.0%) | $0 |
| 25 to 44 Years | 256 (24.1%) | $115,556 |
| 45 to 64 Years | 497 (46.9%) | $113,463 |
| 65+ Years | 307 (29.0%) | $57,875 |
| Total | 1,060 (100.0%) | $88,482 |
Poverty in Strasburg
Income Below Poverty by Sex and Age in Strasburg
With 12.8% poverty level for males and 11.9% for females among the residents of Strasburg, 6 to 11 year old males and 65 to 74 year old females are the most vulnerable to poverty, with 76 males (62.3%) and 84 females (42.4%) in their respective age groups living below the poverty level.
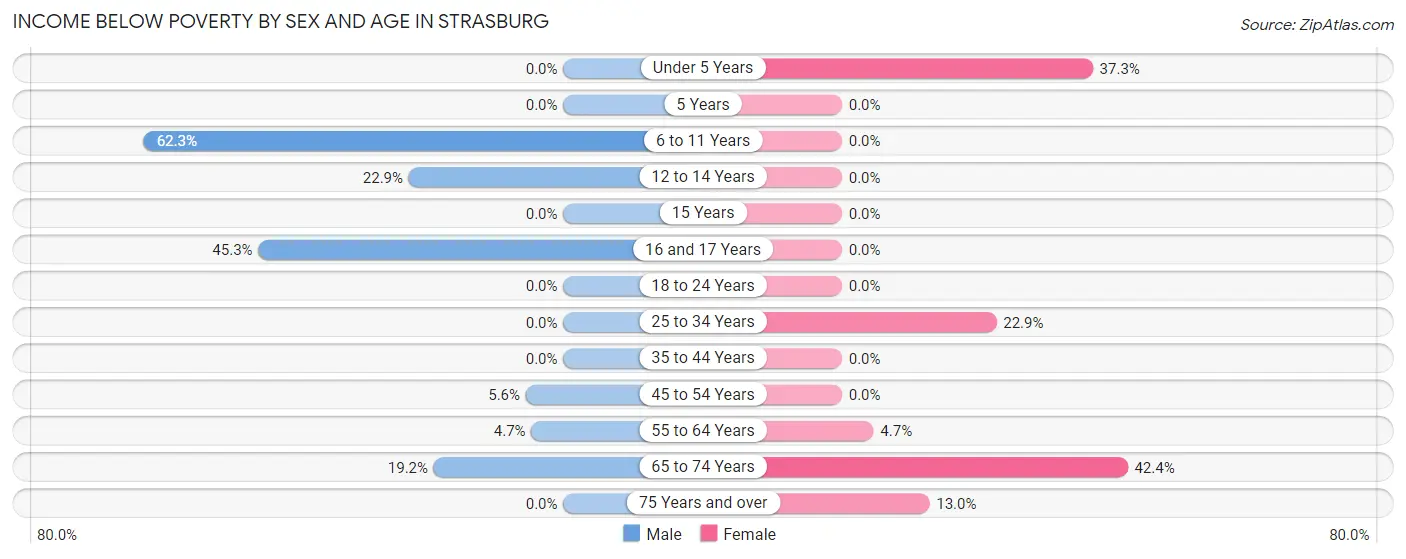
| Age Bracket | Male | Female |
| Under 5 Years | 0 (0.0%) | 38 (37.2%) |
| 5 Years | 0 (0.0%) | 0 (0.0%) |
| 6 to 11 Years | 76 (62.3%) | 0 (0.0%) |
| 12 to 14 Years | 39 (22.9%) | 0 (0.0%) |
| 15 Years | 0 (0.0%) | 0 (0.0%) |
| 16 and 17 Years | 48 (45.3%) | 0 (0.0%) |
| 18 to 24 Years | 0 (0.0%) | 0 (0.0%) |
| 25 to 34 Years | 0 (0.0%) | 39 (22.9%) |
| 35 to 44 Years | 0 (0.0%) | 0 (0.0%) |
| 45 to 54 Years | 16 (5.6%) | 0 (0.0%) |
| 55 to 64 Years | 9 (4.7%) | 9 (4.7%) |
| 65 to 74 Years | 20 (19.2%) | 84 (42.4%) |
| 75 Years and over | 0 (0.0%) | 10 (13.0%) |
| Total | 208 (12.8%) | 180 (11.9%) |
Income Above Poverty by Sex and Age in Strasburg
According to the poverty statistics in Strasburg, males aged under 5 years and females aged 5 years are the age groups that are most secure financially, with 100.0% of males and 100.0% of females in these age groups living above the poverty line.
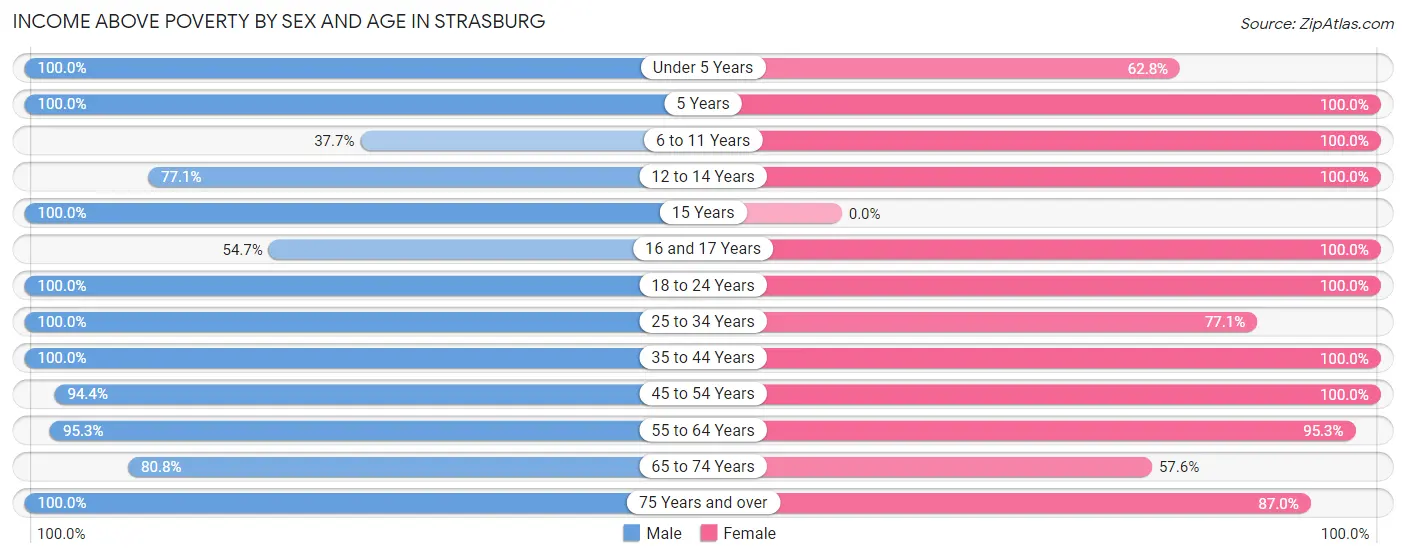
| Age Bracket | Male | Female |
| Under 5 Years | 44 (100.0%) | 64 (62.7%) |
| 5 Years | 48 (100.0%) | 12 (100.0%) |
| 6 to 11 Years | 46 (37.7%) | 216 (100.0%) |
| 12 to 14 Years | 131 (77.1%) | 65 (100.0%) |
| 15 Years | 47 (100.0%) | 0 (0.0%) |
| 16 and 17 Years | 58 (54.7%) | 29 (100.0%) |
| 18 to 24 Years | 202 (100.0%) | 151 (100.0%) |
| 25 to 34 Years | 133 (100.0%) | 131 (77.1%) |
| 35 to 44 Years | 154 (100.0%) | 194 (100.0%) |
| 45 to 54 Years | 271 (94.4%) | 107 (100.0%) |
| 55 to 64 Years | 181 (95.3%) | 183 (95.3%) |
| 65 to 74 Years | 84 (80.8%) | 114 (57.6%) |
| 75 Years and over | 16 (100.0%) | 67 (87.0%) |
| Total | 1,415 (87.2%) | 1,333 (88.1%) |
Income Below Poverty Among Married-Couple Families in Strasburg
The poverty statistics for married-couple families in Strasburg show that 3.5% or 20 of the total 565 families live below the poverty line. Families with no children have the highest poverty rate of 6.6%, comprising of 20 families. On the other hand, families with 1 or 2 children have the lowest poverty rate of 0.0%, which includes 0 families.
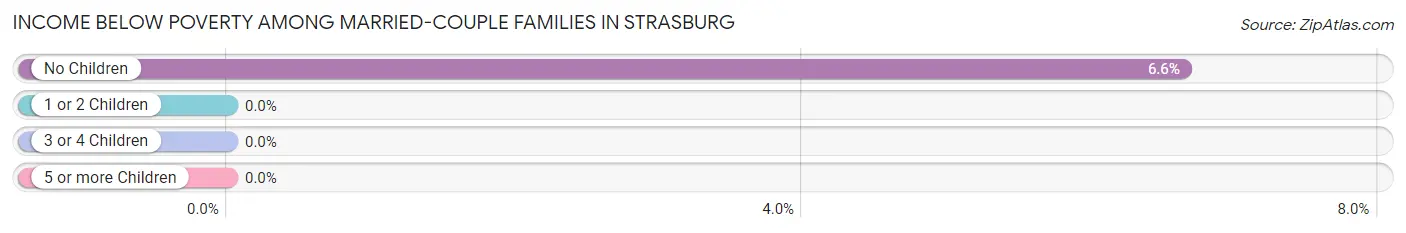
| Children | Above Poverty | Below Poverty |
| No Children | 281 (93.4%) | 20 (6.6%) |
| 1 or 2 Children | 172 (100.0%) | 0 (0.0%) |
| 3 or 4 Children | 92 (100.0%) | 0 (0.0%) |
| 5 or more Children | 0 (0.0%) | 0 (0.0%) |
| Total | 545 (96.5%) | 20 (3.5%) |
Income Below Poverty Among Single-Parent Households in Strasburg
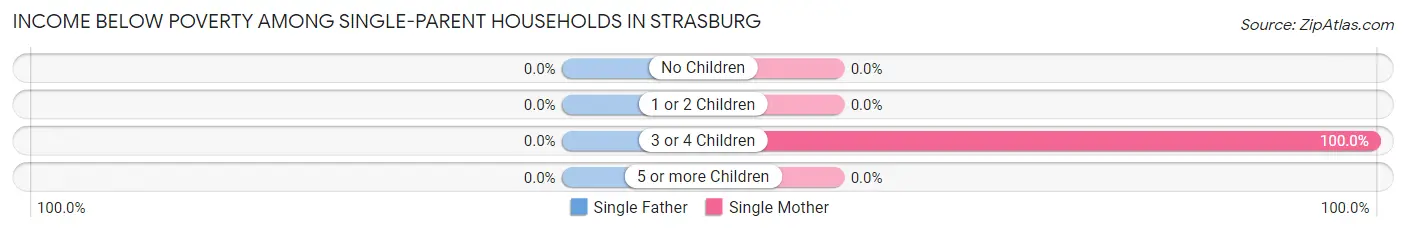
| Children | Single Father | Single Mother |
| No Children | 0 (0.0%) | 0 (0.0%) |
| 1 or 2 Children | 0 (0.0%) | 0 (0.0%) |
| 3 or 4 Children | 0 (0.0%) | 39 (100.0%) |
| 5 or more Children | 0 (0.0%) | 0 (0.0%) |
| Total | 0 (0.0%) | 39 (63.9%) |
Income Below Poverty Among Married-Couple vs Single-Parent Households in Strasburg
The poverty data for Strasburg shows that 20 of the married-couple family households (3.5%) and 39 of the single-parent households (34.2%) are living below the poverty level. Within the married-couple family households, those with no children have the highest poverty rate, with 20 households (6.6%) falling below the poverty line. Among the single-parent households, those with 3 or 4 children have the highest poverty rate, with 39 household (70.9%) living below poverty.
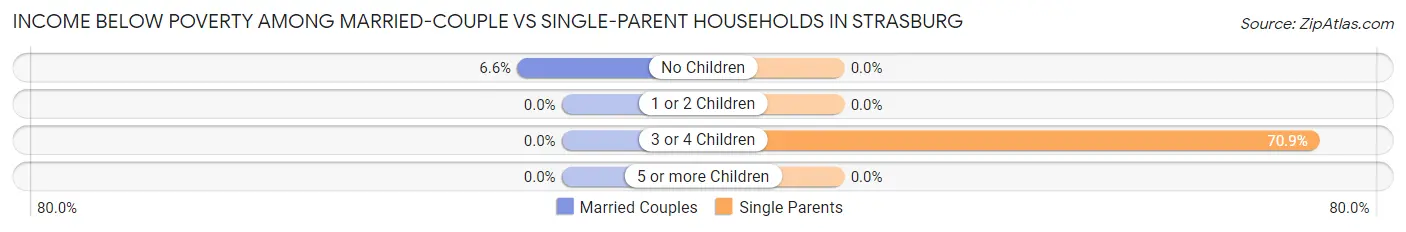
| Children | Married-Couple Families | Single-Parent Households |
| No Children | 20 (6.6%) | 0 (0.0%) |
| 1 or 2 Children | 0 (0.0%) | 0 (0.0%) |
| 3 or 4 Children | 0 (0.0%) | 39 (70.9%) |
| 5 or more Children | 0 (0.0%) | 0 (0.0%) |
| Total | 20 (3.5%) | 39 (34.2%) |
Race in Strasburg
The most populous races in Strasburg are White / Caucasian (2,302 | 73.1%), Hispanic or Latino (548 | 17.4%), and Some other Race (433 | 13.8%).
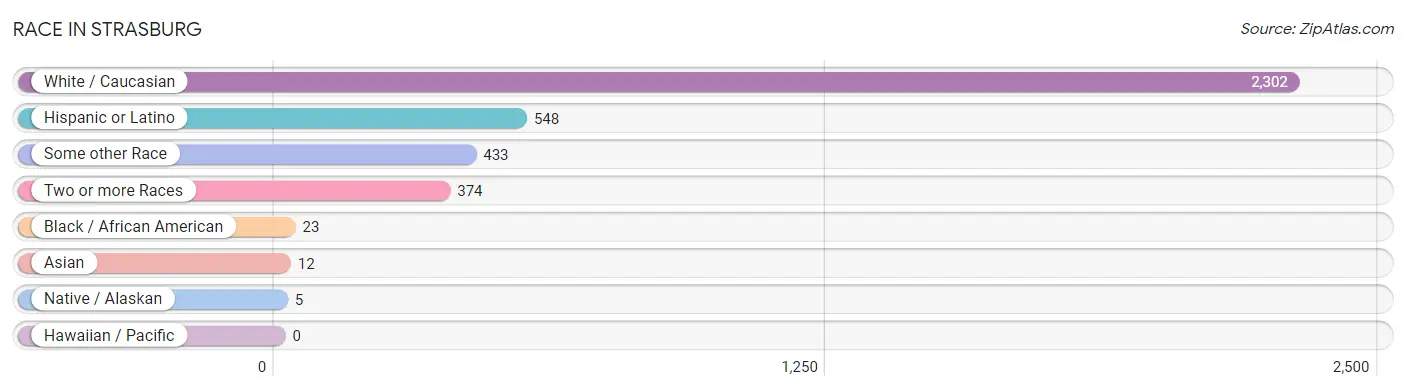
| Race | # Population | % Population |
| Asian | 12 | 0.4% |
| Black / African American | 23 | 0.7% |
| Hawaiian / Pacific | 0 | 0.0% |
| Hispanic or Latino | 548 | 17.4% |
| Native / Alaskan | 5 | 0.2% |
| White / Caucasian | 2,302 | 73.1% |
| Two or more Races | 374 | 11.9% |
| Some other Race | 433 | 13.8% |
| Total | 3,149 | 100.0% |
Ancestry in Strasburg
The most populous ancestries reported in Strasburg are German (586 | 18.6%), Mexican (505 | 16.0%), Irish (293 | 9.3%), English (236 | 7.5%), and French (155 | 4.9%), together accounting for 56.4% of all Strasburg residents.
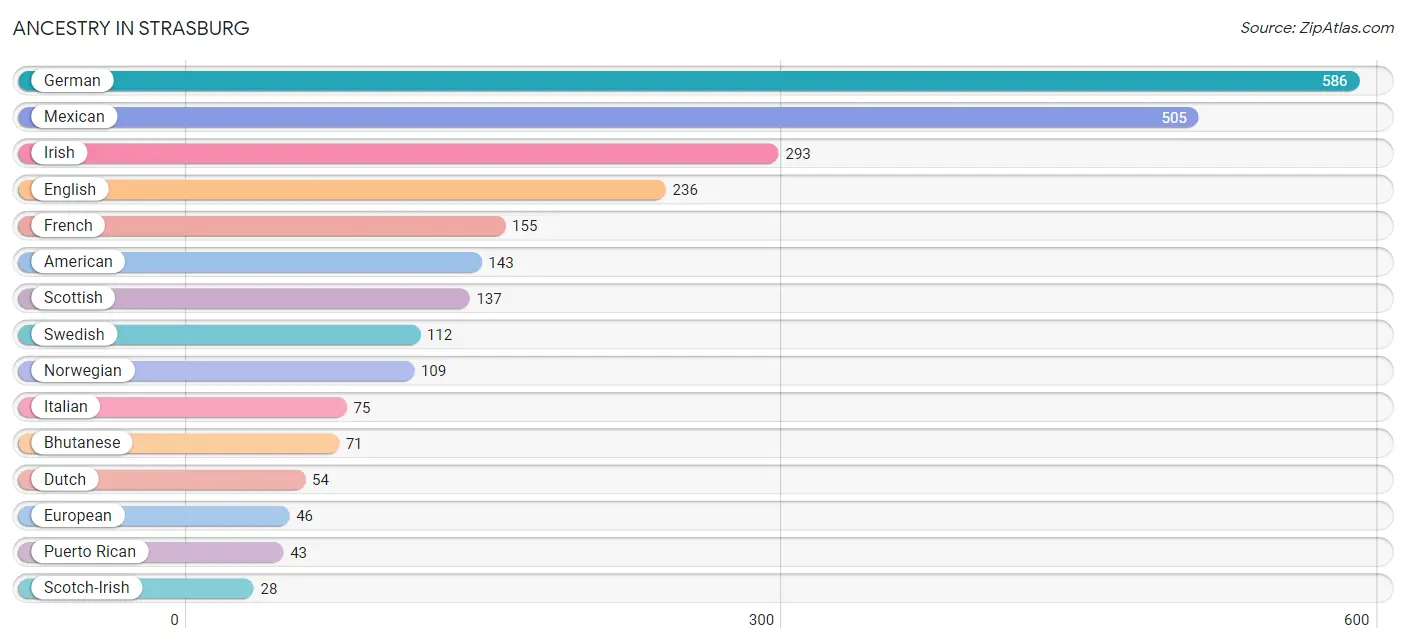
| Ancestry | # Population | % Population |
| American | 143 | 4.5% |
| Bhutanese | 71 | 2.2% |
| British | 7 | 0.2% |
| Burmese | 12 | 0.4% |
| Cherokee | 15 | 0.5% |
| Czech | 8 | 0.3% |
| Dutch | 54 | 1.7% |
| English | 236 | 7.5% |
| Ethiopian | 23 | 0.7% |
| European | 46 | 1.5% |
| French | 155 | 4.9% |
| German | 586 | 18.6% |
| Inupiat | 20 | 0.6% |
| Irish | 293 | 9.3% |
| Italian | 75 | 2.4% |
| Mexican | 505 | 16.0% |
| Norwegian | 109 | 3.5% |
| Polish | 24 | 0.8% |
| Puerto Rican | 43 | 1.4% |
| Russian | 14 | 0.4% |
| Scandinavian | 16 | 0.5% |
| Scotch-Irish | 28 | 0.9% |
| Scottish | 137 | 4.3% |
| Subsaharan African | 23 | 0.7% |
| Swedish | 112 | 3.6% | View All 25 Rows |
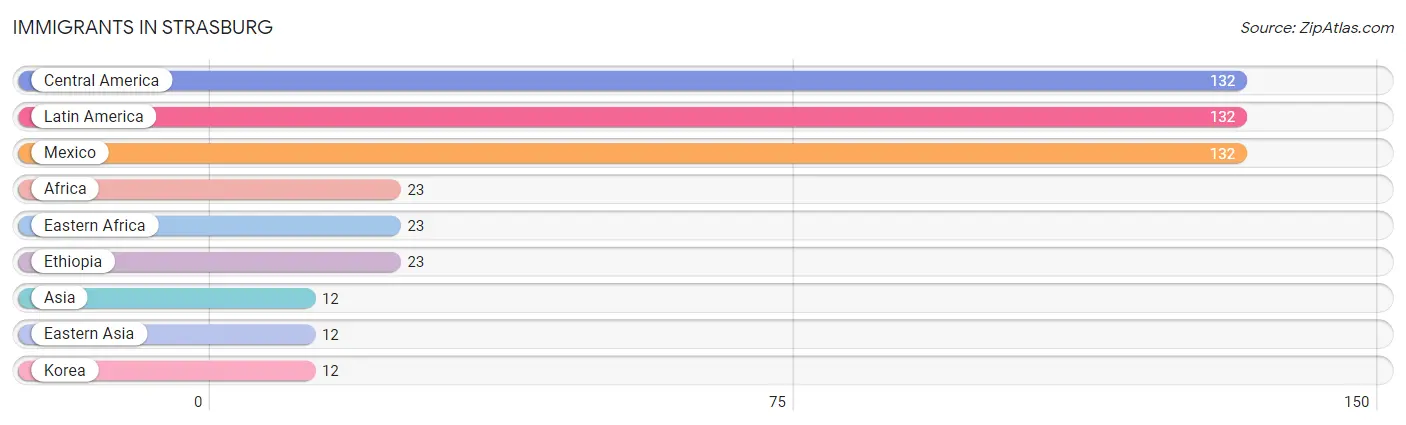
Immigrants in Strasburg
The most numerous immigrant groups reported in Strasburg came from Central America (132 | 4.2%), Latin America (132 | 4.2%), Mexico (132 | 4.2%), Africa (23 | 0.7%), and Eastern Africa (23 | 0.7%), together accounting for 14.0% of all Strasburg residents.
| Immigration Origin | # Population | % Population |
| Africa | 23 | 0.7% |
| Asia | 12 | 0.4% |
| Central America | 132 | 4.2% |
| Eastern Africa | 23 | 0.7% |
| Eastern Asia | 12 | 0.4% |
| Ethiopia | 23 | 0.7% |
| Korea | 12 | 0.4% |
| Latin America | 132 | 4.2% |
| Mexico | 132 | 4.2% | View All 9 Rows |
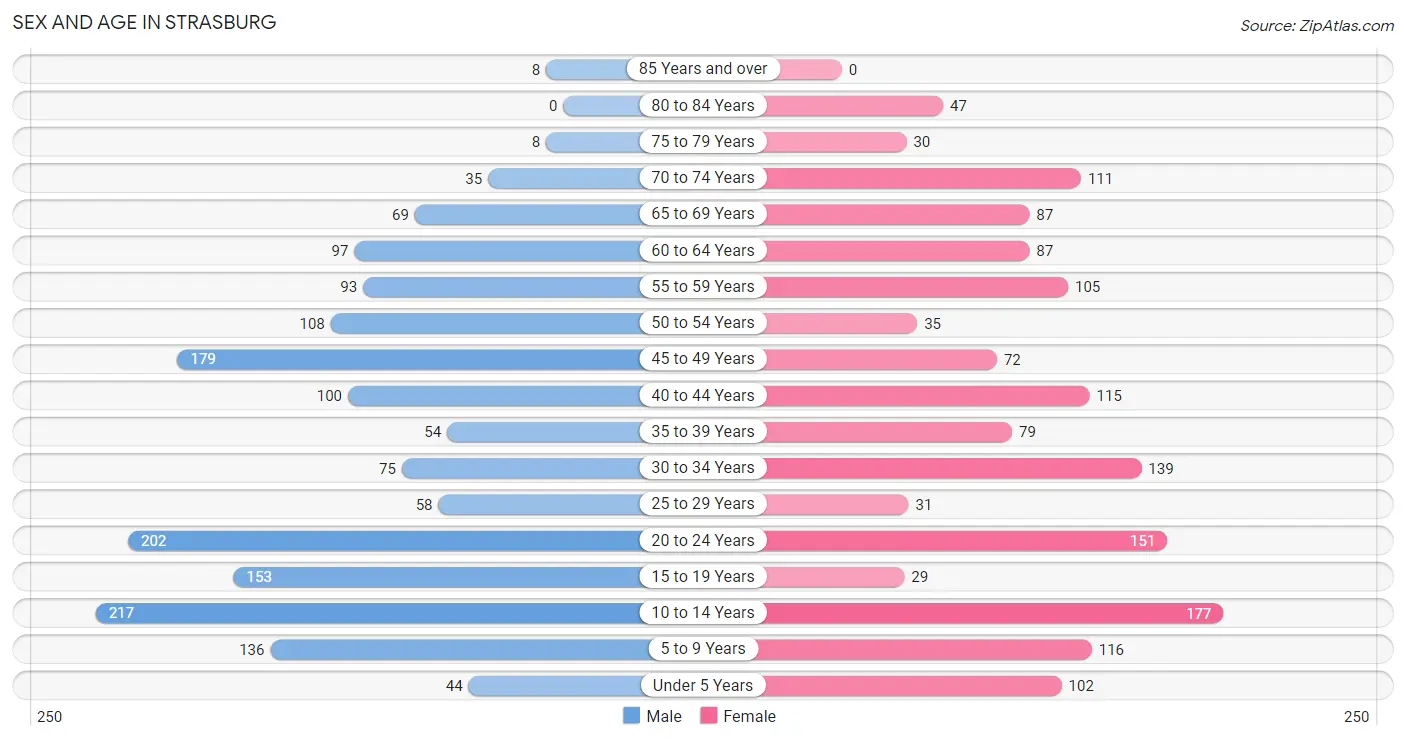
Sex and Age in Strasburg
Sex and Age in Strasburg
The most populous age groups in Strasburg are 10 to 14 Years (217 | 13.3%) for men and 10 to 14 Years (177 | 11.7%) for women.
| Age Bracket | Male | Female |
| Under 5 Years | 44 (2.7%) | 102 (6.7%) |
| 5 to 9 Years | 136 (8.3%) | 116 (7.7%) |
| 10 to 14 Years | 217 (13.3%) | 177 (11.7%) |
| 15 to 19 Years | 153 (9.3%) | 29 (1.9%) |
| 20 to 24 Years | 202 (12.3%) | 151 (10.0%) |
| 25 to 29 Years | 58 (3.5%) | 31 (2.1%) |
| 30 to 34 Years | 75 (4.6%) | 139 (9.2%) |
| 35 to 39 Years | 54 (3.3%) | 79 (5.2%) |
| 40 to 44 Years | 100 (6.1%) | 115 (7.6%) |
| 45 to 49 Years | 179 (10.9%) | 72 (4.8%) |
| 50 to 54 Years | 108 (6.6%) | 35 (2.3%) |
| 55 to 59 Years | 93 (5.7%) | 105 (6.9%) |
| 60 to 64 Years | 97 (5.9%) | 87 (5.8%) |
| 65 to 69 Years | 69 (4.2%) | 87 (5.8%) |
| 70 to 74 Years | 35 (2.1%) | 111 (7.3%) |
| 75 to 79 Years | 8 (0.5%) | 30 (2.0%) |
| 80 to 84 Years | 0 (0.0%) | 47 (3.1%) |
| 85 Years and over | 8 (0.5%) | 0 (0.0%) |
| Total | 1,636 (100.0%) | 1,513 (100.0%) |
Families and Households in Strasburg
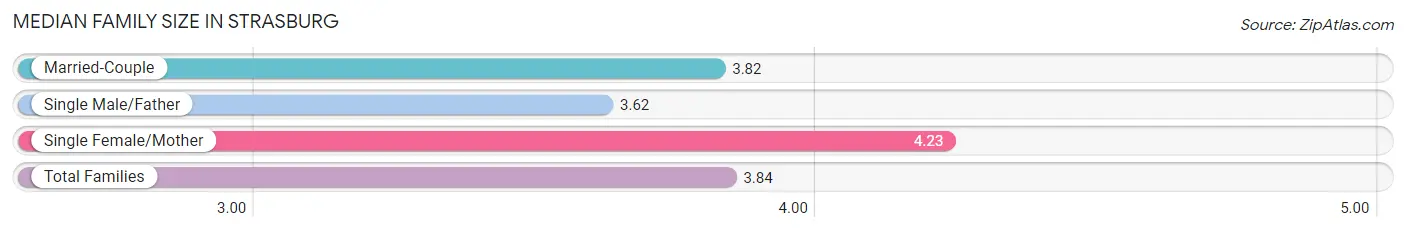
Median Family Size in Strasburg
The median family size in Strasburg is 3.84 persons per family, with single female/mother families (61 | 9.0%) accounting for the largest median family size of 4.23 persons per family. On the other hand, single male/father families (53 | 7.8%) represent the smallest median family size with 3.62 persons per family.
| Family Type | # Families | Family Size |
| Married-Couple | 565 (83.2%) | 3.82 |
| Single Male/Father | 53 (7.8%) | 3.62 |
| Single Female/Mother | 61 (9.0%) | 4.23 |
| Total Families | 679 (100.0%) | 3.84 |
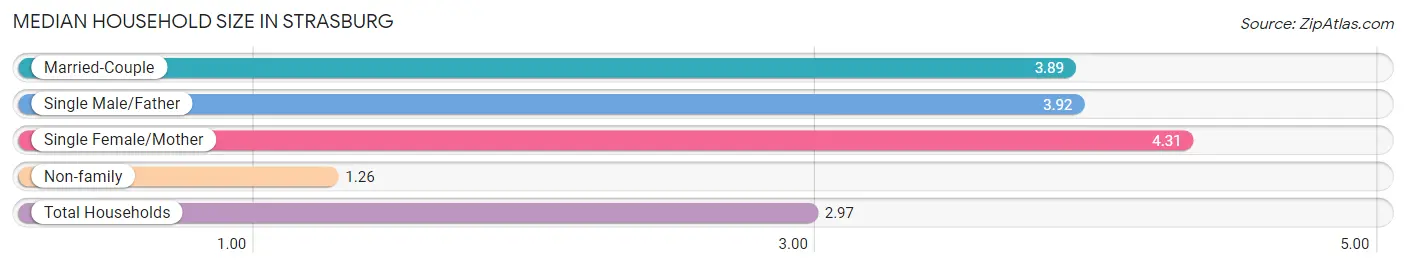
Median Household Size in Strasburg
The median household size in Strasburg is 2.97 persons per household, with single female/mother households (61 | 5.8%) accounting for the largest median household size of 4.31 persons per household. non-family households (381 | 35.9%) represent the smallest median household size with 1.26 persons per household.
| Household Type | # Households | Household Size |
| Married-Couple | 565 (53.3%) | 3.89 |
| Single Male/Father | 53 (5.0%) | 3.92 |
| Single Female/Mother | 61 (5.8%) | 4.31 |
| Non-family | 381 (35.9%) | 1.26 |
| Total Households | 1,060 (100.0%) | 2.97 |
Household Size by Marriage Status in Strasburg
Out of a total of 1,060 households in Strasburg, 679 (64.1%) are family households, while 381 (35.9%) are nonfamily households. The most numerous type of family households are 2-person households, comprising 227, and the most common type of nonfamily households are 1-person households, comprising 323.
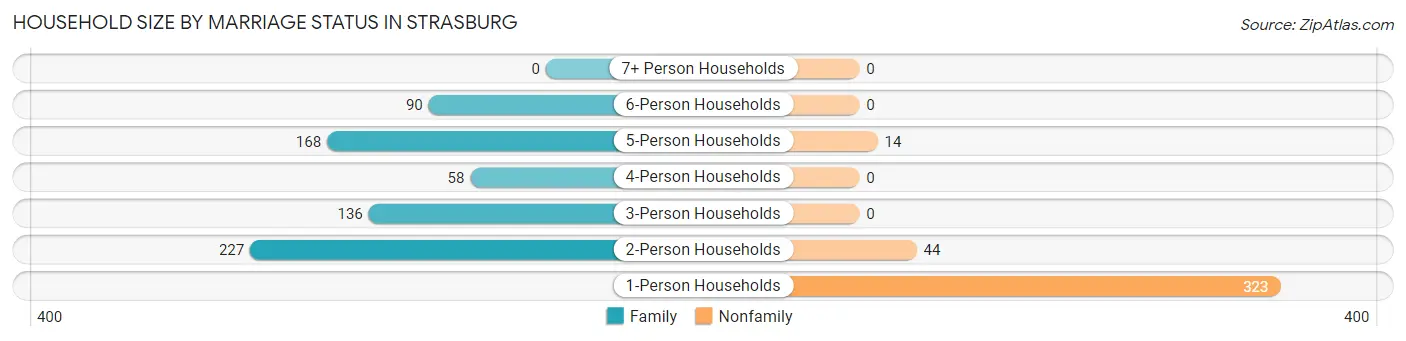
| Household Size | Family Households | Nonfamily Households |
| 1-Person Households | - | 323 (30.5%) |
| 2-Person Households | 227 (21.4%) | 44 (4.2%) |
| 3-Person Households | 136 (12.8%) | 0 (0.0%) |
| 4-Person Households | 58 (5.5%) | 0 (0.0%) |
| 5-Person Households | 168 (15.9%) | 14 (1.3%) |
| 6-Person Households | 90 (8.5%) | 0 (0.0%) |
| 7+ Person Households | 0 (0.0%) | 0 (0.0%) |
| Total | 679 (64.1%) | 381 (35.9%) |
Female Fertility in Strasburg
Fertility by Age in Strasburg
| Age Bracket | Women with Births | Births / 1,000 Women |
| 15 to 19 years | 0 (0.0%) | 0.0 |
| 20 to 34 years | 0 (0.0%) | 0.0 |
| 35 to 50 years | 0 (0.0%) | 0.0 |
| Total | 0 (0.0%) | 0.0 |
Fertility by Age by Marriage Status in Strasburg
| Age Bracket | Married | Unmarried |
| 15 to 19 years | 0 (0.0%) | 0 (0.0%) |
| 20 to 34 years | 0 (0.0%) | 0 (0.0%) |
| 35 to 50 years | 0 (0.0%) | 0 (0.0%) |
| Total | 0 (0.0%) | 0 (0.0%) |
Fertility by Education in Strasburg
| Educational Attainment | Women with Births | Births / 1,000 Women |
| Less than High School | 0 (0.0%) | 0.0 |
| High School Diploma | 0 (0.0%) | 0.0 |
| College or Associate's Degree | 0 (0.0%) | 0.0 |
| Bachelor's Degree | 0 (0.0%) | 0.0 |
| Graduate Degree | 0 (0.0%) | 0.0 |
| Total | 0 (0.0%) | 0.0 |
Fertility by Education by Marriage Status in Strasburg
| Educational Attainment | Married | Unmarried |
| Less than High School | 0 (0.0%) | 0 (0.0%) |
| High School Diploma | 0 (0.0%) | 0 (0.0%) |
| College or Associate's Degree | 0 (0.0%) | 0 (0.0%) |
| Bachelor's Degree | 0 (0.0%) | 0 (0.0%) |
| Graduate Degree | 0 (0.0%) | 0 (0.0%) |
| Total | 0 (0.0%) | 0 (0.0%) |
Employment Characteristics in Strasburg
Employment by Class of Employer in Strasburg
Among the 1,438 employed individuals in Strasburg, private company employees (962 | 66.9%), local government employees (169 | 11.7%), and self-employed (not incorporated) (108 | 7.5%) make up the most common classes of employment.
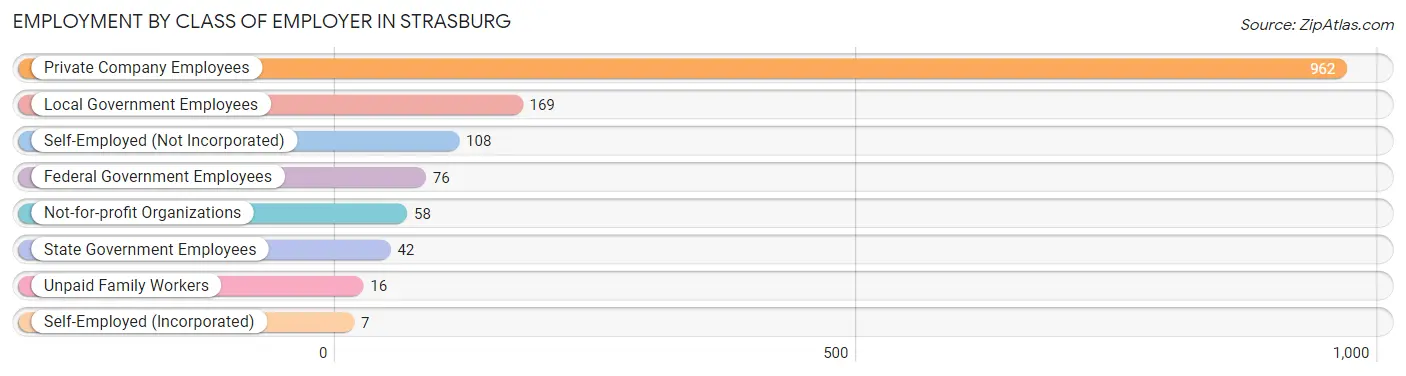
| Employer Class | # Employees | % Employees |
| Private Company Employees | 962 | 66.9% |
| Self-Employed (Incorporated) | 7 | 0.5% |
| Self-Employed (Not Incorporated) | 108 | 7.5% |
| Not-for-profit Organizations | 58 | 4.0% |
| Local Government Employees | 169 | 11.7% |
| State Government Employees | 42 | 2.9% |
| Federal Government Employees | 76 | 5.3% |
| Unpaid Family Workers | 16 | 1.1% |
| Total | 1,438 | 100.0% |
Employment Status by Age in Strasburg
According to the labor force statistics for Strasburg, out of the total population over 16 years of age (2,310), 67.4% or 1,557 individuals are in the labor force, with 6.1% or 95 of them unemployed. The age group with the highest labor force participation rate is 35 to 44 years, with 94.3% or 328 individuals in the labor force. Within the labor force, the 16 to 19 years age range has the highest percentage of unemployed individuals, with 34.7% or 25 of them being unemployed.
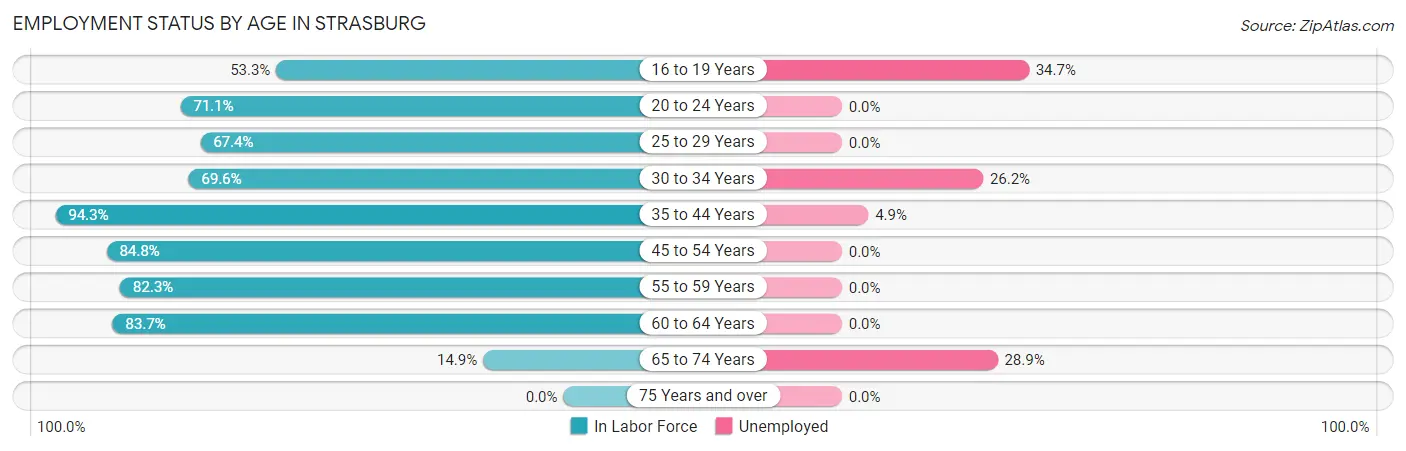
| Age Bracket | In Labor Force | Unemployed |
| 16 to 19 Years | 72 (53.3%) | 25 (34.7%) |
| 20 to 24 Years | 251 (71.1%) | 0 (0.0%) |
| 25 to 29 Years | 60 (67.4%) | 0 (0.0%) |
| 30 to 34 Years | 149 (69.6%) | 39 (26.2%) |
| 35 to 44 Years | 328 (94.3%) | 16 (4.9%) |
| 45 to 54 Years | 334 (84.8%) | 0 (0.0%) |
| 55 to 59 Years | 163 (82.3%) | 0 (0.0%) |
| 60 to 64 Years | 154 (83.7%) | 0 (0.0%) |
| 65 to 74 Years | 45 (14.9%) | 13 (28.9%) |
| 75 Years and over | 0 (0.0%) | 0 (0.0%) |
| Total | 1,557 (67.4%) | 95 (6.1%) |
Employment Status by Educational Attainment in Strasburg
According to labor force statistics for Strasburg, 83.3% of individuals (1,189) out of the total population between 25 and 64 years of age (1,427) are in the labor force, with 4.7% or 56 of them being unemployed. The group with the highest labor force participation rate are those with the educational attainment of bachelor's degree or higher, with 91.1% or 226 individuals in the labor force. Within the labor force, individuals with less than high school education have the highest percentage of unemployment, with 33.6% or 39 of them being unemployed.
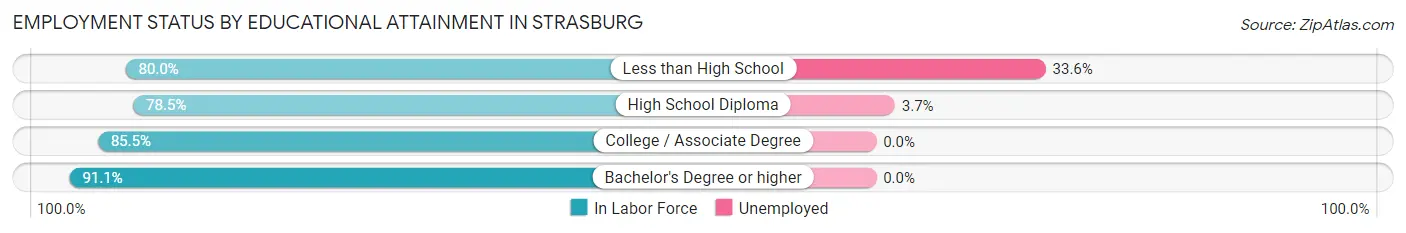
| Educational Attainment | In Labor Force | Unemployed |
| Less than High School | 116 (80.0%) | 49 (33.6%) |
| High School Diploma | 427 (78.5%) | 20 (3.7%) |
| College / Associate Degree | 419 (85.5%) | 0 (0.0%) |
| Bachelor's Degree or higher | 226 (91.1%) | 0 (0.0%) |
| Total | 1,189 (83.3%) | 67 (4.7%) |
Employment Occupations by Sex in Strasburg
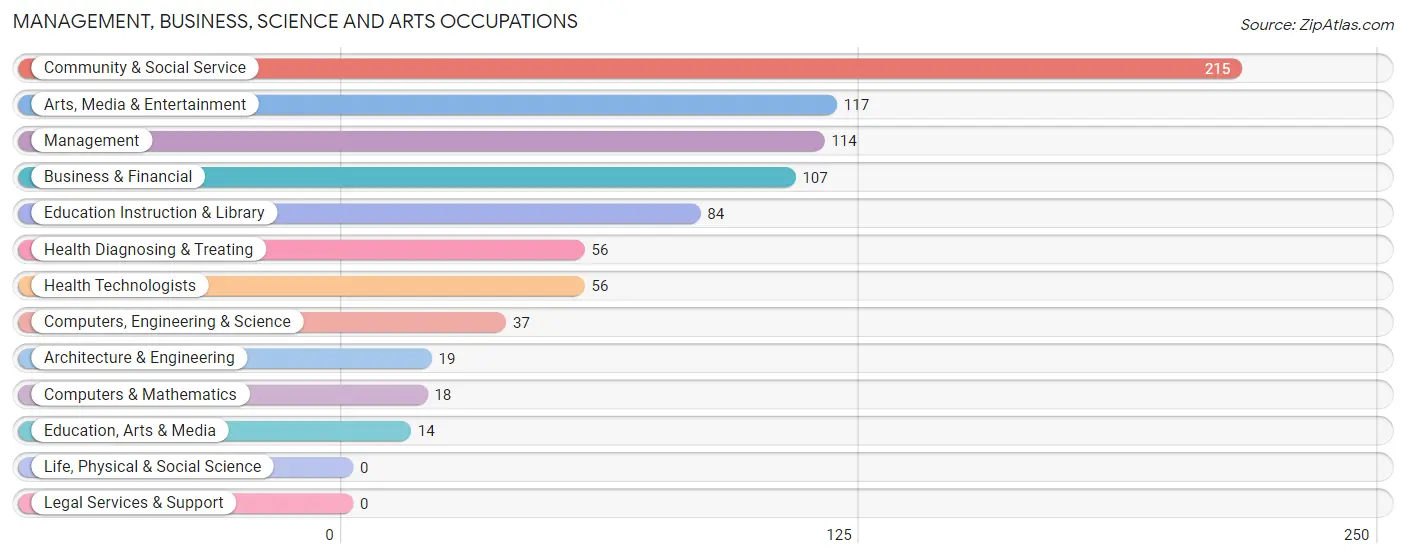
Management, Business, Science and Arts Occupations
The most common Management, Business, Science and Arts occupations in Strasburg are Community & Social Service (215 | 15.0%), Arts, Media & Entertainment (117 | 8.2%), Management (114 | 7.9%), Business & Financial (107 | 7.5%), and Education Instruction & Library (84 | 5.9%).
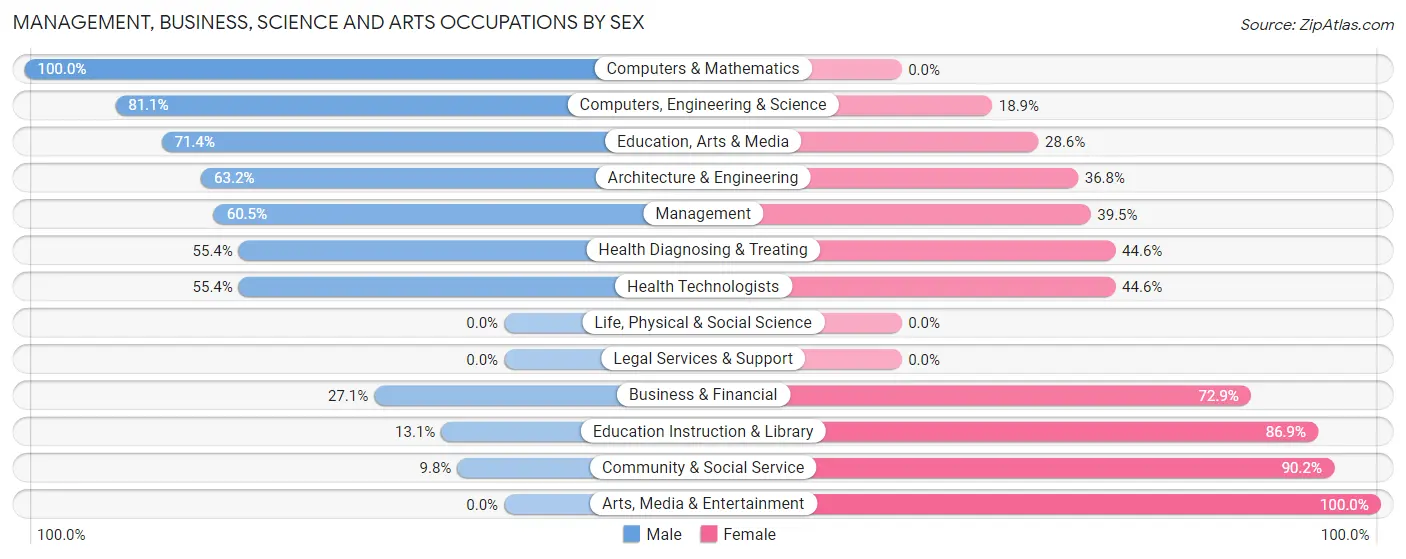
Management, Business, Science and Arts Occupations by Sex
Within the Management, Business, Science and Arts occupations in Strasburg, the most male-oriented occupations are Computers & Mathematics (100.0%), Computers, Engineering & Science (81.1%), and Education, Arts & Media (71.4%), while the most female-oriented occupations are Arts, Media & Entertainment (100.0%), Community & Social Service (90.2%), and Education Instruction & Library (86.9%).
| Occupation | Male | Female |
| Management | 69 (60.5%) | 45 (39.5%) |
| Business & Financial | 29 (27.1%) | 78 (72.9%) |
| Computers, Engineering & Science | 30 (81.1%) | 7 (18.9%) |
| Computers & Mathematics | 18 (100.0%) | 0 (0.0%) |
| Architecture & Engineering | 12 (63.2%) | 7 (36.8%) |
| Life, Physical & Social Science | 0 (0.0%) | 0 (0.0%) |
| Community & Social Service | 21 (9.8%) | 194 (90.2%) |
| Education, Arts & Media | 10 (71.4%) | 4 (28.6%) |
| Legal Services & Support | 0 (0.0%) | 0 (0.0%) |
| Education Instruction & Library | 11 (13.1%) | 73 (86.9%) |
| Arts, Media & Entertainment | 0 (0.0%) | 117 (100.0%) |
| Health Diagnosing & Treating | 31 (55.4%) | 25 (44.6%) |
| Health Technologists | 31 (55.4%) | 25 (44.6%) |
| Total (Category) | 180 (34.0%) | 349 (66.0%) |
| Total (Overall) | 778 (54.2%) | 657 (45.8%) |
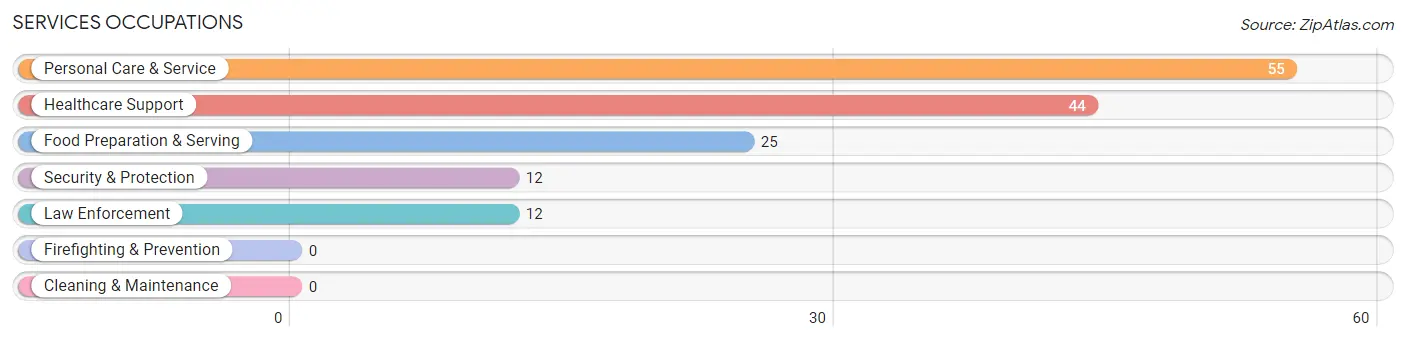
Services Occupations
The most common Services occupations in Strasburg are Personal Care & Service (55 | 3.8%), Healthcare Support (44 | 3.1%), Food Preparation & Serving (25 | 1.7%), Security & Protection (12 | 0.8%), and Law Enforcement (12 | 0.8%).
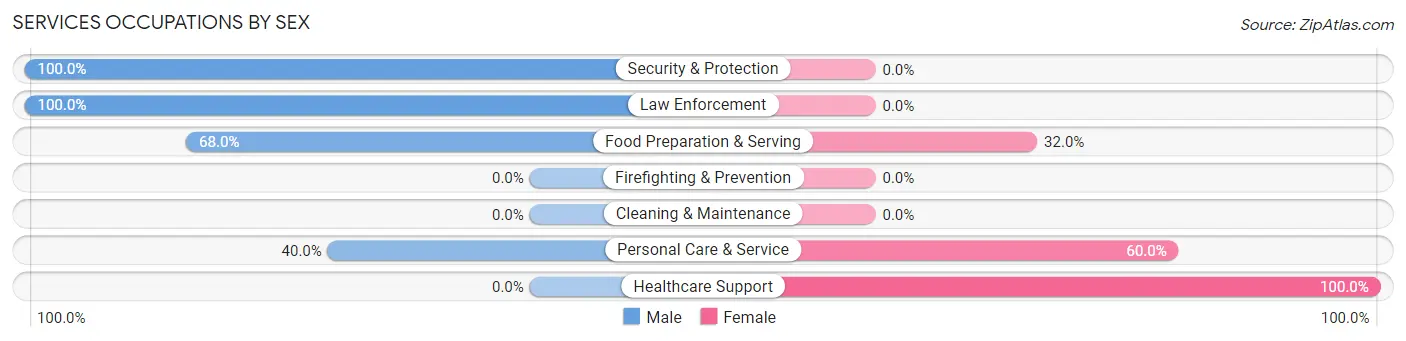
Services Occupations by Sex
Within the Services occupations in Strasburg, the most male-oriented occupations are Security & Protection (100.0%), Law Enforcement (100.0%), and Food Preparation & Serving (68.0%), while the most female-oriented occupations are Healthcare Support (100.0%), Personal Care & Service (60.0%), and Food Preparation & Serving (32.0%).
| Occupation | Male | Female |
| Healthcare Support | 0 (0.0%) | 44 (100.0%) |
| Security & Protection | 12 (100.0%) | 0 (0.0%) |
| Firefighting & Prevention | 0 (0.0%) | 0 (0.0%) |
| Law Enforcement | 12 (100.0%) | 0 (0.0%) |
| Food Preparation & Serving | 17 (68.0%) | 8 (32.0%) |
| Cleaning & Maintenance | 0 (0.0%) | 0 (0.0%) |
| Personal Care & Service | 22 (40.0%) | 33 (60.0%) |
| Total (Category) | 51 (37.5%) | 85 (62.5%) |
| Total (Overall) | 778 (54.2%) | 657 (45.8%) |
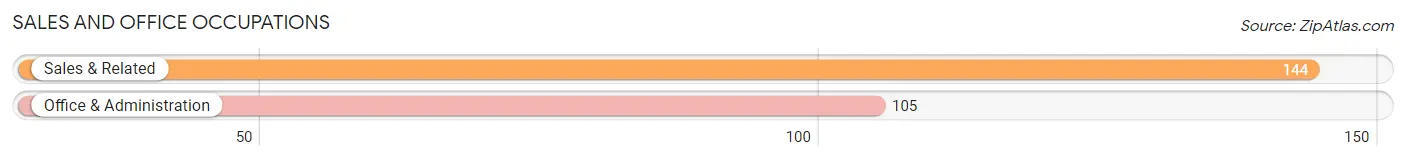
Sales and Office Occupations
The most common Sales and Office occupations in Strasburg are Sales & Related (144 | 10.0%), and Office & Administration (105 | 7.3%).
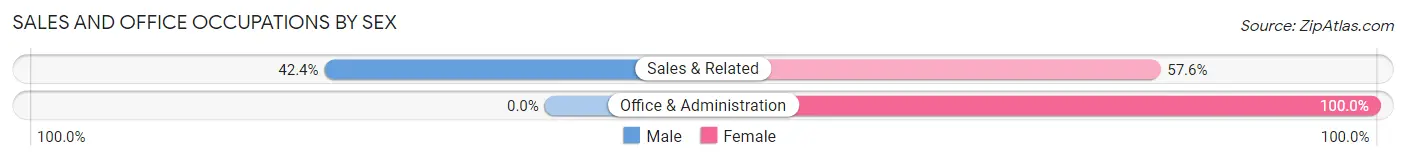
Sales and Office Occupations by Sex
| Occupation | Male | Female |
| Sales & Related | 61 (42.4%) | 83 (57.6%) |
| Office & Administration | 0 (0.0%) | 105 (100.0%) |
| Total (Category) | 61 (24.5%) | 188 (75.5%) |
| Total (Overall) | 778 (54.2%) | 657 (45.8%) |
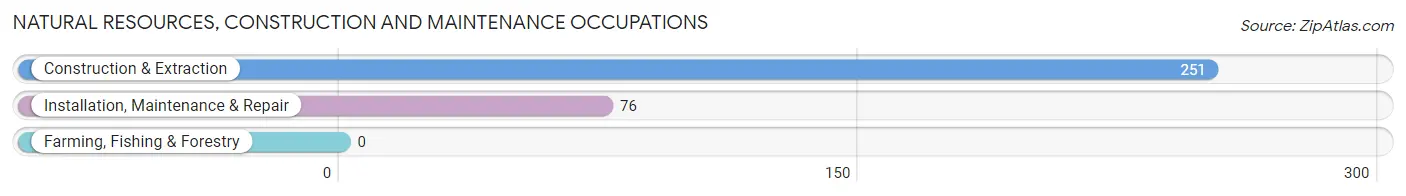
Natural Resources, Construction and Maintenance Occupations
The most common Natural Resources, Construction and Maintenance occupations in Strasburg are Construction & Extraction (251 | 17.5%), and Installation, Maintenance & Repair (76 | 5.3%).
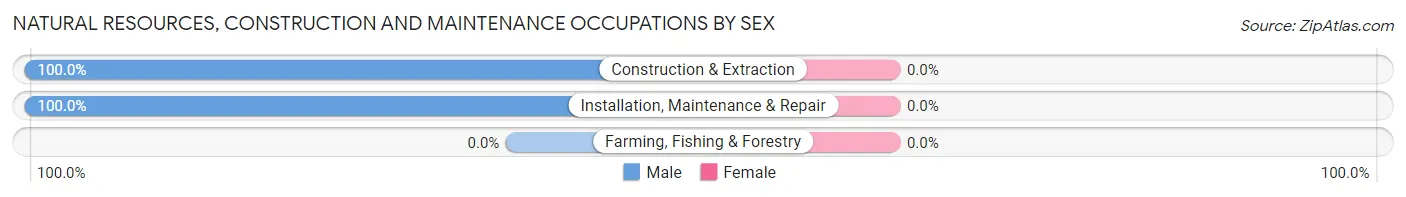
Natural Resources, Construction and Maintenance Occupations by Sex
| Occupation | Male | Female |
| Farming, Fishing & Forestry | 0 (0.0%) | 0 (0.0%) |
| Construction & Extraction | 251 (100.0%) | 0 (0.0%) |
| Installation, Maintenance & Repair | 76 (100.0%) | 0 (0.0%) |
| Total (Category) | 327 (100.0%) | 0 (0.0%) |
| Total (Overall) | 778 (54.2%) | 657 (45.8%) |
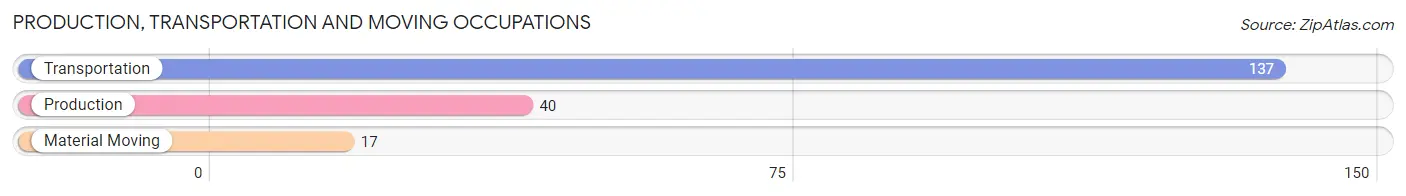
Production, Transportation and Moving Occupations
The most common Production, Transportation and Moving occupations in Strasburg are Transportation (137 | 9.6%), Production (40 | 2.8%), and Material Moving (17 | 1.2%).
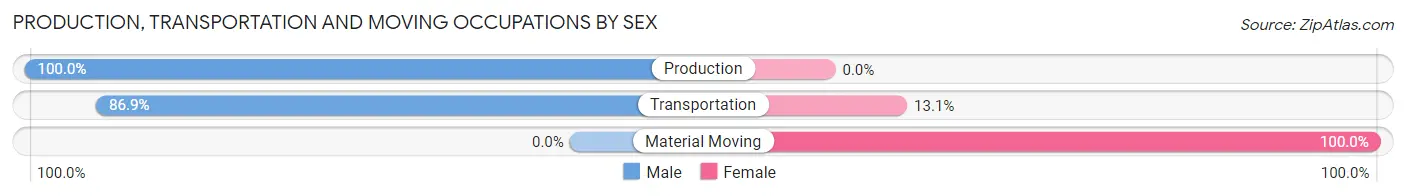
Production, Transportation and Moving Occupations by Sex
| Occupation | Male | Female |
| Production | 40 (100.0%) | 0 (0.0%) |
| Transportation | 119 (86.9%) | 18 (13.1%) |
| Material Moving | 0 (0.0%) | 17 (100.0%) |
| Total (Category) | 159 (82.0%) | 35 (18.0%) |
| Total (Overall) | 778 (54.2%) | 657 (45.8%) |
Employment Industries by Sex in Strasburg
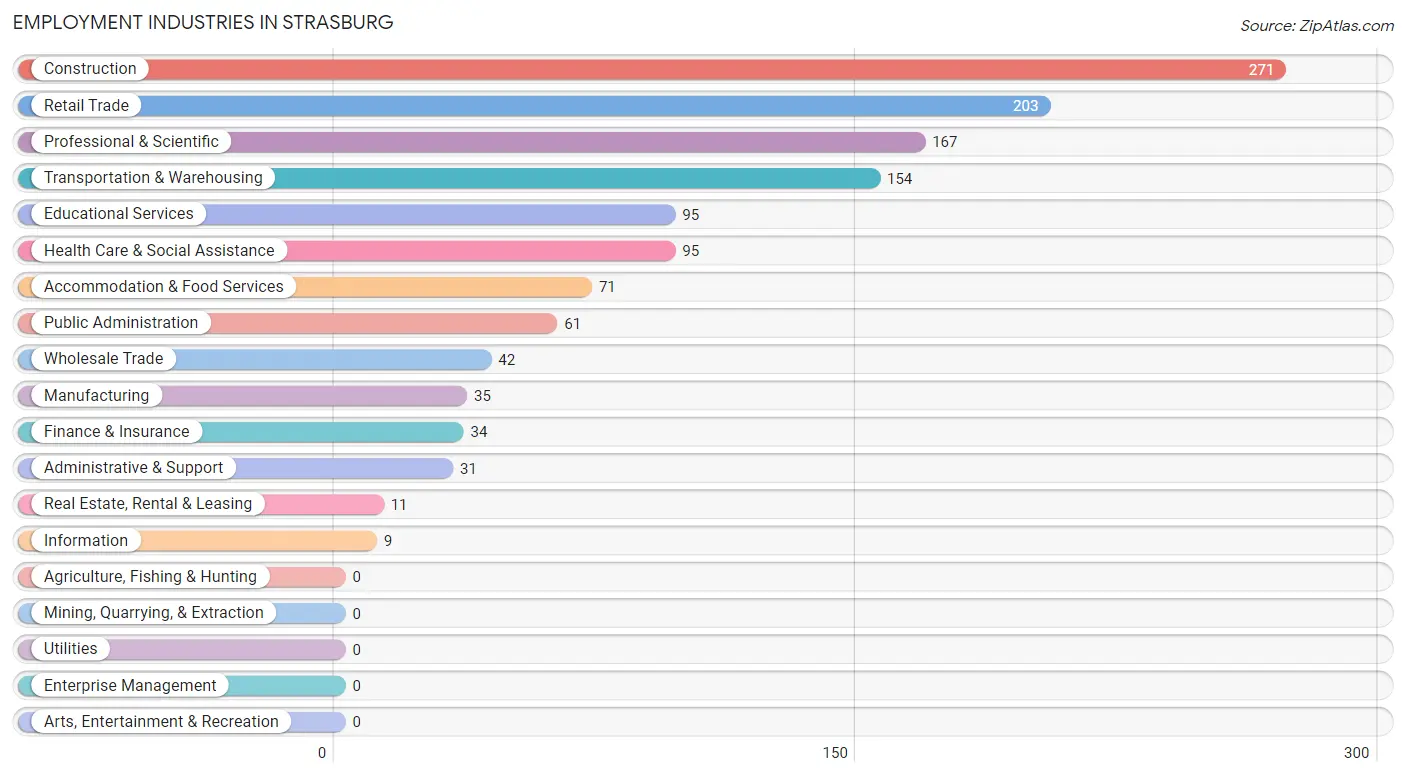
Employment Industries in Strasburg
The major employment industries in Strasburg include Construction (271 | 18.9%), Retail Trade (203 | 14.1%), Professional & Scientific (167 | 11.6%), Transportation & Warehousing (154 | 10.7%), and Educational Services (95 | 6.6%).
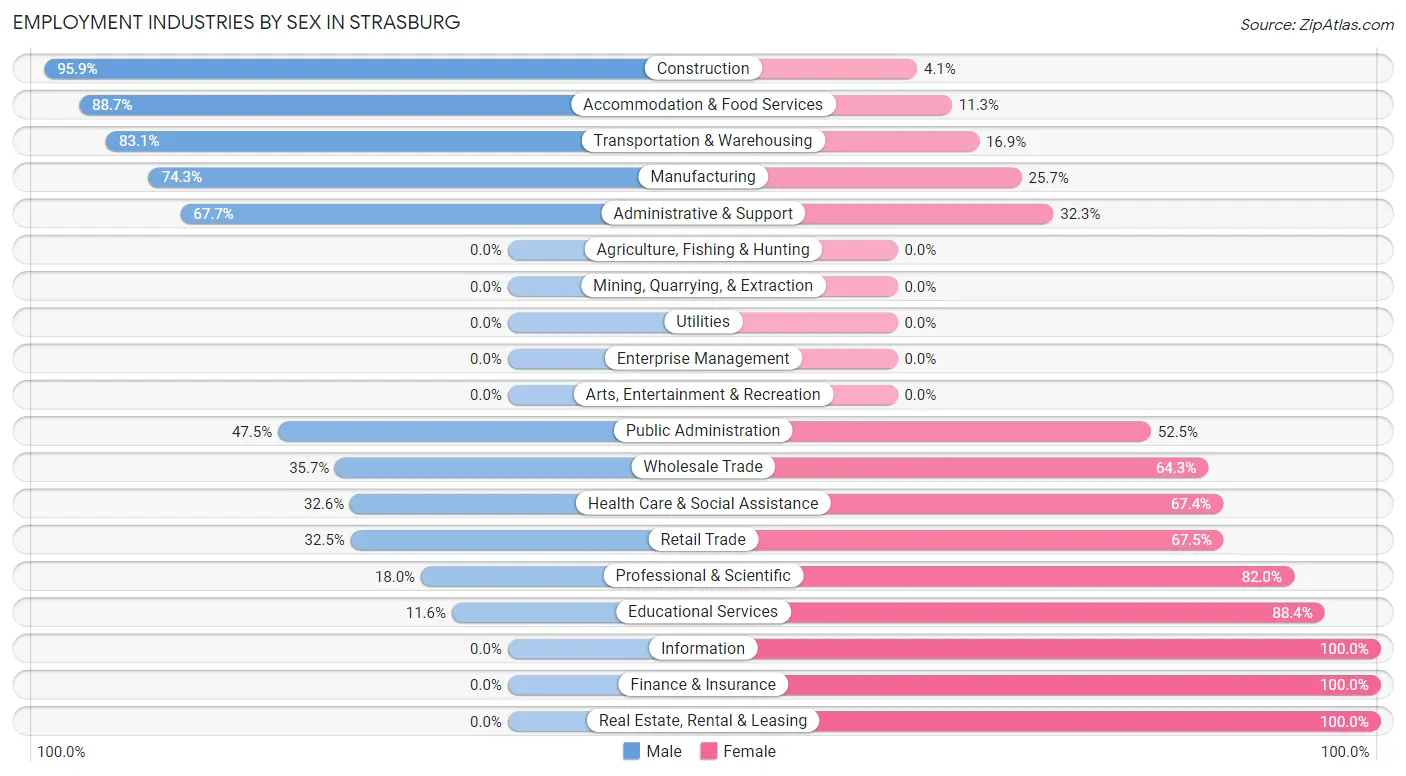
Employment Industries by Sex in Strasburg
The Strasburg industries that see more men than women are Construction (95.9%), Accommodation & Food Services (88.7%), and Transportation & Warehousing (83.1%), whereas the industries that tend to have a higher number of women are Information (100.0%), Finance & Insurance (100.0%), and Real Estate, Rental & Leasing (100.0%).
| Industry | Male | Female |
| Agriculture, Fishing & Hunting | 0 (0.0%) | 0 (0.0%) |
| Mining, Quarrying, & Extraction | 0 (0.0%) | 0 (0.0%) |
| Construction | 260 (95.9%) | 11 (4.1%) |
| Manufacturing | 26 (74.3%) | 9 (25.7%) |
| Wholesale Trade | 15 (35.7%) | 27 (64.3%) |
| Retail Trade | 66 (32.5%) | 137 (67.5%) |
| Transportation & Warehousing | 128 (83.1%) | 26 (16.9%) |
| Utilities | 0 (0.0%) | 0 (0.0%) |
| Information | 0 (0.0%) | 9 (100.0%) |
| Finance & Insurance | 0 (0.0%) | 34 (100.0%) |
| Real Estate, Rental & Leasing | 0 (0.0%) | 11 (100.0%) |
| Professional & Scientific | 30 (18.0%) | 137 (82.0%) |
| Enterprise Management | 0 (0.0%) | 0 (0.0%) |
| Administrative & Support | 21 (67.7%) | 10 (32.3%) |
| Educational Services | 11 (11.6%) | 84 (88.4%) |
| Health Care & Social Assistance | 31 (32.6%) | 64 (67.4%) |
| Arts, Entertainment & Recreation | 0 (0.0%) | 0 (0.0%) |
| Accommodation & Food Services | 63 (88.7%) | 8 (11.3%) |
| Public Administration | 29 (47.5%) | 32 (52.5%) |
| Total | 778 (54.2%) | 657 (45.8%) |
Education in Strasburg
School Enrollment in Strasburg
The most common levels of schooling among the 765 students in Strasburg are high school (260 | 34.0%), middle school (230 | 30.1%), and elementary school (188 | 24.6%).
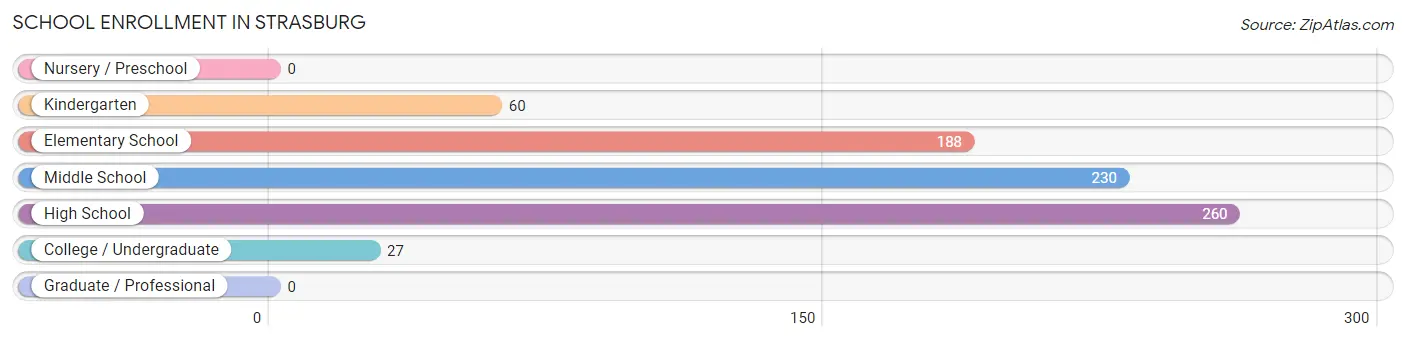
| School Level | # Students | % Students |
| Nursery / Preschool | 0 | 0.0% |
| Kindergarten | 60 | 7.8% |
| Elementary School | 188 | 24.6% |
| Middle School | 230 | 30.1% |
| High School | 260 | 34.0% |
| College / Undergraduate | 27 | 3.5% |
| Graduate / Professional | 0 | 0.0% |
| Total | 765 | 100.0% |
School Enrollment by Age by Funding Source in Strasburg
Out of a total of 765 students who are enrolled in schools in Strasburg, 45 (5.9%) attend a private institution, while the remaining 720 (94.1%) are enrolled in public schools. The age group of 20 to 24 year olds has the highest likelihood of being enrolled in private schools, with 17 (100.0% in the age bracket) enrolled. Conversely, the age group of 5 to 9 year old has the lowest likelihood of being enrolled in a private school, with 214 (100.0% in the age bracket) attending a public institution.
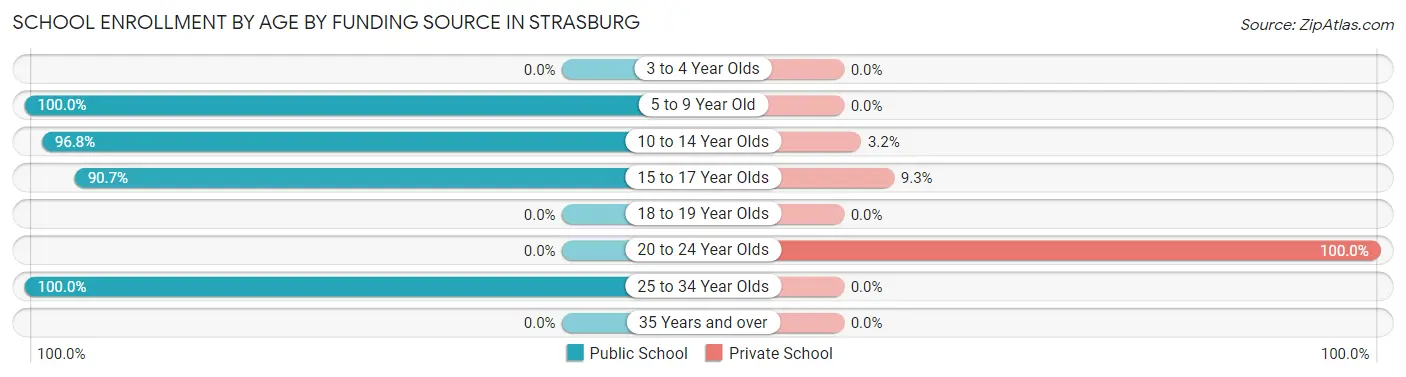
| Age Bracket | Public School | Private School |
| 3 to 4 Year Olds | 0 (0.0%) | 0 (0.0%) |
| 5 to 9 Year Old | 214 (100.0%) | 0 (0.0%) |
| 10 to 14 Year Olds | 331 (96.8%) | 11 (3.2%) |
| 15 to 17 Year Olds | 165 (90.7%) | 17 (9.3%) |
| 18 to 19 Year Olds | 0 (0.0%) | 0 (0.0%) |
| 20 to 24 Year Olds | 0 (0.0%) | 17 (100.0%) |
| 25 to 34 Year Olds | 10 (100.0%) | 0 (0.0%) |
| 35 Years and over | 0 (0.0%) | 0 (0.0%) |
| Total | 720 (94.1%) | 45 (5.9%) |
Educational Attainment by Field of Study in Strasburg
Education (144 | 41.5%), business (56 | 16.1%), arts & humanities (43 | 12.4%), social sciences (29 | 8.4%), and bio, nature & agricultural (25 | 7.2%) are the most common fields of study among 347 individuals in Strasburg who have obtained a bachelor's degree or higher.
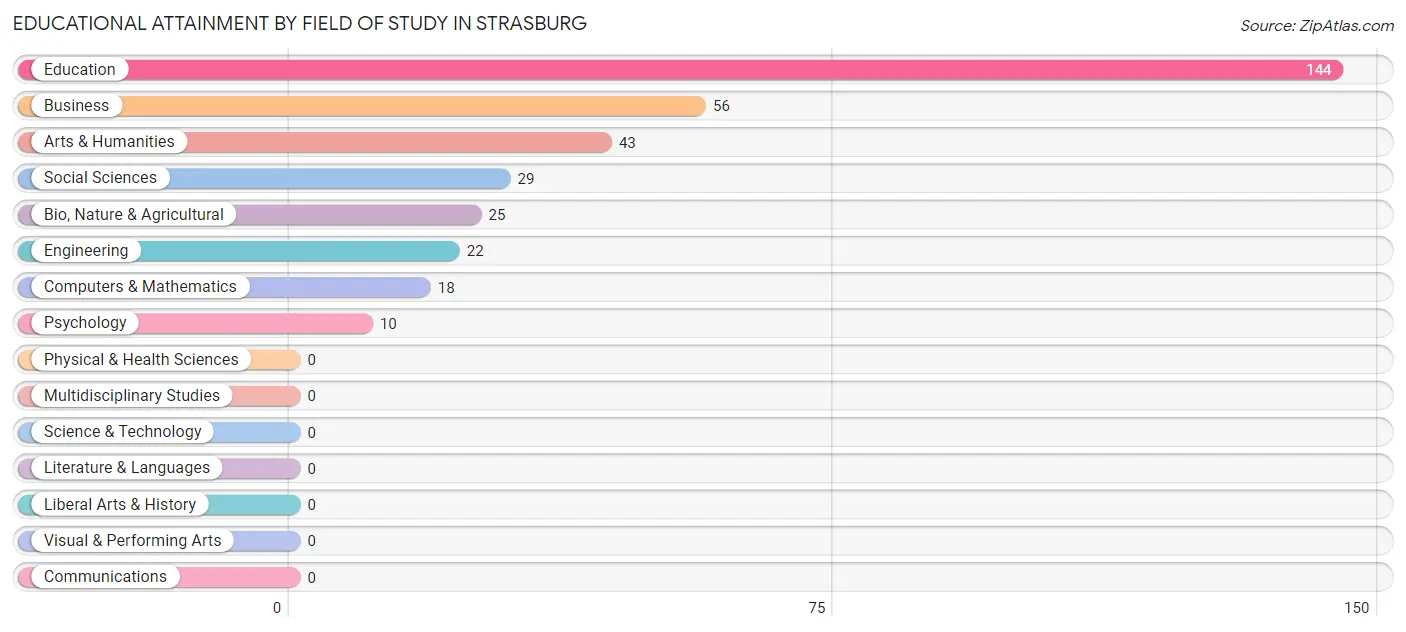
| Field of Study | # Graduates | % Graduates |
| Computers & Mathematics | 18 | 5.2% |
| Bio, Nature & Agricultural | 25 | 7.2% |
| Physical & Health Sciences | 0 | 0.0% |
| Psychology | 10 | 2.9% |
| Social Sciences | 29 | 8.4% |
| Engineering | 22 | 6.3% |
| Multidisciplinary Studies | 0 | 0.0% |
| Science & Technology | 0 | 0.0% |
| Business | 56 | 16.1% |
| Education | 144 | 41.5% |
| Literature & Languages | 0 | 0.0% |
| Liberal Arts & History | 0 | 0.0% |
| Visual & Performing Arts | 0 | 0.0% |
| Communications | 0 | 0.0% |
| Arts & Humanities | 43 | 12.4% |
| Total | 347 | 100.0% |
Transportation & Commute in Strasburg
Vehicle Availability by Sex in Strasburg
The most prevalent vehicle ownership categories in Strasburg are males with 4 vehicles (341, accounting for 42.3%) and females with 4 vehicles (120, making up 54.0%).
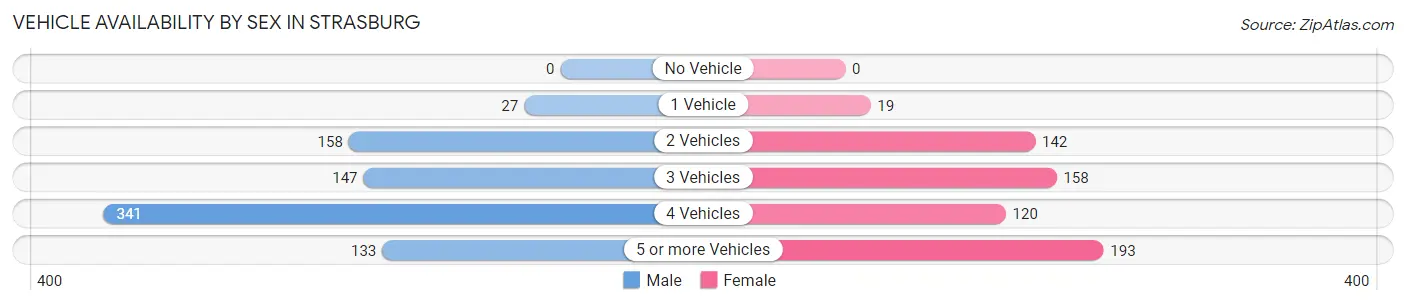
| Vehicles Available | Male | Female |
| No Vehicle | 0 (0.0%) | 0 (0.0%) |
| 1 Vehicle | 27 (3.4%) | 19 (3.0%) |
| 2 Vehicles | 158 (19.6%) | 142 (22.5%) |
| 3 Vehicles | 147 (18.2%) | 158 (25.0%) |
| 4 Vehicles | 341 (42.3%) | 120 (19.0%) |
| 5 or more Vehicles | 133 (16.5%) | 193 (30.5%) |
| Total | 806 (100.0%) | 632 (100.0%) |
Commute Time in Strasburg
The most frequently occuring commute durations in Strasburg are 45 to 59 minutes (250 commuters, 19.1%), 35 to 39 minutes (243 commuters, 18.5%), and 30 to 34 minutes (230 commuters, 17.5%).
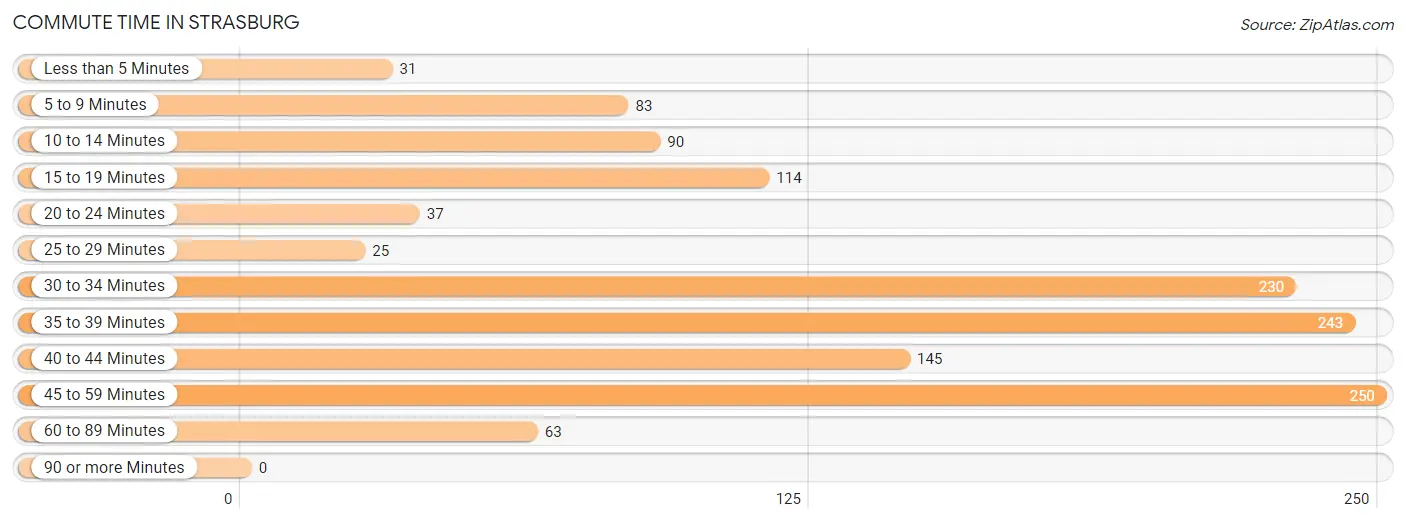
| Commute Time | # Commuters | % Commuters |
| Less than 5 Minutes | 31 | 2.4% |
| 5 to 9 Minutes | 83 | 6.3% |
| 10 to 14 Minutes | 90 | 6.9% |
| 15 to 19 Minutes | 114 | 8.7% |
| 20 to 24 Minutes | 37 | 2.8% |
| 25 to 29 Minutes | 25 | 1.9% |
| 30 to 34 Minutes | 230 | 17.5% |
| 35 to 39 Minutes | 243 | 18.5% |
| 40 to 44 Minutes | 145 | 11.1% |
| 45 to 59 Minutes | 250 | 19.1% |
| 60 to 89 Minutes | 63 | 4.8% |
| 90 or more Minutes | 0 | 0.0% |
Commute Time by Sex in Strasburg
The most common commute times in Strasburg are 45 to 59 minutes (190 commuters, 24.8%) for males and 35 to 39 minutes (208 commuters, 38.1%) for females.
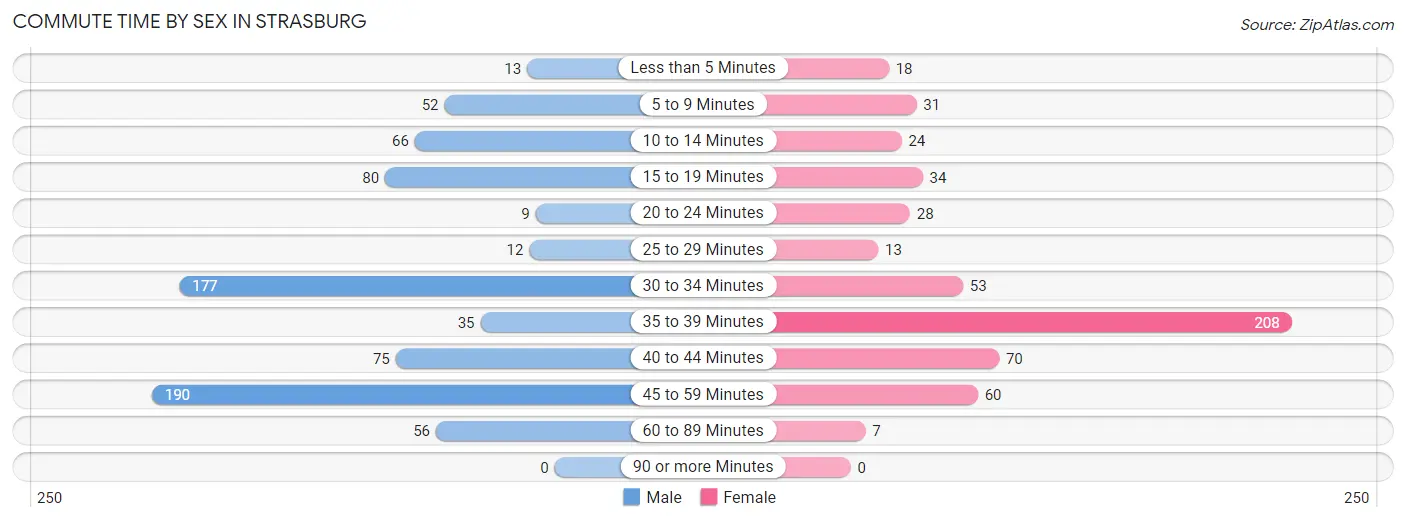
| Commute Time | Male | Female |
| Less than 5 Minutes | 13 (1.7%) | 18 (3.3%) |
| 5 to 9 Minutes | 52 (6.8%) | 31 (5.7%) |
| 10 to 14 Minutes | 66 (8.6%) | 24 (4.4%) |
| 15 to 19 Minutes | 80 (10.5%) | 34 (6.2%) |
| 20 to 24 Minutes | 9 (1.2%) | 28 (5.1%) |
| 25 to 29 Minutes | 12 (1.6%) | 13 (2.4%) |
| 30 to 34 Minutes | 177 (23.1%) | 53 (9.7%) |
| 35 to 39 Minutes | 35 (4.6%) | 208 (38.1%) |
| 40 to 44 Minutes | 75 (9.8%) | 70 (12.8%) |
| 45 to 59 Minutes | 190 (24.8%) | 60 (11.0%) |
| 60 to 89 Minutes | 56 (7.3%) | 7 (1.3%) |
| 90 or more Minutes | 0 (0.0%) | 0 (0.0%) |
Time of Departure to Work by Sex in Strasburg
The most frequent times of departure to work in Strasburg are 7:30 AM to 7:59 AM (149, 19.5%) for males and 5:30 AM to 5:59 AM (178, 32.6%) for females.
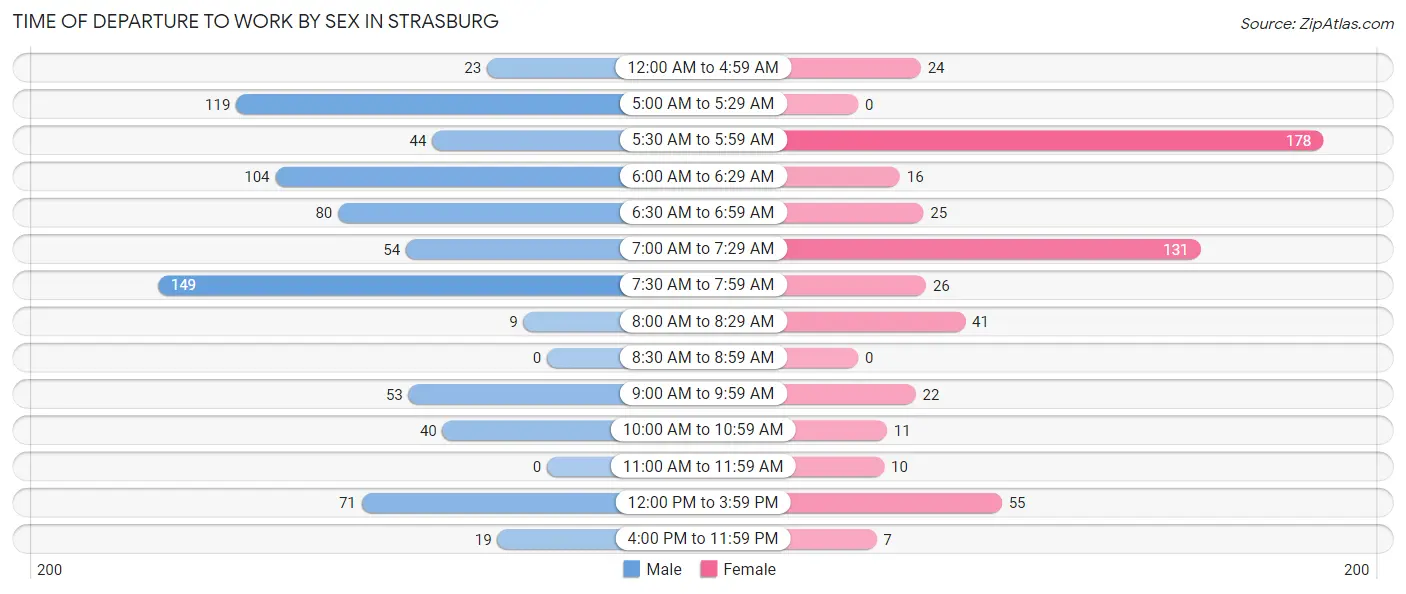
| Time of Departure | Male | Female |
| 12:00 AM to 4:59 AM | 23 (3.0%) | 24 (4.4%) |
| 5:00 AM to 5:29 AM | 119 (15.6%) | 0 (0.0%) |
| 5:30 AM to 5:59 AM | 44 (5.8%) | 178 (32.6%) |
| 6:00 AM to 6:29 AM | 104 (13.6%) | 16 (2.9%) |
| 6:30 AM to 6:59 AM | 80 (10.5%) | 25 (4.6%) |
| 7:00 AM to 7:29 AM | 54 (7.1%) | 131 (24.0%) |
| 7:30 AM to 7:59 AM | 149 (19.5%) | 26 (4.8%) |
| 8:00 AM to 8:29 AM | 9 (1.2%) | 41 (7.5%) |
| 8:30 AM to 8:59 AM | 0 (0.0%) | 0 (0.0%) |
| 9:00 AM to 9:59 AM | 53 (6.9%) | 22 (4.0%) |
| 10:00 AM to 10:59 AM | 40 (5.2%) | 11 (2.0%) |
| 11:00 AM to 11:59 AM | 0 (0.0%) | 10 (1.8%) |
| 12:00 PM to 3:59 PM | 71 (9.3%) | 55 (10.1%) |
| 4:00 PM to 11:59 PM | 19 (2.5%) | 7 (1.3%) |
| Total | 765 (100.0%) | 546 (100.0%) |
Housing Occupancy in Strasburg
Occupancy by Ownership in Strasburg
Of the total 1,060 dwellings in Strasburg, owner-occupied units account for 947 (89.3%), while renter-occupied units make up 113 (10.7%).
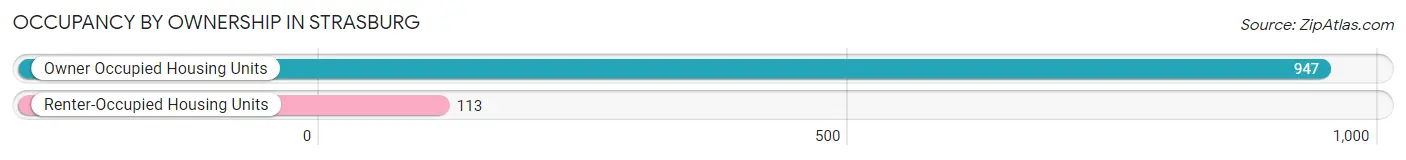
| Occupancy | # Housing Units | % Housing Units |
| Owner Occupied Housing Units | 947 | 89.3% |
| Renter-Occupied Housing Units | 113 | 10.7% |
| Total Occupied Housing Units | 1,060 | 100.0% |
Occupancy by Household Size in Strasburg
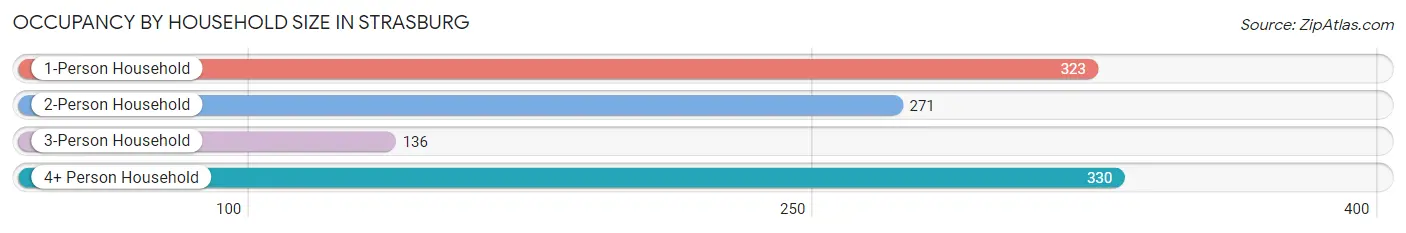
| Household Size | # Housing Units | % Housing Units |
| 1-Person Household | 323 | 30.5% |
| 2-Person Household | 271 | 25.6% |
| 3-Person Household | 136 | 12.8% |
| 4+ Person Household | 330 | 31.1% |
| Total Housing Units | 1,060 | 100.0% |
Occupancy by Ownership by Household Size in Strasburg
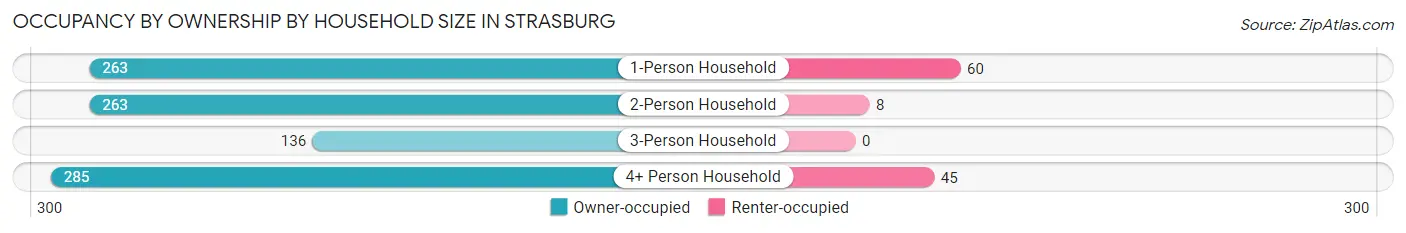
| Household Size | Owner-occupied | Renter-occupied |
| 1-Person Household | 263 (81.4%) | 60 (18.6%) |
| 2-Person Household | 263 (97.1%) | 8 (2.9%) |
| 3-Person Household | 136 (100.0%) | 0 (0.0%) |
| 4+ Person Household | 285 (86.4%) | 45 (13.6%) |
| Total Housing Units | 947 (89.3%) | 113 (10.7%) |
Occupancy by Educational Attainment in Strasburg
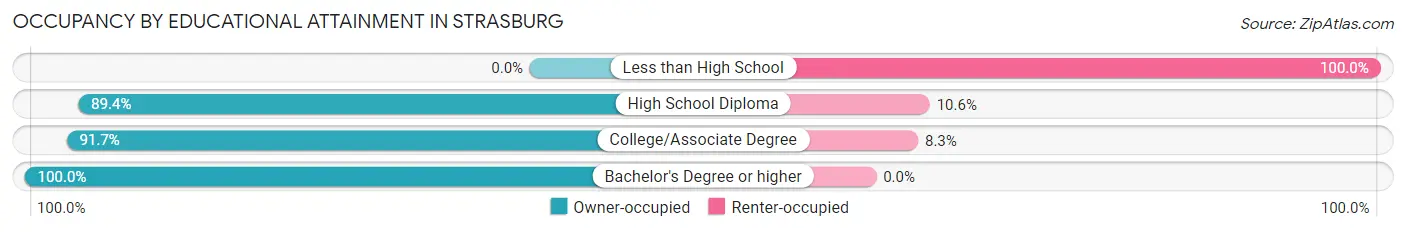
| Household Size | Owner-occupied | Renter-occupied |
| Less than High School | 0 (0.0%) | 39 (100.0%) |
| High School Diploma | 429 (89.4%) | 51 (10.6%) |
| College/Associate Degree | 254 (91.7%) | 23 (8.3%) |
| Bachelor's Degree or higher | 264 (100.0%) | 0 (0.0%) |
Occupancy by Age of Householder in Strasburg
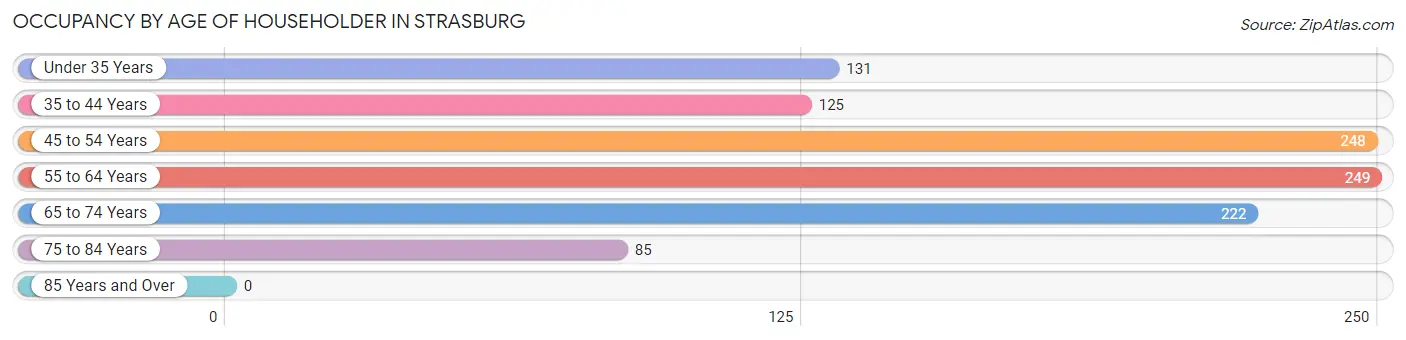
| Age Bracket | # Households | % Households |
| Under 35 Years | 131 | 12.4% |
| 35 to 44 Years | 125 | 11.8% |
| 45 to 54 Years | 248 | 23.4% |
| 55 to 64 Years | 249 | 23.5% |
| 65 to 74 Years | 222 | 20.9% |
| 75 to 84 Years | 85 | 8.0% |
| 85 Years and Over | 0 | 0.0% |
| Total | 1,060 | 100.0% |
Housing Finances in Strasburg
Median Income by Occupancy in Strasburg
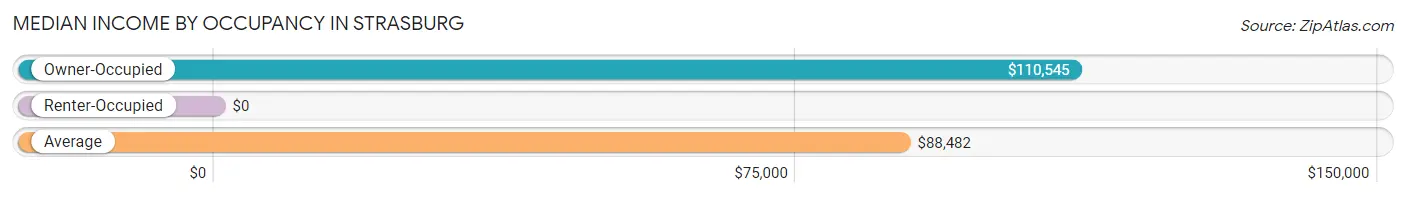
| Occupancy Type | # Households | Median Income |
| Owner-Occupied | 947 (89.3%) | $110,545 |
| Renter-Occupied | 113 (10.7%) | $0 |
| Average | 1,060 (100.0%) | $88,482 |
Occupancy by Householder Income Bracket in Strasburg
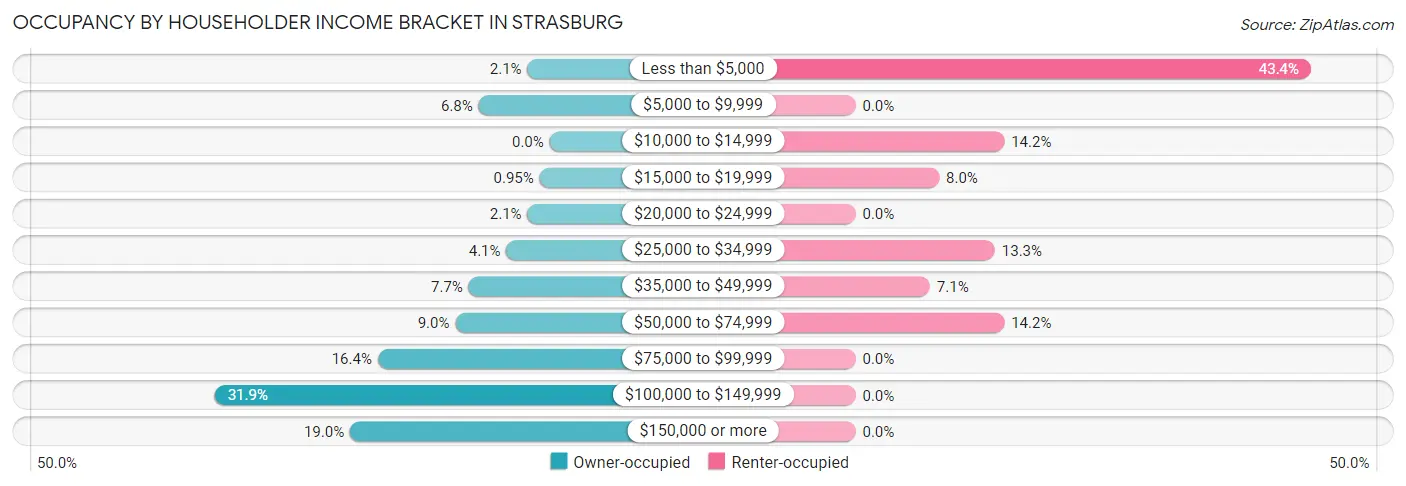
| Income Bracket | Owner-occupied | Renter-occupied |
| Less than $5,000 | 20 (2.1%) | 49 (43.4%) |
| $5,000 to $9,999 | 64 (6.8%) | 0 (0.0%) |
| $10,000 to $14,999 | 0 (0.0%) | 16 (14.2%) |
| $15,000 to $19,999 | 9 (0.9%) | 9 (8.0%) |
| $20,000 to $24,999 | 20 (2.1%) | 0 (0.0%) |
| $25,000 to $34,999 | 39 (4.1%) | 15 (13.3%) |
| $35,000 to $49,999 | 73 (7.7%) | 8 (7.1%) |
| $50,000 to $74,999 | 85 (9.0%) | 16 (14.2%) |
| $75,000 to $99,999 | 155 (16.4%) | 0 (0.0%) |
| $100,000 to $149,999 | 302 (31.9%) | 0 (0.0%) |
| $150,000 or more | 180 (19.0%) | 0 (0.0%) |
| Total | 947 (100.0%) | 113 (100.0%) |
Monthly Housing Cost Tiers in Strasburg
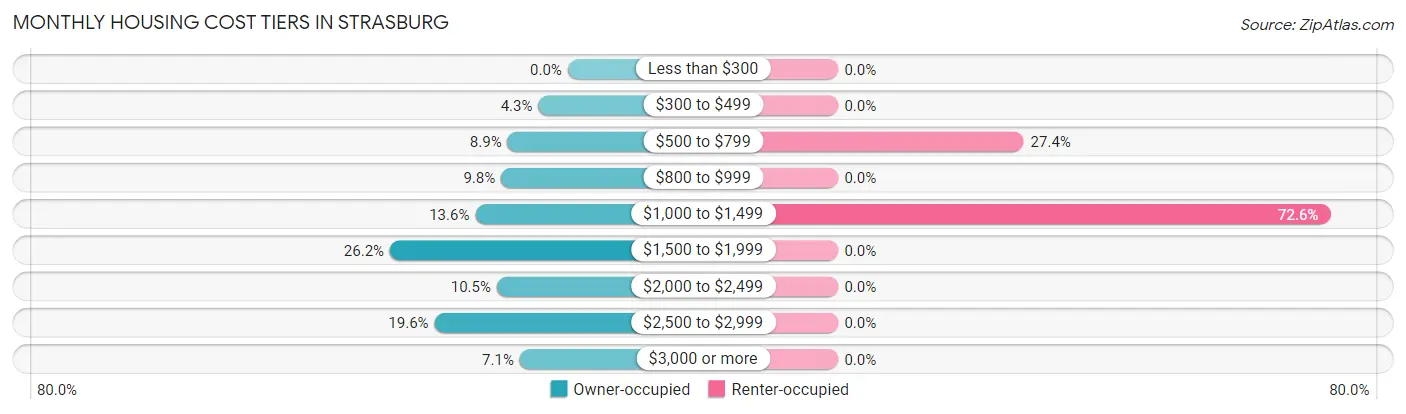
| Monthly Cost | Owner-occupied | Renter-occupied |
| Less than $300 | 0 (0.0%) | 0 (0.0%) |
| $300 to $499 | 41 (4.3%) | 0 (0.0%) |
| $500 to $799 | 84 (8.9%) | 31 (27.4%) |
| $800 to $999 | 93 (9.8%) | 0 (0.0%) |
| $1,000 to $1,499 | 129 (13.6%) | 82 (72.6%) |
| $1,500 to $1,999 | 248 (26.2%) | 0 (0.0%) |
| $2,000 to $2,499 | 99 (10.4%) | 0 (0.0%) |
| $2,500 to $2,999 | 186 (19.6%) | 0 (0.0%) |
| $3,000 or more | 67 (7.1%) | 0 (0.0%) |
| Total | 947 (100.0%) | 113 (100.0%) |
Physical Housing Characteristics in Strasburg
Housing Structures in Strasburg
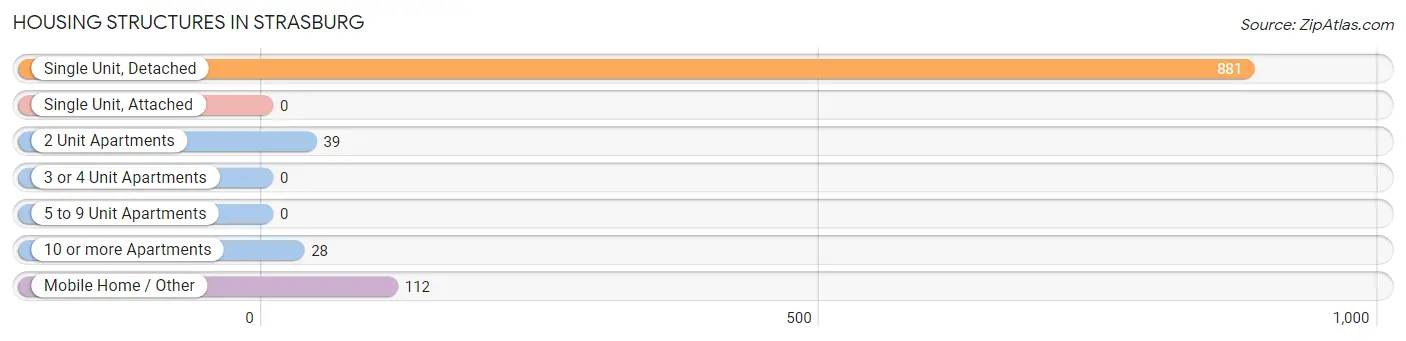
| Structure Type | # Housing Units | % Housing Units |
| Single Unit, Detached | 881 | 83.1% |
| Single Unit, Attached | 0 | 0.0% |
| 2 Unit Apartments | 39 | 3.7% |
| 3 or 4 Unit Apartments | 0 | 0.0% |
| 5 to 9 Unit Apartments | 0 | 0.0% |
| 10 or more Apartments | 28 | 2.6% |
| Mobile Home / Other | 112 | 10.6% |
| Total | 1,060 | 100.0% |
Housing Structures by Occupancy in Strasburg
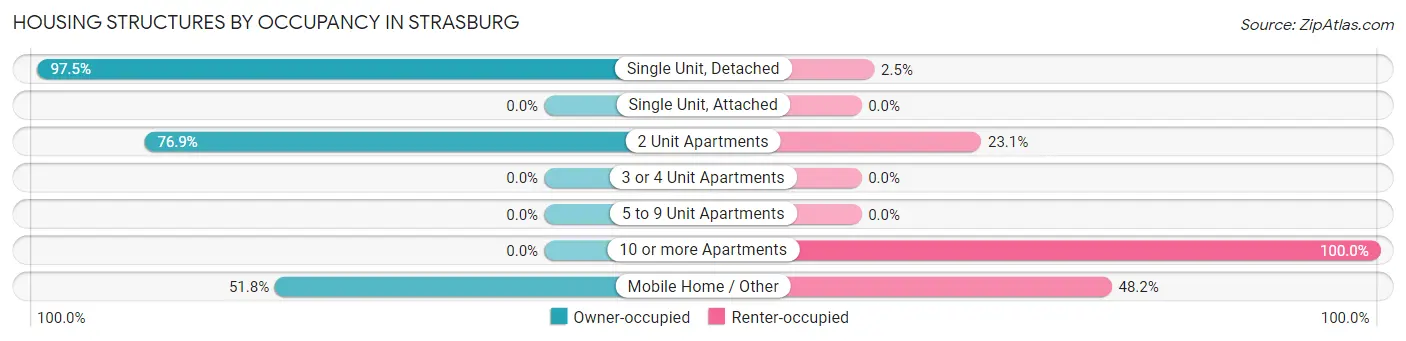
| Structure Type | Owner-occupied | Renter-occupied |
| Single Unit, Detached | 859 (97.5%) | 22 (2.5%) |
| Single Unit, Attached | 0 (0.0%) | 0 (0.0%) |
| 2 Unit Apartments | 30 (76.9%) | 9 (23.1%) |
| 3 or 4 Unit Apartments | 0 (0.0%) | 0 (0.0%) |
| 5 to 9 Unit Apartments | 0 (0.0%) | 0 (0.0%) |
| 10 or more Apartments | 0 (0.0%) | 28 (100.0%) |
| Mobile Home / Other | 58 (51.8%) | 54 (48.2%) |
| Total | 947 (89.3%) | 113 (10.7%) |
Housing Structures by Number of Rooms in Strasburg
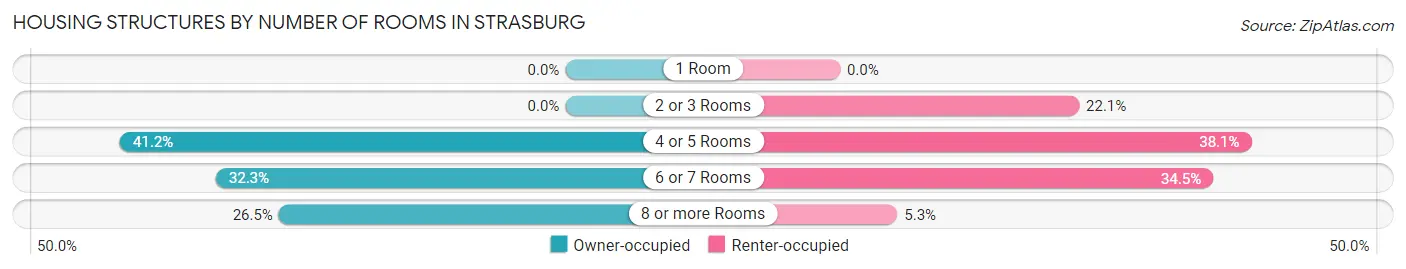
| Number of Rooms | Owner-occupied | Renter-occupied |
| 1 Room | 0 (0.0%) | 0 (0.0%) |
| 2 or 3 Rooms | 0 (0.0%) | 25 (22.1%) |
| 4 or 5 Rooms | 390 (41.2%) | 43 (38.1%) |
| 6 or 7 Rooms | 306 (32.3%) | 39 (34.5%) |
| 8 or more Rooms | 251 (26.5%) | 6 (5.3%) |
| Total | 947 (100.0%) | 113 (100.0%) |
Housing Structure by Heating Type in Strasburg
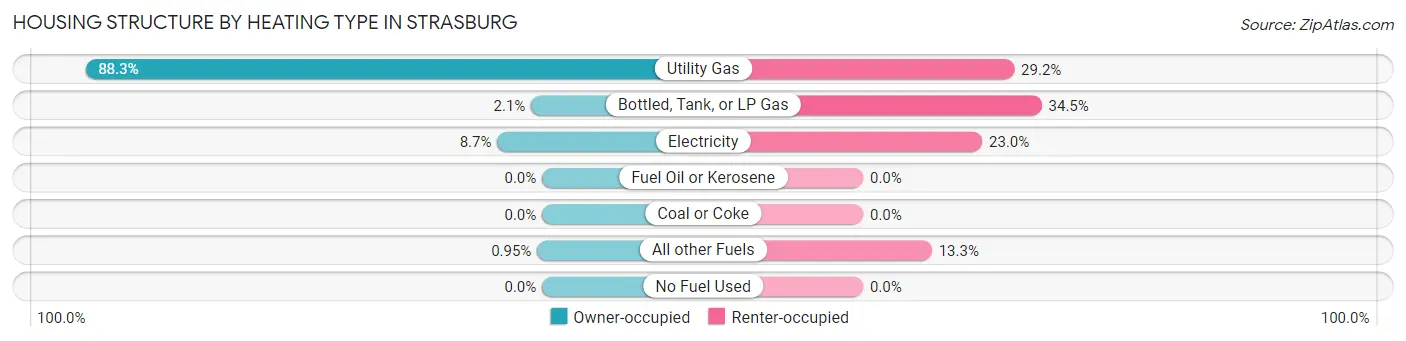
| Heating Type | Owner-occupied | Renter-occupied |
| Utility Gas | 836 (88.3%) | 33 (29.2%) |
| Bottled, Tank, or LP Gas | 20 (2.1%) | 39 (34.5%) |
| Electricity | 82 (8.7%) | 26 (23.0%) |
| Fuel Oil or Kerosene | 0 (0.0%) | 0 (0.0%) |
| Coal or Coke | 0 (0.0%) | 0 (0.0%) |
| All other Fuels | 9 (0.9%) | 15 (13.3%) |
| No Fuel Used | 0 (0.0%) | 0 (0.0%) |
| Total | 947 (100.0%) | 113 (100.0%) |
Household Vehicle Usage in Strasburg
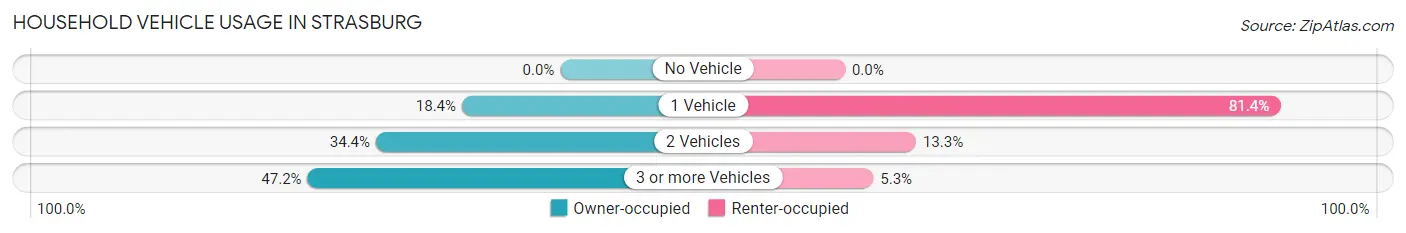
| Vehicles per Household | Owner-occupied | Renter-occupied |
| No Vehicle | 0 (0.0%) | 0 (0.0%) |
| 1 Vehicle | 174 (18.4%) | 92 (81.4%) |
| 2 Vehicles | 326 (34.4%) | 15 (13.3%) |
| 3 or more Vehicles | 447 (47.2%) | 6 (5.3%) |
| Total | 947 (100.0%) | 113 (100.0%) |
Real Estate & Mortgages in Strasburg
Real Estate and Mortgage Overview in Strasburg
| Characteristic | Without Mortgage | With Mortgage |
| Housing Units | 154 | 793 |
| Median Property Value | $427,300 | $422,800 |
| Median Household Income | - | - |
| Monthly Housing Costs | $590 | $67 |
| Real Estate Taxes | $2,292 | $31 |
Property Value by Mortgage Status in Strasburg
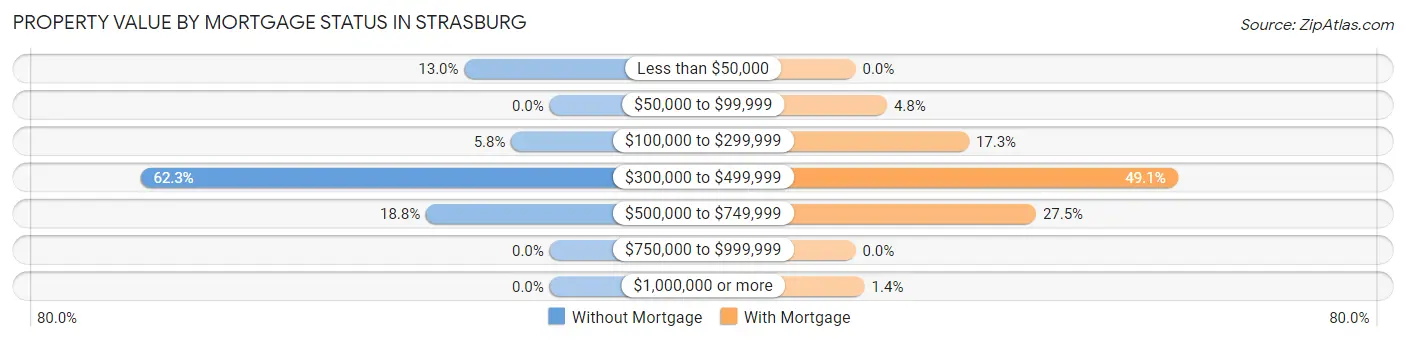
| Property Value | Without Mortgage | With Mortgage |
| Less than $50,000 | 20 (13.0%) | 0 (0.0%) |
| $50,000 to $99,999 | 0 (0.0%) | 38 (4.8%) |
| $100,000 to $299,999 | 9 (5.8%) | 137 (17.3%) |
| $300,000 to $499,999 | 96 (62.3%) | 389 (49.0%) |
| $500,000 to $749,999 | 29 (18.8%) | 218 (27.5%) |
| $750,000 to $999,999 | 0 (0.0%) | 0 (0.0%) |
| $1,000,000 or more | 0 (0.0%) | 11 (1.4%) |
| Total | 154 (100.0%) | 793 (100.0%) |
Household Income by Mortgage Status in Strasburg
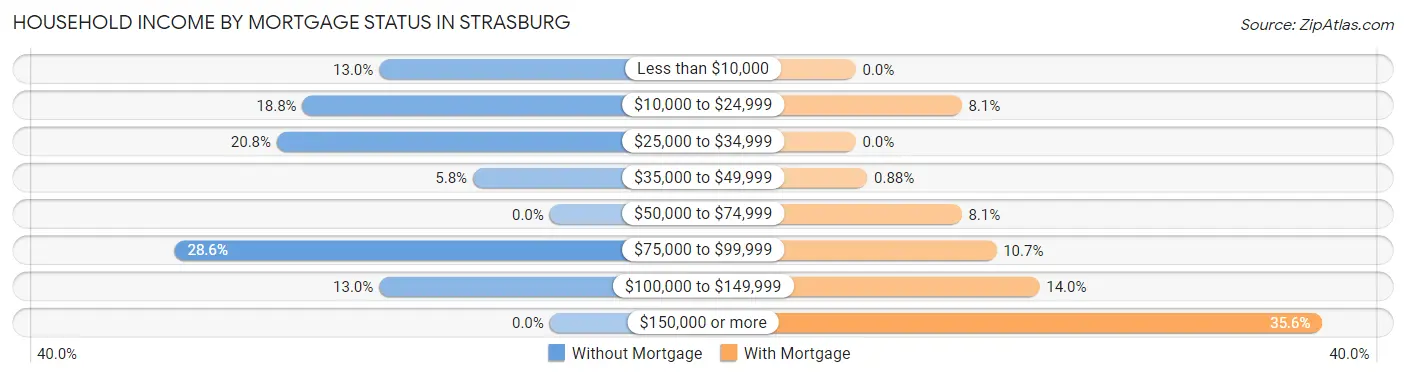
| Household Income | Without Mortgage | With Mortgage |
| Less than $10,000 | 20 (13.0%) | 0 (0.0%) |
| $10,000 to $24,999 | 29 (18.8%) | 64 (8.1%) |
| $25,000 to $34,999 | 32 (20.8%) | 0 (0.0%) |
| $35,000 to $49,999 | 9 (5.8%) | 7 (0.9%) |
| $50,000 to $74,999 | 0 (0.0%) | 64 (8.1%) |
| $75,000 to $99,999 | 44 (28.6%) | 85 (10.7%) |
| $100,000 to $149,999 | 20 (13.0%) | 111 (14.0%) |
| $150,000 or more | 0 (0.0%) | 282 (35.6%) |
| Total | 154 (100.0%) | 793 (100.0%) |
Property Value to Household Income Ratio in Strasburg
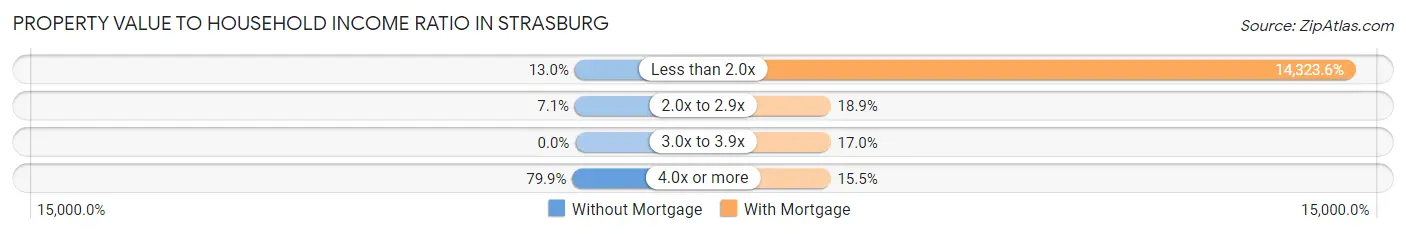
| Value-to-Income Ratio | Without Mortgage | With Mortgage |
| Less than 2.0x | 20 (13.0%) | 113,586 (14,323.6%) |
| 2.0x to 2.9x | 11 (7.1%) | 150 (18.9%) |
| 3.0x to 3.9x | 0 (0.0%) | 135 (17.0%) |
| 4.0x or more | 123 (79.9%) | 123 (15.5%) |
| Total | 154 (100.0%) | 793 (100.0%) |
Real Estate Taxes by Mortgage Status in Strasburg
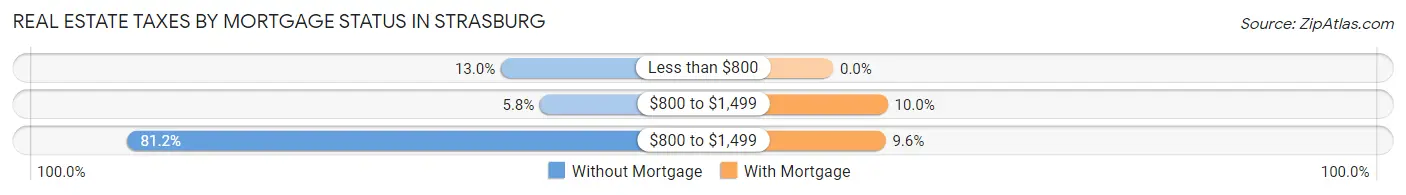
| Property Taxes | Without Mortgage | With Mortgage |
| Less than $800 | 20 (13.0%) | 0 (0.0%) |
| $800 to $1,499 | 9 (5.8%) | 79 (10.0%) |
| $800 to $1,499 | 125 (81.2%) | 76 (9.6%) |
| Total | 154 (100.0%) | 793 (100.0%) |
Health & Disability in Strasburg
Health Insurance Coverage by Age in Strasburg
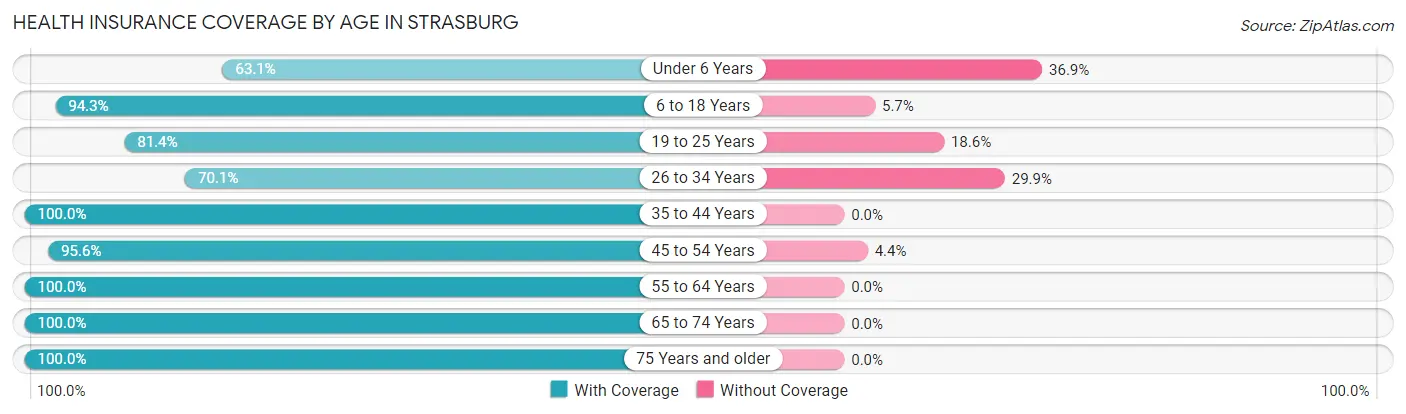
| Age Bracket | With Coverage | Without Coverage |
| Under 6 Years | 130 (63.1%) | 76 (36.9%) |
| 6 to 18 Years | 724 (94.3%) | 44 (5.7%) |
| 19 to 25 Years | 311 (81.4%) | 71 (18.6%) |
| 26 to 34 Years | 192 (70.1%) | 82 (29.9%) |
| 35 to 44 Years | 348 (100.0%) | 0 (0.0%) |
| 45 to 54 Years | 350 (95.6%) | 16 (4.4%) |
| 55 to 64 Years | 382 (100.0%) | 0 (0.0%) |
| 65 to 74 Years | 302 (100.0%) | 0 (0.0%) |
| 75 Years and older | 93 (100.0%) | 0 (0.0%) |
| Total | 2,832 (90.7%) | 289 (9.3%) |
Health Insurance Coverage by Citizenship Status in Strasburg
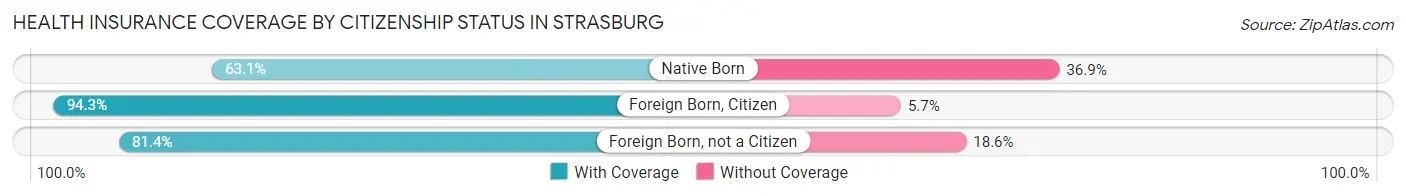
| Citizenship Status | With Coverage | Without Coverage |
| Native Born | 130 (63.1%) | 76 (36.9%) |
| Foreign Born, Citizen | 724 (94.3%) | 44 (5.7%) |
| Foreign Born, not a Citizen | 311 (81.4%) | 71 (18.6%) |
Health Insurance Coverage by Household Income in Strasburg
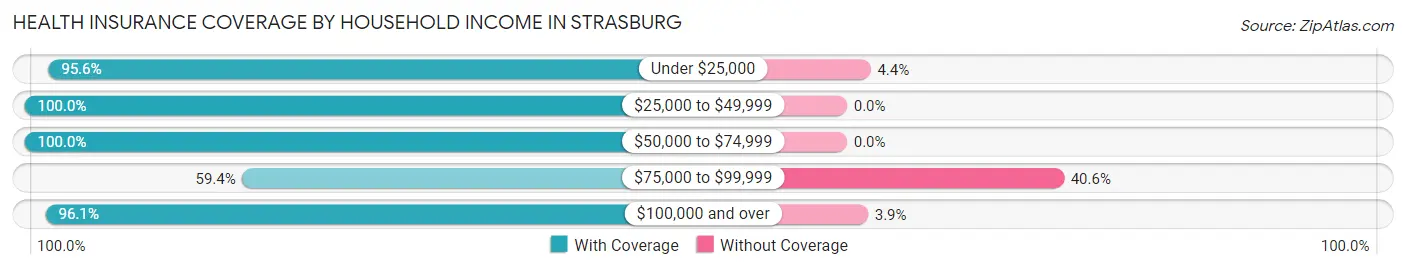
| Household Income | With Coverage | Without Coverage |
| Under $25,000 | 344 (95.6%) | 16 (4.4%) |
| $25,000 to $49,999 | 264 (100.0%) | 0 (0.0%) |
| $50,000 to $74,999 | 195 (100.0%) | 0 (0.0%) |
| $75,000 to $99,999 | 295 (59.4%) | 202 (40.6%) |
| $100,000 and over | 1,734 (96.1%) | 71 (3.9%) |
Public vs Private Health Insurance Coverage by Age in Strasburg
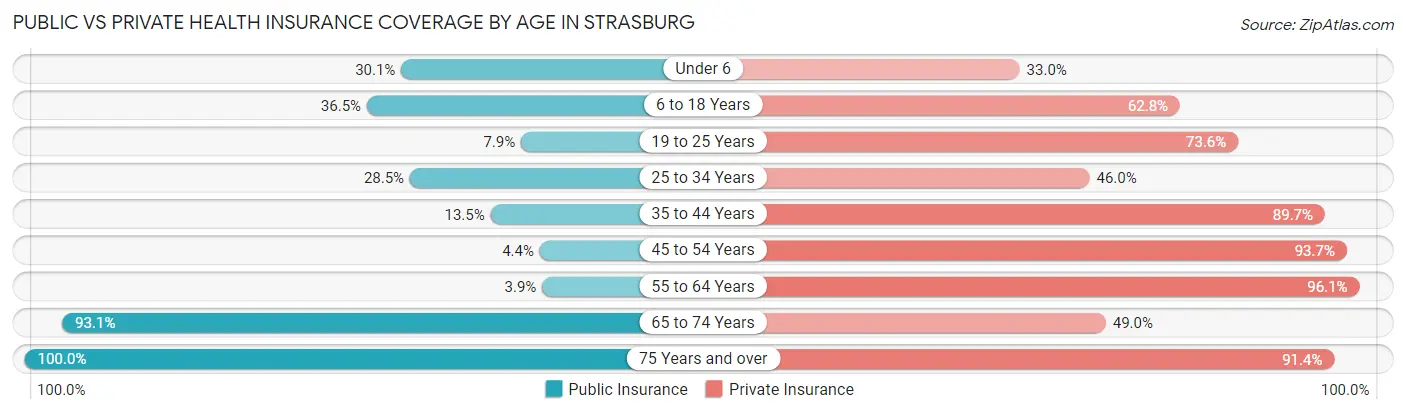
| Age Bracket | Public Insurance | Private Insurance |
| Under 6 | 62 (30.1%) | 68 (33.0%) |
| 6 to 18 Years | 280 (36.5%) | 482 (62.8%) |
| 19 to 25 Years | 30 (7.9%) | 281 (73.6%) |
| 25 to 34 Years | 78 (28.5%) | 126 (46.0%) |
| 35 to 44 Years | 47 (13.5%) | 312 (89.7%) |
| 45 to 54 Years | 16 (4.4%) | 343 (93.7%) |
| 55 to 64 Years | 15 (3.9%) | 367 (96.1%) |
| 65 to 74 Years | 281 (93.0%) | 148 (49.0%) |
| 75 Years and over | 93 (100.0%) | 85 (91.4%) |
| Total | 902 (28.9%) | 2,212 (70.9%) |
Disability Status by Sex by Age in Strasburg
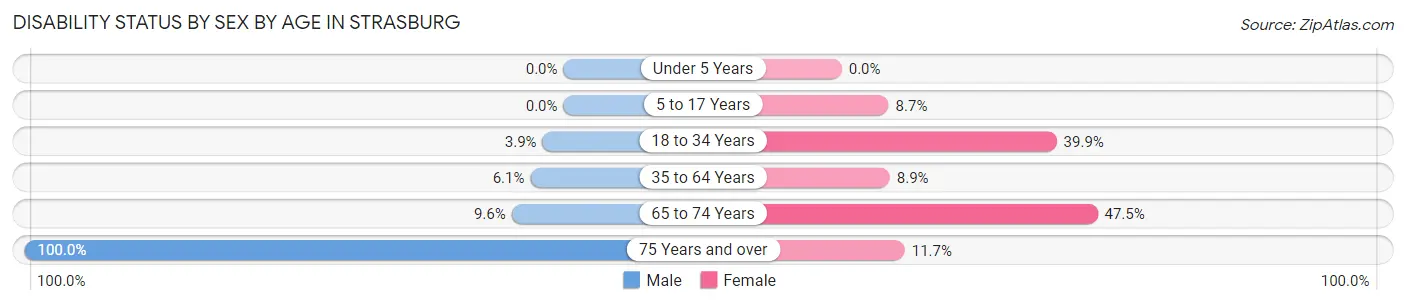
| Age Bracket | Male | Female |
| Under 5 Years | 0 (0.0%) | 0 (0.0%) |
| 5 to 17 Years | 0 (0.0%) | 28 (8.7%) |
| 18 to 34 Years | 13 (3.9%) | 128 (39.9%) |
| 35 to 64 Years | 37 (6.1%) | 44 (8.9%) |
| 65 to 74 Years | 10 (9.6%) | 94 (47.5%) |
| 75 Years and over | 16 (100.0%) | 9 (11.7%) |
Disability Class by Sex by Age in Strasburg
Disability Class: Hearing Difficulty
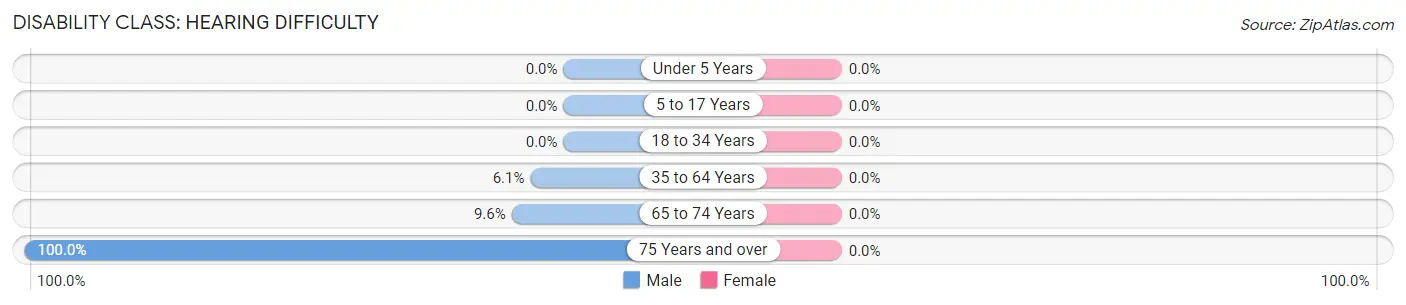
| Age Bracket | Male | Female |
| Under 5 Years | 0 (0.0%) | 0 (0.0%) |
| 5 to 17 Years | 0 (0.0%) | 0 (0.0%) |
| 18 to 34 Years | 0 (0.0%) | 0 (0.0%) |
| 35 to 64 Years | 37 (6.1%) | 0 (0.0%) |
| 65 to 74 Years | 10 (9.6%) | 0 (0.0%) |
| 75 Years and over | 16 (100.0%) | 0 (0.0%) |
Disability Class: Vision Difficulty
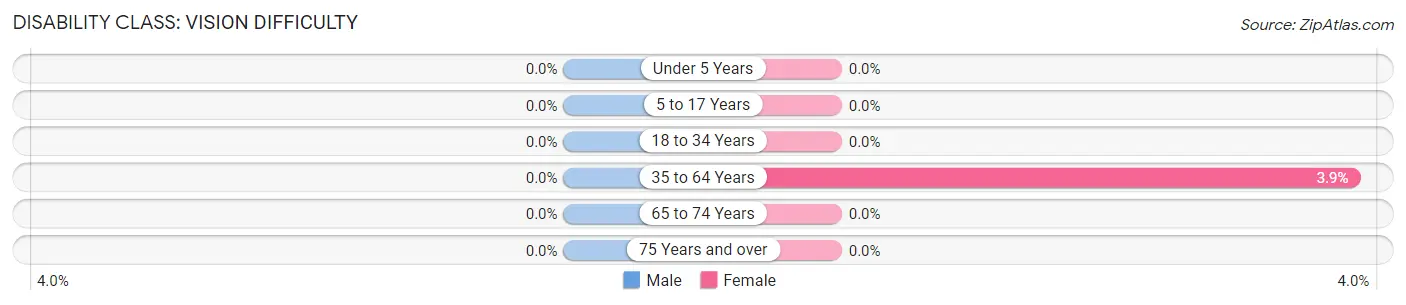
| Age Bracket | Male | Female |
| Under 5 Years | 0 (0.0%) | 0 (0.0%) |
| 5 to 17 Years | 0 (0.0%) | 0 (0.0%) |
| 18 to 34 Years | 0 (0.0%) | 0 (0.0%) |
| 35 to 64 Years | 0 (0.0%) | 19 (3.8%) |
| 65 to 74 Years | 0 (0.0%) | 0 (0.0%) |
| 75 Years and over | 0 (0.0%) | 0 (0.0%) |
Disability Class: Cognitive Difficulty
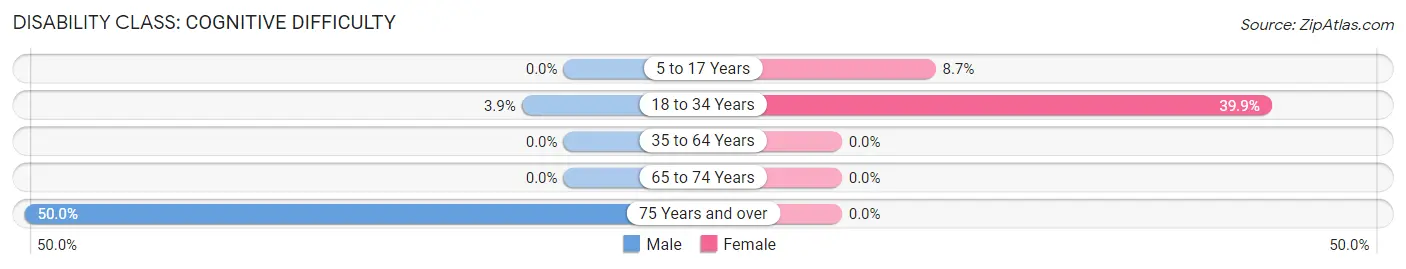
| Age Bracket | Male | Female |
| 5 to 17 Years | 0 (0.0%) | 28 (8.7%) |
| 18 to 34 Years | 13 (3.9%) | 128 (39.9%) |
| 35 to 64 Years | 0 (0.0%) | 0 (0.0%) |
| 65 to 74 Years | 0 (0.0%) | 0 (0.0%) |
| 75 Years and over | 8 (50.0%) | 0 (0.0%) |
Disability Class: Ambulatory Difficulty
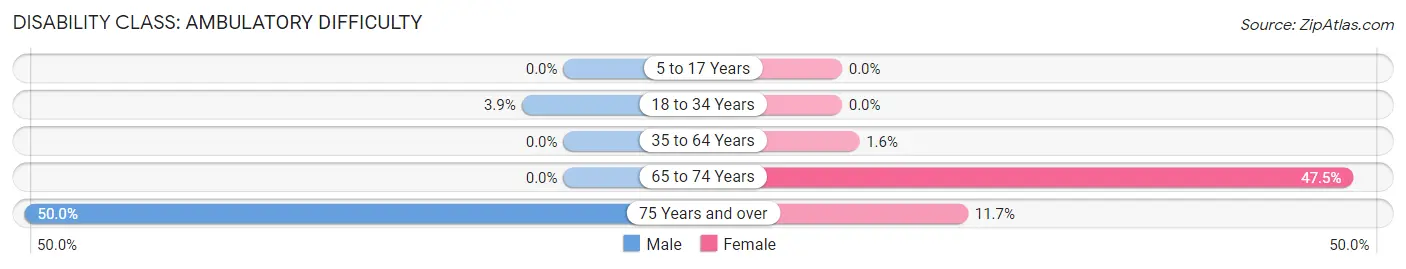
| Age Bracket | Male | Female |
| 5 to 17 Years | 0 (0.0%) | 0 (0.0%) |
| 18 to 34 Years | 13 (3.9%) | 0 (0.0%) |
| 35 to 64 Years | 0 (0.0%) | 8 (1.6%) |
| 65 to 74 Years | 0 (0.0%) | 94 (47.5%) |
| 75 Years and over | 8 (50.0%) | 9 (11.7%) |
Disability Class: Self-Care Difficulty
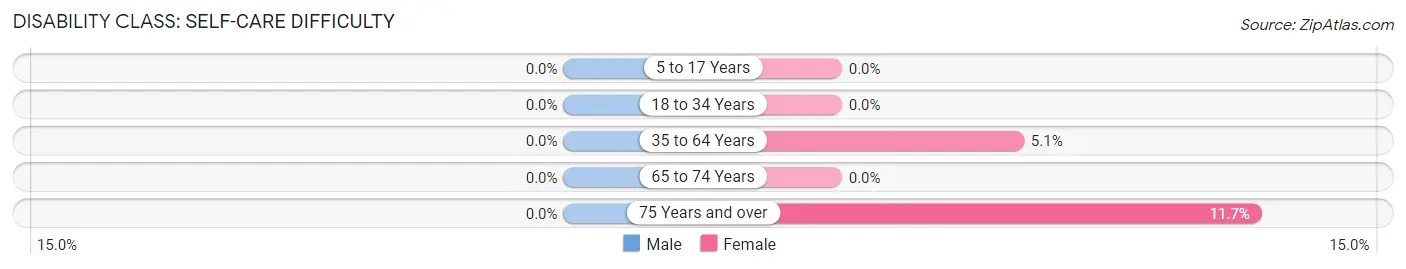
| Age Bracket | Male | Female |
| 5 to 17 Years | 0 (0.0%) | 0 (0.0%) |
| 18 to 34 Years | 0 (0.0%) | 0 (0.0%) |
| 35 to 64 Years | 0 (0.0%) | 25 (5.1%) |
| 65 to 74 Years | 0 (0.0%) | 0 (0.0%) |
| 75 Years and over | 0 (0.0%) | 9 (11.7%) |
Technology Access in Strasburg
Computing Device Access in Strasburg
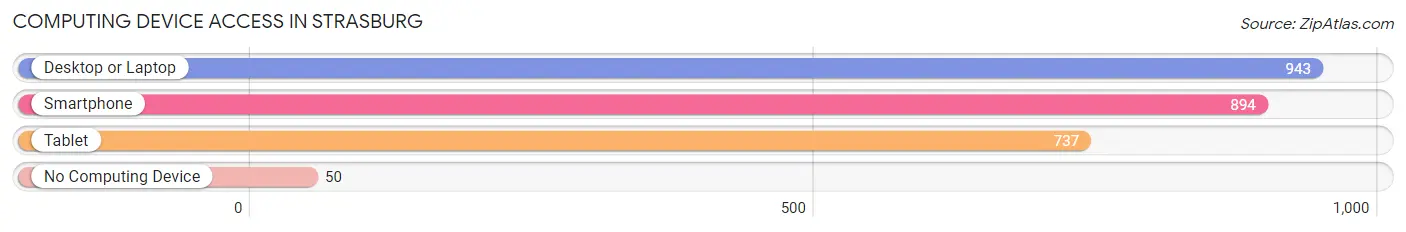
| Device Type | # Households | % Households |
| Desktop or Laptop | 943 | 89.0% |
| Smartphone | 894 | 84.3% |
| Tablet | 737 | 69.5% |
| No Computing Device | 50 | 4.7% |
| Total | 1,060 | 100.0% |
Internet Access in Strasburg
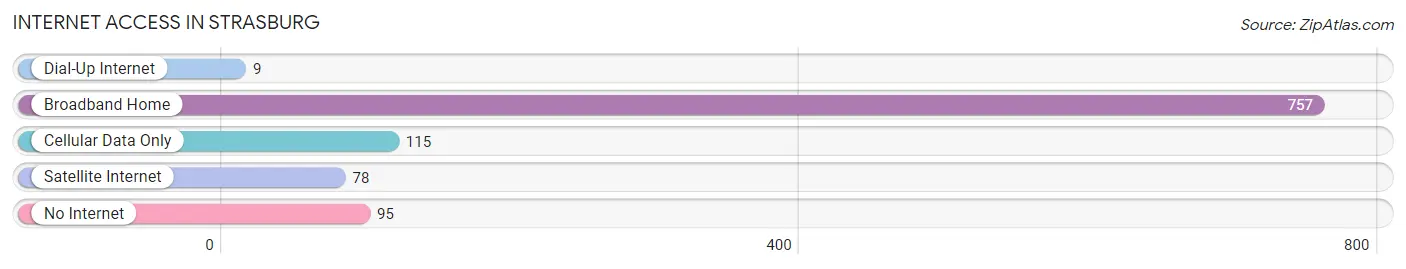
| Internet Type | # Households | % Households |
| Dial-Up Internet | 9 | 0.9% |
| Broadband Home | 757 | 71.4% |
| Cellular Data Only | 115 | 10.8% |
| Satellite Internet | 78 | 7.4% |
| No Internet | 95 | 9.0% |
| Total | 1,060 | 100.0% |
Strasburg Summary
Strasburg is a small town located in Adams County, Colorado, United States. It is situated about 25 miles northeast of Denver and is part of the Denver-Aurora-Lakewood Metropolitan Statistical Area. The town was founded in 1887 and was named after Strasbourg, France. As of the 2010 census, the population of Strasburg was 2,907.
History
Strasburg was founded in 1887 by German immigrants who had come to the area to farm. The town was named after Strasbourg, France, and was originally called Strasburg Station. The town was incorporated in 1890 and was the first town in Adams County to be incorporated.
The town grew rapidly in the early 1900s, and by 1910, it had a population of over 1,000. The town was home to a variety of businesses, including a bank, a hotel, a blacksmith shop, a livery stable, a general store, and a post office.
In the 1920s, the town experienced a period of growth and prosperity. The Great Western Sugar Company built a sugar beet processing plant in Strasburg, which provided jobs for many of the town’s residents. The town also had a thriving agricultural industry, with many farmers growing wheat, corn, and other crops.
Geography
Strasburg is located in Adams County, Colorado, at 39°45'N 104°45'W. The town is situated about 25 miles northeast of Denver and is part of the Denver-Aurora-Lakewood Metropolitan Statistical Area. The town is located in the South Platte River Valley, and the surrounding area is mostly flat, with some rolling hills.
The town has a total area of 1.2 square miles, all of which is land. The town is located at an elevation of 5,092 feet above sea level.
Economy
The economy of Strasburg is largely based on agriculture and tourism. The town is home to a variety of farms, which grow a variety of crops, including wheat, corn, and hay. The town is also home to a number of tourist attractions, including the Strasburg Railroad, the Strasburg Museum, and the Strasburg State Wildlife Area.
The town is also home to a number of businesses, including restaurants, retail stores, and auto repair shops. The town is also home to a number of manufacturing companies, including a plastics manufacturer and a metal fabrication company.
Demographics
As of the 2010 census, the population of Strasburg was 2,907. The racial makeup of the town was 91.3% White, 0.7% African American, 0.7% Native American, 0.3% Asian, 0.1% Pacific Islander, 4.3% from other races, and 2.6% from two or more races. Hispanic or Latino of any race were 10.2% of the population.
The median household income in Strasburg was $50,938, and the median family income was $58,906. The per capita income in Strasburg was $21,945. About 8.3% of the population was below the poverty line.
Common Questions
What is Per Capita Income in Strasburg?
Per Capita income in Strasburg is $41,050.
What is the Median Family Income in Strasburg?
Median Family Income in Strasburg is $110,417.
What is the Median Household income in Strasburg?
Median Household Income in Strasburg is $88,482.
What is Income or Wage Gap in Strasburg?
Income or Wage Gap in Strasburg is 52.1%.
Women in Strasburg earn 47.9 cents for every dollar earned by a man.
What is Inequality or Gini Index in Strasburg?
Inequality or Gini Index in Strasburg is 0.50.
What is the Total Population of Strasburg?
Total Population of Strasburg is 3,149.
What is the Total Male Population of Strasburg?
Total Male Population of Strasburg is 1,636.
What is the Total Female Population of Strasburg?
Total Female Population of Strasburg is 1,513.
What is the Ratio of Males per 100 Females in Strasburg?
There are 108.13 Males per 100 Females in Strasburg.
What is the Ratio of Females per 100 Males in Strasburg?
There are 92.48 Females per 100 Males in Strasburg.
What is the Median Population Age in Strasburg?
Median Population Age in Strasburg is 32.5 Years.
What is the Average Family Size in Strasburg
Average Family Size in Strasburg is 3.8 People.
What is the Average Household Size in Strasburg
Average Household Size in Strasburg is 3.0 People.
How Large is the Labor Force in Strasburg?
There are 1,557 People in the Labor Forcein in Strasburg.
What is the Percentage of People in the Labor Force in Strasburg?
67.4% of People are in the Labor Force in Strasburg.
What is the Unemployment Rate in Strasburg?
Unemployment Rate in Strasburg is 6.1%.