Stratton, CO Map & Demographics
Stratton Map
Stratton Overview
$29,404
PER CAPITA INCOME
$66,429
AVG FAMILY INCOME
$51,806
AVG HOUSEHOLD INCOME
39.9%
WAGE / INCOME GAP [ % ]
60.1¢/ $1
WAGE / INCOME GAP [ $ ]
0.48
INEQUALITY / GINI INDEX
722
TOTAL POPULATION
405
MALE POPULATION
317
FEMALE POPULATION
127.76
MALES / 100 FEMALES
78.27
FEMALES / 100 MALES
33.0
MEDIAN AGE
3.3
AVG FAMILY SIZE
2.8
AVG HOUSEHOLD SIZE
314
LABOR FORCE [ PEOPLE ]
62.2%
PERCENT IN LABOR FORCE
1.3%
UNEMPLOYMENT RATE
Stratton Zip Codes
Stratton Area Codes
Income in Stratton
Income Overview in Stratton
Per Capita Income in Stratton is $29,404, while median incomes of families and households are $66,429 and $51,806 respectively.
| Characteristic | Number | Measure |
| Per Capita Income | 722 | $29,404 |
| Median Family Income | 184 | $66,429 |
| Mean Family Income | 184 | $95,617 |
| Median Household Income | 251 | $51,806 |
| Mean Household Income | 251 | $80,595 |
| Income Deficit | 184 | $0 |
| Wage / Income Gap (%) | 722 | 39.91% |
| Wage / Income Gap ($) | 722 | 60.09¢ per $1 |
| Gini / Inequality Index | 722 | 0.48 |
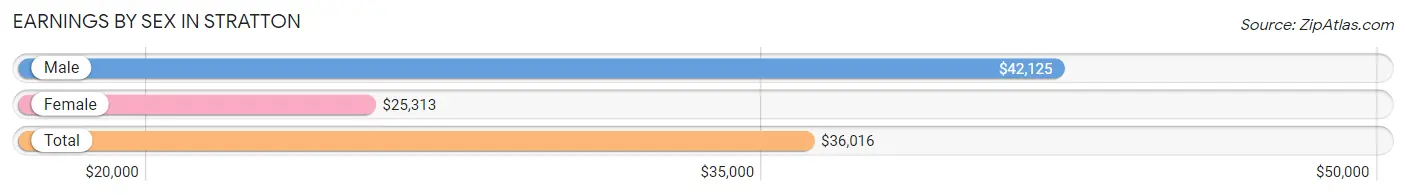
Earnings by Sex in Stratton
Average Earnings in Stratton are $36,016, $42,125 for men and $25,313 for women, a difference of 39.9%.
| Sex | Number | Average Earnings |
| Male | 197 (62.0%) | $42,125 |
| Female | 121 (38.1%) | $25,313 |
| Total | 318 (100.0%) | $36,016 |
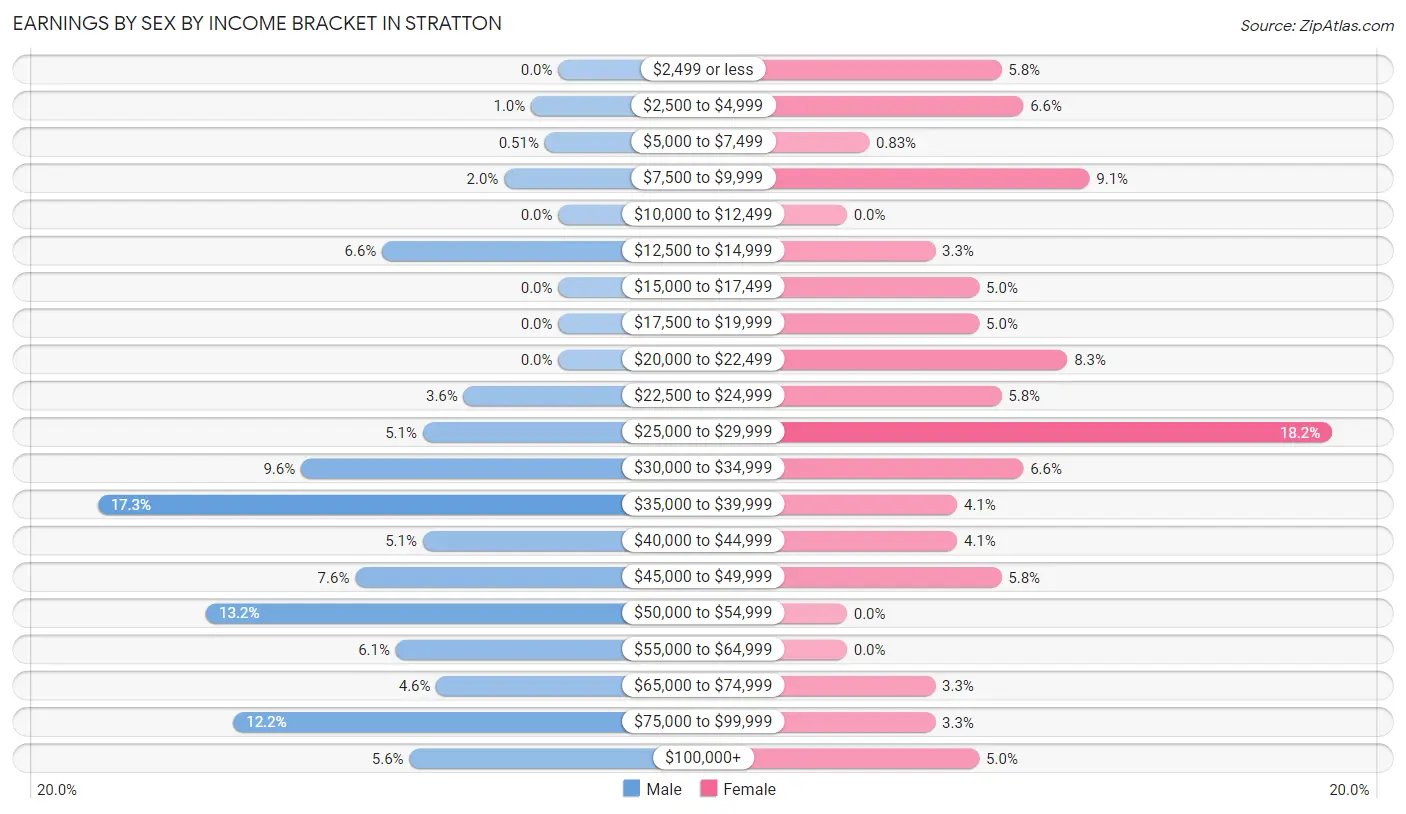
Earnings by Sex by Income Bracket in Stratton
The most common earnings brackets in Stratton are $35,000 to $39,999 for men (34 | 17.3%) and $25,000 to $29,999 for women (22 | 18.2%).
| Income | Male | Female |
| $2,499 or less | 0 (0.0%) | 7 (5.8%) |
| $2,500 to $4,999 | 2 (1.0%) | 8 (6.6%) |
| $5,000 to $7,499 | 1 (0.5%) | 1 (0.8%) |
| $7,500 to $9,999 | 4 (2.0%) | 11 (9.1%) |
| $10,000 to $12,499 | 0 (0.0%) | 0 (0.0%) |
| $12,500 to $14,999 | 13 (6.6%) | 4 (3.3%) |
| $15,000 to $17,499 | 0 (0.0%) | 6 (5.0%) |
| $17,500 to $19,999 | 0 (0.0%) | 6 (5.0%) |
| $20,000 to $22,499 | 0 (0.0%) | 10 (8.3%) |
| $22,500 to $24,999 | 7 (3.5%) | 7 (5.8%) |
| $25,000 to $29,999 | 10 (5.1%) | 22 (18.2%) |
| $30,000 to $34,999 | 19 (9.6%) | 8 (6.6%) |
| $35,000 to $39,999 | 34 (17.3%) | 5 (4.1%) |
| $40,000 to $44,999 | 10 (5.1%) | 5 (4.1%) |
| $45,000 to $49,999 | 15 (7.6%) | 7 (5.8%) |
| $50,000 to $54,999 | 26 (13.2%) | 0 (0.0%) |
| $55,000 to $64,999 | 12 (6.1%) | 0 (0.0%) |
| $65,000 to $74,999 | 9 (4.6%) | 4 (3.3%) |
| $75,000 to $99,999 | 24 (12.2%) | 4 (3.3%) |
| $100,000+ | 11 (5.6%) | 6 (5.0%) |
| Total | 197 (100.0%) | 121 (100.0%) |
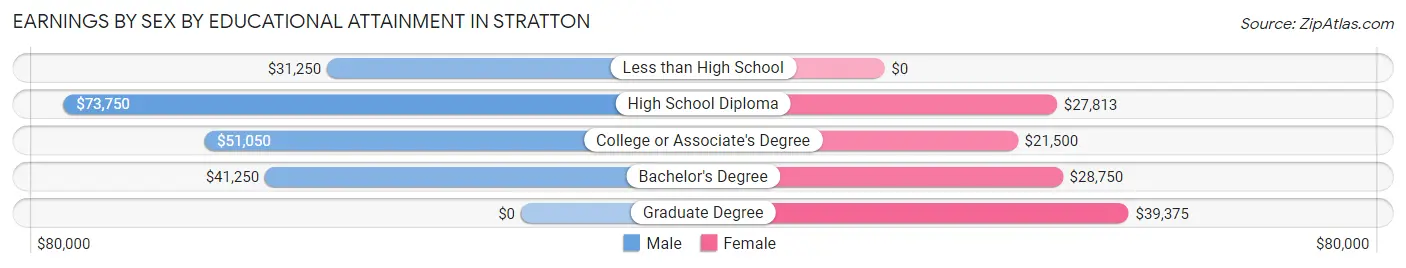
Earnings by Sex by Educational Attainment in Stratton
Average earnings in Stratton are $45,938 for men and $26,250 for women, a difference of 42.9%. Men with an educational attainment of high school diploma enjoy the highest average annual earnings of $73,750, while those with less than high school education earn the least with $31,250. Women with an educational attainment of graduate degree earn the most with the average annual earnings of $39,375, while those with college or associate's degree education have the smallest earnings of $21,500.
| Educational Attainment | Male Income | Female Income |
| Less than High School | $31,250 | $0 |
| High School Diploma | $73,750 | $27,813 |
| College or Associate's Degree | $51,050 | $21,500 |
| Bachelor's Degree | $41,250 | $28,750 |
| Graduate Degree | - | - |
| Total | $45,938 | $26,250 |
Family Income in Stratton
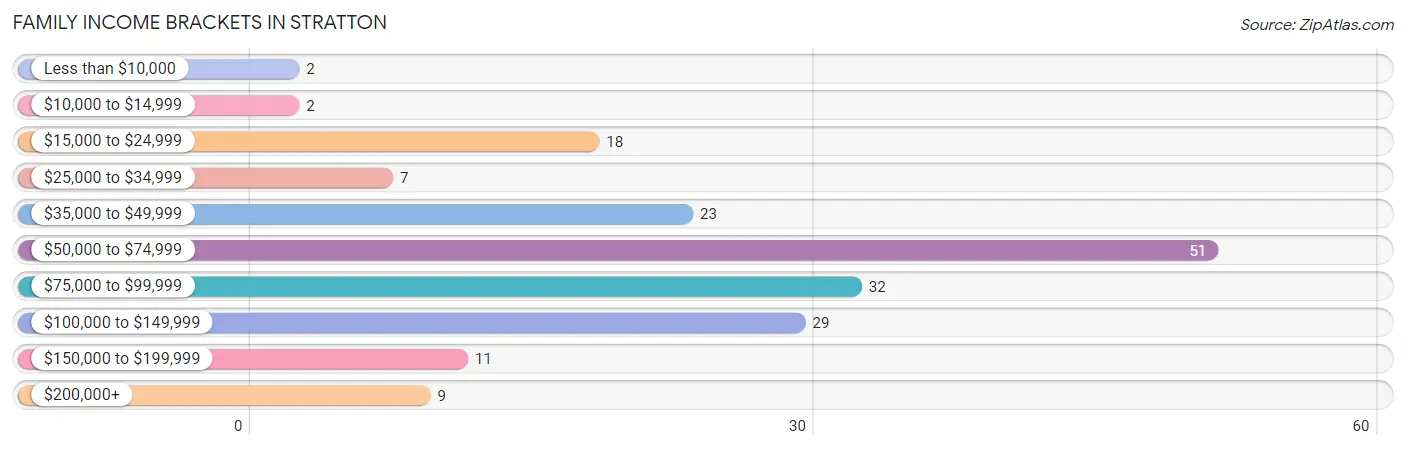
Family Income Brackets in Stratton
According to the Stratton family income data, there are 51 families falling into the $50,000 to $74,999 income range, which is the most common income bracket and makes up 27.7% of all families. Conversely, the less than $10,000 income bracket is the least frequent group with only 2 families (1.1%) belonging to this category.
| Income Bracket | # Families | % Families |
| Less than $10,000 | 2 | 1.1% |
| $10,000 to $14,999 | 2 | 1.1% |
| $15,000 to $24,999 | 18 | 9.8% |
| $25,000 to $34,999 | 7 | 3.8% |
| $35,000 to $49,999 | 23 | 12.5% |
| $50,000 to $74,999 | 51 | 27.7% |
| $75,000 to $99,999 | 32 | 17.4% |
| $100,000 to $149,999 | 29 | 15.8% |
| $150,000 to $199,999 | 11 | 6.0% |
| $200,000+ | 9 | 4.9% |
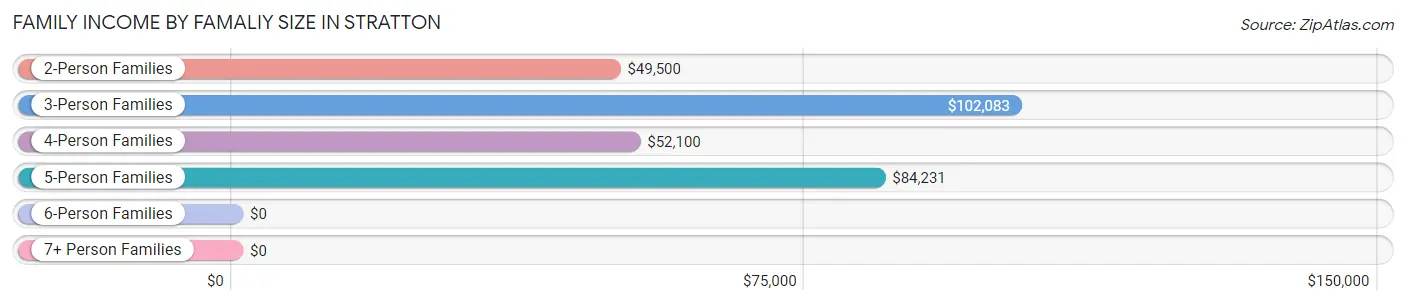
Family Income by Famaliy Size in Stratton
3-person families (30 | 16.3%) account for the highest median family income in Stratton with $102,083 per family, while 3-person families (30 | 16.3%) have the highest median income of $34,028 per family member.
| Income Bracket | # Families | Median Income |
| 2-Person Families | 76 (41.3%) | $49,500 |
| 3-Person Families | 30 (16.3%) | $102,083 |
| 4-Person Families | 42 (22.8%) | $52,100 |
| 5-Person Families | 26 (14.1%) | $84,231 |
| 6-Person Families | 8 (4.3%) | $0 |
| 7+ Person Families | 2 (1.1%) | $0 |
| Total | 184 (100.0%) | $66,429 |
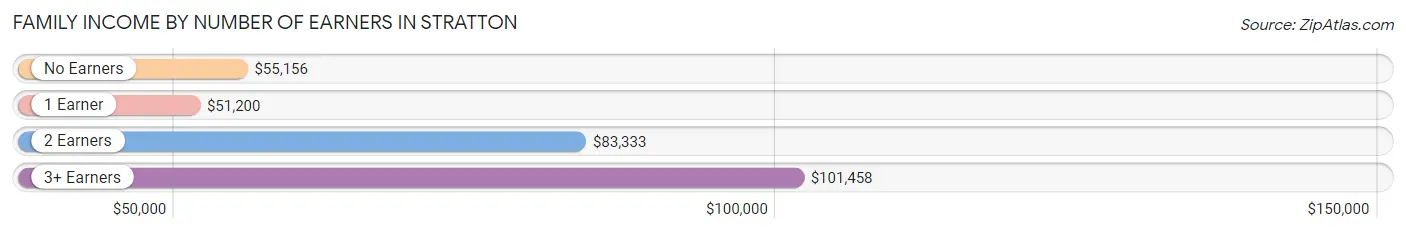
Family Income by Number of Earners in Stratton
The median family income in Stratton is $66,429, with families comprising 3+ earners (13) having the highest median family income of $101,458, while families with 1 earner (76) have the lowest median family income of $51,200, accounting for 7.1% and 41.3% of families, respectively.
| Number of Earners | # Families | Median Income |
| No Earners | 29 (15.8%) | $55,156 |
| 1 Earner | 76 (41.3%) | $51,200 |
| 2 Earners | 66 (35.9%) | $83,333 |
| 3+ Earners | 13 (7.1%) | $101,458 |
| Total | 184 (100.0%) | $66,429 |
Household Income in Stratton
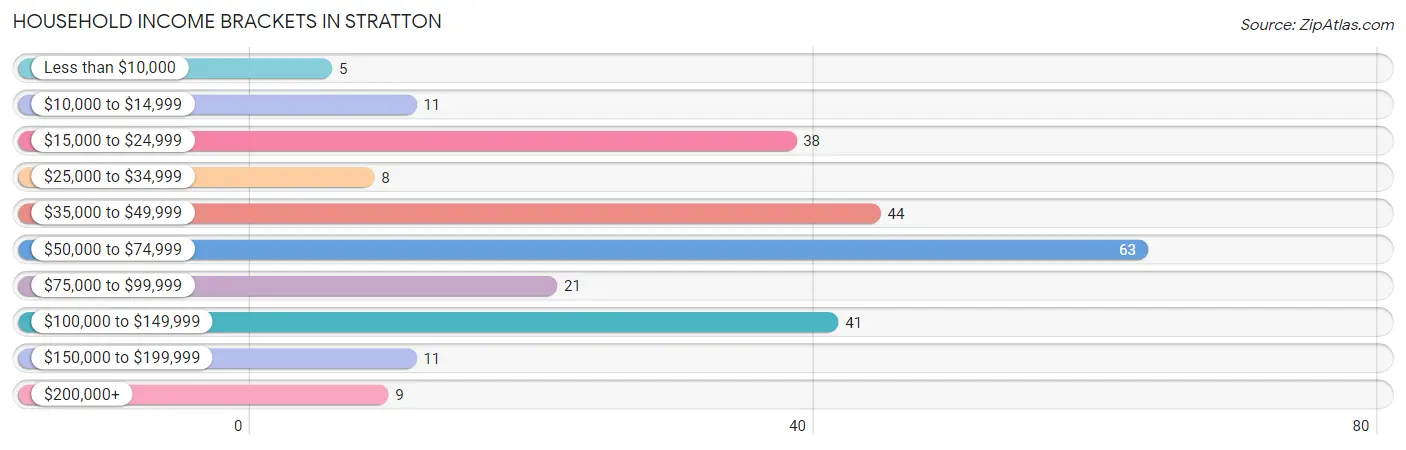
Household Income Brackets in Stratton
With 63 households falling in the category, the $50,000 to $74,999 income range is the most frequent in Stratton, accounting for 25.1% of all households. In contrast, only 5 households (2.0%) fall into the less than $10,000 income bracket, making it the least populous group.
| Income Bracket | # Households | % Households |
| Less than $10,000 | 5 | 2.0% |
| $10,000 to $14,999 | 11 | 4.4% |
| $15,000 to $24,999 | 38 | 15.1% |
| $25,000 to $34,999 | 8 | 3.2% |
| $35,000 to $49,999 | 44 | 17.5% |
| $50,000 to $74,999 | 63 | 25.1% |
| $75,000 to $99,999 | 21 | 8.4% |
| $100,000 to $149,999 | 41 | 16.3% |
| $150,000 to $199,999 | 11 | 4.4% |
| $200,000+ | 9 | 3.6% |
Household Income by Householder Age in Stratton
The median household income in Stratton is $51,806, with the highest median household income of $68,906 found in the 15 to 24 years age bracket for the primary householder. A total of 13 households (5.2%) fall into this category. Meanwhile, the 25 to 44 years age bracket for the primary householder has the lowest median household income of $0, with 106 households (42.2%) in this group.
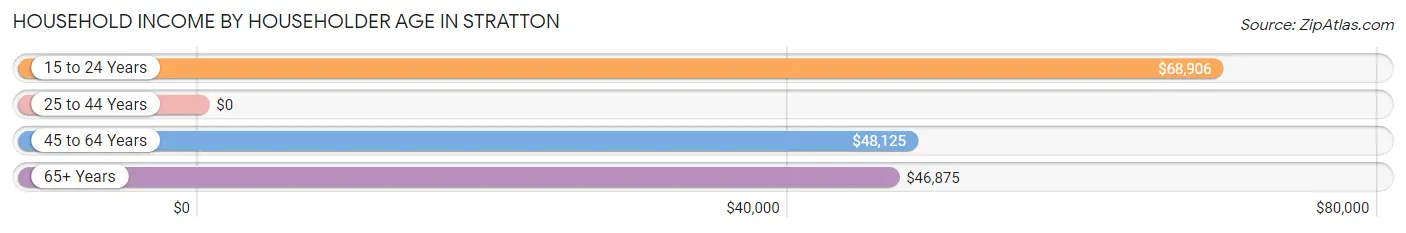
| Income Bracket | # Households | Median Income |
| 15 to 24 Years | 13 (5.2%) | $68,906 |
| 25 to 44 Years | 106 (42.2%) | $0 |
| 45 to 64 Years | 57 (22.7%) | $48,125 |
| 65+ Years | 75 (29.9%) | $46,875 |
| Total | 251 (100.0%) | $51,806 |
Poverty in Stratton
Income Below Poverty by Sex and Age in Stratton
With 8.5% poverty level for males and 5.4% for females among the residents of Stratton, 6 to 11 year old males and 12 to 14 year old females are the most vulnerable to poverty, with 7 males (22.6%) and 7 females (26.9%) in their respective age groups living below the poverty level.
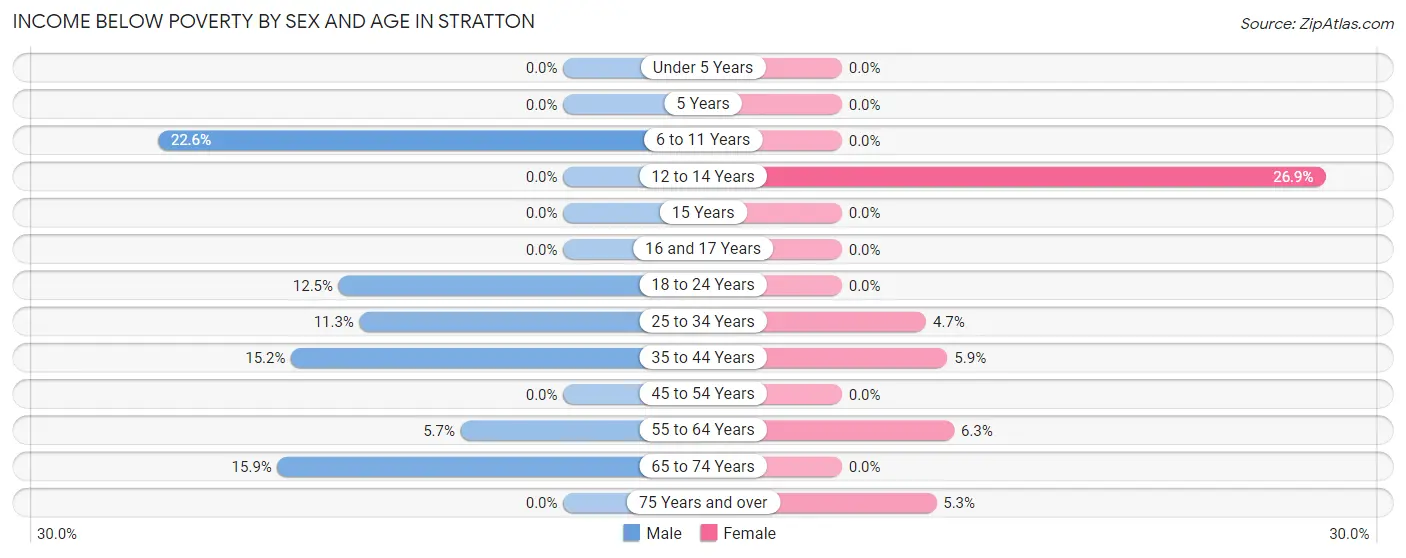
| Age Bracket | Male | Female |
| Under 5 Years | 0 (0.0%) | 0 (0.0%) |
| 5 Years | 0 (0.0%) | 0 (0.0%) |
| 6 to 11 Years | 7 (22.6%) | 0 (0.0%) |
| 12 to 14 Years | 0 (0.0%) | 7 (26.9%) |
| 15 Years | 0 (0.0%) | 0 (0.0%) |
| 16 and 17 Years | 0 (0.0%) | 0 (0.0%) |
| 18 to 24 Years | 2 (12.5%) | 0 (0.0%) |
| 25 to 34 Years | 11 (11.3%) | 3 (4.7%) |
| 35 to 44 Years | 5 (15.1%) | 2 (5.9%) |
| 45 to 54 Years | 0 (0.0%) | 0 (0.0%) |
| 55 to 64 Years | 2 (5.7%) | 2 (6.2%) |
| 65 to 74 Years | 7 (15.9%) | 0 (0.0%) |
| 75 Years and over | 0 (0.0%) | 2 (5.3%) |
| Total | 34 (8.5%) | 16 (5.4%) |
Income Above Poverty by Sex and Age in Stratton
According to the poverty statistics in Stratton, males aged under 5 years and females aged under 5 years are the age groups that are most secure financially, with 100.0% of males and 100.0% of females in these age groups living above the poverty line.
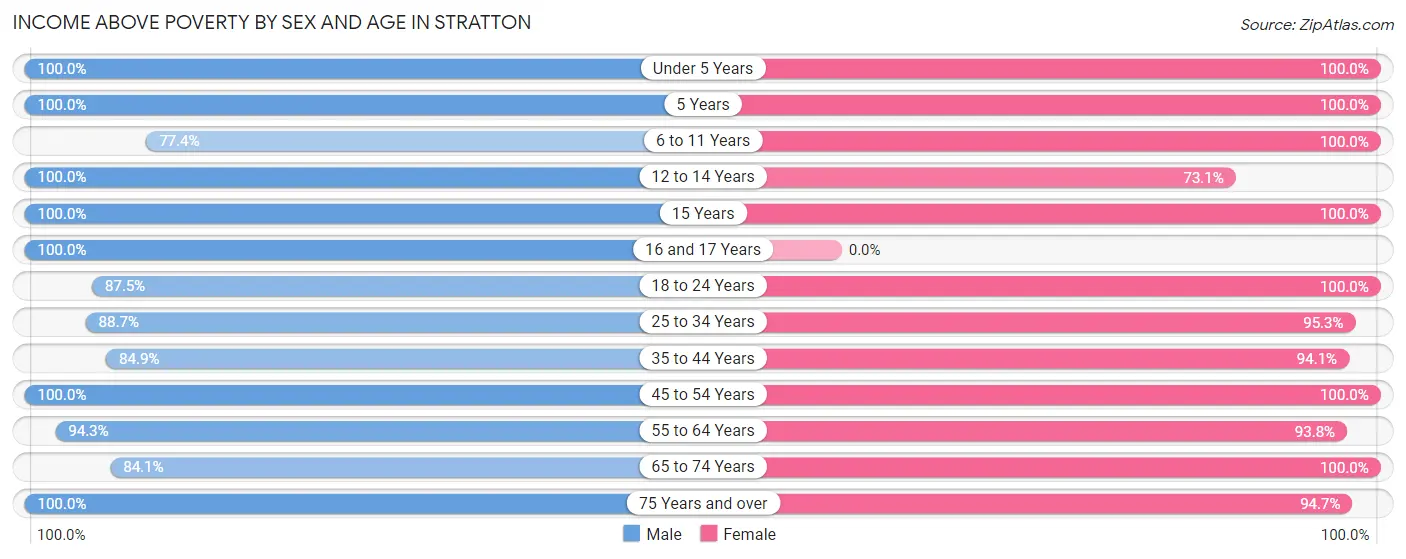
| Age Bracket | Male | Female |
| Under 5 Years | 89 (100.0%) | 16 (100.0%) |
| 5 Years | 5 (100.0%) | 8 (100.0%) |
| 6 to 11 Years | 24 (77.4%) | 29 (100.0%) |
| 12 to 14 Years | 5 (100.0%) | 19 (73.1%) |
| 15 Years | 7 (100.0%) | 1 (100.0%) |
| 16 and 17 Years | 1 (100.0%) | 0 (0.0%) |
| 18 to 24 Years | 14 (87.5%) | 11 (100.0%) |
| 25 to 34 Years | 86 (88.7%) | 61 (95.3%) |
| 35 to 44 Years | 28 (84.9%) | 32 (94.1%) |
| 45 to 54 Years | 15 (100.0%) | 12 (100.0%) |
| 55 to 64 Years | 33 (94.3%) | 30 (93.8%) |
| 65 to 74 Years | 37 (84.1%) | 25 (100.0%) |
| 75 Years and over | 22 (100.0%) | 36 (94.7%) |
| Total | 366 (91.5%) | 280 (94.6%) |
Income Below Poverty Among Married-Couple Families in Stratton
The poverty statistics for married-couple families in Stratton show that 3.3% or 5 of the total 154 families live below the poverty line. Families with 3 or 4 children have the highest poverty rate of 14.3%, comprising of 3 families. On the other hand, families with 1 or 2 children have the lowest poverty rate of 0.0%, which includes 0 families.
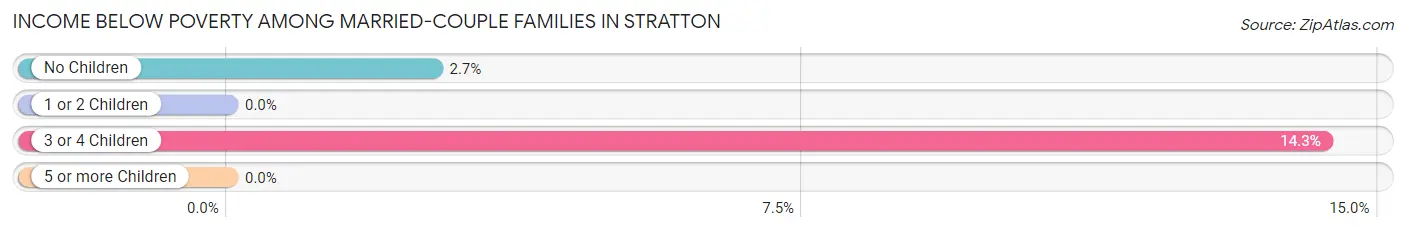
| Children | Above Poverty | Below Poverty |
| No Children | 73 (97.3%) | 2 (2.7%) |
| 1 or 2 Children | 58 (100.0%) | 0 (0.0%) |
| 3 or 4 Children | 18 (85.7%) | 3 (14.3%) |
| 5 or more Children | 0 (0.0%) | 0 (0.0%) |
| Total | 149 (96.8%) | 5 (3.3%) |
Income Below Poverty Among Single-Parent Households in Stratton
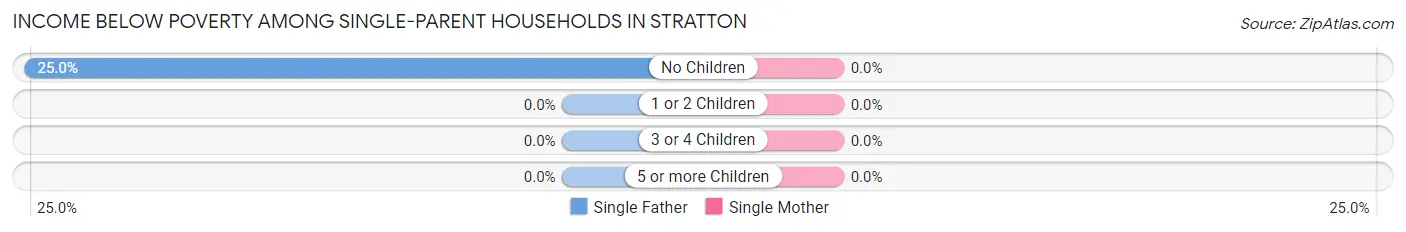
| Children | Single Father | Single Mother |
| No Children | 2 (25.0%) | 0 (0.0%) |
| 1 or 2 Children | 0 (0.0%) | 0 (0.0%) |
| 3 or 4 Children | 0 (0.0%) | 0 (0.0%) |
| 5 or more Children | 0 (0.0%) | 0 (0.0%) |
| Total | 2 (10.0%) | 0 (0.0%) |
Income Below Poverty Among Married-Couple vs Single-Parent Households in Stratton
The poverty data for Stratton shows that 5 of the married-couple family households (3.3%) and 2 of the single-parent households (6.7%) are living below the poverty level. Within the married-couple family households, those with 3 or 4 children have the highest poverty rate, with 3 households (14.3%) falling below the poverty line. Among the single-parent households, those with no children have the highest poverty rate, with 2 household (25.0%) living below poverty.
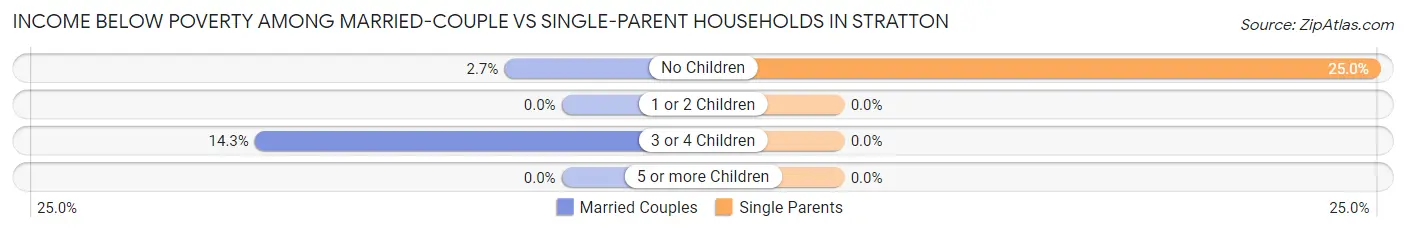
| Children | Married-Couple Families | Single-Parent Households |
| No Children | 2 (2.7%) | 2 (25.0%) |
| 1 or 2 Children | 0 (0.0%) | 0 (0.0%) |
| 3 or 4 Children | 3 (14.3%) | 0 (0.0%) |
| 5 or more Children | 0 (0.0%) | 0 (0.0%) |
| Total | 5 (3.3%) | 2 (6.7%) |
Race in Stratton
The most populous races in Stratton are White / Caucasian (603 | 83.5%), Hispanic or Latino (113 | 15.7%), and Two or more Races (97 | 13.4%).
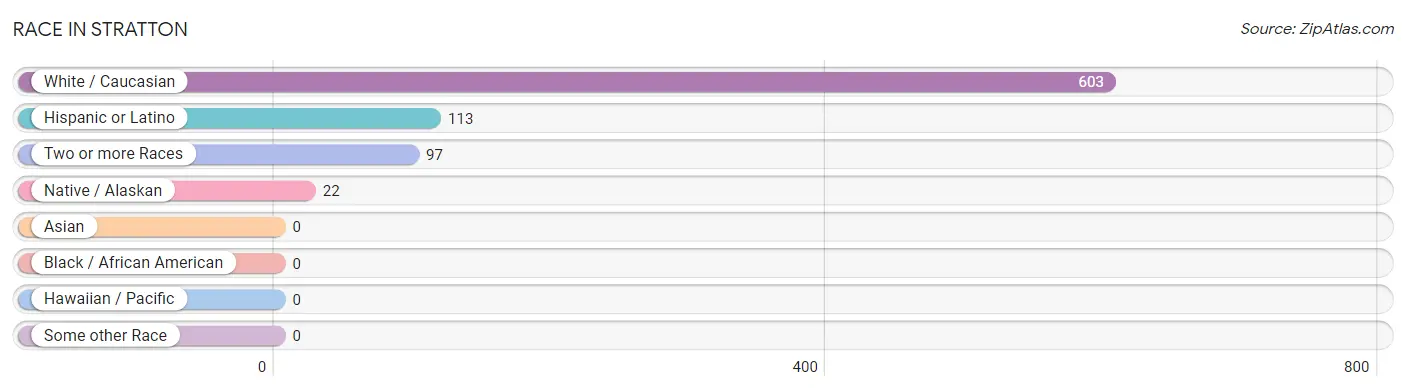
| Race | # Population | % Population |
| Asian | 0 | 0.0% |
| Black / African American | 0 | 0.0% |
| Hawaiian / Pacific | 0 | 0.0% |
| Hispanic or Latino | 113 | 15.7% |
| Native / Alaskan | 22 | 3.0% |
| White / Caucasian | 603 | 83.5% |
| Two or more Races | 97 | 13.4% |
| Some other Race | 0 | 0.0% |
| Total | 722 | 100.0% |
Ancestry in Stratton
The most populous ancestries reported in Stratton are German (251 | 34.8%), Mexican (109 | 15.1%), English (86 | 11.9%), Irish (57 | 7.9%), and American (46 | 6.4%), together accounting for 76.0% of all Stratton residents.
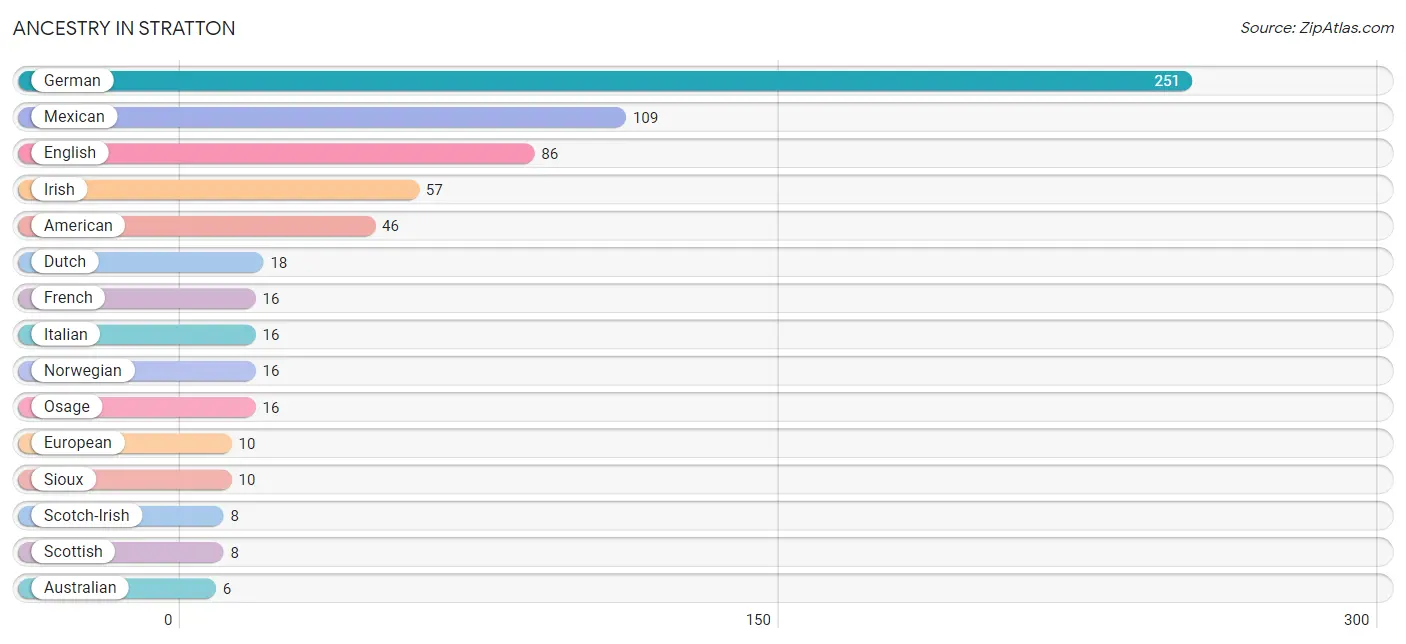
| Ancestry | # Population | % Population |
| American | 46 | 6.4% |
| Australian | 6 | 0.8% |
| Belgian | 3 | 0.4% |
| Bhutanese | 4 | 0.5% |
| British | 5 | 0.7% |
| Cherokee | 4 | 0.5% |
| Czech | 6 | 0.8% |
| Dutch | 18 | 2.5% |
| English | 86 | 11.9% |
| European | 10 | 1.4% |
| French | 16 | 2.2% |
| German | 251 | 34.8% |
| Irish | 57 | 7.9% |
| Italian | 16 | 2.2% |
| Mexican | 109 | 15.1% |
| Navajo | 1 | 0.1% |
| Norwegian | 16 | 2.2% |
| Osage | 16 | 2.2% |
| Polish | 4 | 0.5% |
| Scotch-Irish | 8 | 1.1% |
| Scottish | 8 | 1.1% |
| Sioux | 10 | 1.4% |
| Spanish | 4 | 0.5% |
| Swedish | 5 | 0.7% |
| Swiss | 2 | 0.3% |
| Welsh | 6 | 0.8% | View All 26 Rows |
Immigrants in Stratton
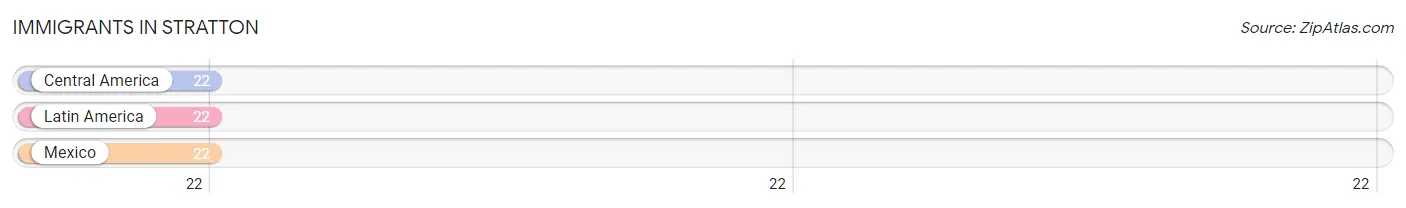
The most numerous immigrant groups reported in Stratton came from Central America (22 | 3.0%), Latin America (22 | 3.0%), and Mexico (22 | 3.0%), together accounting for 9.1% of all Stratton residents.
| Immigration Origin | # Population | % Population |
| Central America | 22 | 3.0% |
| Latin America | 22 | 3.0% |
| Mexico | 22 | 3.0% | View All 3 Rows |
Sex and Age in Stratton
Sex and Age in Stratton
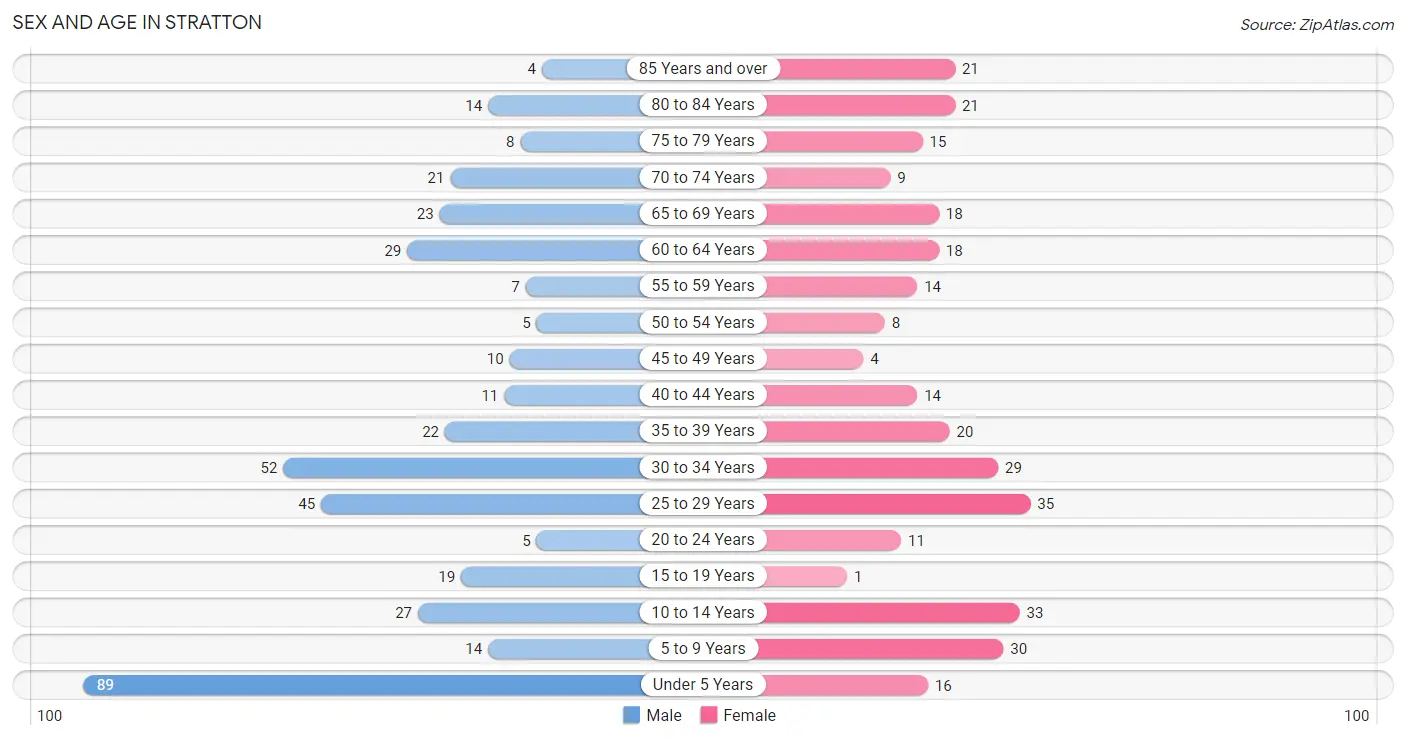
The most populous age groups in Stratton are Under 5 Years (89 | 22.0%) for men and 25 to 29 Years (35 | 11.0%) for women.
| Age Bracket | Male | Female |
| Under 5 Years | 89 (22.0%) | 16 (5.1%) |
| 5 to 9 Years | 14 (3.5%) | 30 (9.5%) |
| 10 to 14 Years | 27 (6.7%) | 33 (10.4%) |
| 15 to 19 Years | 19 (4.7%) | 1 (0.3%) |
| 20 to 24 Years | 5 (1.2%) | 11 (3.5%) |
| 25 to 29 Years | 45 (11.1%) | 35 (11.0%) |
| 30 to 34 Years | 52 (12.8%) | 29 (9.1%) |
| 35 to 39 Years | 22 (5.4%) | 20 (6.3%) |
| 40 to 44 Years | 11 (2.7%) | 14 (4.4%) |
| 45 to 49 Years | 10 (2.5%) | 4 (1.3%) |
| 50 to 54 Years | 5 (1.2%) | 8 (2.5%) |
| 55 to 59 Years | 7 (1.7%) | 14 (4.4%) |
| 60 to 64 Years | 29 (7.2%) | 18 (5.7%) |
| 65 to 69 Years | 23 (5.7%) | 18 (5.7%) |
| 70 to 74 Years | 21 (5.2%) | 9 (2.8%) |
| 75 to 79 Years | 8 (2.0%) | 15 (4.7%) |
| 80 to 84 Years | 14 (3.5%) | 21 (6.6%) |
| 85 Years and over | 4 (1.0%) | 21 (6.6%) |
| Total | 405 (100.0%) | 317 (100.0%) |
Families and Households in Stratton
Median Family Size in Stratton
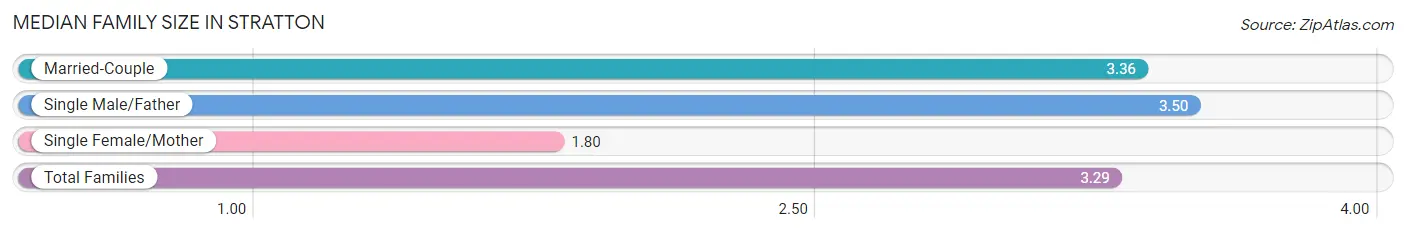
The median family size in Stratton is 3.29 persons per family, with single male/father families (20 | 10.9%) accounting for the largest median family size of 3.5 persons per family. On the other hand, single female/mother families (10 | 5.4%) represent the smallest median family size with 1.80 persons per family.
| Family Type | # Families | Family Size |
| Married-Couple | 154 (83.7%) | 3.36 |
| Single Male/Father | 20 (10.9%) | 3.50 |
| Single Female/Mother | 10 (5.4%) | 1.80 |
| Total Families | 184 (100.0%) | 3.29 |
Median Household Size in Stratton
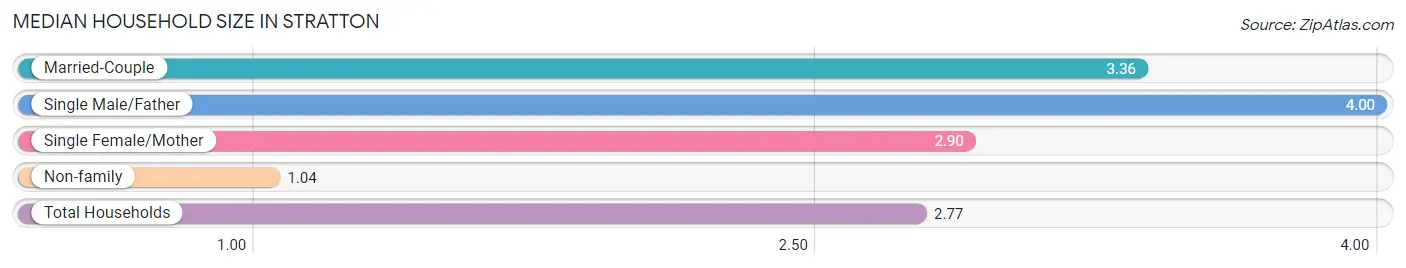
The median household size in Stratton is 2.77 persons per household, with single male/father households (20 | 8.0%) accounting for the largest median household size of 4 persons per household. non-family households (67 | 26.7%) represent the smallest median household size with 1.04 persons per household.
| Household Type | # Households | Household Size |
| Married-Couple | 154 (61.4%) | 3.36 |
| Single Male/Father | 20 (8.0%) | 4.00 |
| Single Female/Mother | 10 (4.0%) | 2.90 |
| Non-family | 67 (26.7%) | 1.04 |
| Total Households | 251 (100.0%) | 2.77 |
Household Size by Marriage Status in Stratton
Out of a total of 251 households in Stratton, 184 (73.3%) are family households, while 67 (26.7%) are nonfamily households. The most numerous type of family households are 2-person households, comprising 68, and the most common type of nonfamily households are 1-person households, comprising 64.
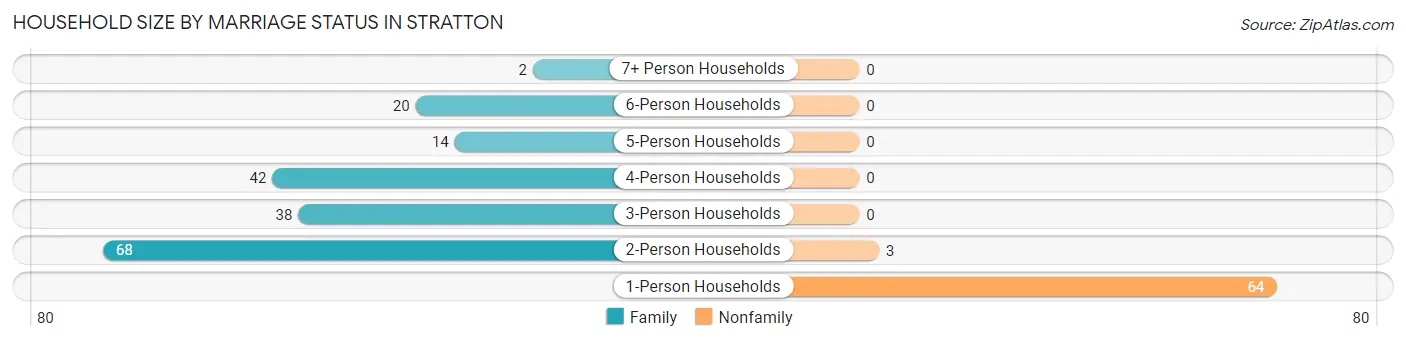
| Household Size | Family Households | Nonfamily Households |
| 1-Person Households | - | 64 (25.5%) |
| 2-Person Households | 68 (27.1%) | 3 (1.2%) |
| 3-Person Households | 38 (15.1%) | 0 (0.0%) |
| 4-Person Households | 42 (16.7%) | 0 (0.0%) |
| 5-Person Households | 14 (5.6%) | 0 (0.0%) |
| 6-Person Households | 20 (8.0%) | 0 (0.0%) |
| 7+ Person Households | 2 (0.8%) | 0 (0.0%) |
| Total | 184 (73.3%) | 67 (26.7%) |
Female Fertility in Stratton
Fertility by Age in Stratton
Average fertility rate in Stratton is 397.0 births per 1,000 women. Women in the age bracket of 20 to 34 years have the highest fertility rate with 560.0 births per 1,000 women. Women in the age bracket of 20 to 34 years acount for 91.3% of all women with births.
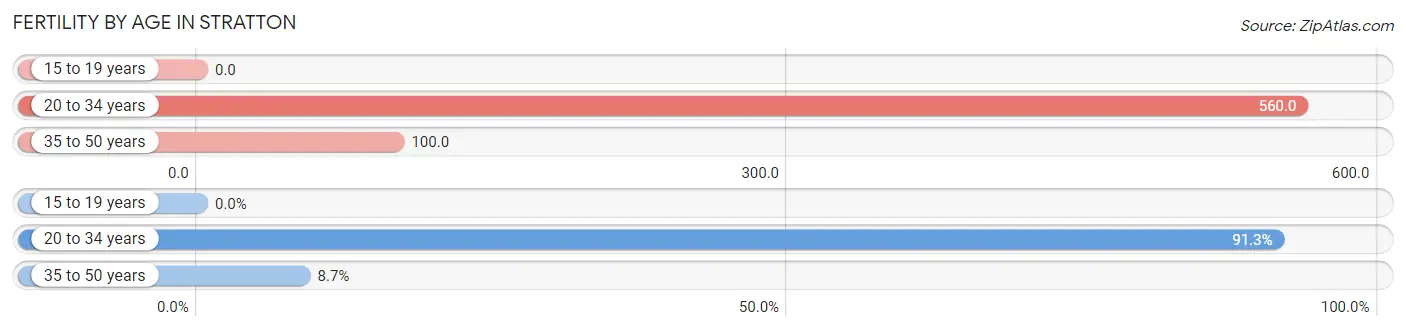
| Age Bracket | Women with Births | Births / 1,000 Women |
| 15 to 19 years | 0 (0.0%) | 0.0 |
| 20 to 34 years | 42 (91.3%) | 560.0 |
| 35 to 50 years | 4 (8.7%) | 100.0 |
| Total | 46 (100.0%) | 397.0 |
Fertility by Age by Marriage Status in Stratton
60.9% of women with births (46) in Stratton are married. The highest percentage of unmarried women with births falls into 20 to 34 years age bracket with 42.9% of them unmarried at the time of birth, while the lowest percentage of unmarried women with births belong to 35 to 50 years age bracket with 0.0% of them unmarried.
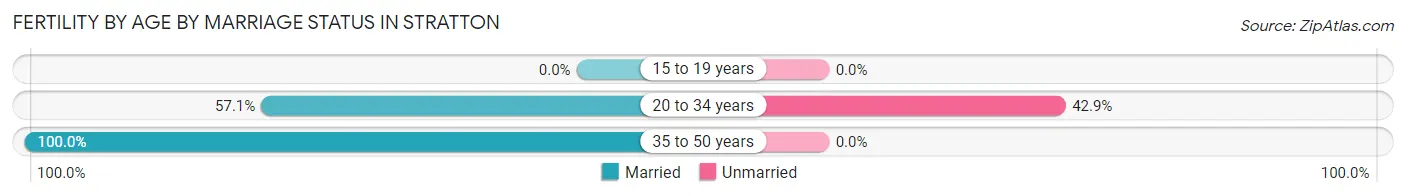
| Age Bracket | Married | Unmarried |
| 15 to 19 years | 0 (0.0%) | 0 (0.0%) |
| 20 to 34 years | 24 (57.1%) | 18 (42.9%) |
| 35 to 50 years | 4 (100.0%) | 0 (0.0%) |
| Total | 28 (60.9%) | 18 (39.1%) |
Fertility by Education in Stratton
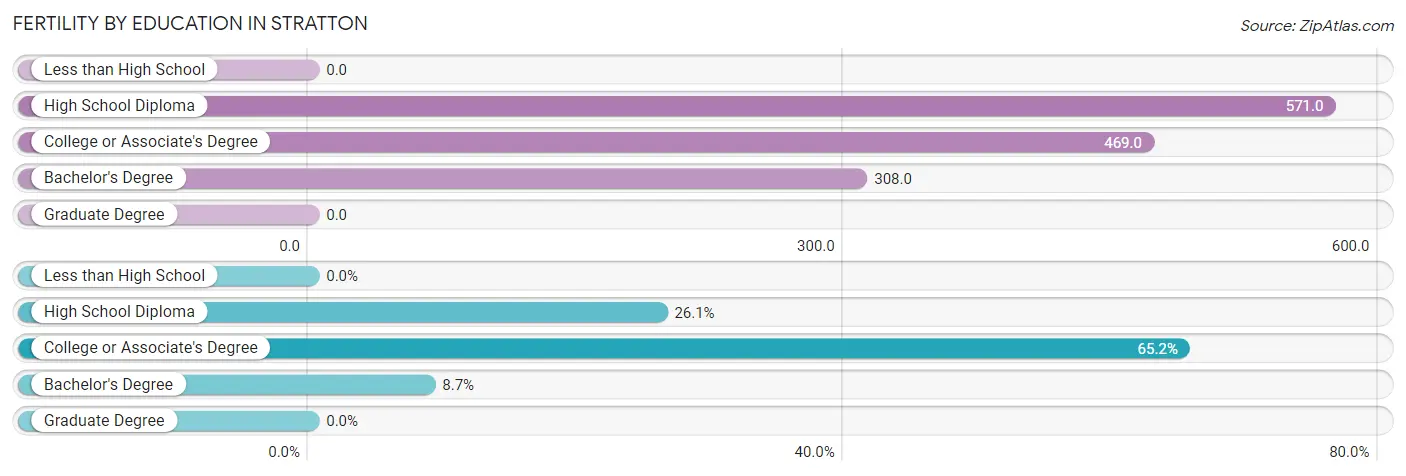
| Educational Attainment | Women with Births | Births / 1,000 Women |
| Less than High School | 0 (0.0%) | 0.0 |
| High School Diploma | 12 (26.1%) | 571.0 |
| College or Associate's Degree | 30 (65.2%) | 469.0 |
| Bachelor's Degree | 4 (8.7%) | 308.0 |
| Graduate Degree | 0 (0.0%) | 0.0 |
| Total | 46 (100.0%) | 397.0 |
Fertility by Education by Marriage Status in Stratton
39.1% of women with births in Stratton are unmarried. Women with the educational attainment of bachelor's degree are most likely to be married with 100.0% of them married at childbirth, while women with the educational attainment of high school diploma are least likely to be married with 83.3% of them unmarried at childbirth.
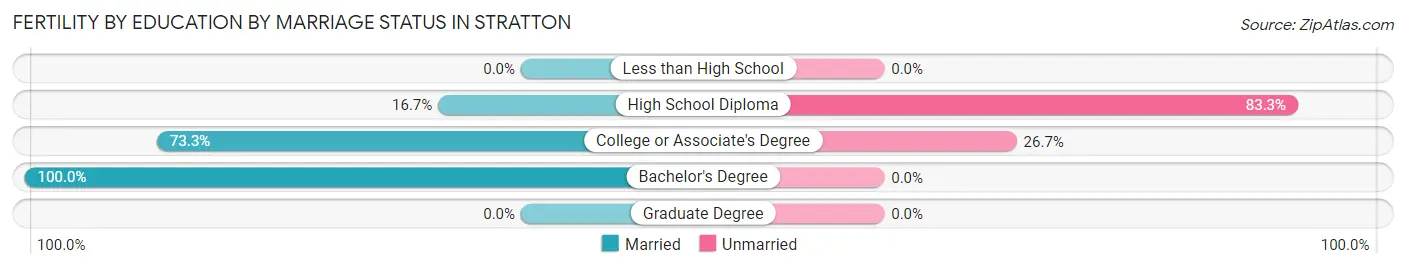
| Educational Attainment | Married | Unmarried |
| Less than High School | 0 (0.0%) | 0 (0.0%) |
| High School Diploma | 2 (16.7%) | 10 (83.3%) |
| College or Associate's Degree | 22 (73.3%) | 8 (26.7%) |
| Bachelor's Degree | 4 (100.0%) | 0 (0.0%) |
| Graduate Degree | 0 (0.0%) | 0 (0.0%) |
| Total | 28 (60.9%) | 18 (39.1%) |
Employment Characteristics in Stratton
Employment by Class of Employer in Stratton
Among the 304 employed individuals in Stratton, private company employees (180 | 59.2%), local government employees (48 | 15.8%), and not-for-profit organizations (37 | 12.2%) make up the most common classes of employment.
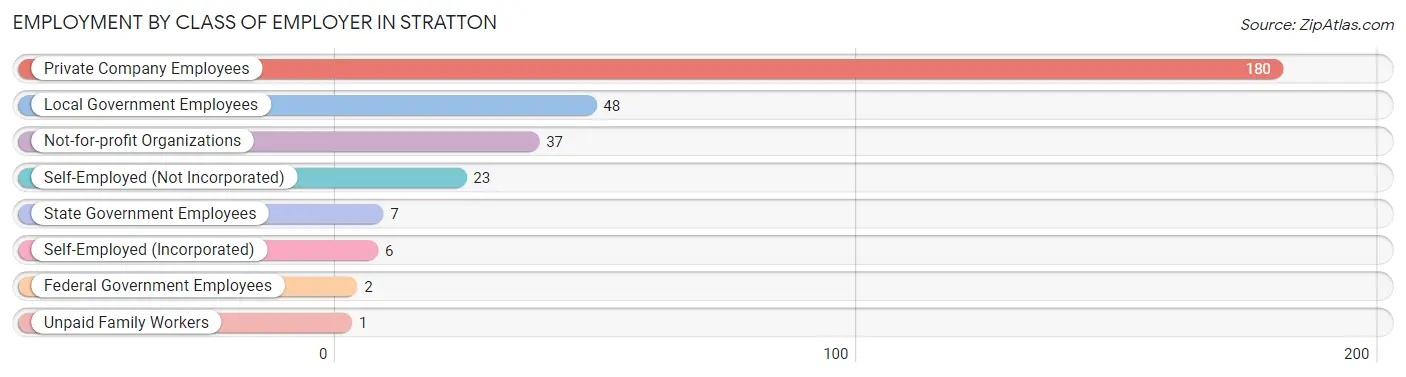
| Employer Class | # Employees | % Employees |
| Private Company Employees | 180 | 59.2% |
| Self-Employed (Incorporated) | 6 | 2.0% |
| Self-Employed (Not Incorporated) | 23 | 7.6% |
| Not-for-profit Organizations | 37 | 12.2% |
| Local Government Employees | 48 | 15.8% |
| State Government Employees | 7 | 2.3% |
| Federal Government Employees | 2 | 0.7% |
| Unpaid Family Workers | 1 | 0.3% |
| Total | 304 | 100.0% |
Employment Status by Age in Stratton
According to the labor force statistics for Stratton, out of the total population over 16 years of age (505), 62.2% or 314 individuals are in the labor force, with 1.3% or 4 of them unemployed. The age group with the highest labor force participation rate is 45 to 54 years, with 96.3% or 26 individuals in the labor force. Within the labor force, the 20 to 24 years age range has the highest percentage of unemployed individuals, with 25.0% or 2 of them being unemployed.
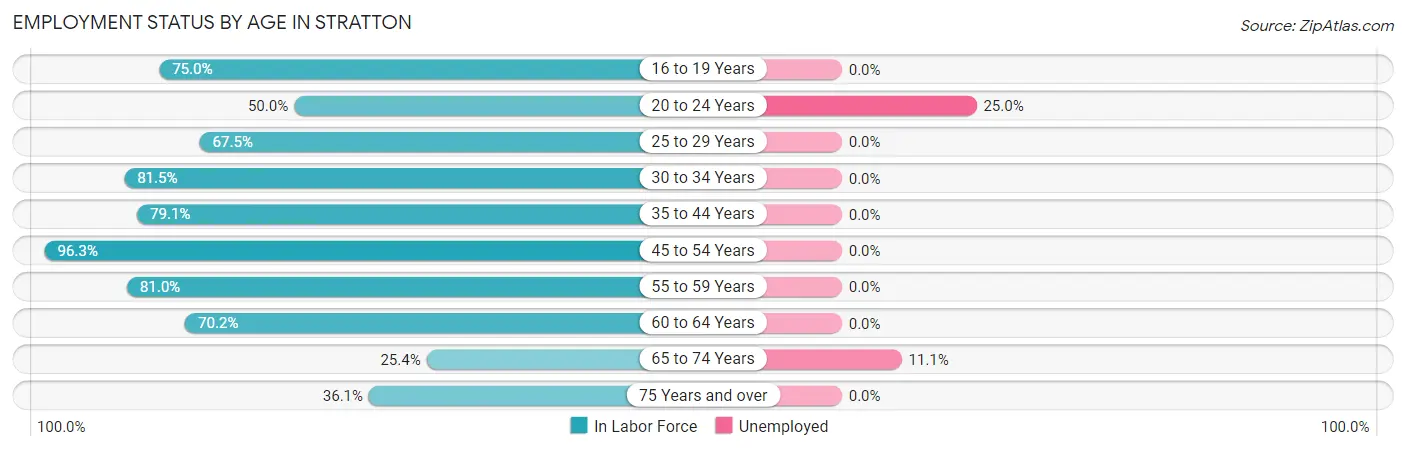
| Age Bracket | In Labor Force | Unemployed |
| 16 to 19 Years | 9 (75.0%) | 0 (0.0%) |
| 20 to 24 Years | 8 (50.0%) | 2 (25.0%) |
| 25 to 29 Years | 54 (67.5%) | 0 (0.0%) |
| 30 to 34 Years | 66 (81.5%) | 0 (0.0%) |
| 35 to 44 Years | 53 (79.1%) | 0 (0.0%) |
| 45 to 54 Years | 26 (96.3%) | 0 (0.0%) |
| 55 to 59 Years | 17 (81.0%) | 0 (0.0%) |
| 60 to 64 Years | 33 (70.2%) | 0 (0.0%) |
| 65 to 74 Years | 18 (25.4%) | 2 (11.1%) |
| 75 Years and over | 30 (36.1%) | 0 (0.0%) |
| Total | 314 (62.2%) | 4 (1.3%) |
Employment Status by Educational Attainment in Stratton
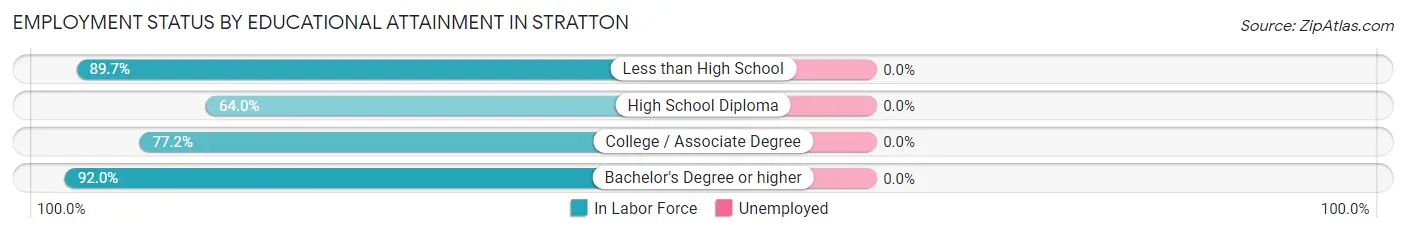
| Educational Attainment | In Labor Force | Unemployed |
| Less than High School | 26 (89.7%) | 0 (0.0%) |
| High School Diploma | 55 (64.0%) | 0 (0.0%) |
| College / Associate Degree | 122 (77.2%) | 0 (0.0%) |
| Bachelor's Degree or higher | 46 (92.0%) | 0 (0.0%) |
| Total | 249 (77.1%) | 0 (0.0%) |
Employment Occupations by Sex in Stratton
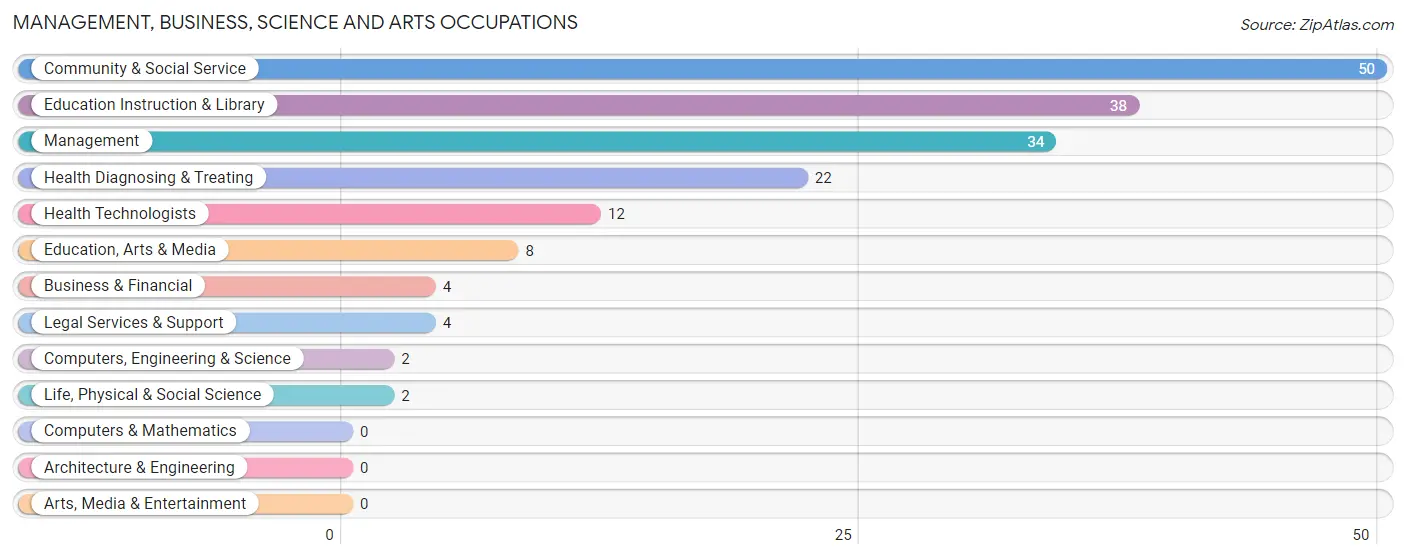
Management, Business, Science and Arts Occupations
The most common Management, Business, Science and Arts occupations in Stratton are Community & Social Service (50 | 16.1%), Education Instruction & Library (38 | 12.3%), Management (34 | 11.0%), Health Diagnosing & Treating (22 | 7.1%), and Health Technologists (12 | 3.9%).
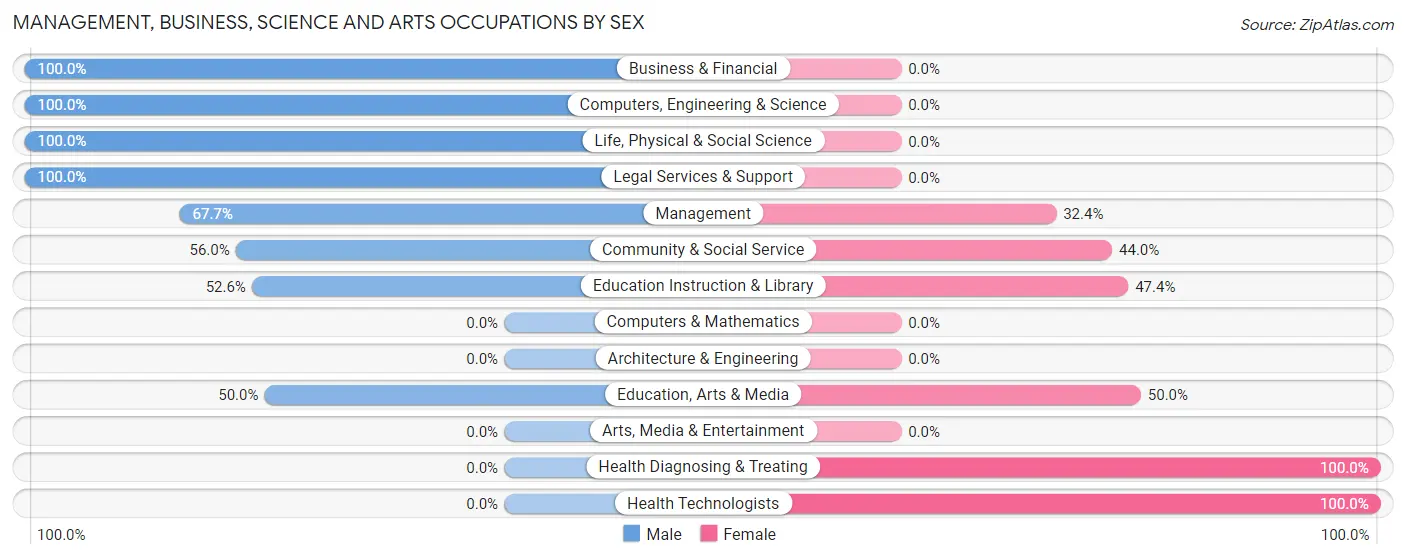
Management, Business, Science and Arts Occupations by Sex
Within the Management, Business, Science and Arts occupations in Stratton, the most male-oriented occupations are Business & Financial (100.0%), Computers, Engineering & Science (100.0%), and Life, Physical & Social Science (100.0%), while the most female-oriented occupations are Health Diagnosing & Treating (100.0%), Health Technologists (100.0%), and Education, Arts & Media (50.0%).
| Occupation | Male | Female |
| Management | 23 (67.6%) | 11 (32.4%) |
| Business & Financial | 4 (100.0%) | 0 (0.0%) |
| Computers, Engineering & Science | 2 (100.0%) | 0 (0.0%) |
| Computers & Mathematics | 0 (0.0%) | 0 (0.0%) |
| Architecture & Engineering | 0 (0.0%) | 0 (0.0%) |
| Life, Physical & Social Science | 2 (100.0%) | 0 (0.0%) |
| Community & Social Service | 28 (56.0%) | 22 (44.0%) |
| Education, Arts & Media | 4 (50.0%) | 4 (50.0%) |
| Legal Services & Support | 4 (100.0%) | 0 (0.0%) |
| Education Instruction & Library | 20 (52.6%) | 18 (47.4%) |
| Arts, Media & Entertainment | 0 (0.0%) | 0 (0.0%) |
| Health Diagnosing & Treating | 0 (0.0%) | 22 (100.0%) |
| Health Technologists | 0 (0.0%) | 12 (100.0%) |
| Total (Category) | 57 (50.9%) | 55 (49.1%) |
| Total (Overall) | 191 (61.6%) | 119 (38.4%) |
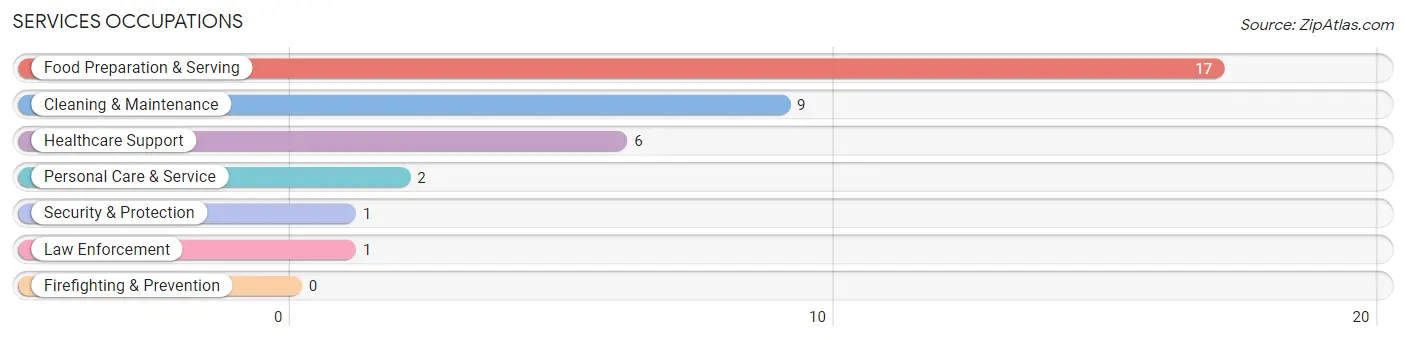
Services Occupations
The most common Services occupations in Stratton are Food Preparation & Serving (17 | 5.5%), Cleaning & Maintenance (9 | 2.9%), Healthcare Support (6 | 1.9%), Personal Care & Service (2 | 0.6%), and Security & Protection (1 | 0.3%).
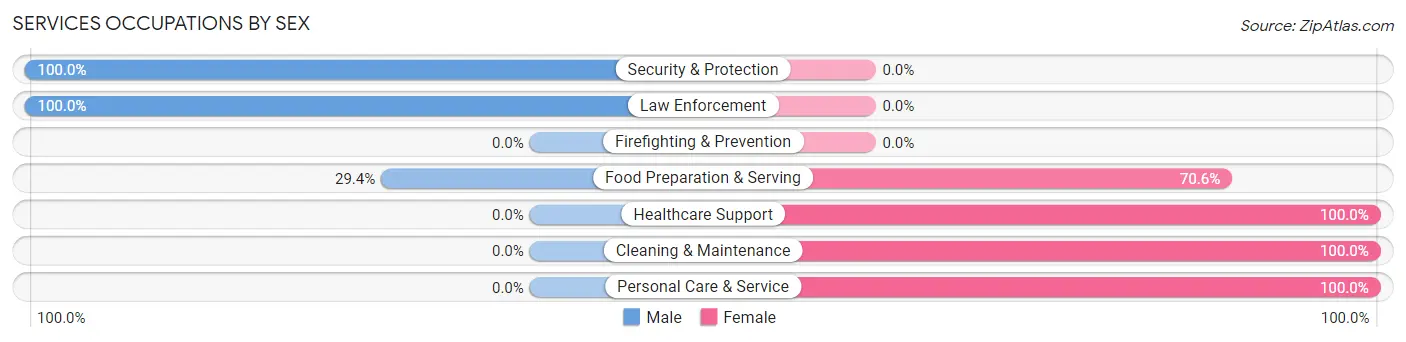
Services Occupations by Sex
Within the Services occupations in Stratton, the most male-oriented occupations are Security & Protection (100.0%), Law Enforcement (100.0%), and Food Preparation & Serving (29.4%), while the most female-oriented occupations are Healthcare Support (100.0%), Cleaning & Maintenance (100.0%), and Personal Care & Service (100.0%).
| Occupation | Male | Female |
| Healthcare Support | 0 (0.0%) | 6 (100.0%) |
| Security & Protection | 1 (100.0%) | 0 (0.0%) |
| Firefighting & Prevention | 0 (0.0%) | 0 (0.0%) |
| Law Enforcement | 1 (100.0%) | 0 (0.0%) |
| Food Preparation & Serving | 5 (29.4%) | 12 (70.6%) |
| Cleaning & Maintenance | 0 (0.0%) | 9 (100.0%) |
| Personal Care & Service | 0 (0.0%) | 2 (100.0%) |
| Total (Category) | 6 (17.1%) | 29 (82.9%) |
| Total (Overall) | 191 (61.6%) | 119 (38.4%) |
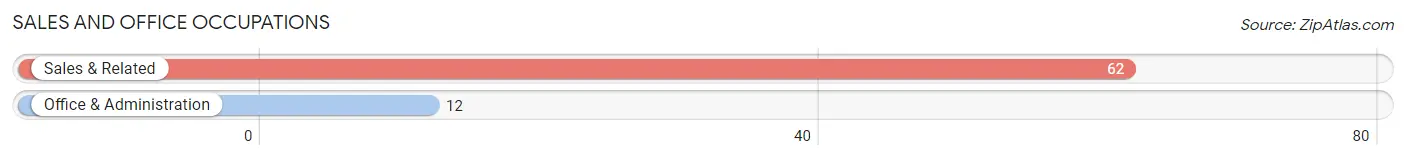
Sales and Office Occupations
The most common Sales and Office occupations in Stratton are Sales & Related (62 | 20.0%), and Office & Administration (12 | 3.9%).
Sales and Office Occupations by Sex
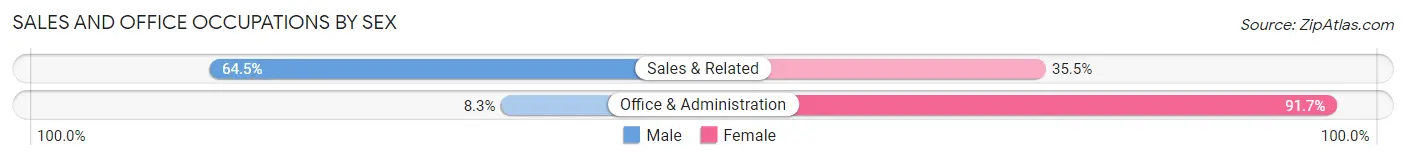
| Occupation | Male | Female |
| Sales & Related | 40 (64.5%) | 22 (35.5%) |
| Office & Administration | 1 (8.3%) | 11 (91.7%) |
| Total (Category) | 41 (55.4%) | 33 (44.6%) |
| Total (Overall) | 191 (61.6%) | 119 (38.4%) |
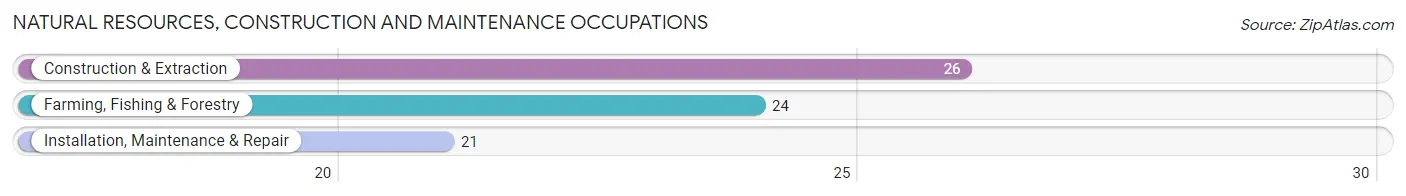
Natural Resources, Construction and Maintenance Occupations
The most common Natural Resources, Construction and Maintenance occupations in Stratton are Construction & Extraction (26 | 8.4%), Farming, Fishing & Forestry (24 | 7.7%), and Installation, Maintenance & Repair (21 | 6.8%).
Natural Resources, Construction and Maintenance Occupations by Sex
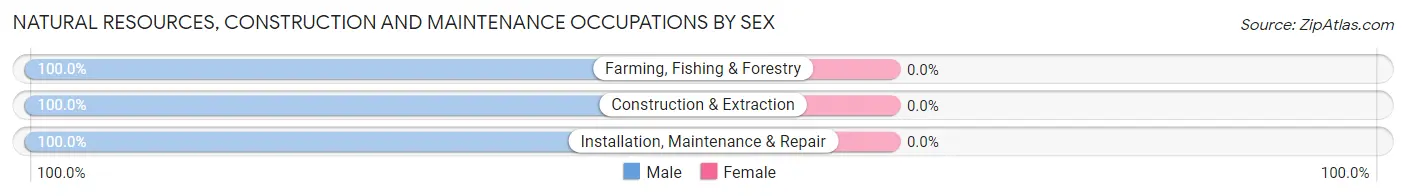
| Occupation | Male | Female |
| Farming, Fishing & Forestry | 24 (100.0%) | 0 (0.0%) |
| Construction & Extraction | 26 (100.0%) | 0 (0.0%) |
| Installation, Maintenance & Repair | 21 (100.0%) | 0 (0.0%) |
| Total (Category) | 71 (100.0%) | 0 (0.0%) |
| Total (Overall) | 191 (61.6%) | 119 (38.4%) |
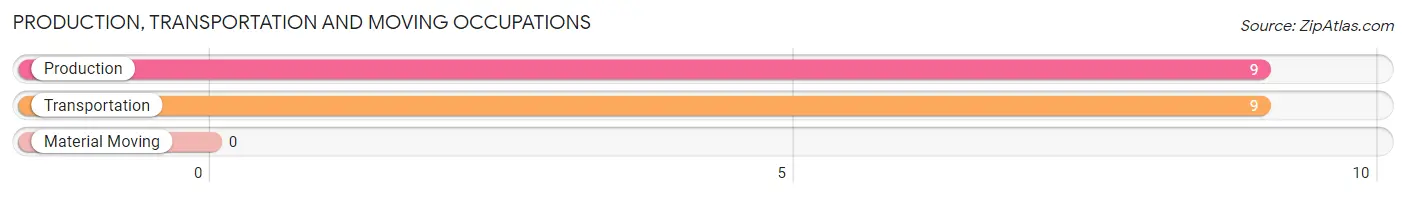
Production, Transportation and Moving Occupations
The most common Production, Transportation and Moving occupations in Stratton are Production (9 | 2.9%), and Transportation (9 | 2.9%).
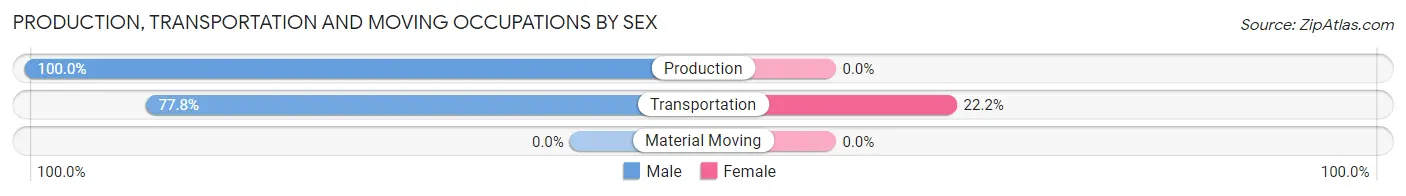
Production, Transportation and Moving Occupations by Sex
| Occupation | Male | Female |
| Production | 9 (100.0%) | 0 (0.0%) |
| Transportation | 7 (77.8%) | 2 (22.2%) |
| Material Moving | 0 (0.0%) | 0 (0.0%) |
| Total (Category) | 16 (88.9%) | 2 (11.1%) |
| Total (Overall) | 191 (61.6%) | 119 (38.4%) |
Employment Industries by Sex in Stratton
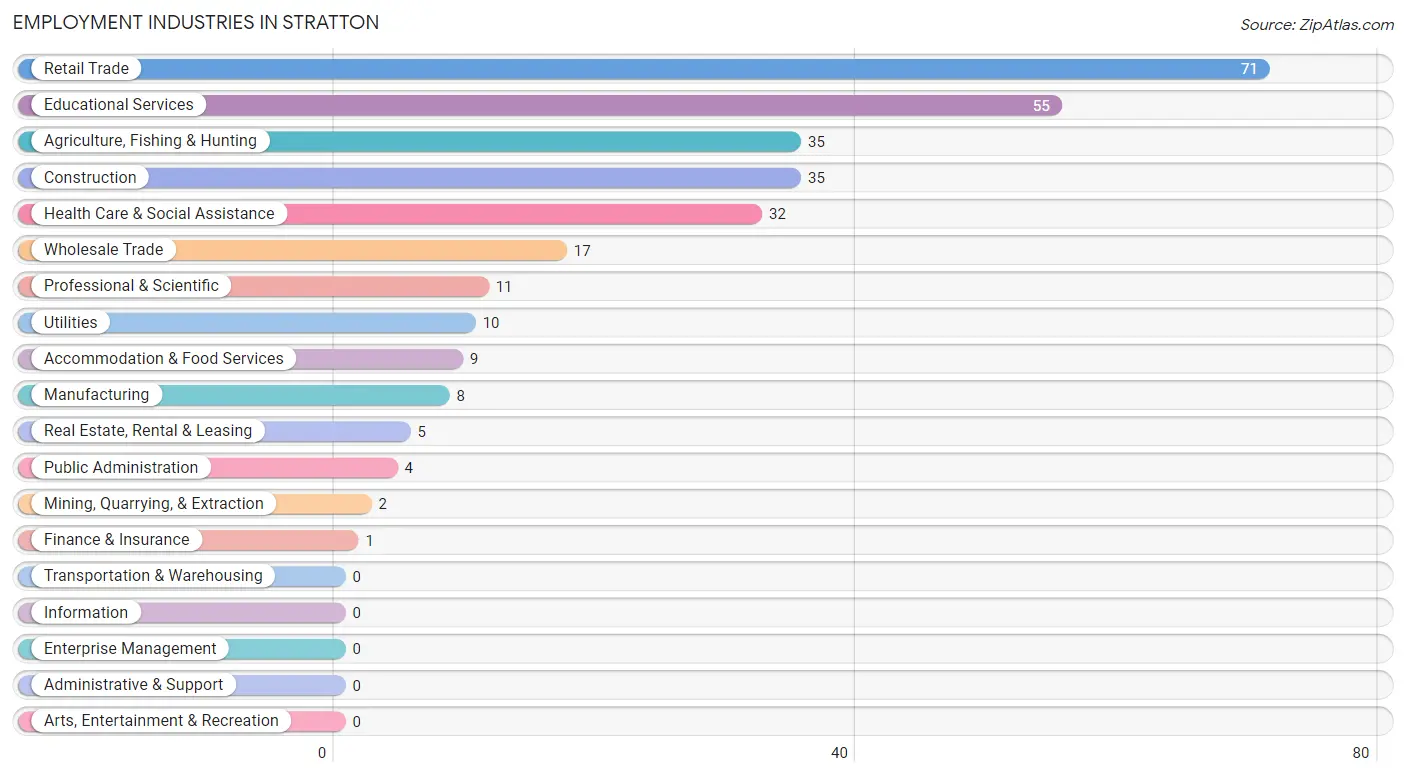
Employment Industries in Stratton
The major employment industries in Stratton include Retail Trade (71 | 22.9%), Educational Services (55 | 17.7%), Agriculture, Fishing & Hunting (35 | 11.3%), Construction (35 | 11.3%), and Health Care & Social Assistance (32 | 10.3%).
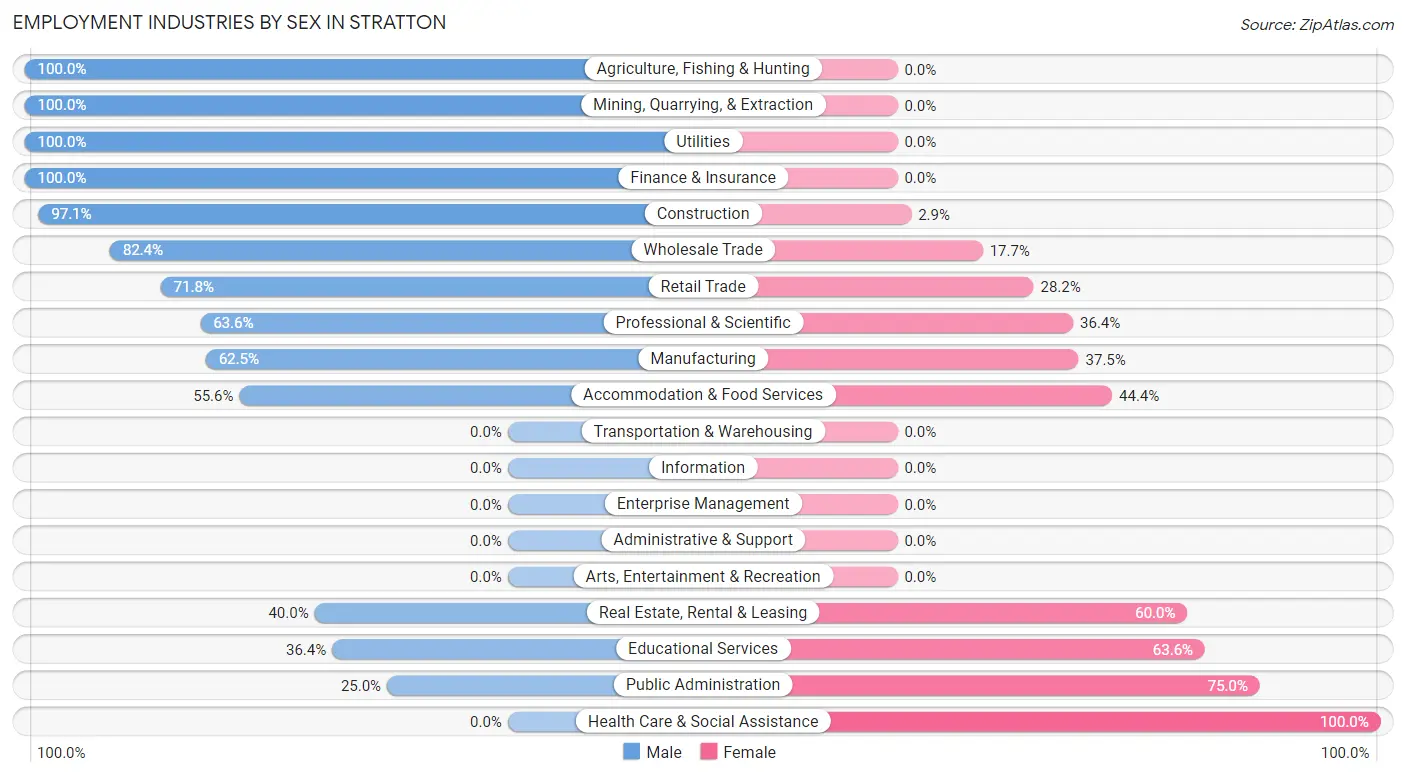
Employment Industries by Sex in Stratton
The Stratton industries that see more men than women are Agriculture, Fishing & Hunting (100.0%), Mining, Quarrying, & Extraction (100.0%), and Utilities (100.0%), whereas the industries that tend to have a higher number of women are Health Care & Social Assistance (100.0%), Public Administration (75.0%), and Educational Services (63.6%).
| Industry | Male | Female |
| Agriculture, Fishing & Hunting | 35 (100.0%) | 0 (0.0%) |
| Mining, Quarrying, & Extraction | 2 (100.0%) | 0 (0.0%) |
| Construction | 34 (97.1%) | 1 (2.9%) |
| Manufacturing | 5 (62.5%) | 3 (37.5%) |
| Wholesale Trade | 14 (82.4%) | 3 (17.6%) |
| Retail Trade | 51 (71.8%) | 20 (28.2%) |
| Transportation & Warehousing | 0 (0.0%) | 0 (0.0%) |
| Utilities | 10 (100.0%) | 0 (0.0%) |
| Information | 0 (0.0%) | 0 (0.0%) |
| Finance & Insurance | 1 (100.0%) | 0 (0.0%) |
| Real Estate, Rental & Leasing | 2 (40.0%) | 3 (60.0%) |
| Professional & Scientific | 7 (63.6%) | 4 (36.4%) |
| Enterprise Management | 0 (0.0%) | 0 (0.0%) |
| Administrative & Support | 0 (0.0%) | 0 (0.0%) |
| Educational Services | 20 (36.4%) | 35 (63.6%) |
| Health Care & Social Assistance | 0 (0.0%) | 32 (100.0%) |
| Arts, Entertainment & Recreation | 0 (0.0%) | 0 (0.0%) |
| Accommodation & Food Services | 5 (55.6%) | 4 (44.4%) |
| Public Administration | 1 (25.0%) | 3 (75.0%) |
| Total | 191 (61.6%) | 119 (38.4%) |
Education in Stratton
School Enrollment in Stratton
The most common levels of schooling among the 137 students in Stratton are middle school (49 | 35.8%), elementary school (36 | 26.3%), and nursery / preschool (17 | 12.4%).
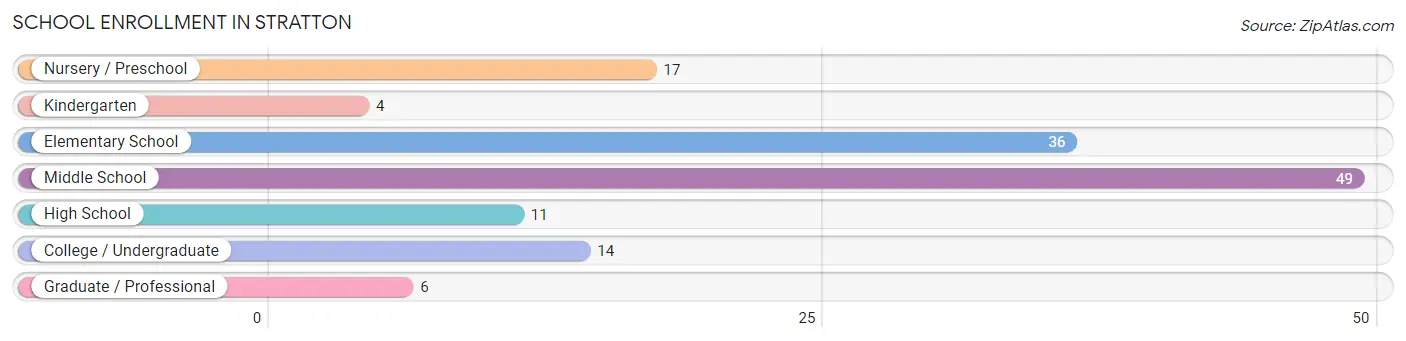
| School Level | # Students | % Students |
| Nursery / Preschool | 17 | 12.4% |
| Kindergarten | 4 | 2.9% |
| Elementary School | 36 | 26.3% |
| Middle School | 49 | 35.8% |
| High School | 11 | 8.0% |
| College / Undergraduate | 14 | 10.2% |
| Graduate / Professional | 6 | 4.4% |
| Total | 137 | 100.0% |
School Enrollment by Age by Funding Source in Stratton
Out of a total of 137 students who are enrolled in schools in Stratton, 7 (5.1%) attend a private institution, while the remaining 130 (94.9%) are enrolled in public schools. The age group of 35 years and over has the highest likelihood of being enrolled in private schools, with 6 (60.0% in the age bracket) enrolled. Conversely, the age group of 3 to 4 year olds has the lowest likelihood of being enrolled in a private school, with 5 (100.0% in the age bracket) attending a public institution.
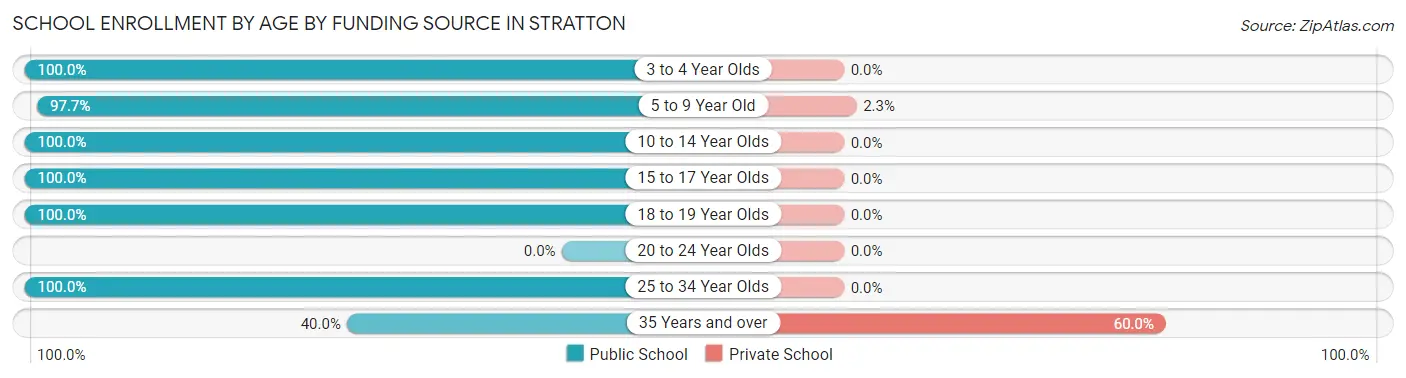
| Age Bracket | Public School | Private School |
| 3 to 4 Year Olds | 5 (100.0%) | 0 (0.0%) |
| 5 to 9 Year Old | 42 (97.7%) | 1 (2.3%) |
| 10 to 14 Year Olds | 60 (100.0%) | 0 (0.0%) |
| 15 to 17 Year Olds | 9 (100.0%) | 0 (0.0%) |
| 18 to 19 Year Olds | 2 (100.0%) | 0 (0.0%) |
| 20 to 24 Year Olds | 0 (0.0%) | 0 (0.0%) |
| 25 to 34 Year Olds | 8 (100.0%) | 0 (0.0%) |
| 35 Years and over | 4 (40.0%) | 6 (60.0%) |
| Total | 130 (94.9%) | 7 (5.1%) |
Educational Attainment by Field of Study in Stratton
Visual & performing arts (18 | 20.0%), social sciences (16 | 17.8%), engineering (15 | 16.7%), education (12 | 13.3%), and arts & humanities (6 | 6.7%) are the most common fields of study among 90 individuals in Stratton who have obtained a bachelor's degree or higher.
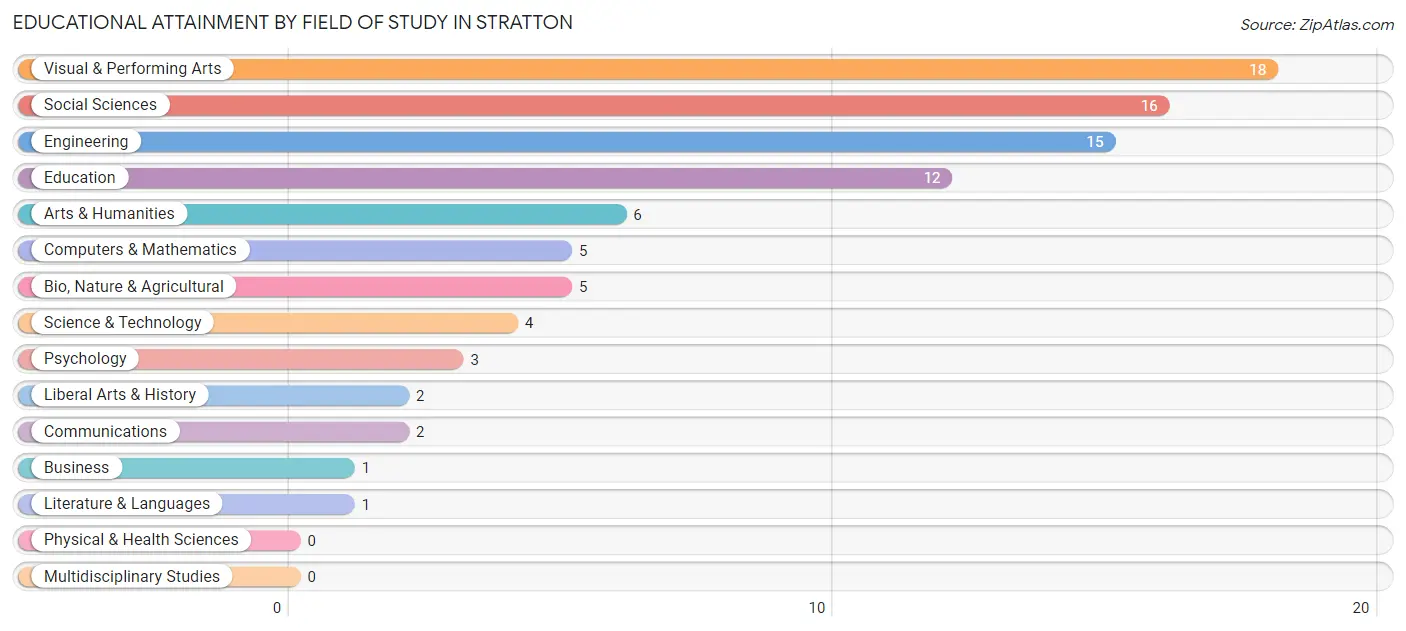
| Field of Study | # Graduates | % Graduates |
| Computers & Mathematics | 5 | 5.6% |
| Bio, Nature & Agricultural | 5 | 5.6% |
| Physical & Health Sciences | 0 | 0.0% |
| Psychology | 3 | 3.3% |
| Social Sciences | 16 | 17.8% |
| Engineering | 15 | 16.7% |
| Multidisciplinary Studies | 0 | 0.0% |
| Science & Technology | 4 | 4.4% |
| Business | 1 | 1.1% |
| Education | 12 | 13.3% |
| Literature & Languages | 1 | 1.1% |
| Liberal Arts & History | 2 | 2.2% |
| Visual & Performing Arts | 18 | 20.0% |
| Communications | 2 | 2.2% |
| Arts & Humanities | 6 | 6.7% |
| Total | 90 | 100.0% |
Transportation & Commute in Stratton
Vehicle Availability by Sex in Stratton
The most prevalent vehicle ownership categories in Stratton are males with 3 vehicles (63, accounting for 33.0%) and females with 3 vehicles (21, making up 55.7%).
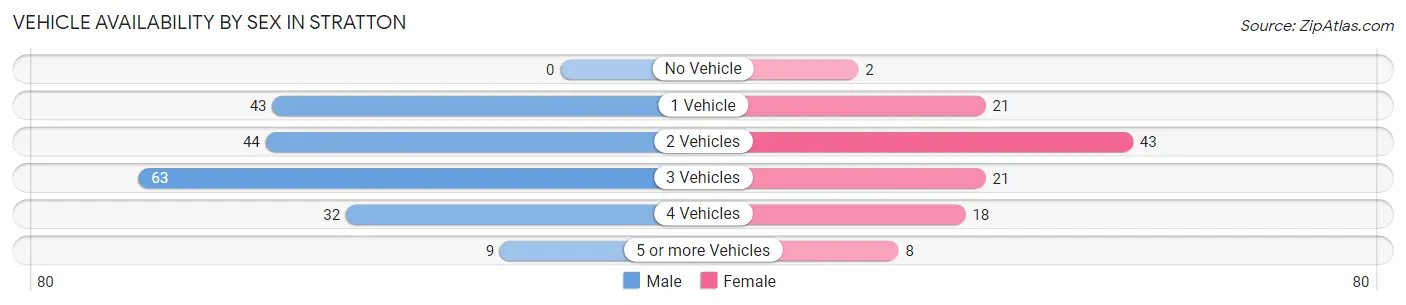
| Vehicles Available | Male | Female |
| No Vehicle | 0 (0.0%) | 2 (1.8%) |
| 1 Vehicle | 43 (22.5%) | 21 (18.6%) |
| 2 Vehicles | 44 (23.0%) | 43 (38.1%) |
| 3 Vehicles | 63 (33.0%) | 21 (18.6%) |
| 4 Vehicles | 32 (16.8%) | 18 (15.9%) |
| 5 or more Vehicles | 9 (4.7%) | 8 (7.1%) |
| Total | 191 (100.0%) | 113 (100.0%) |
Commute Time in Stratton
The most frequently occuring commute durations in Stratton are less than 5 minutes (92 commuters, 31.7%), 10 to 14 minutes (39 commuters, 13.5%), and 5 to 9 minutes (34 commuters, 11.7%).
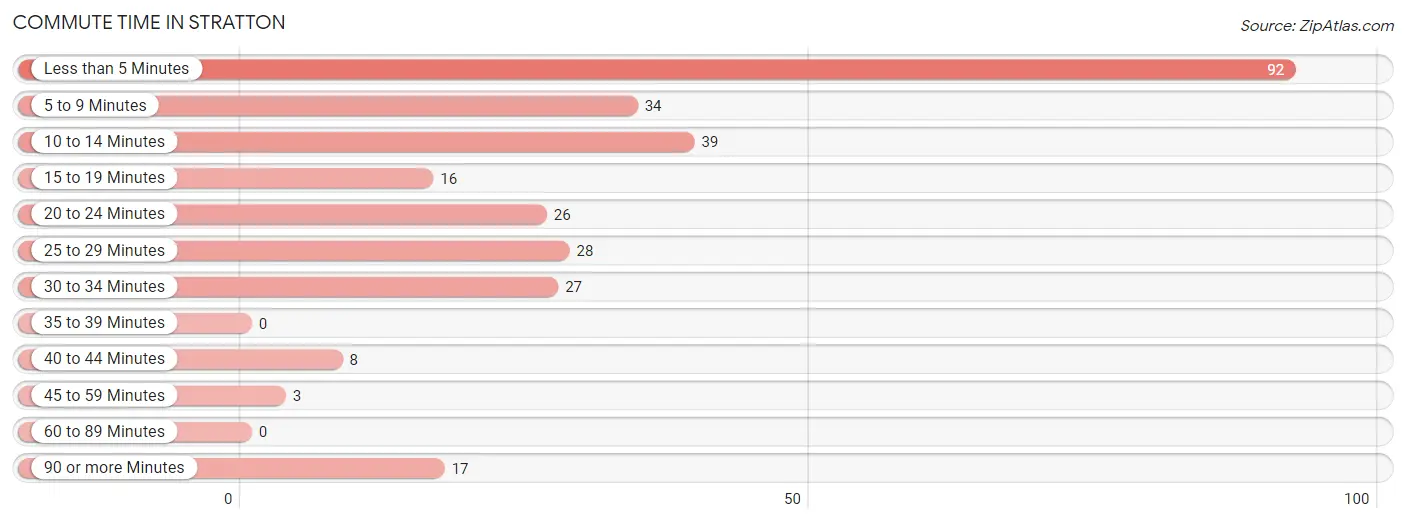
| Commute Time | # Commuters | % Commuters |
| Less than 5 Minutes | 92 | 31.7% |
| 5 to 9 Minutes | 34 | 11.7% |
| 10 to 14 Minutes | 39 | 13.5% |
| 15 to 19 Minutes | 16 | 5.5% |
| 20 to 24 Minutes | 26 | 9.0% |
| 25 to 29 Minutes | 28 | 9.7% |
| 30 to 34 Minutes | 27 | 9.3% |
| 35 to 39 Minutes | 0 | 0.0% |
| 40 to 44 Minutes | 8 | 2.8% |
| 45 to 59 Minutes | 3 | 1.0% |
| 60 to 89 Minutes | 0 | 0.0% |
| 90 or more Minutes | 17 | 5.9% |
Commute Time by Sex in Stratton
The most common commute times in Stratton are less than 5 minutes (47 commuters, 26.3%) for males and less than 5 minutes (45 commuters, 40.5%) for females.
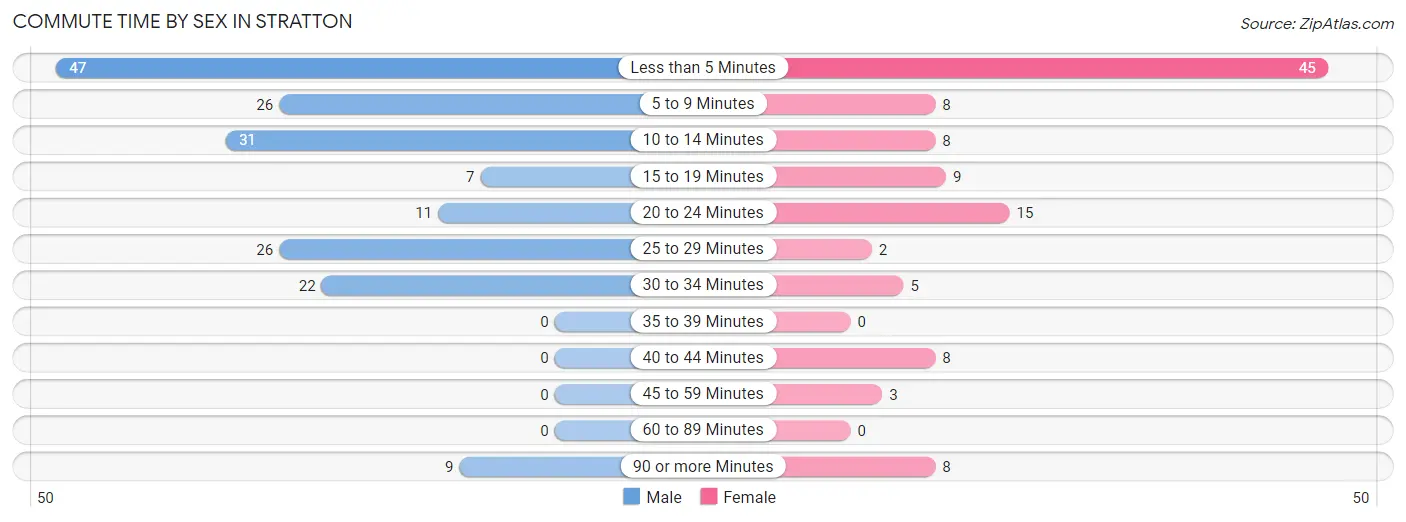
| Commute Time | Male | Female |
| Less than 5 Minutes | 47 (26.3%) | 45 (40.5%) |
| 5 to 9 Minutes | 26 (14.5%) | 8 (7.2%) |
| 10 to 14 Minutes | 31 (17.3%) | 8 (7.2%) |
| 15 to 19 Minutes | 7 (3.9%) | 9 (8.1%) |
| 20 to 24 Minutes | 11 (6.1%) | 15 (13.5%) |
| 25 to 29 Minutes | 26 (14.5%) | 2 (1.8%) |
| 30 to 34 Minutes | 22 (12.3%) | 5 (4.5%) |
| 35 to 39 Minutes | 0 (0.0%) | 0 (0.0%) |
| 40 to 44 Minutes | 0 (0.0%) | 8 (7.2%) |
| 45 to 59 Minutes | 0 (0.0%) | 3 (2.7%) |
| 60 to 89 Minutes | 0 (0.0%) | 0 (0.0%) |
| 90 or more Minutes | 9 (5.0%) | 8 (7.2%) |
Time of Departure to Work by Sex in Stratton
The most frequent times of departure to work in Stratton are 6:30 AM to 6:59 AM (58, 32.4%) for males and 7:00 AM to 7:29 AM (32, 28.8%) for females.
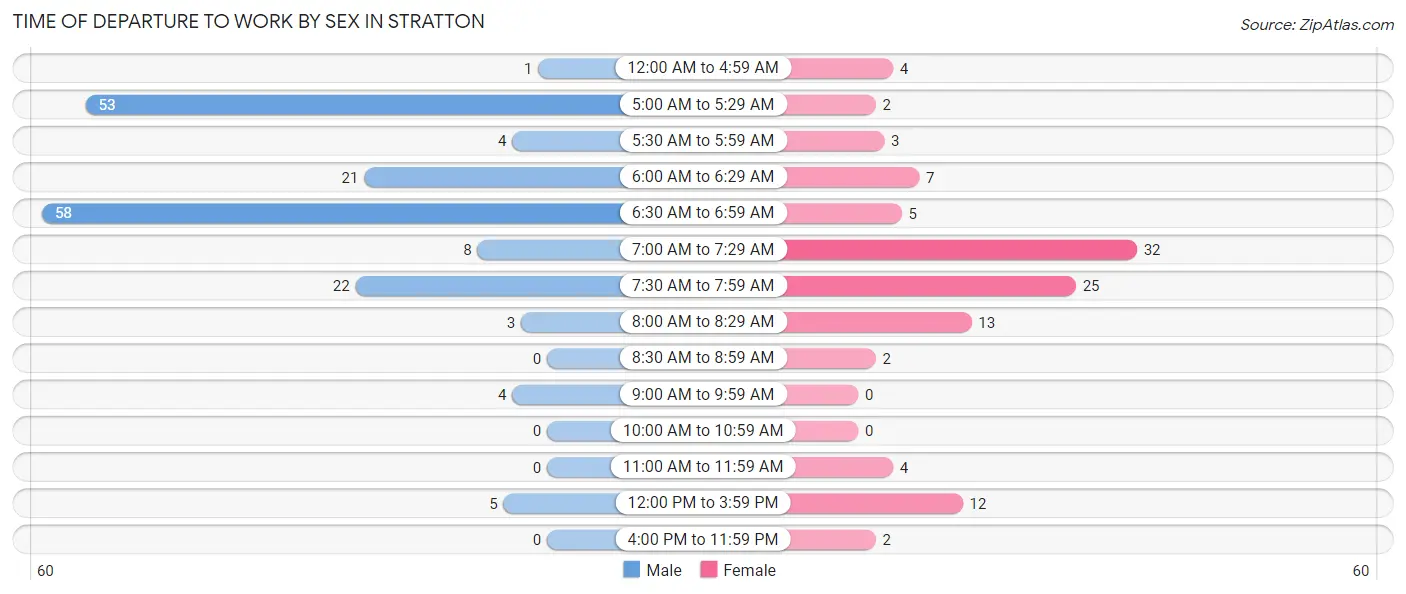
| Time of Departure | Male | Female |
| 12:00 AM to 4:59 AM | 1 (0.6%) | 4 (3.6%) |
| 5:00 AM to 5:29 AM | 53 (29.6%) | 2 (1.8%) |
| 5:30 AM to 5:59 AM | 4 (2.2%) | 3 (2.7%) |
| 6:00 AM to 6:29 AM | 21 (11.7%) | 7 (6.3%) |
| 6:30 AM to 6:59 AM | 58 (32.4%) | 5 (4.5%) |
| 7:00 AM to 7:29 AM | 8 (4.5%) | 32 (28.8%) |
| 7:30 AM to 7:59 AM | 22 (12.3%) | 25 (22.5%) |
| 8:00 AM to 8:29 AM | 3 (1.7%) | 13 (11.7%) |
| 8:30 AM to 8:59 AM | 0 (0.0%) | 2 (1.8%) |
| 9:00 AM to 9:59 AM | 4 (2.2%) | 0 (0.0%) |
| 10:00 AM to 10:59 AM | 0 (0.0%) | 0 (0.0%) |
| 11:00 AM to 11:59 AM | 0 (0.0%) | 4 (3.6%) |
| 12:00 PM to 3:59 PM | 5 (2.8%) | 12 (10.8%) |
| 4:00 PM to 11:59 PM | 0 (0.0%) | 2 (1.8%) |
| Total | 179 (100.0%) | 111 (100.0%) |
Housing Occupancy in Stratton
Occupancy by Ownership in Stratton
Of the total 251 dwellings in Stratton, owner-occupied units account for 166 (66.1%), while renter-occupied units make up 85 (33.9%).
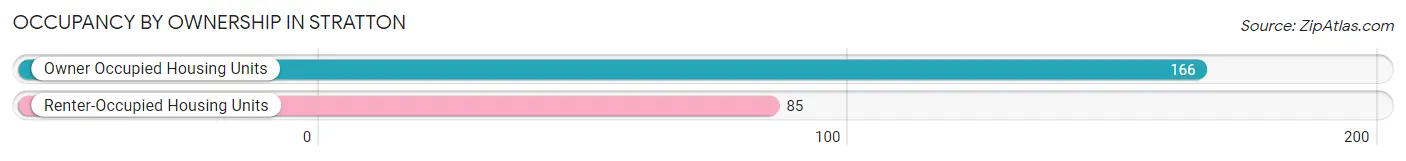
| Occupancy | # Housing Units | % Housing Units |
| Owner Occupied Housing Units | 166 | 66.1% |
| Renter-Occupied Housing Units | 85 | 33.9% |
| Total Occupied Housing Units | 251 | 100.0% |
Occupancy by Household Size in Stratton
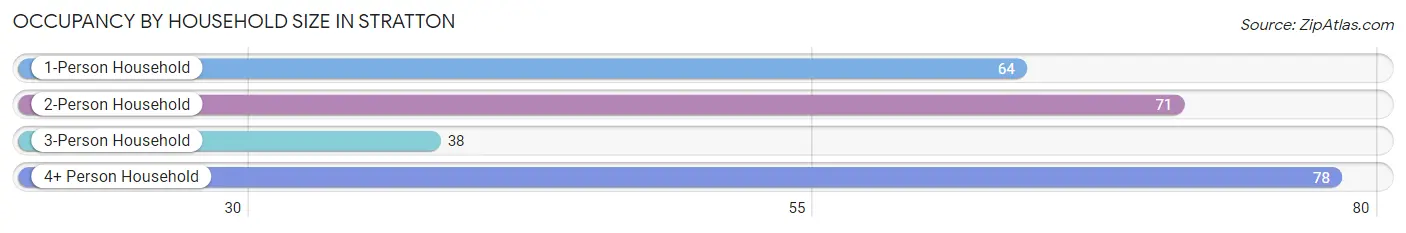
| Household Size | # Housing Units | % Housing Units |
| 1-Person Household | 64 | 25.5% |
| 2-Person Household | 71 | 28.3% |
| 3-Person Household | 38 | 15.1% |
| 4+ Person Household | 78 | 31.1% |
| Total Housing Units | 251 | 100.0% |
Occupancy by Ownership by Household Size in Stratton
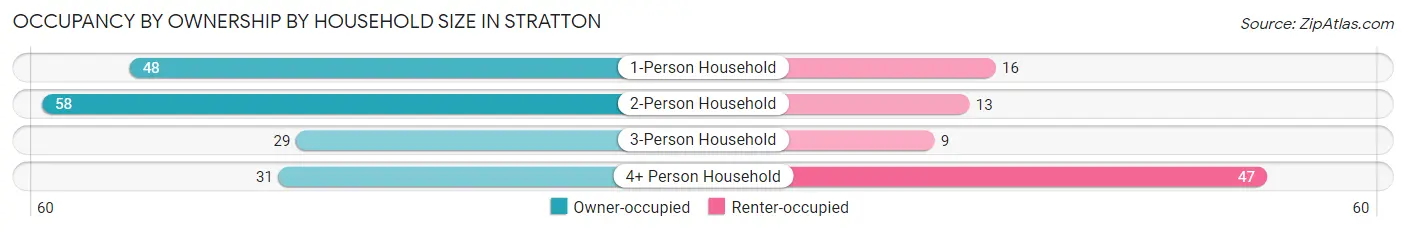
| Household Size | Owner-occupied | Renter-occupied |
| 1-Person Household | 48 (75.0%) | 16 (25.0%) |
| 2-Person Household | 58 (81.7%) | 13 (18.3%) |
| 3-Person Household | 29 (76.3%) | 9 (23.7%) |
| 4+ Person Household | 31 (39.7%) | 47 (60.3%) |
| Total Housing Units | 166 (66.1%) | 85 (33.9%) |
Occupancy by Educational Attainment in Stratton
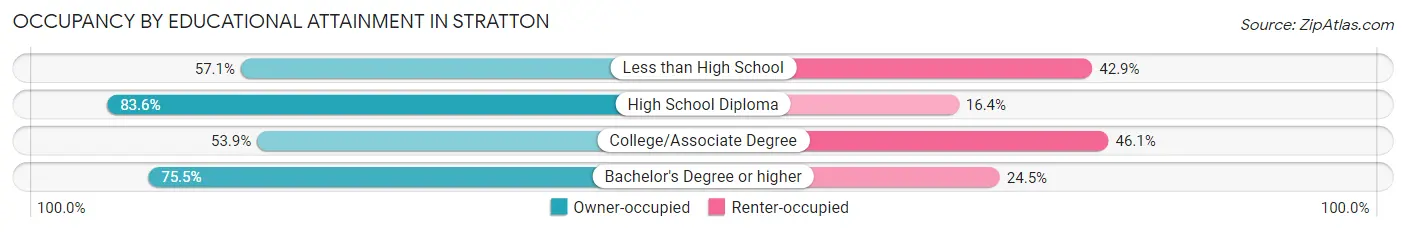
| Household Size | Owner-occupied | Renter-occupied |
| Less than High School | 20 (57.1%) | 15 (42.9%) |
| High School Diploma | 51 (83.6%) | 10 (16.4%) |
| College/Associate Degree | 55 (53.9%) | 47 (46.1%) |
| Bachelor's Degree or higher | 40 (75.5%) | 13 (24.5%) |
Occupancy by Age of Householder in Stratton
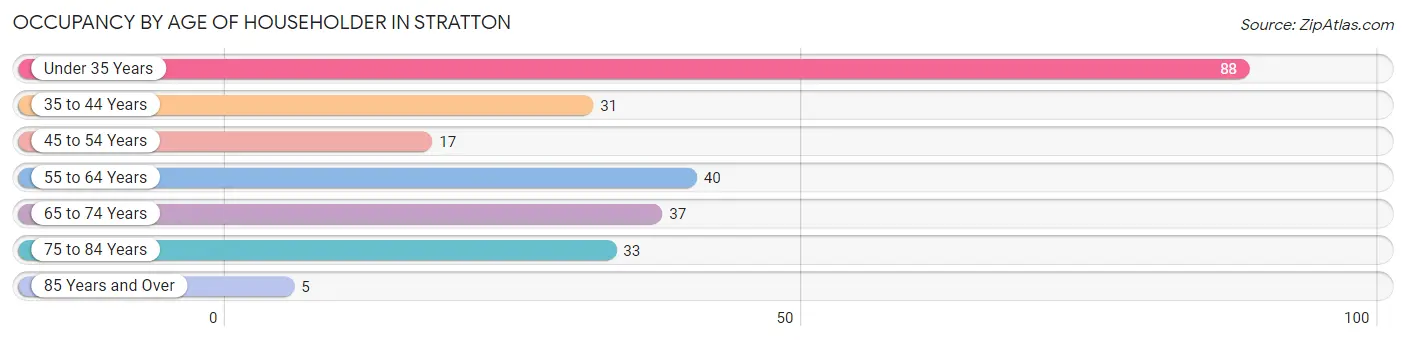
| Age Bracket | # Households | % Households |
| Under 35 Years | 88 | 35.1% |
| 35 to 44 Years | 31 | 12.3% |
| 45 to 54 Years | 17 | 6.8% |
| 55 to 64 Years | 40 | 15.9% |
| 65 to 74 Years | 37 | 14.7% |
| 75 to 84 Years | 33 | 13.2% |
| 85 Years and Over | 5 | 2.0% |
| Total | 251 | 100.0% |
Housing Finances in Stratton
Median Income by Occupancy in Stratton
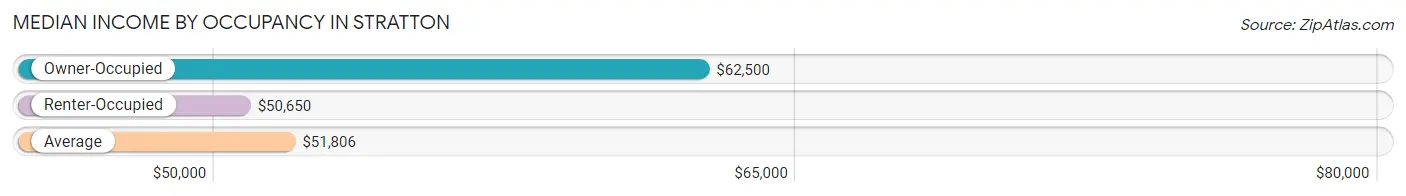
| Occupancy Type | # Households | Median Income |
| Owner-Occupied | 166 (66.1%) | $62,500 |
| Renter-Occupied | 85 (33.9%) | $50,650 |
| Average | 251 (100.0%) | $51,806 |
Occupancy by Householder Income Bracket in Stratton
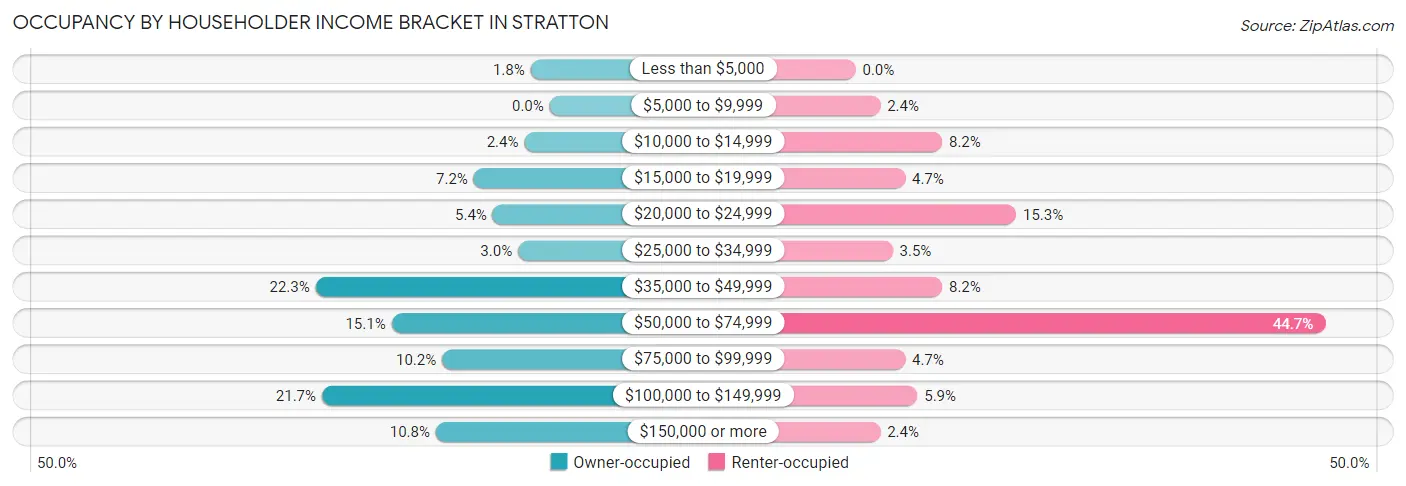
| Income Bracket | Owner-occupied | Renter-occupied |
| Less than $5,000 | 3 (1.8%) | 0 (0.0%) |
| $5,000 to $9,999 | 0 (0.0%) | 2 (2.4%) |
| $10,000 to $14,999 | 4 (2.4%) | 7 (8.2%) |
| $15,000 to $19,999 | 12 (7.2%) | 4 (4.7%) |
| $20,000 to $24,999 | 9 (5.4%) | 13 (15.3%) |
| $25,000 to $34,999 | 5 (3.0%) | 3 (3.5%) |
| $35,000 to $49,999 | 37 (22.3%) | 7 (8.2%) |
| $50,000 to $74,999 | 25 (15.1%) | 38 (44.7%) |
| $75,000 to $99,999 | 17 (10.2%) | 4 (4.7%) |
| $100,000 to $149,999 | 36 (21.7%) | 5 (5.9%) |
| $150,000 or more | 18 (10.8%) | 2 (2.4%) |
| Total | 166 (100.0%) | 85 (100.0%) |
Monthly Housing Cost Tiers in Stratton
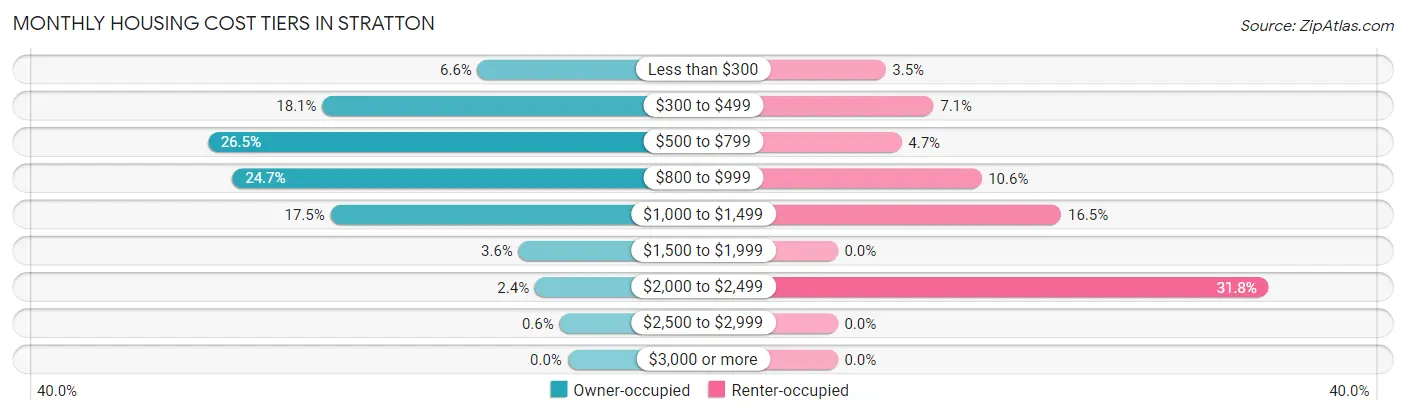
| Monthly Cost | Owner-occupied | Renter-occupied |
| Less than $300 | 11 (6.6%) | 3 (3.5%) |
| $300 to $499 | 30 (18.1%) | 6 (7.1%) |
| $500 to $799 | 44 (26.5%) | 4 (4.7%) |
| $800 to $999 | 41 (24.7%) | 9 (10.6%) |
| $1,000 to $1,499 | 29 (17.5%) | 14 (16.5%) |
| $1,500 to $1,999 | 6 (3.6%) | 0 (0.0%) |
| $2,000 to $2,499 | 4 (2.4%) | 27 (31.8%) |
| $2,500 to $2,999 | 1 (0.6%) | 0 (0.0%) |
| $3,000 or more | 0 (0.0%) | 0 (0.0%) |
| Total | 166 (100.0%) | 85 (100.0%) |
Physical Housing Characteristics in Stratton
Housing Structures in Stratton
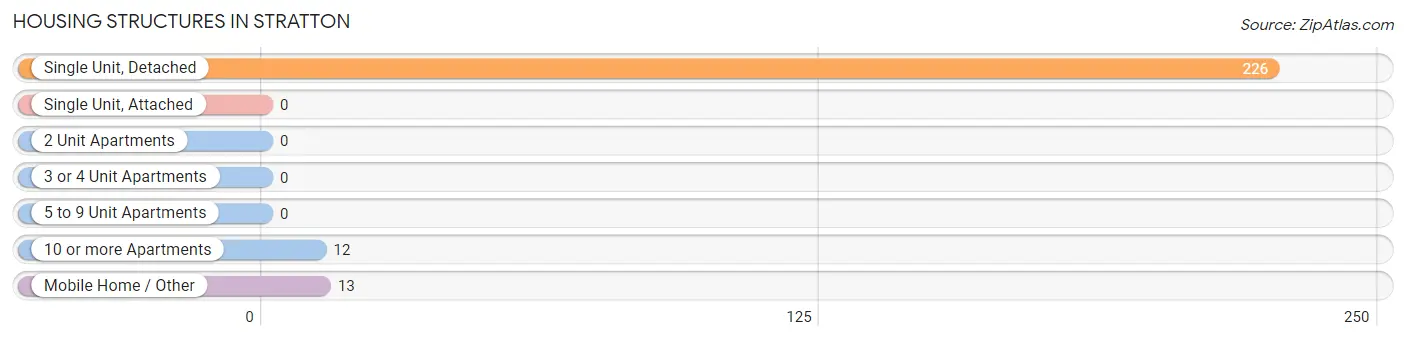
| Structure Type | # Housing Units | % Housing Units |
| Single Unit, Detached | 226 | 90.0% |
| Single Unit, Attached | 0 | 0.0% |
| 2 Unit Apartments | 0 | 0.0% |
| 3 or 4 Unit Apartments | 0 | 0.0% |
| 5 to 9 Unit Apartments | 0 | 0.0% |
| 10 or more Apartments | 12 | 4.8% |
| Mobile Home / Other | 13 | 5.2% |
| Total | 251 | 100.0% |
Housing Structures by Occupancy in Stratton
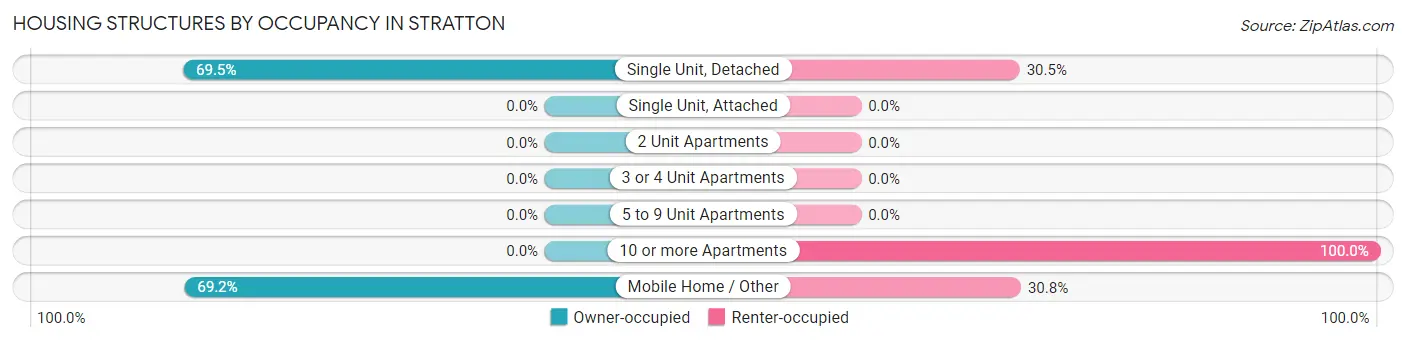
| Structure Type | Owner-occupied | Renter-occupied |
| Single Unit, Detached | 157 (69.5%) | 69 (30.5%) |
| Single Unit, Attached | 0 (0.0%) | 0 (0.0%) |
| 2 Unit Apartments | 0 (0.0%) | 0 (0.0%) |
| 3 or 4 Unit Apartments | 0 (0.0%) | 0 (0.0%) |
| 5 to 9 Unit Apartments | 0 (0.0%) | 0 (0.0%) |
| 10 or more Apartments | 0 (0.0%) | 12 (100.0%) |
| Mobile Home / Other | 9 (69.2%) | 4 (30.8%) |
| Total | 166 (66.1%) | 85 (33.9%) |
Housing Structures by Number of Rooms in Stratton
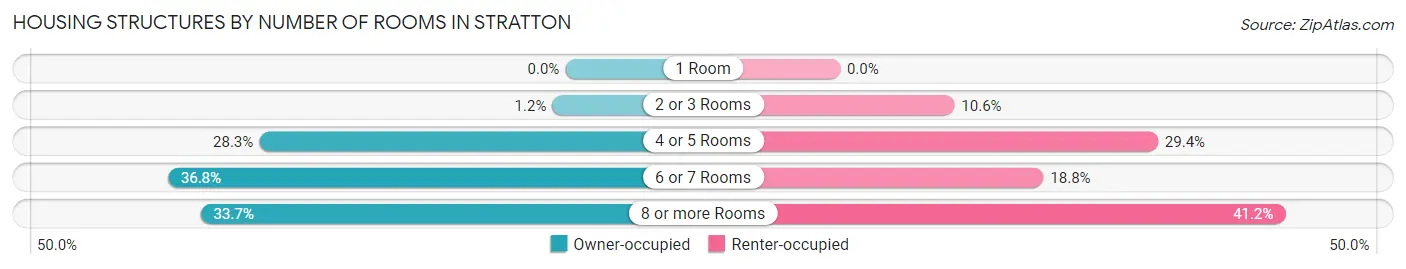
| Number of Rooms | Owner-occupied | Renter-occupied |
| 1 Room | 0 (0.0%) | 0 (0.0%) |
| 2 or 3 Rooms | 2 (1.2%) | 9 (10.6%) |
| 4 or 5 Rooms | 47 (28.3%) | 25 (29.4%) |
| 6 or 7 Rooms | 61 (36.7%) | 16 (18.8%) |
| 8 or more Rooms | 56 (33.7%) | 35 (41.2%) |
| Total | 166 (100.0%) | 85 (100.0%) |
Housing Structure by Heating Type in Stratton
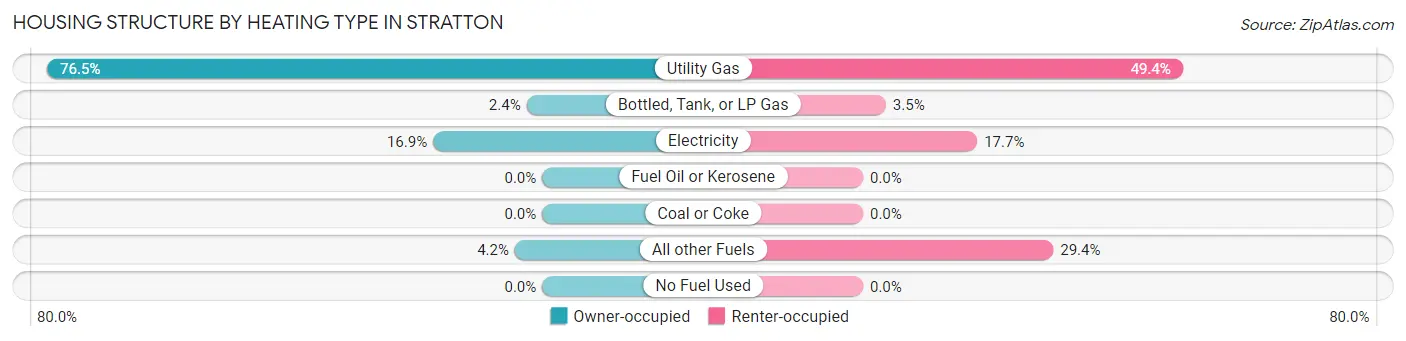
| Heating Type | Owner-occupied | Renter-occupied |
| Utility Gas | 127 (76.5%) | 42 (49.4%) |
| Bottled, Tank, or LP Gas | 4 (2.4%) | 3 (3.5%) |
| Electricity | 28 (16.9%) | 15 (17.6%) |
| Fuel Oil or Kerosene | 0 (0.0%) | 0 (0.0%) |
| Coal or Coke | 0 (0.0%) | 0 (0.0%) |
| All other Fuels | 7 (4.2%) | 25 (29.4%) |
| No Fuel Used | 0 (0.0%) | 0 (0.0%) |
| Total | 166 (100.0%) | 85 (100.0%) |
Household Vehicle Usage in Stratton
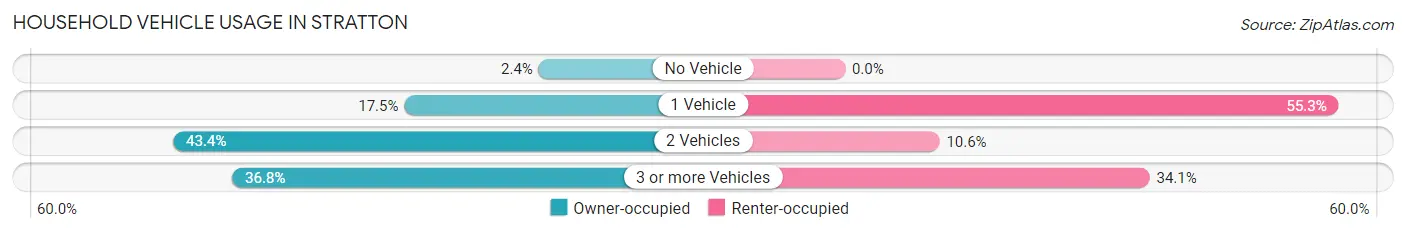
| Vehicles per Household | Owner-occupied | Renter-occupied |
| No Vehicle | 4 (2.4%) | 0 (0.0%) |
| 1 Vehicle | 29 (17.5%) | 47 (55.3%) |
| 2 Vehicles | 72 (43.4%) | 9 (10.6%) |
| 3 or more Vehicles | 61 (36.7%) | 29 (34.1%) |
| Total | 166 (100.0%) | 85 (100.0%) |
Real Estate & Mortgages in Stratton
Real Estate and Mortgage Overview in Stratton
| Characteristic | Without Mortgage | With Mortgage |
| Housing Units | 72 | 94 |
| Median Property Value | $167,500 | $134,100 |
| Median Household Income | $46,250 | $11 |
| Monthly Housing Costs | $462 | $0 |
| Real Estate Taxes | $664 | $6 |
Property Value by Mortgage Status in Stratton
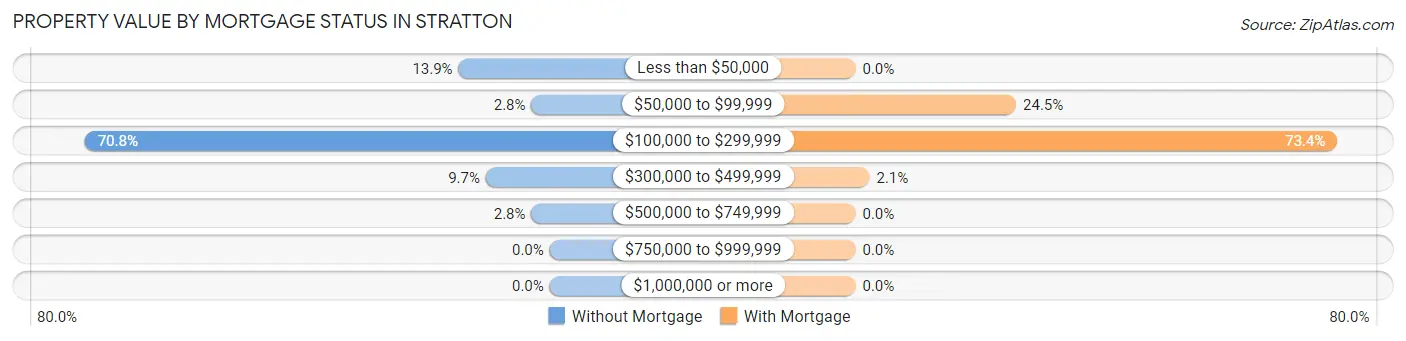
| Property Value | Without Mortgage | With Mortgage |
| Less than $50,000 | 10 (13.9%) | 0 (0.0%) |
| $50,000 to $99,999 | 2 (2.8%) | 23 (24.5%) |
| $100,000 to $299,999 | 51 (70.8%) | 69 (73.4%) |
| $300,000 to $499,999 | 7 (9.7%) | 2 (2.1%) |
| $500,000 to $749,999 | 2 (2.8%) | 0 (0.0%) |
| $750,000 to $999,999 | 0 (0.0%) | 0 (0.0%) |
| $1,000,000 or more | 0 (0.0%) | 0 (0.0%) |
| Total | 72 (100.0%) | 94 (100.0%) |
Household Income by Mortgage Status in Stratton
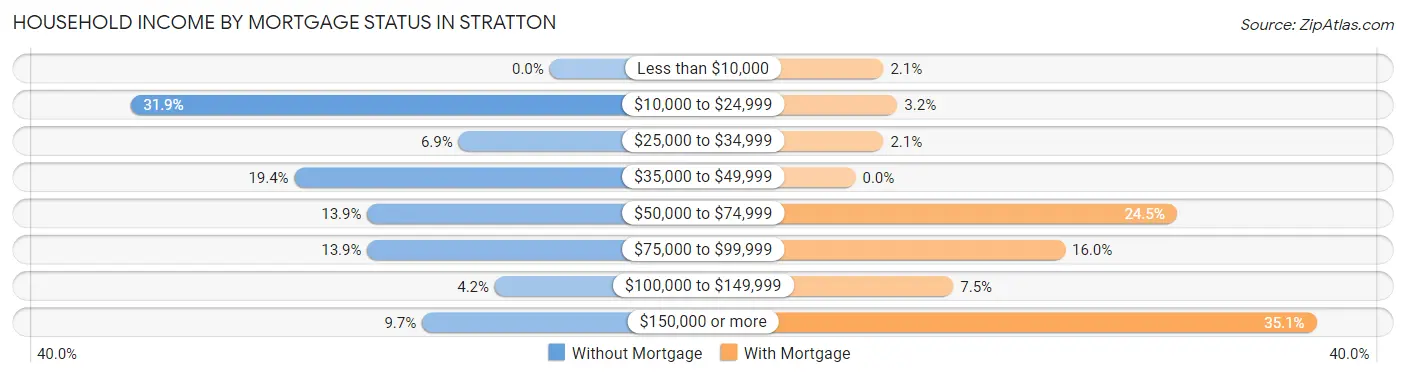
| Household Income | Without Mortgage | With Mortgage |
| Less than $10,000 | 0 (0.0%) | 2 (2.1%) |
| $10,000 to $24,999 | 23 (31.9%) | 3 (3.2%) |
| $25,000 to $34,999 | 5 (6.9%) | 2 (2.1%) |
| $35,000 to $49,999 | 14 (19.4%) | 0 (0.0%) |
| $50,000 to $74,999 | 10 (13.9%) | 23 (24.5%) |
| $75,000 to $99,999 | 10 (13.9%) | 15 (16.0%) |
| $100,000 to $149,999 | 3 (4.2%) | 7 (7.4%) |
| $150,000 or more | 7 (9.7%) | 33 (35.1%) |
| Total | 72 (100.0%) | 94 (100.0%) |
Property Value to Household Income Ratio in Stratton
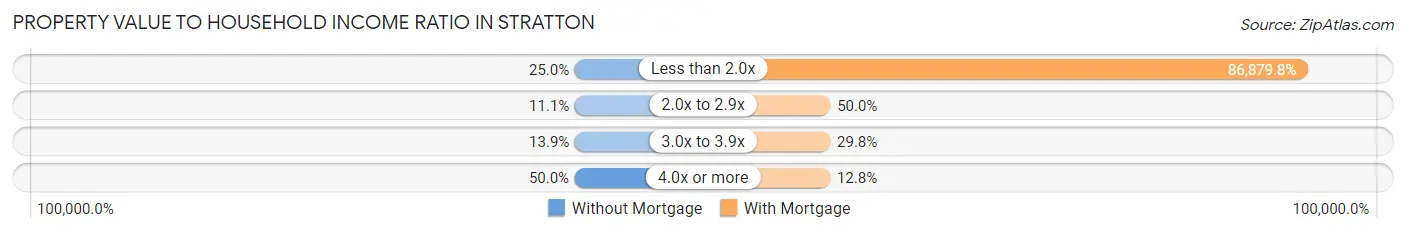
| Value-to-Income Ratio | Without Mortgage | With Mortgage |
| Less than 2.0x | 18 (25.0%) | 81,667 (86,879.8%) |
| 2.0x to 2.9x | 8 (11.1%) | 47 (50.0%) |
| 3.0x to 3.9x | 10 (13.9%) | 28 (29.8%) |
| 4.0x or more | 36 (50.0%) | 12 (12.8%) |
| Total | 72 (100.0%) | 94 (100.0%) |
Real Estate Taxes by Mortgage Status in Stratton
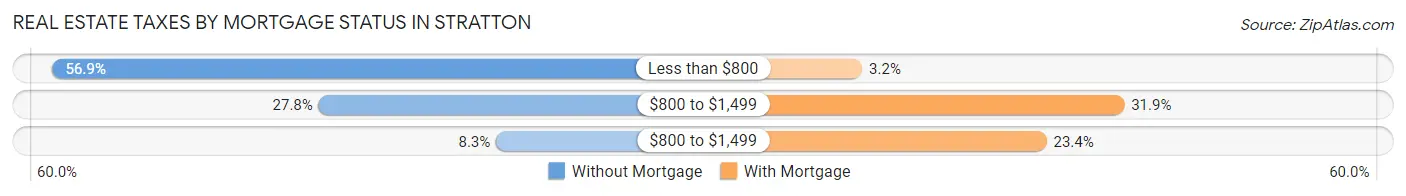
| Property Taxes | Without Mortgage | With Mortgage |
| Less than $800 | 41 (56.9%) | 3 (3.2%) |
| $800 to $1,499 | 20 (27.8%) | 30 (31.9%) |
| $800 to $1,499 | 6 (8.3%) | 22 (23.4%) |
| Total | 72 (100.0%) | 94 (100.0%) |
Health & Disability in Stratton
Health Insurance Coverage by Age in Stratton
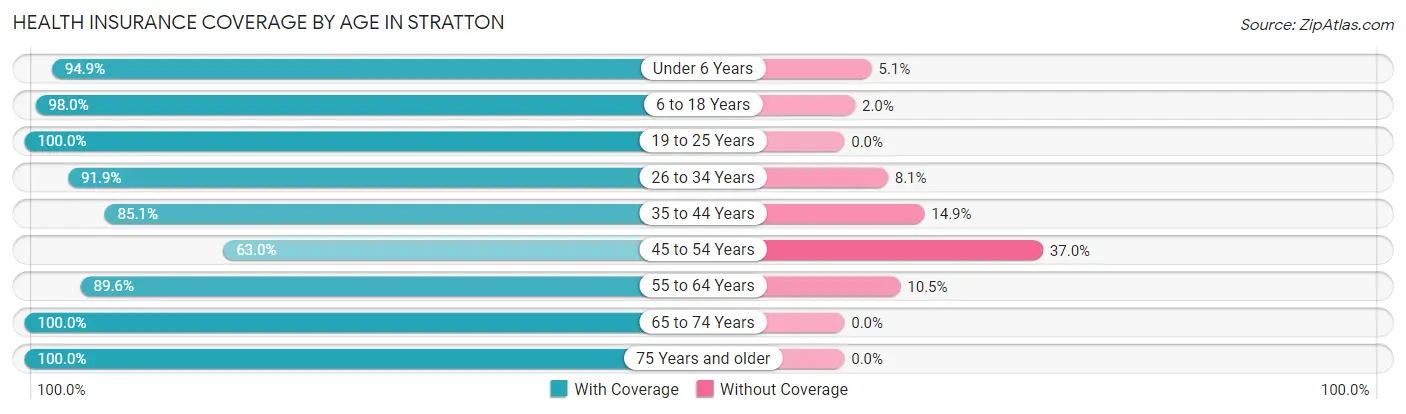
| Age Bracket | With Coverage | Without Coverage |
| Under 6 Years | 112 (94.9%) | 6 (5.1%) |
| 6 to 18 Years | 98 (98.0%) | 2 (2.0%) |
| 19 to 25 Years | 40 (100.0%) | 0 (0.0%) |
| 26 to 34 Years | 136 (91.9%) | 12 (8.1%) |
| 35 to 44 Years | 57 (85.1%) | 10 (14.9%) |
| 45 to 54 Years | 17 (63.0%) | 10 (37.0%) |
| 55 to 64 Years | 60 (89.5%) | 7 (10.4%) |
| 65 to 74 Years | 69 (100.0%) | 0 (0.0%) |
| 75 Years and older | 60 (100.0%) | 0 (0.0%) |
| Total | 649 (93.2%) | 47 (6.8%) |
Health Insurance Coverage by Citizenship Status in Stratton
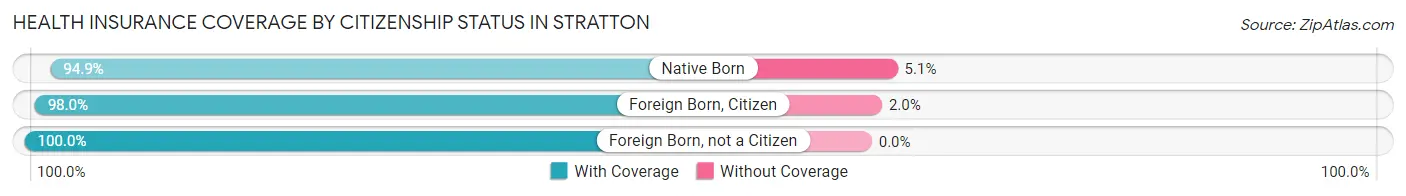
| Citizenship Status | With Coverage | Without Coverage |
| Native Born | 112 (94.9%) | 6 (5.1%) |
| Foreign Born, Citizen | 98 (98.0%) | 2 (2.0%) |
| Foreign Born, not a Citizen | 40 (100.0%) | 0 (0.0%) |
Health Insurance Coverage by Household Income in Stratton
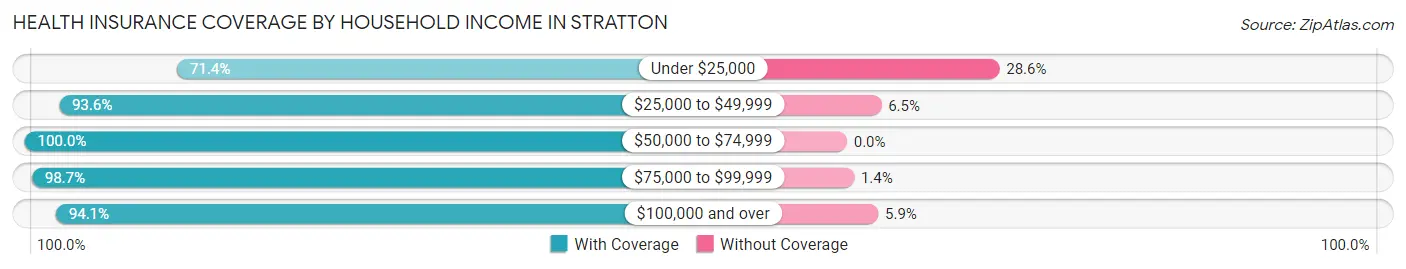
| Household Income | With Coverage | Without Coverage |
| Under $25,000 | 60 (71.4%) | 24 (28.6%) |
| $25,000 to $49,999 | 116 (93.5%) | 8 (6.5%) |
| $50,000 to $74,999 | 175 (100.0%) | 0 (0.0%) |
| $75,000 to $99,999 | 73 (98.7%) | 1 (1.3%) |
| $100,000 and over | 225 (94.1%) | 14 (5.9%) |
Public vs Private Health Insurance Coverage by Age in Stratton
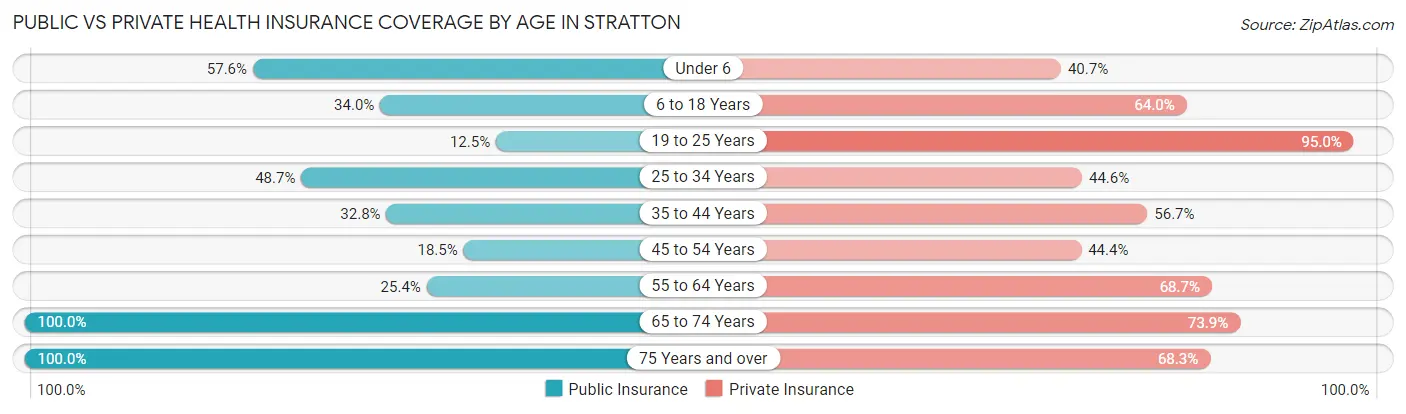
| Age Bracket | Public Insurance | Private Insurance |
| Under 6 | 68 (57.6%) | 48 (40.7%) |
| 6 to 18 Years | 34 (34.0%) | 64 (64.0%) |
| 19 to 25 Years | 5 (12.5%) | 38 (95.0%) |
| 25 to 34 Years | 72 (48.6%) | 66 (44.6%) |
| 35 to 44 Years | 22 (32.8%) | 38 (56.7%) |
| 45 to 54 Years | 5 (18.5%) | 12 (44.4%) |
| 55 to 64 Years | 17 (25.4%) | 46 (68.7%) |
| 65 to 74 Years | 69 (100.0%) | 51 (73.9%) |
| 75 Years and over | 60 (100.0%) | 41 (68.3%) |
| Total | 352 (50.6%) | 404 (58.1%) |
Disability Status by Sex by Age in Stratton
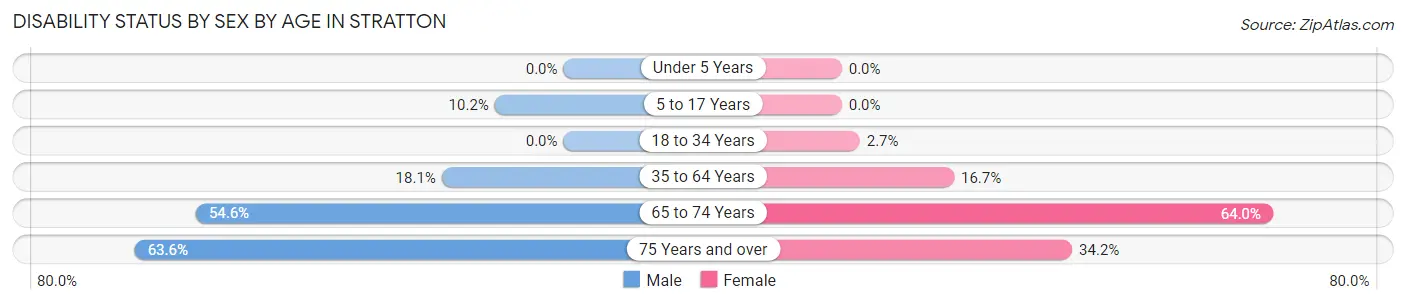
| Age Bracket | Male | Female |
| Under 5 Years | 0 (0.0%) | 0 (0.0%) |
| 5 to 17 Years | 5 (10.2%) | 0 (0.0%) |
| 18 to 34 Years | 0 (0.0%) | 2 (2.7%) |
| 35 to 64 Years | 15 (18.1%) | 13 (16.7%) |
| 65 to 74 Years | 24 (54.5%) | 16 (64.0%) |
| 75 Years and over | 14 (63.6%) | 13 (34.2%) |
Disability Class by Sex by Age in Stratton
Disability Class: Hearing Difficulty
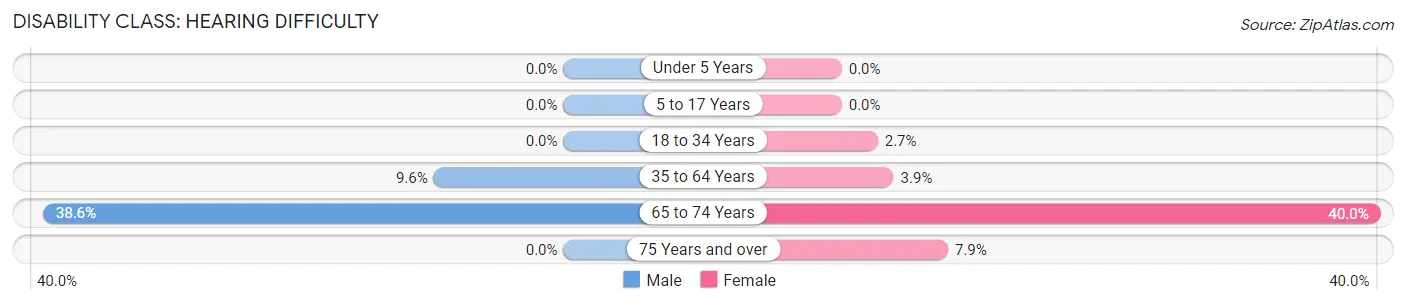
| Age Bracket | Male | Female |
| Under 5 Years | 0 (0.0%) | 0 (0.0%) |
| 5 to 17 Years | 0 (0.0%) | 0 (0.0%) |
| 18 to 34 Years | 0 (0.0%) | 2 (2.7%) |
| 35 to 64 Years | 8 (9.6%) | 3 (3.8%) |
| 65 to 74 Years | 17 (38.6%) | 10 (40.0%) |
| 75 Years and over | 0 (0.0%) | 3 (7.9%) |
Disability Class: Vision Difficulty
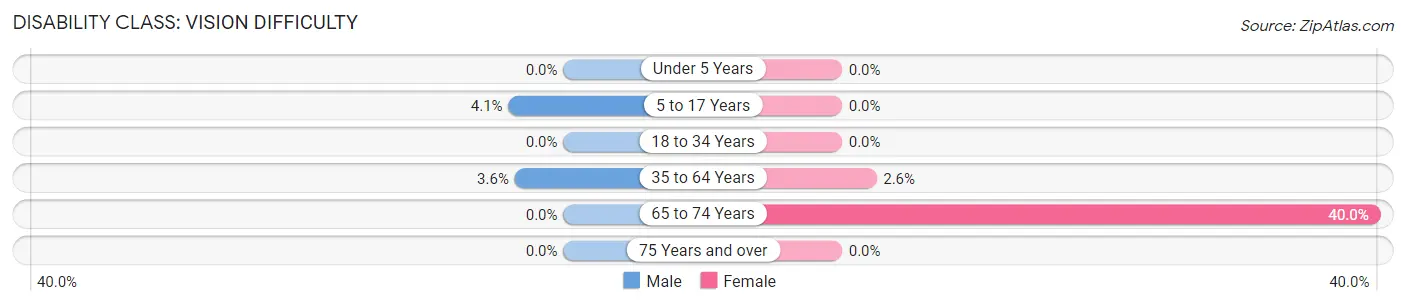
| Age Bracket | Male | Female |
| Under 5 Years | 0 (0.0%) | 0 (0.0%) |
| 5 to 17 Years | 2 (4.1%) | 0 (0.0%) |
| 18 to 34 Years | 0 (0.0%) | 0 (0.0%) |
| 35 to 64 Years | 3 (3.6%) | 2 (2.6%) |
| 65 to 74 Years | 0 (0.0%) | 10 (40.0%) |
| 75 Years and over | 0 (0.0%) | 0 (0.0%) |
Disability Class: Cognitive Difficulty
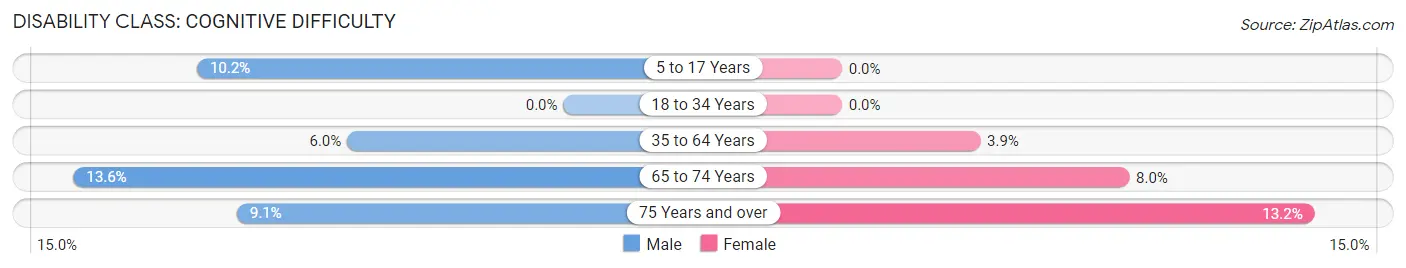
| Age Bracket | Male | Female |
| 5 to 17 Years | 5 (10.2%) | 0 (0.0%) |
| 18 to 34 Years | 0 (0.0%) | 0 (0.0%) |
| 35 to 64 Years | 5 (6.0%) | 3 (3.8%) |
| 65 to 74 Years | 6 (13.6%) | 2 (8.0%) |
| 75 Years and over | 2 (9.1%) | 5 (13.2%) |
Disability Class: Ambulatory Difficulty
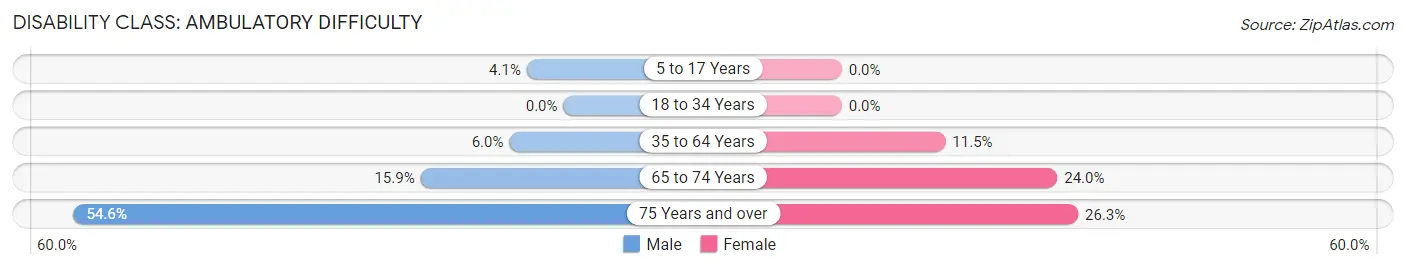
| Age Bracket | Male | Female |
| 5 to 17 Years | 2 (4.1%) | 0 (0.0%) |
| 18 to 34 Years | 0 (0.0%) | 0 (0.0%) |
| 35 to 64 Years | 5 (6.0%) | 9 (11.5%) |
| 65 to 74 Years | 7 (15.9%) | 6 (24.0%) |
| 75 Years and over | 12 (54.5%) | 10 (26.3%) |
Disability Class: Self-Care Difficulty
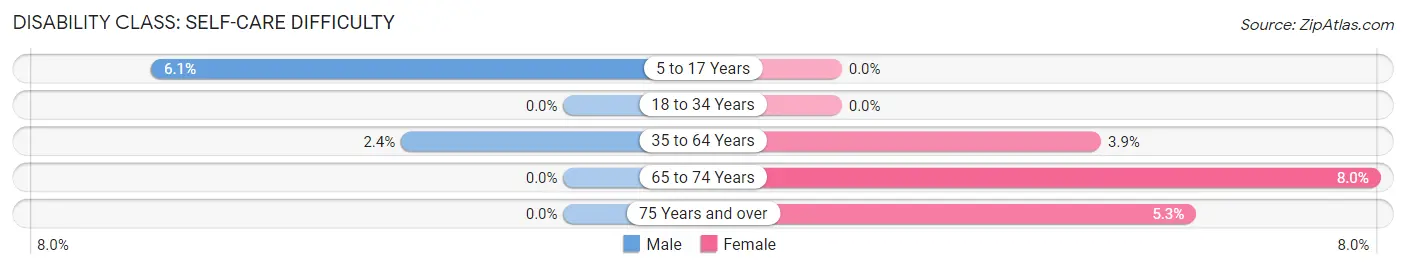
| Age Bracket | Male | Female |
| 5 to 17 Years | 3 (6.1%) | 0 (0.0%) |
| 18 to 34 Years | 0 (0.0%) | 0 (0.0%) |
| 35 to 64 Years | 2 (2.4%) | 3 (3.8%) |
| 65 to 74 Years | 0 (0.0%) | 2 (8.0%) |
| 75 Years and over | 0 (0.0%) | 2 (5.3%) |
Technology Access in Stratton
Computing Device Access in Stratton
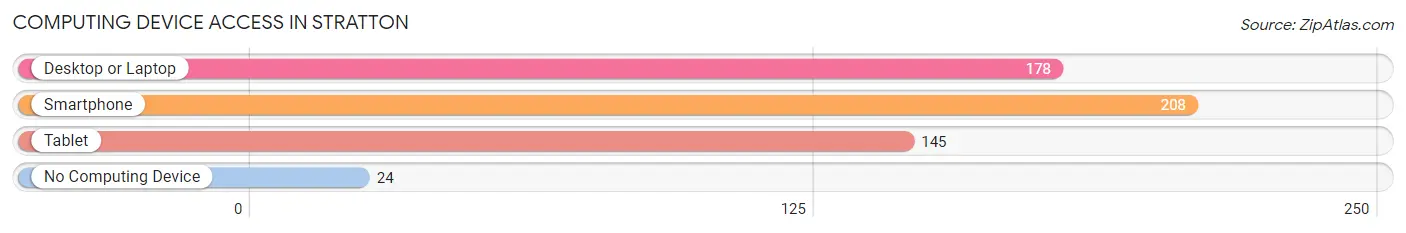
| Device Type | # Households | % Households |
| Desktop or Laptop | 178 | 70.9% |
| Smartphone | 208 | 82.9% |
| Tablet | 145 | 57.8% |
| No Computing Device | 24 | 9.6% |
| Total | 251 | 100.0% |
Internet Access in Stratton
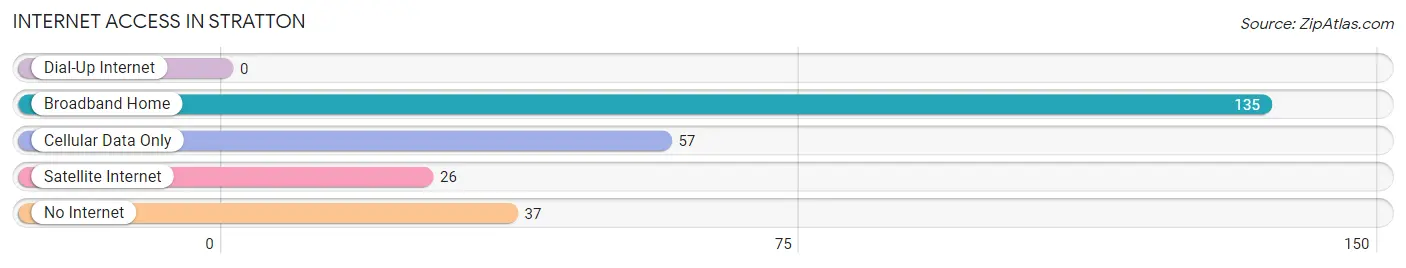
| Internet Type | # Households | % Households |
| Dial-Up Internet | 0 | 0.0% |
| Broadband Home | 135 | 53.8% |
| Cellular Data Only | 57 | 22.7% |
| Satellite Internet | 26 | 10.4% |
| No Internet | 37 | 14.7% |
| Total | 251 | 100.0% |
Stratton Summary
Stratton, Colorado is a small town located in the eastern part of the state, in the county of Kit Carson. It is situated at the intersection of U.S. Highway 24 and State Highway 59, and is approximately 30 miles east of the Colorado-Kansas border. The town has a population of approximately 1,000 people, and is the county seat of Kit Carson County.
History
Stratton was founded in 1887 by a group of settlers from Kansas. The town was named after the Stratton family, who were among the first settlers in the area. The town was originally a farming community, and the main crops grown were wheat, corn, and hay. In the early 1900s, the town began to grow and develop, and the first school was built in 1906.
In the 1920s, the town began to experience a period of growth and prosperity. The Great Western Sugar Company opened a sugar beet processing plant in Stratton, and the town became a major center for the sugar beet industry. The plant provided jobs for many of the town's residents, and the town's population grew to over 1,000 people.
In the 1950s, the sugar beet industry began to decline, and the plant eventually closed in the 1960s. The town's population began to decline, and by the 1970s, the population had dropped to just over 500 people.
Geography
Stratton is located in the eastern part of Colorado, in the county of Kit Carson. It is situated at the intersection of U.S. Highway 24 and State Highway 59, and is approximately 30 miles east of the Colorado-Kansas border. The town is located in the High Plains region of Colorado, and is surrounded by rolling hills and prairies. The town is located at an elevation of 4,400 feet above sea level.
Economy
Stratton's economy is largely based on agriculture and tourism. The town is home to several farms, which produce a variety of crops, including wheat, corn, hay, and sugar beets. The town is also home to several tourist attractions, including the Kit Carson County Museum, the Stratton Historical Society, and the Stratton Golf Course.
Demographics
As of the 2010 census, Stratton had a population of 1,000 people. The racial makeup of the town was 95.2% White, 0.3% African American, 0.2% Native American, 0.2% Asian, 0.1% Pacific Islander, 0.2% from other races, and 3.9% from two or more races. Hispanic or Latino of any race were 2.2% of the population.
The median income for a household in Stratton was $37,500, and the median income for a family was $41,250. The per capita income for the town was $17,845. About 11.2% of families and 13.2% of the population were below the poverty line, including 16.7% of those under age 18 and 8.3% of those age 65 or over.
Common Questions
What is Per Capita Income in Stratton?
Per Capita income in Stratton is $29,404.
What is the Median Family Income in Stratton?
Median Family Income in Stratton is $66,429.
What is the Median Household income in Stratton?
Median Household Income in Stratton is $51,806.
What is Income or Wage Gap in Stratton?
Income or Wage Gap in Stratton is 39.9%.
Women in Stratton earn 60.1 cents for every dollar earned by a man.
What is Inequality or Gini Index in Stratton?
Inequality or Gini Index in Stratton is 0.48.
What is the Total Population of Stratton?
Total Population of Stratton is 722.
What is the Total Male Population of Stratton?
Total Male Population of Stratton is 405.
What is the Total Female Population of Stratton?
Total Female Population of Stratton is 317.
What is the Ratio of Males per 100 Females in Stratton?
There are 127.76 Males per 100 Females in Stratton.
What is the Ratio of Females per 100 Males in Stratton?
There are 78.27 Females per 100 Males in Stratton.
What is the Median Population Age in Stratton?
Median Population Age in Stratton is 33.0 Years.
What is the Average Family Size in Stratton
Average Family Size in Stratton is 3.3 People.
What is the Average Household Size in Stratton
Average Household Size in Stratton is 2.8 People.
How Large is the Labor Force in Stratton?
There are 314 People in the Labor Forcein in Stratton.
What is the Percentage of People in the Labor Force in Stratton?
62.2% of People are in the Labor Force in Stratton.
What is the Unemployment Rate in Stratton?
Unemployment Rate in Stratton is 1.3%.