Castle Pines Village, CO Map & Demographics
Castle Pines Village Map
Castle Pines Village Overview
$132,948
PER CAPITA INCOME
$250,001
AVG FAMILY INCOME
$250,001
AVG HOUSEHOLD INCOME
43.2%
WAGE / INCOME GAP [ % ]
56.8¢/ $1
WAGE / INCOME GAP [ $ ]
0.43
INEQUALITY / GINI INDEX
4,462
TOTAL POPULATION
2,247
MALE POPULATION
2,215
FEMALE POPULATION
101.44
MALES / 100 FEMALES
98.58
FEMALES / 100 MALES
52.7
MEDIAN AGE
2.8
AVG FAMILY SIZE
2.7
AVG HOUSEHOLD SIZE
2,190
LABOR FORCE [ PEOPLE ]
57.0%
PERCENT IN LABOR FORCE
5.7%
UNEMPLOYMENT RATE
Income in Castle Pines Village
Income Overview in Castle Pines Village
Per Capita Income in Castle Pines Village is $132,948, while median incomes of families and households are $250,001 and $250,001 respectively.
| Characteristic | Number | Measure |
| Per Capita Income | 4,462 | $132,948 |
| Median Family Income | 1,527 | $250,001 |
| Mean Family Income | 1,527 | $358,021 |
| Median Household Income | 1,657 | $250,001 |
| Mean Household Income | 1,657 | $350,166 |
| Income Deficit | 1,527 | $0 |
| Wage / Income Gap (%) | 4,462 | 43.18% |
| Wage / Income Gap ($) | 4,462 | 56.82¢ per $1 |
| Gini / Inequality Index | 4,462 | 0.43 |
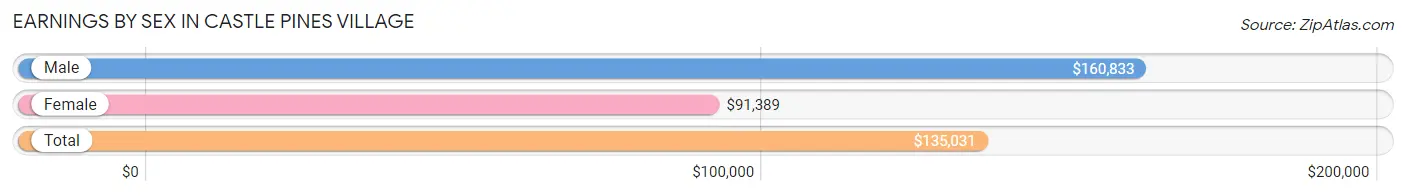
Earnings by Sex in Castle Pines Village
Average Earnings in Castle Pines Village are $135,031, $160,833 for men and $91,389 for women, a difference of 43.2%.
| Sex | Number | Average Earnings |
| Male | 1,384 (62.1%) | $160,833 |
| Female | 846 (37.9%) | $91,389 |
| Total | 2,230 (100.0%) | $135,031 |
Earnings by Sex by Income Bracket in Castle Pines Village
The most common earnings brackets in Castle Pines Village are $100,000+ for men (922 | 66.6%) and $100,000+ for women (392 | 46.3%).
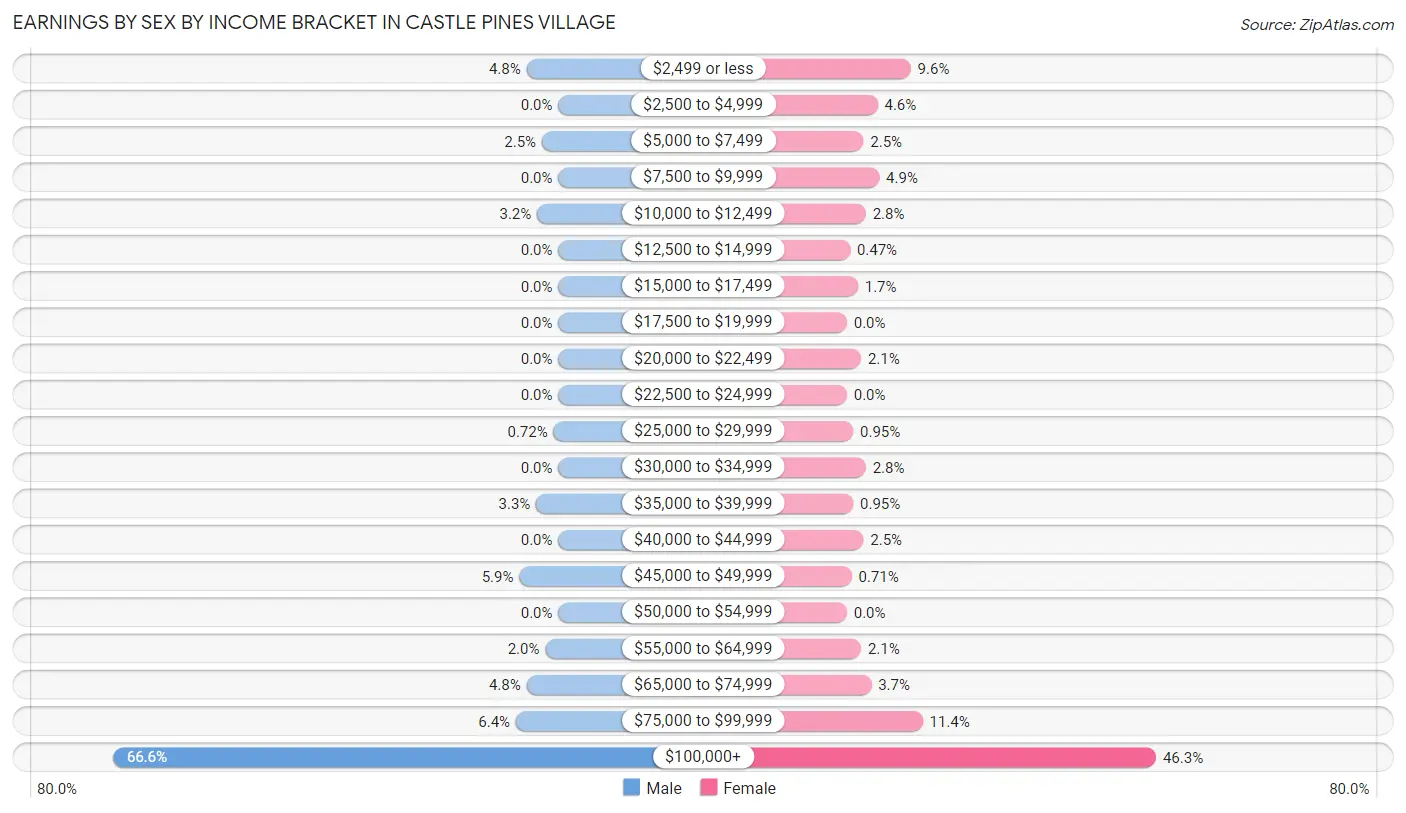
| Income | Male | Female |
| $2,499 or less | 66 (4.8%) | 81 (9.6%) |
| $2,500 to $4,999 | 0 (0.0%) | 39 (4.6%) |
| $5,000 to $7,499 | 34 (2.5%) | 21 (2.5%) |
| $7,500 to $9,999 | 0 (0.0%) | 41 (4.9%) |
| $10,000 to $12,499 | 44 (3.2%) | 24 (2.8%) |
| $12,500 to $14,999 | 0 (0.0%) | 4 (0.5%) |
| $15,000 to $17,499 | 0 (0.0%) | 14 (1.7%) |
| $17,500 to $19,999 | 0 (0.0%) | 0 (0.0%) |
| $20,000 to $22,499 | 0 (0.0%) | 18 (2.1%) |
| $22,500 to $24,999 | 0 (0.0%) | 0 (0.0%) |
| $25,000 to $29,999 | 10 (0.7%) | 8 (0.9%) |
| $30,000 to $34,999 | 0 (0.0%) | 24 (2.8%) |
| $35,000 to $39,999 | 46 (3.3%) | 8 (0.9%) |
| $40,000 to $44,999 | 0 (0.0%) | 21 (2.5%) |
| $45,000 to $49,999 | 81 (5.9%) | 6 (0.7%) |
| $50,000 to $54,999 | 0 (0.0%) | 0 (0.0%) |
| $55,000 to $64,999 | 27 (1.9%) | 18 (2.1%) |
| $65,000 to $74,999 | 66 (4.8%) | 31 (3.7%) |
| $75,000 to $99,999 | 88 (6.4%) | 96 (11.4%) |
| $100,000+ | 922 (66.6%) | 392 (46.3%) |
| Total | 1,384 (100.0%) | 846 (100.0%) |
Earnings by Sex by Educational Attainment in Castle Pines Village
Average earnings in Castle Pines Village are $196,618 for men and $114,313 for women, a difference of 41.9%. Men with an educational attainment of graduate degree enjoy the highest average annual earnings of $250,001, while those with college or associate's degree education earn the least with $98,777. Women with an educational attainment of graduate degree earn the most with the average annual earnings of $175,809, while those with college or associate's degree education have the smallest earnings of $70,125.
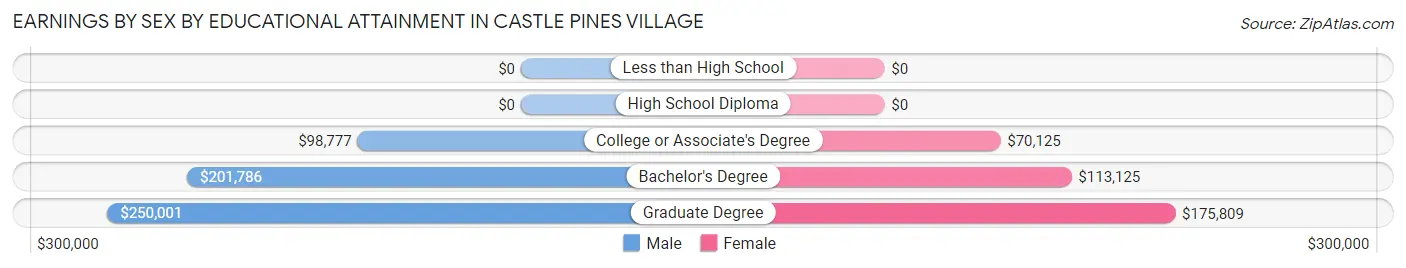
| Educational Attainment | Male Income | Female Income |
| Less than High School | - | - |
| High School Diploma | - | - |
| College or Associate's Degree | $98,777 | $70,125 |
| Bachelor's Degree | $201,786 | $113,125 |
| Graduate Degree | $250,001 | $175,809 |
| Total | $196,618 | $114,313 |
Family Income in Castle Pines Village
Family Income Brackets in Castle Pines Village
According to the Castle Pines Village family income data, there are 902 families falling into the $200,000+ income range, which is the most common income bracket and makes up 59.1% of all families.
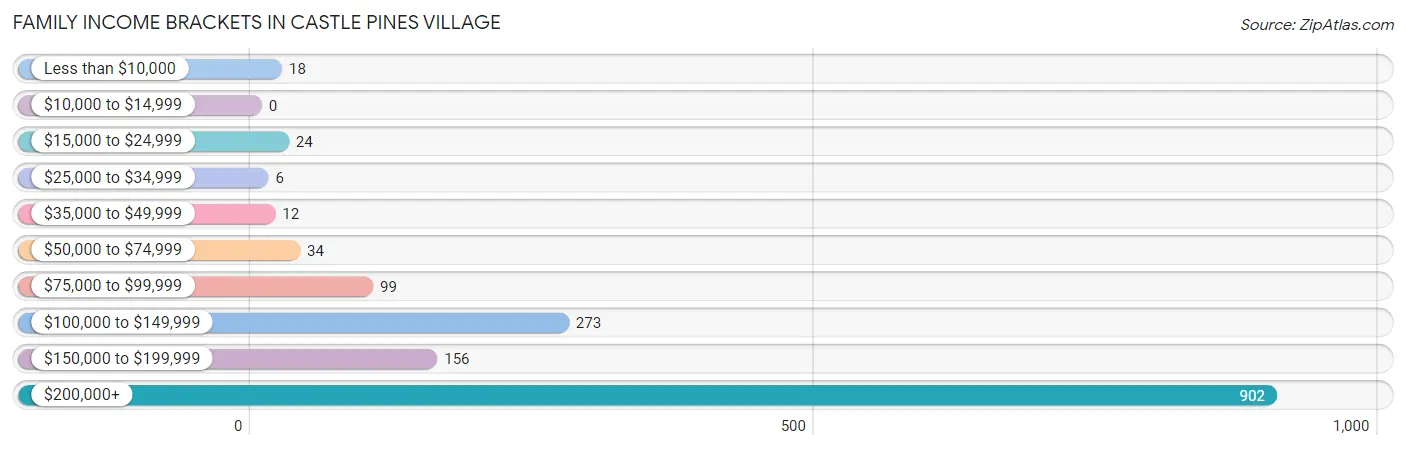
| Income Bracket | # Families | % Families |
| Less than $10,000 | 18 | 1.2% |
| $10,000 to $14,999 | 0 | 0.0% |
| $15,000 to $24,999 | 24 | 1.6% |
| $25,000 to $34,999 | 6 | 0.4% |
| $35,000 to $49,999 | 12 | 0.8% |
| $50,000 to $74,999 | 34 | 2.2% |
| $75,000 to $99,999 | 99 | 6.5% |
| $100,000 to $149,999 | 273 | 17.9% |
| $150,000 to $199,999 | 156 | 10.2% |
| $200,000+ | 902 | 59.1% |
Family Income by Famaliy Size in Castle Pines Village
2-person families (920 | 60.3%) account for the highest median family income in Castle Pines Village with $250,001 per family, while 2-person families (920 | 60.3%) have the highest median income of $125,000 per family member.
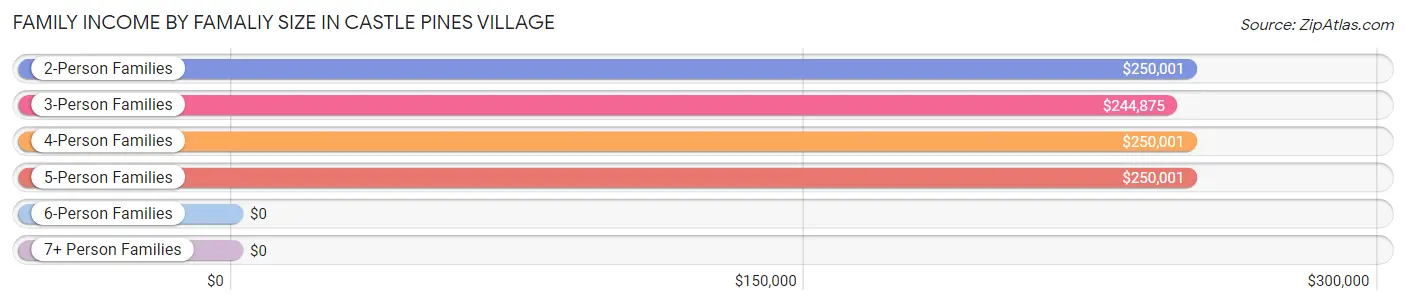
| Income Bracket | # Families | Median Income |
| 2-Person Families | 920 (60.3%) | $250,001 |
| 3-Person Families | 169 (11.1%) | $244,875 |
| 4-Person Families | 372 (24.4%) | $250,001 |
| 5-Person Families | 66 (4.3%) | $250,001 |
| 6-Person Families | 0 (0.0%) | $0 |
| 7+ Person Families | 0 (0.0%) | $0 |
| Total | 1,527 (100.0%) | $250,001 |
Family Income by Number of Earners in Castle Pines Village
The median family income in Castle Pines Village is $250,001, with families comprising 2 earners (510) having the highest median family income of $250,001, while families with no earners (364) have the lowest median family income of $148,106, accounting for 33.4% and 23.8% of families, respectively.
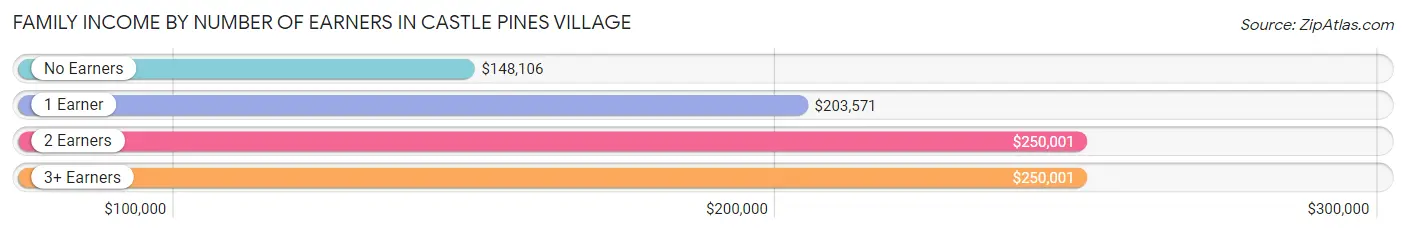
| Number of Earners | # Families | Median Income |
| No Earners | 364 (23.8%) | $148,106 |
| 1 Earner | 540 (35.4%) | $203,571 |
| 2 Earners | 510 (33.4%) | $250,001 |
| 3+ Earners | 113 (7.4%) | $250,001 |
| Total | 1,527 (100.0%) | $250,001 |
Household Income in Castle Pines Village
Household Income Brackets in Castle Pines Village
With 944 households falling in the category, the $200,000+ income range is the most frequent in Castle Pines Village, accounting for 57.0% of all households. In contrast, only 8 households (0.5%) fall into the $10,000 to $14,999 income bracket, making it the least populous group.
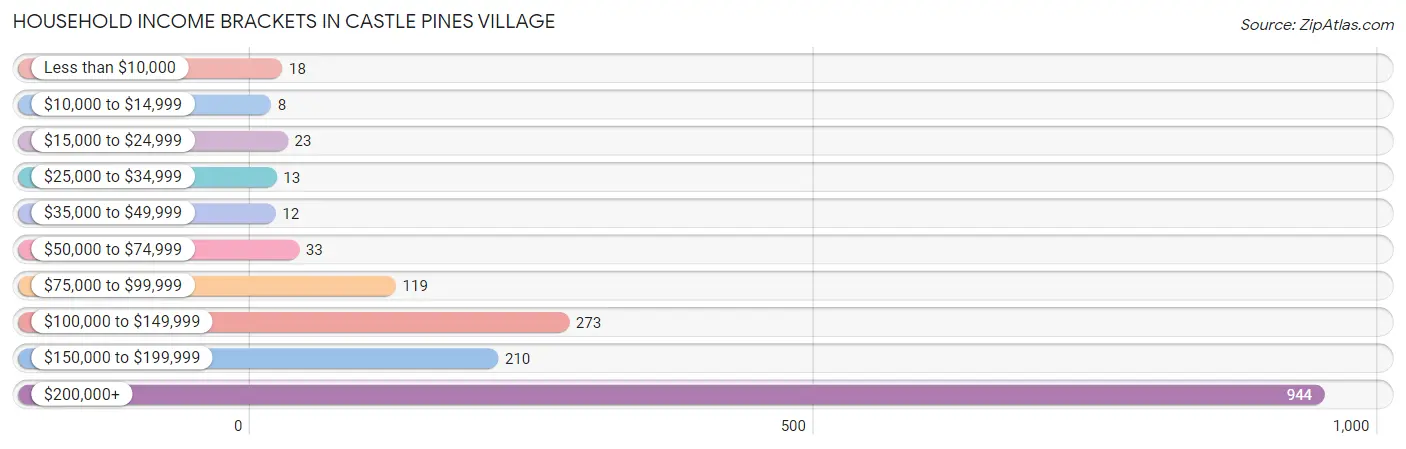
| Income Bracket | # Households | % Households |
| Less than $10,000 | 18 | 1.1% |
| $10,000 to $14,999 | 8 | 0.5% |
| $15,000 to $24,999 | 23 | 1.4% |
| $25,000 to $34,999 | 13 | 0.8% |
| $35,000 to $49,999 | 12 | 0.7% |
| $50,000 to $74,999 | 33 | 2.0% |
| $75,000 to $99,999 | 119 | 7.2% |
| $100,000 to $149,999 | 273 | 16.5% |
| $150,000 to $199,999 | 210 | 12.7% |
| $200,000+ | 944 | 57.0% |
Household Income by Householder Age in Castle Pines Village
The median household income in Castle Pines Village is $250,001, with the highest median household income of $250,001 found in the 25 to 44 years age bracket for the primary householder. A total of 200 households (12.1%) fall into this category.
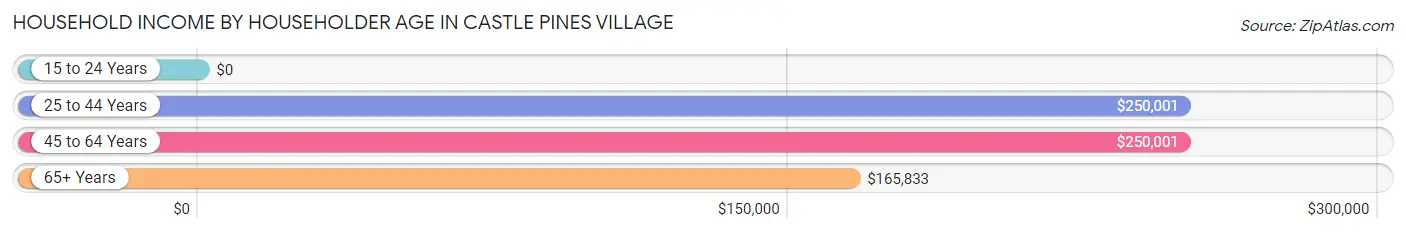
| Income Bracket | # Households | Median Income |
| 15 to 24 Years | 0 (0.0%) | $0 |
| 25 to 44 Years | 200 (12.1%) | $250,001 |
| 45 to 64 Years | 899 (54.2%) | $250,001 |
| 65+ Years | 558 (33.7%) | $165,833 |
| Total | 1,657 (100.0%) | $250,001 |
Poverty in Castle Pines Village
Income Below Poverty by Sex and Age in Castle Pines Village
With 4.1% poverty level for males and 2.8% for females among the residents of Castle Pines Village, 6 to 11 year old males and 75 year old and over females are the most vulnerable to poverty, with 44 males (37.9%) and 28 females (18.9%) in their respective age groups living below the poverty level.
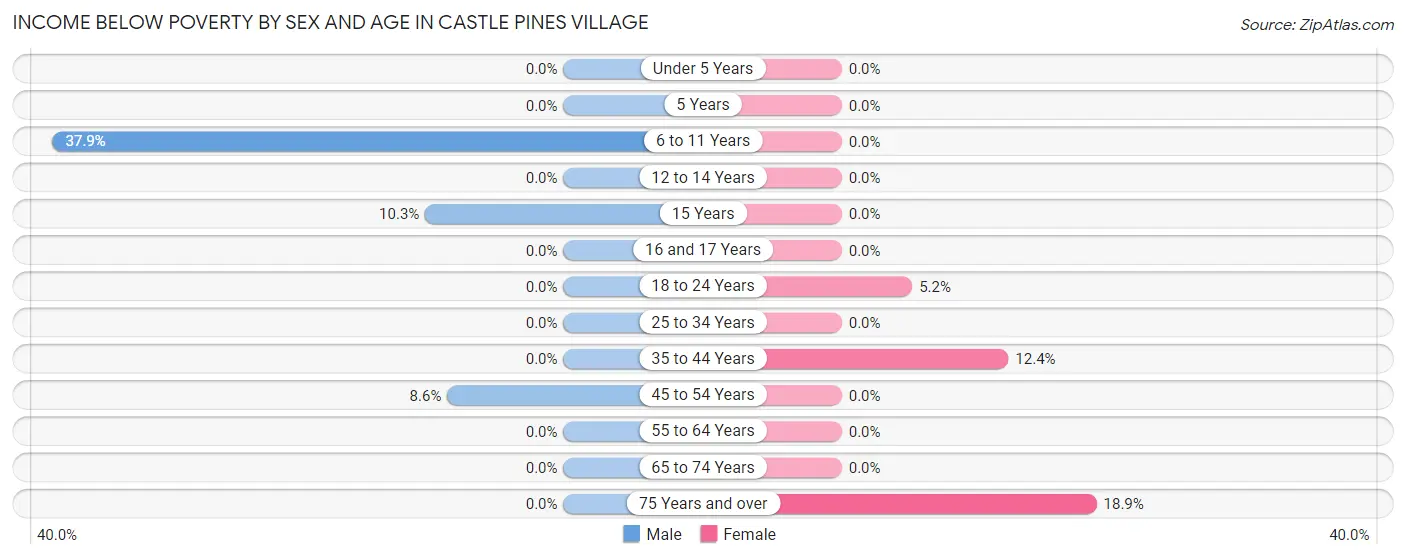
| Age Bracket | Male | Female |
| Under 5 Years | 0 (0.0%) | 0 (0.0%) |
| 5 Years | 0 (0.0%) | 0 (0.0%) |
| 6 to 11 Years | 44 (37.9%) | 0 (0.0%) |
| 12 to 14 Years | 0 (0.0%) | 0 (0.0%) |
| 15 Years | 4 (10.3%) | 0 (0.0%) |
| 16 and 17 Years | 0 (0.0%) | 0 (0.0%) |
| 18 to 24 Years | 0 (0.0%) | 9 (5.2%) |
| 25 to 34 Years | 0 (0.0%) | 0 (0.0%) |
| 35 to 44 Years | 0 (0.0%) | 24 (12.4%) |
| 45 to 54 Years | 43 (8.6%) | 0 (0.0%) |
| 55 to 64 Years | 0 (0.0%) | 0 (0.0%) |
| 65 to 74 Years | 0 (0.0%) | 0 (0.0%) |
| 75 Years and over | 0 (0.0%) | 28 (18.9%) |
| Total | 91 (4.1%) | 61 (2.8%) |
Income Above Poverty by Sex and Age in Castle Pines Village
According to the poverty statistics in Castle Pines Village, males aged under 5 years and females aged under 5 years are the age groups that are most secure financially, with 100.0% of males and 100.0% of females in these age groups living above the poverty line.
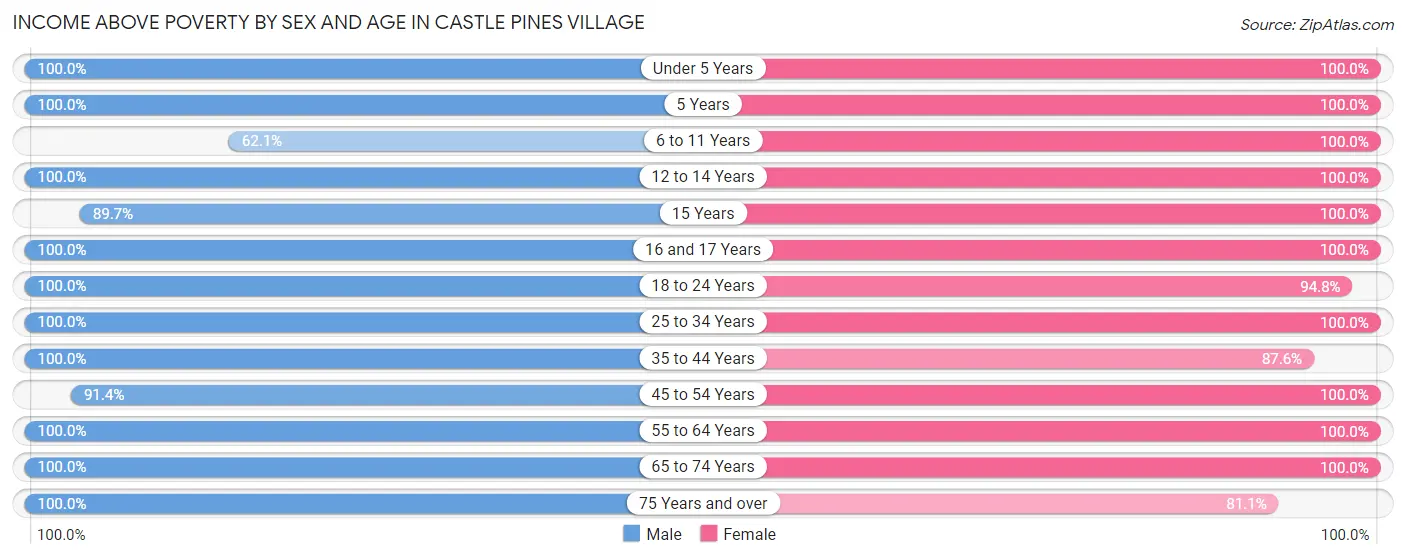
| Age Bracket | Male | Female |
| Under 5 Years | 79 (100.0%) | 53 (100.0%) |
| 5 Years | 14 (100.0%) | 14 (100.0%) |
| 6 to 11 Years | 72 (62.1%) | 110 (100.0%) |
| 12 to 14 Years | 73 (100.0%) | 54 (100.0%) |
| 15 Years | 35 (89.7%) | 68 (100.0%) |
| 16 and 17 Years | 40 (100.0%) | 156 (100.0%) |
| 18 to 24 Years | 131 (100.0%) | 163 (94.8%) |
| 25 to 34 Years | 150 (100.0%) | 53 (100.0%) |
| 35 to 44 Years | 132 (100.0%) | 170 (87.6%) |
| 45 to 54 Years | 456 (91.4%) | 432 (100.0%) |
| 55 to 64 Years | 435 (100.0%) | 464 (100.0%) |
| 65 to 74 Years | 366 (100.0%) | 297 (100.0%) |
| 75 Years and over | 173 (100.0%) | 120 (81.1%) |
| Total | 2,156 (96.0%) | 2,154 (97.3%) |
Income Below Poverty Among Married-Couple Families in Castle Pines Village
The poverty statistics for married-couple families in Castle Pines Village show that 1.7% or 24 of the total 1,452 families live below the poverty line. Families with 1 or 2 children have the highest poverty rate of 5.6%, comprising of 24 families. On the other hand, families with no children have the lowest poverty rate of 0.0%, which includes 0 families.
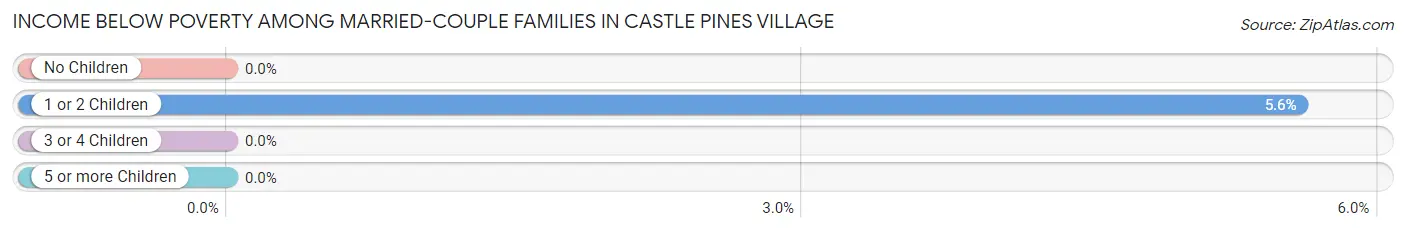
| Children | Above Poverty | Below Poverty |
| No Children | 1,000 (100.0%) | 0 (0.0%) |
| 1 or 2 Children | 405 (94.4%) | 24 (5.6%) |
| 3 or 4 Children | 23 (100.0%) | 0 (0.0%) |
| 5 or more Children | 0 (0.0%) | 0 (0.0%) |
| Total | 1,428 (98.4%) | 24 (1.7%) |
Income Below Poverty Among Single-Parent Households in Castle Pines Village
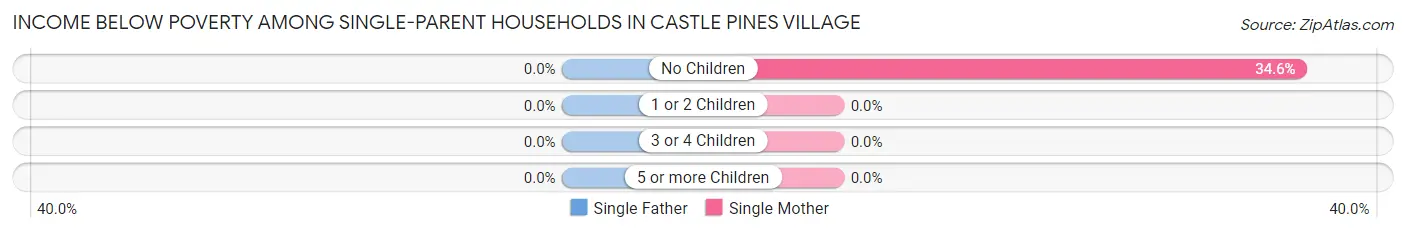
| Children | Single Father | Single Mother |
| No Children | 0 (0.0%) | 19 (34.5%) |
| 1 or 2 Children | 0 (0.0%) | 0 (0.0%) |
| 3 or 4 Children | 0 (0.0%) | 0 (0.0%) |
| 5 or more Children | 0 (0.0%) | 0 (0.0%) |
| Total | 0 (0.0%) | 19 (28.4%) |
Income Below Poverty Among Married-Couple vs Single-Parent Households in Castle Pines Village
The poverty data for Castle Pines Village shows that 24 of the married-couple family households (1.7%) and 19 of the single-parent households (25.3%) are living below the poverty level. Within the married-couple family households, those with 1 or 2 children have the highest poverty rate, with 24 households (5.6%) falling below the poverty line. Among the single-parent households, those with no children have the highest poverty rate, with 19 household (34.5%) living below poverty.
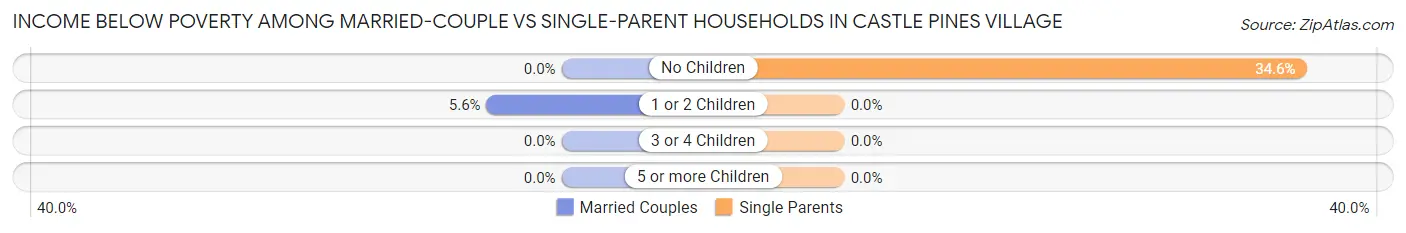
| Children | Married-Couple Families | Single-Parent Households |
| No Children | 0 (0.0%) | 19 (34.5%) |
| 1 or 2 Children | 24 (5.6%) | 0 (0.0%) |
| 3 or 4 Children | 0 (0.0%) | 0 (0.0%) |
| 5 or more Children | 0 (0.0%) | 0 (0.0%) |
| Total | 24 (1.7%) | 19 (25.3%) |
Race in Castle Pines Village
The most populous races in Castle Pines Village are White / Caucasian (4,083 | 91.5%), Hispanic or Latino (196 | 4.4%), and Asian (156 | 3.5%).
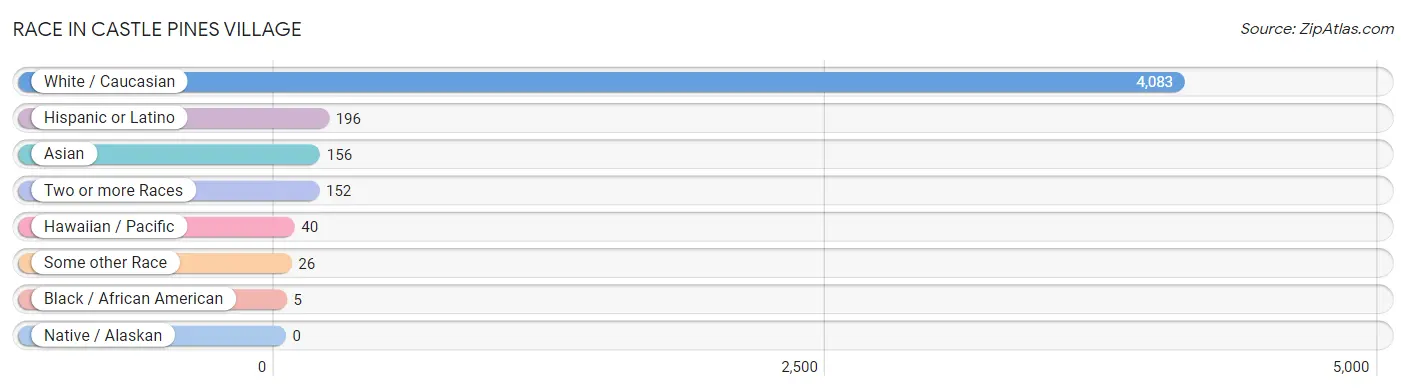
| Race | # Population | % Population |
| Asian | 156 | 3.5% |
| Black / African American | 5 | 0.1% |
| Hawaiian / Pacific | 40 | 0.9% |
| Hispanic or Latino | 196 | 4.4% |
| Native / Alaskan | 0 | 0.0% |
| White / Caucasian | 4,083 | 91.5% |
| Two or more Races | 152 | 3.4% |
| Some other Race | 26 | 0.6% |
| Total | 4,462 | 100.0% |
Ancestry in Castle Pines Village
The most populous ancestries reported in Castle Pines Village are English (1,002 | 22.5%), German (918 | 20.6%), Irish (480 | 10.8%), Norwegian (268 | 6.0%), and French (236 | 5.3%), together accounting for 65.1% of all Castle Pines Village residents.
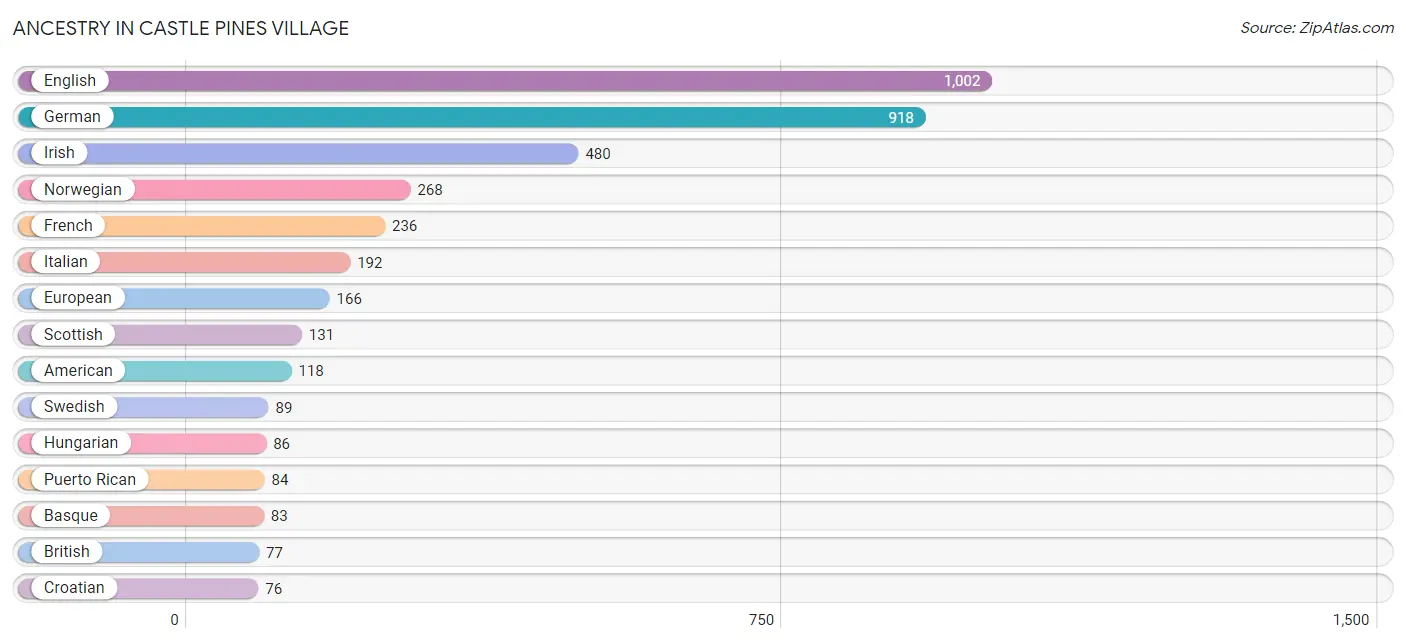
| Ancestry | # Population | % Population |
| African | 5 | 0.1% |
| American | 118 | 2.6% |
| Armenian | 12 | 0.3% |
| Austrian | 35 | 0.8% |
| Basque | 83 | 1.9% |
| Bhutanese | 40 | 0.9% |
| Brazilian | 9 | 0.2% |
| British | 77 | 1.7% |
| Burmese | 15 | 0.3% |
| Canadian | 22 | 0.5% |
| Central American | 15 | 0.3% |
| Chilean | 44 | 1.0% |
| Croatian | 76 | 1.7% |
| Czech | 38 | 0.9% |
| Danish | 47 | 1.1% |
| Dutch | 40 | 0.9% |
| Eastern European | 9 | 0.2% |
| English | 1,002 | 22.5% |
| European | 166 | 3.7% |
| Finnish | 15 | 0.3% |
| French | 236 | 5.3% |
| French Canadian | 46 | 1.0% |
| German | 918 | 20.6% |
| Ghanaian | 5 | 0.1% |
| Greek | 20 | 0.4% |
| Hungarian | 86 | 1.9% |
| Indian (Asian) | 25 | 0.6% |
| Iranian | 6 | 0.1% |
| Irish | 480 | 10.8% |
| Italian | 192 | 4.3% |
| Korean | 69 | 1.5% |
| Lithuanian | 38 | 0.9% |
| Mexican | 53 | 1.2% |
| Native Hawaiian | 55 | 1.2% |
| Norwegian | 268 | 6.0% |
| Polish | 57 | 1.3% |
| Puerto Rican | 84 | 1.9% |
| Romanian | 33 | 0.7% |
| Russian | 53 | 1.2% |
| Salvadoran | 15 | 0.3% |
| Scandinavian | 20 | 0.4% |
| Scotch-Irish | 43 | 1.0% |
| Scottish | 131 | 2.9% |
| Sioux | 2 | 0.0% |
| Slovak | 9 | 0.2% |
| South American | 44 | 1.0% |
| Subsaharan African | 5 | 0.1% |
| Swedish | 89 | 2.0% |
| Swiss | 17 | 0.4% |
| Thai | 21 | 0.5% |
| Ukrainian | 7 | 0.2% |
| Welsh | 7 | 0.2% | View All 52 Rows |
Immigrants in Castle Pines Village
The most numerous immigrant groups reported in Castle Pines Village came from Asia (114 | 2.5%), Europe (87 | 1.9%), Latin America (79 | 1.8%), South Central Asia (73 | 1.6%), and South America (71 | 1.6%), together accounting for 9.5% of all Castle Pines Village residents.
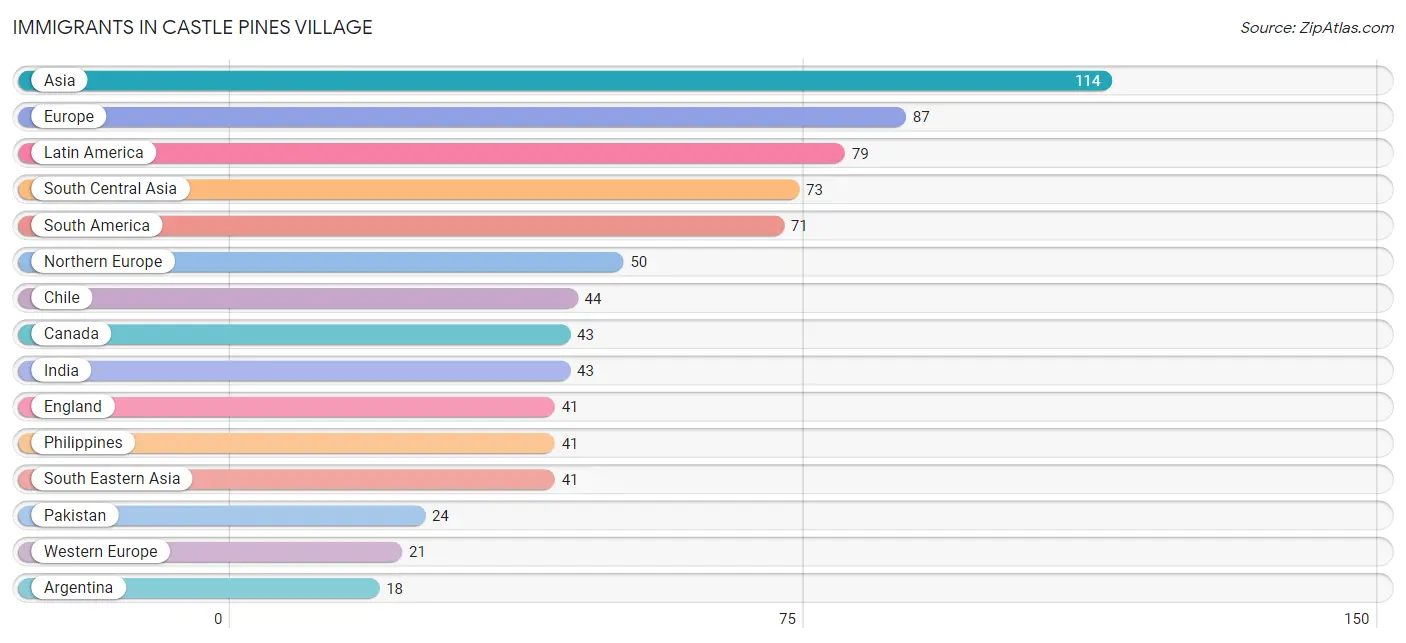
| Immigration Origin | # Population | % Population |
| Africa | 5 | 0.1% |
| Argentina | 18 | 0.4% |
| Asia | 114 | 2.5% |
| Brazil | 9 | 0.2% |
| Canada | 43 | 1.0% |
| Central America | 8 | 0.2% |
| Chile | 44 | 1.0% |
| Eastern Europe | 16 | 0.4% |
| El Salvador | 8 | 0.2% |
| England | 41 | 0.9% |
| Europe | 87 | 1.9% |
| France | 12 | 0.3% |
| Germany | 9 | 0.2% |
| Ghana | 5 | 0.1% |
| India | 43 | 1.0% |
| Iran | 6 | 0.1% |
| Latin America | 79 | 1.8% |
| Moldova | 9 | 0.2% |
| Northern Europe | 50 | 1.1% |
| Pakistan | 24 | 0.5% |
| Philippines | 41 | 0.9% |
| Romania | 7 | 0.2% |
| South America | 71 | 1.6% |
| South Central Asia | 73 | 1.6% |
| South Eastern Asia | 41 | 0.9% |
| Western Africa | 5 | 0.1% |
| Western Europe | 21 | 0.5% | View All 27 Rows |
Sex and Age in Castle Pines Village
Sex and Age in Castle Pines Village
The most populous age groups in Castle Pines Village are 50 to 54 Years (440 | 19.6%) for men and 50 to 54 Years (286 | 12.9%) for women.
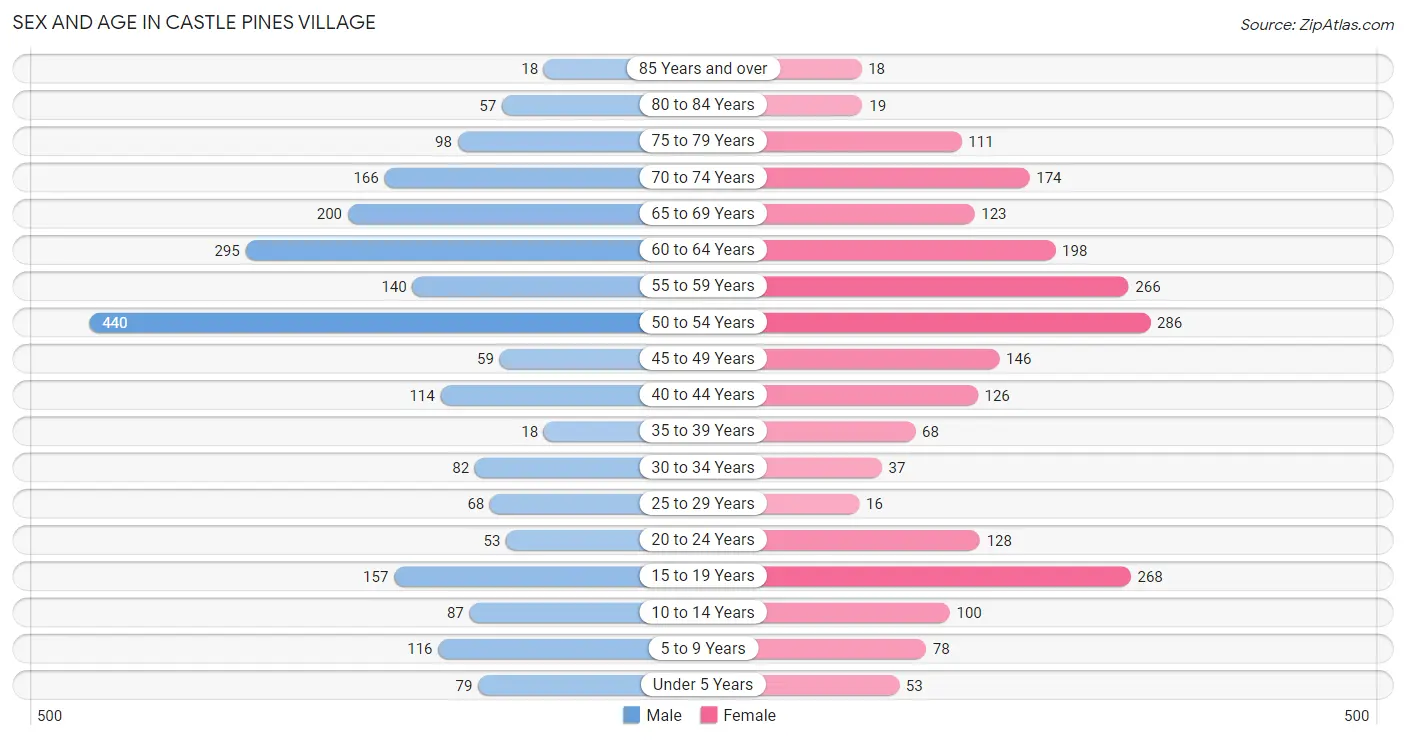
| Age Bracket | Male | Female |
| Under 5 Years | 79 (3.5%) | 53 (2.4%) |
| 5 to 9 Years | 116 (5.2%) | 78 (3.5%) |
| 10 to 14 Years | 87 (3.9%) | 100 (4.5%) |
| 15 to 19 Years | 157 (7.0%) | 268 (12.1%) |
| 20 to 24 Years | 53 (2.4%) | 128 (5.8%) |
| 25 to 29 Years | 68 (3.0%) | 16 (0.7%) |
| 30 to 34 Years | 82 (3.6%) | 37 (1.7%) |
| 35 to 39 Years | 18 (0.8%) | 68 (3.1%) |
| 40 to 44 Years | 114 (5.1%) | 126 (5.7%) |
| 45 to 49 Years | 59 (2.6%) | 146 (6.6%) |
| 50 to 54 Years | 440 (19.6%) | 286 (12.9%) |
| 55 to 59 Years | 140 (6.2%) | 266 (12.0%) |
| 60 to 64 Years | 295 (13.1%) | 198 (8.9%) |
| 65 to 69 Years | 200 (8.9%) | 123 (5.6%) |
| 70 to 74 Years | 166 (7.4%) | 174 (7.9%) |
| 75 to 79 Years | 98 (4.4%) | 111 (5.0%) |
| 80 to 84 Years | 57 (2.5%) | 19 (0.9%) |
| 85 Years and over | 18 (0.8%) | 18 (0.8%) |
| Total | 2,247 (100.0%) | 2,215 (100.0%) |
Families and Households in Castle Pines Village
Median Family Size in Castle Pines Village
The median family size in Castle Pines Village is 2.79 persons per family, with single male/father families (8 | 0.5%) accounting for the largest median family size of 3.88 persons per family. On the other hand, married-couple families (1,452 | 95.1%) represent the smallest median family size with 2.77 persons per family.
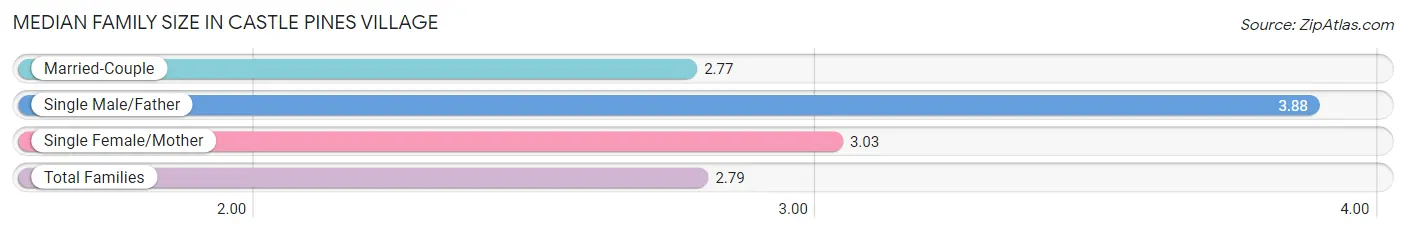
| Family Type | # Families | Family Size |
| Married-Couple | 1,452 (95.1%) | 2.77 |
| Single Male/Father | 8 (0.5%) | 3.88 |
| Single Female/Mother | 67 (4.4%) | 3.03 |
| Total Families | 1,527 (100.0%) | 2.79 |
Median Household Size in Castle Pines Village
The median household size in Castle Pines Village is 2.69 persons per household, with single male/father households (8 | 0.5%) accounting for the largest median household size of 4.75 persons per household. non-family households (130 | 7.9%) represent the smallest median household size with 1.29 persons per household.
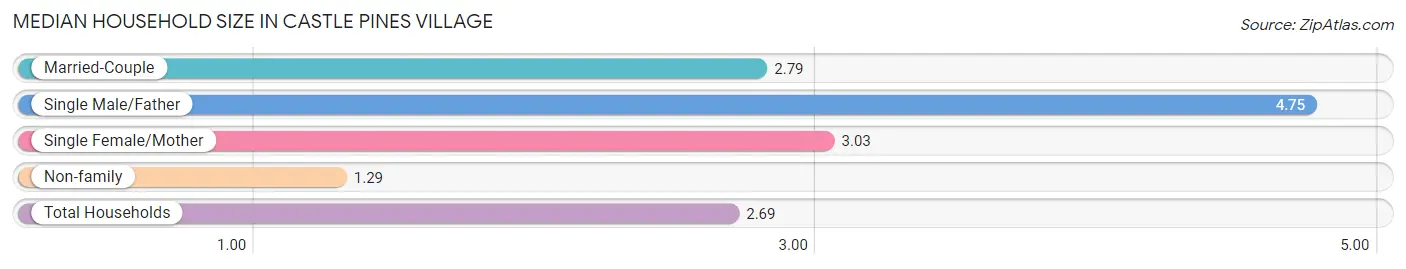
| Household Type | # Households | Household Size |
| Married-Couple | 1,452 (87.6%) | 2.79 |
| Single Male/Father | 8 (0.5%) | 4.75 |
| Single Female/Mother | 67 (4.0%) | 3.03 |
| Non-family | 130 (7.9%) | 1.29 |
| Total Households | 1,657 (100.0%) | 2.69 |
Household Size by Marriage Status in Castle Pines Village
Out of a total of 1,657 households in Castle Pines Village, 1,527 (92.1%) are family households, while 130 (7.9%) are nonfamily households. The most numerous type of family households are 2-person households, comprising 920, and the most common type of nonfamily households are 1-person households, comprising 98.
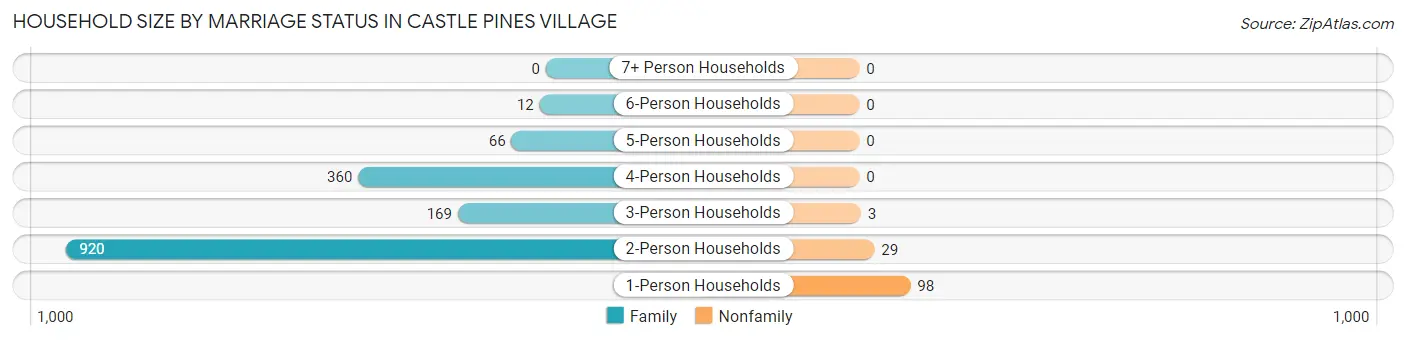
| Household Size | Family Households | Nonfamily Households |
| 1-Person Households | - | 98 (5.9%) |
| 2-Person Households | 920 (55.5%) | 29 (1.8%) |
| 3-Person Households | 169 (10.2%) | 3 (0.2%) |
| 4-Person Households | 360 (21.7%) | 0 (0.0%) |
| 5-Person Households | 66 (4.0%) | 0 (0.0%) |
| 6-Person Households | 12 (0.7%) | 0 (0.0%) |
| 7+ Person Households | 0 (0.0%) | 0 (0.0%) |
| Total | 1,527 (92.1%) | 130 (7.9%) |
Female Fertility in Castle Pines Village
Fertility by Age in Castle Pines Village
Average fertility rate in Castle Pines Village is 12.0 births per 1,000 women. Women in the age bracket of 35 to 50 years have the highest fertility rate with 25.0 births per 1,000 women. Women in the age bracket of 35 to 50 years acount for 100.0% of all women with births.
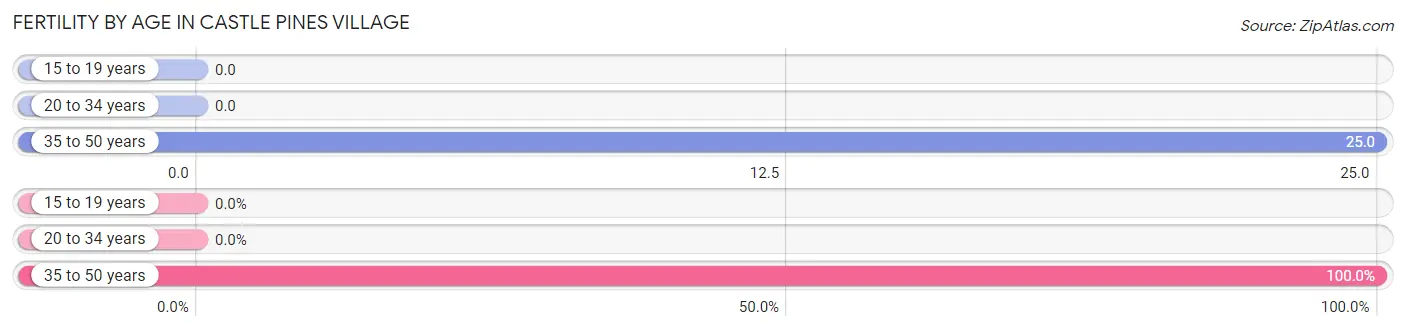
| Age Bracket | Women with Births | Births / 1,000 Women |
| 15 to 19 years | 0 (0.0%) | 0.0 |
| 20 to 34 years | 0 (0.0%) | 0.0 |
| 35 to 50 years | 10 (100.0%) | 25.0 |
| Total | 10 (100.0%) | 12.0 |
Fertility by Age by Marriage Status in Castle Pines Village
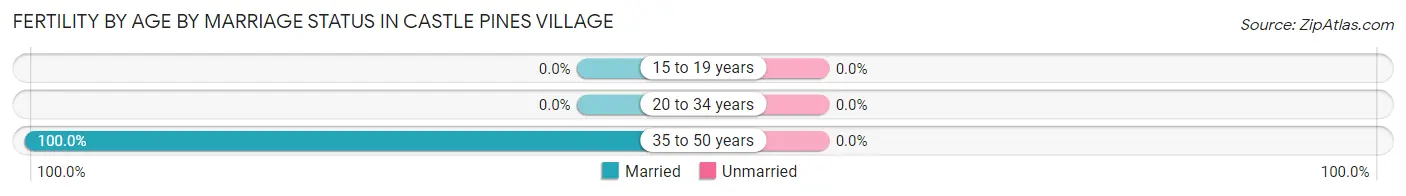
| Age Bracket | Married | Unmarried |
| 15 to 19 years | 0 (0.0%) | 0 (0.0%) |
| 20 to 34 years | 0 (0.0%) | 0 (0.0%) |
| 35 to 50 years | 10 (100.0%) | 0 (0.0%) |
| Total | 10 (100.0%) | 0 (0.0%) |
Fertility by Education in Castle Pines Village
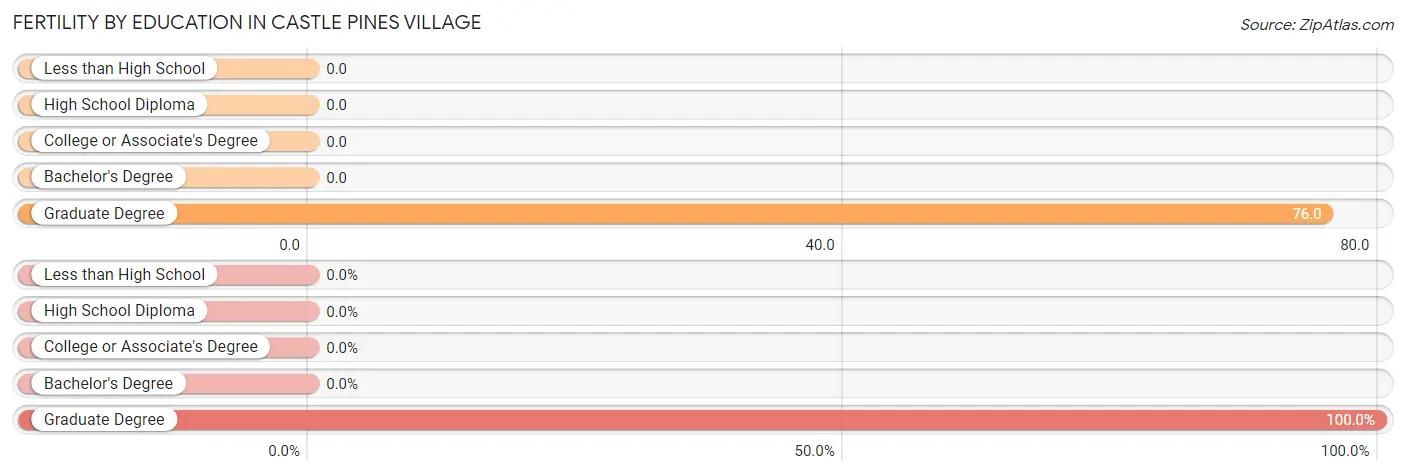
| Educational Attainment | Women with Births | Births / 1,000 Women |
| Less than High School | 0 (0.0%) | 0.0 |
| High School Diploma | 0 (0.0%) | 0.0 |
| College or Associate's Degree | 0 (0.0%) | 0.0 |
| Bachelor's Degree | 0 (0.0%) | 0.0 |
| Graduate Degree | 10 (100.0%) | 76.0 |
| Total | 10 (100.0%) | 12.0 |
Fertility by Education by Marriage Status in Castle Pines Village
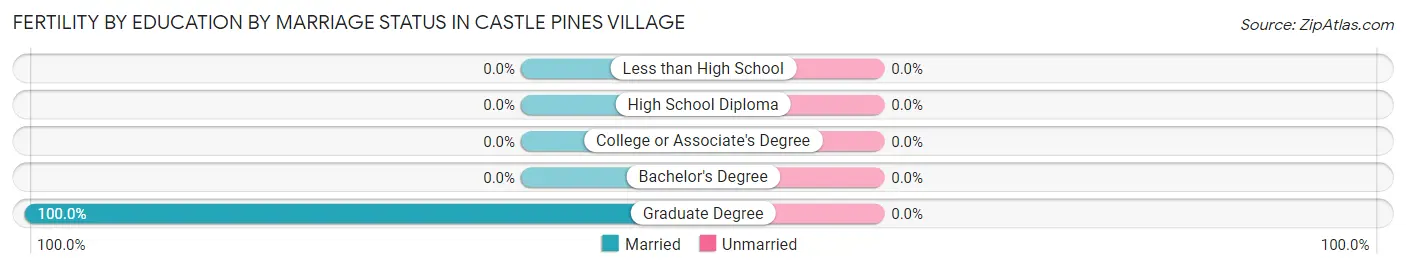
| Educational Attainment | Married | Unmarried |
| Less than High School | 0 (0.0%) | 0 (0.0%) |
| High School Diploma | 0 (0.0%) | 0 (0.0%) |
| College or Associate's Degree | 0 (0.0%) | 0 (0.0%) |
| Bachelor's Degree | 0 (0.0%) | 0 (0.0%) |
| Graduate Degree | 10 (100.0%) | 0 (0.0%) |
| Total | 10 (100.0%) | 0 (0.0%) |
Employment Characteristics in Castle Pines Village
Employment by Class of Employer in Castle Pines Village
Among the 2,065 employed individuals in Castle Pines Village, private company employees (1,366 | 66.1%), self-employed (incorporated) (260 | 12.6%), and not-for-profit organizations (170 | 8.2%) make up the most common classes of employment.
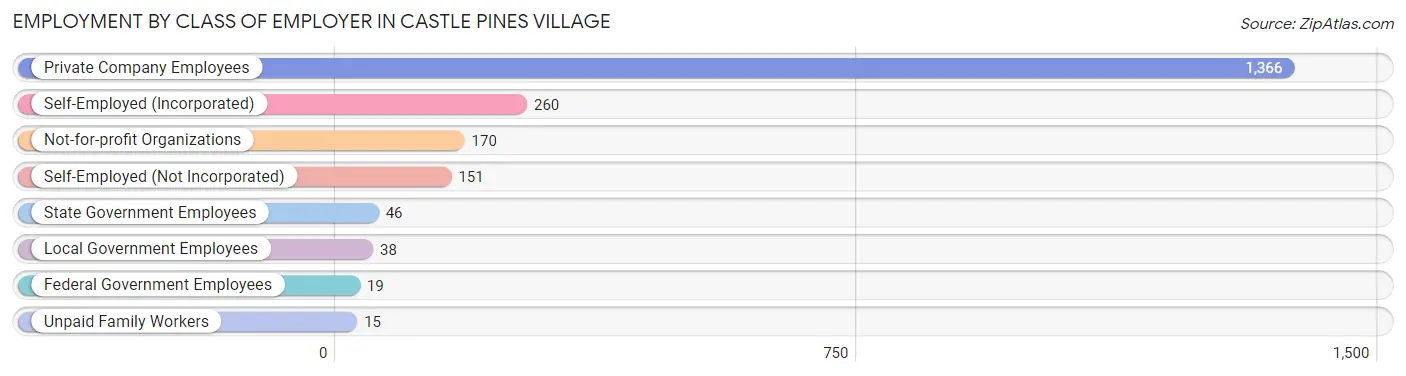
| Employer Class | # Employees | % Employees |
| Private Company Employees | 1,366 | 66.1% |
| Self-Employed (Incorporated) | 260 | 12.6% |
| Self-Employed (Not Incorporated) | 151 | 7.3% |
| Not-for-profit Organizations | 170 | 8.2% |
| Local Government Employees | 38 | 1.8% |
| State Government Employees | 46 | 2.2% |
| Federal Government Employees | 19 | 0.9% |
| Unpaid Family Workers | 15 | 0.7% |
| Total | 2,065 | 100.0% |
Employment Status by Age in Castle Pines Village
According to the labor force statistics for Castle Pines Village, out of the total population over 16 years of age (3,842), 57.0% or 2,190 individuals are in the labor force, with 5.7% or 125 of them unemployed. The age group with the highest labor force participation rate is 25 to 29 years, with 100.0% or 84 individuals in the labor force. Within the labor force, the 25 to 29 years age range has the highest percentage of unemployed individuals, with 23.8% or 20 of them being unemployed.
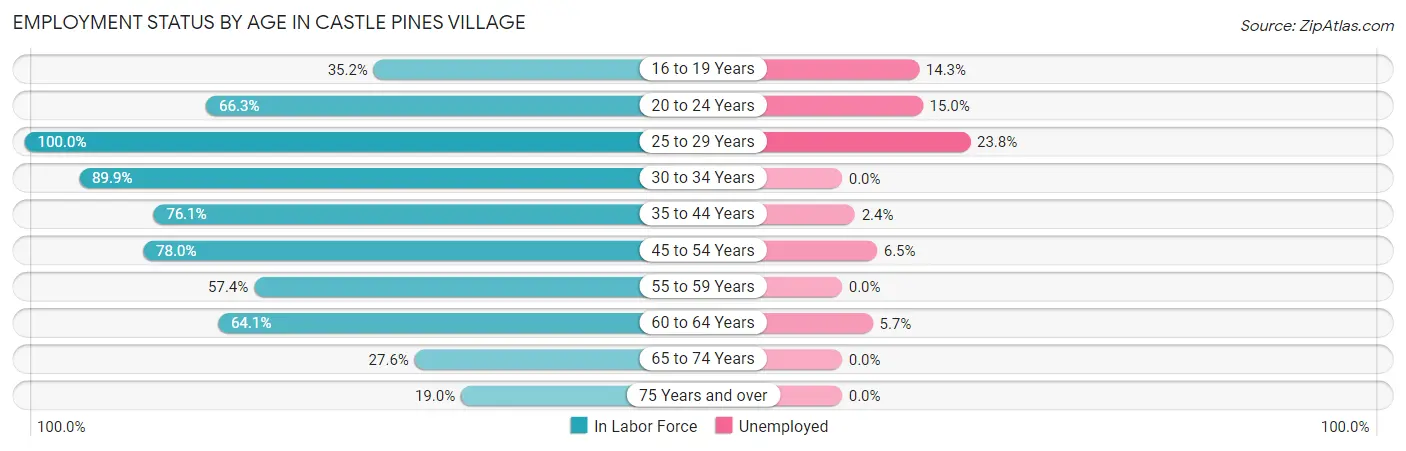
| Age Bracket | In Labor Force | Unemployed |
| 16 to 19 Years | 112 (35.2%) | 16 (14.3%) |
| 20 to 24 Years | 120 (66.3%) | 18 (15.0%) |
| 25 to 29 Years | 84 (100.0%) | 20 (23.8%) |
| 30 to 34 Years | 107 (89.9%) | 0 (0.0%) |
| 35 to 44 Years | 248 (76.1%) | 6 (2.4%) |
| 45 to 54 Years | 726 (78.0%) | 47 (6.5%) |
| 55 to 59 Years | 233 (57.4%) | 0 (0.0%) |
| 60 to 64 Years | 316 (64.1%) | 18 (5.7%) |
| 65 to 74 Years | 183 (27.6%) | 0 (0.0%) |
| 75 Years and over | 61 (19.0%) | 0 (0.0%) |
| Total | 2,190 (57.0%) | 125 (5.7%) |
Employment Status by Educational Attainment in Castle Pines Village
According to labor force statistics for Castle Pines Village, 72.7% of individuals (1,715) out of the total population between 25 and 64 years of age (2,359) are in the labor force, with 5.3% or 91 of them being unemployed. The group with the highest labor force participation rate are those with the educational attainment of less than high school, with 100.0% or 12 individuals in the labor force. Within the labor force, individuals with bachelor's degree or higher education have the highest percentage of unemployment, with 6.1% or 91 of them being unemployed.
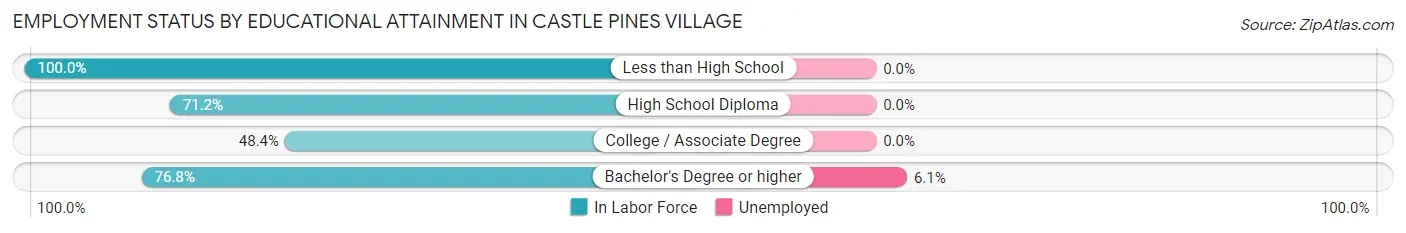
| Educational Attainment | In Labor Force | Unemployed |
| Less than High School | 12 (100.0%) | 0 (0.0%) |
| High School Diploma | 37 (71.2%) | 0 (0.0%) |
| College / Associate Degree | 166 (48.4%) | 0 (0.0%) |
| Bachelor's Degree or higher | 1,499 (76.8%) | 119 (6.1%) |
| Total | 1,715 (72.7%) | 125 (5.3%) |
Employment Occupations by Sex in Castle Pines Village
Management, Business, Science and Arts Occupations
The most common Management, Business, Science and Arts occupations in Castle Pines Village are Management (831 | 40.2%), Business & Financial (227 | 11.0%), Community & Social Service (170 | 8.2%), Computers, Engineering & Science (133 | 6.4%), and Health Diagnosing & Treating (93 | 4.5%).
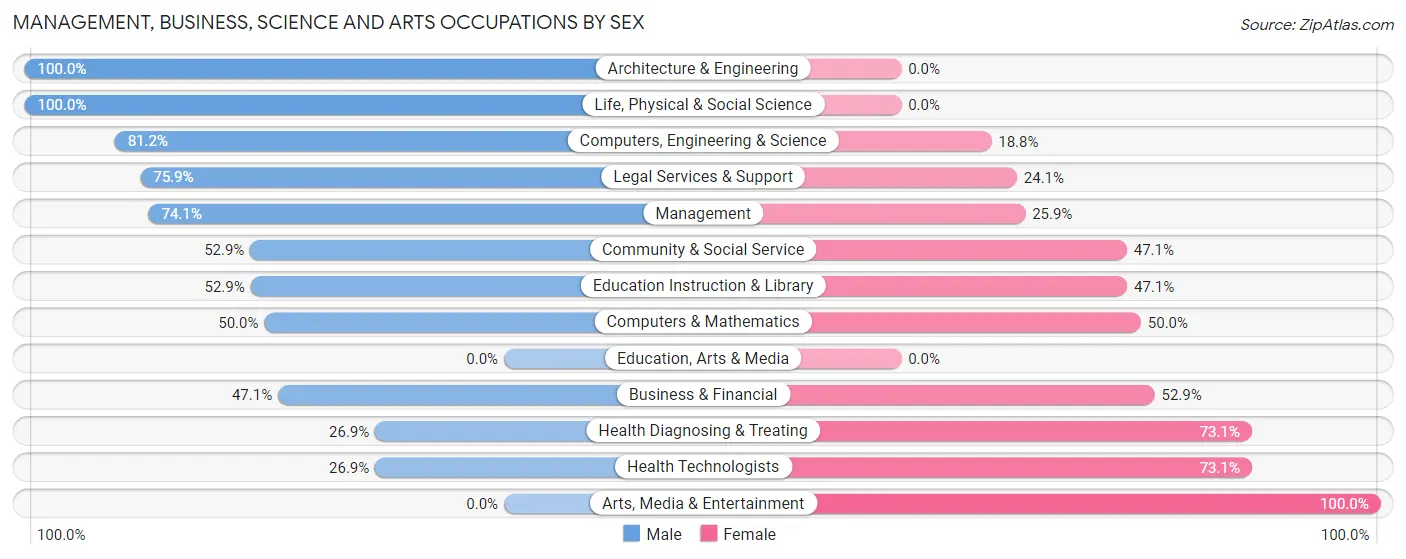
Management, Business, Science and Arts Occupations by Sex
Within the Management, Business, Science and Arts occupations in Castle Pines Village, the most male-oriented occupations are Architecture & Engineering (100.0%), Life, Physical & Social Science (100.0%), and Computers, Engineering & Science (81.2%), while the most female-oriented occupations are Arts, Media & Entertainment (100.0%), Health Diagnosing & Treating (73.1%), and Health Technologists (73.1%).
| Occupation | Male | Female |
| Management | 616 (74.1%) | 215 (25.9%) |
| Business & Financial | 107 (47.1%) | 120 (52.9%) |
| Computers, Engineering & Science | 108 (81.2%) | 25 (18.8%) |
| Computers & Mathematics | 25 (50.0%) | 25 (50.0%) |
| Architecture & Engineering | 63 (100.0%) | 0 (0.0%) |
| Life, Physical & Social Science | 20 (100.0%) | 0 (0.0%) |
| Community & Social Service | 90 (52.9%) | 80 (47.1%) |
| Education, Arts & Media | 0 (0.0%) | 0 (0.0%) |
| Legal Services & Support | 44 (75.9%) | 14 (24.1%) |
| Education Instruction & Library | 46 (52.9%) | 41 (47.1%) |
| Arts, Media & Entertainment | 0 (0.0%) | 25 (100.0%) |
| Health Diagnosing & Treating | 25 (26.9%) | 68 (73.1%) |
| Health Technologists | 25 (26.9%) | 68 (73.1%) |
| Total (Category) | 946 (65.1%) | 508 (34.9%) |
| Total (Overall) | 1,306 (63.2%) | 759 (36.8%) |
Services Occupations
The most common Services occupations in Castle Pines Village are Personal Care & Service (58 | 2.8%), Food Preparation & Serving (47 | 2.3%), Healthcare Support (23 | 1.1%), Security & Protection (4 | 0.2%), and Law Enforcement (4 | 0.2%).
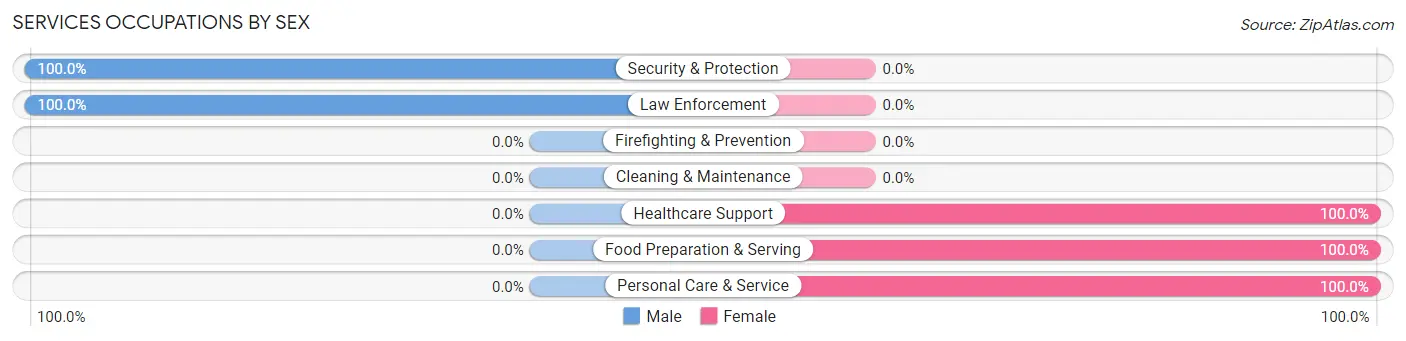
Services Occupations by Sex
Within the Services occupations in Castle Pines Village, the most male-oriented occupations are Security & Protection (100.0%), and Law Enforcement (100.0%), while the most female-oriented occupations are Healthcare Support (100.0%), Food Preparation & Serving (100.0%), and Personal Care & Service (100.0%).
| Occupation | Male | Female |
| Healthcare Support | 0 (0.0%) | 23 (100.0%) |
| Security & Protection | 4 (100.0%) | 0 (0.0%) |
| Firefighting & Prevention | 0 (0.0%) | 0 (0.0%) |
| Law Enforcement | 4 (100.0%) | 0 (0.0%) |
| Food Preparation & Serving | 0 (0.0%) | 47 (100.0%) |
| Cleaning & Maintenance | 0 (0.0%) | 0 (0.0%) |
| Personal Care & Service | 0 (0.0%) | 58 (100.0%) |
| Total (Category) | 4 (3.0%) | 128 (97.0%) |
| Total (Overall) | 1,306 (63.2%) | 759 (36.8%) |
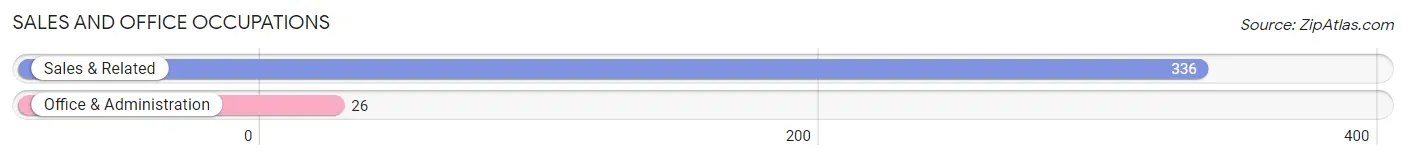
Sales and Office Occupations
The most common Sales and Office occupations in Castle Pines Village are Sales & Related (336 | 16.3%), and Office & Administration (26 | 1.3%).
Sales and Office Occupations by Sex
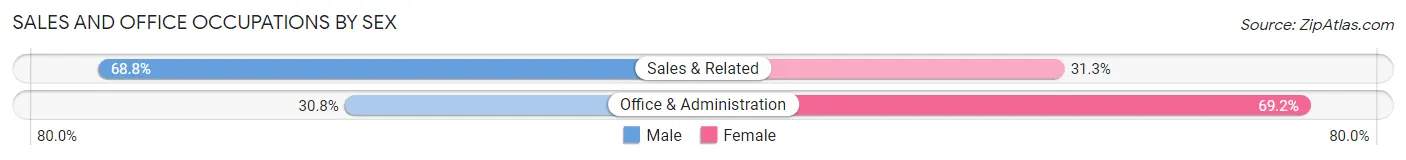
| Occupation | Male | Female |
| Sales & Related | 231 (68.8%) | 105 (31.2%) |
| Office & Administration | 8 (30.8%) | 18 (69.2%) |
| Total (Category) | 239 (66.0%) | 123 (34.0%) |
| Total (Overall) | 1,306 (63.2%) | 759 (36.8%) |
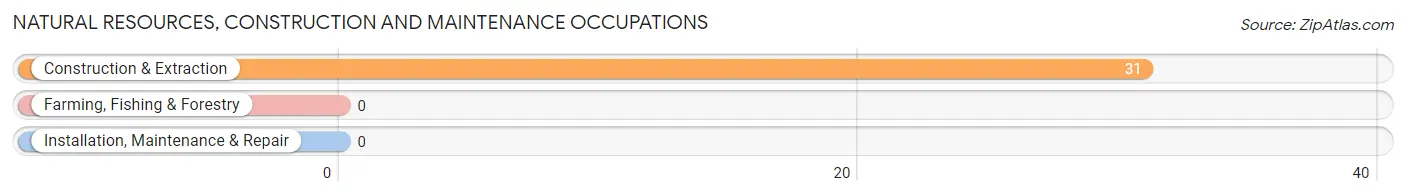
Natural Resources, Construction and Maintenance Occupations
The most common Natural Resources, Construction and Maintenance occupations in Castle Pines Village are , and Construction & Extraction (31 | 1.5%).
Natural Resources, Construction and Maintenance Occupations by Sex
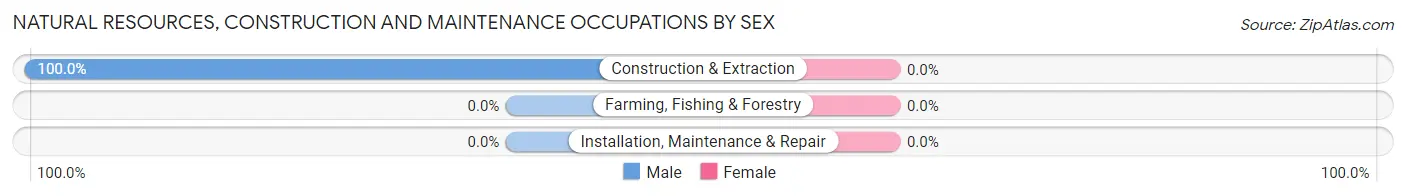
| Occupation | Male | Female |
| Farming, Fishing & Forestry | 0 (0.0%) | 0 (0.0%) |
| Construction & Extraction | 31 (100.0%) | 0 (0.0%) |
| Installation, Maintenance & Repair | 0 (0.0%) | 0 (0.0%) |
| Total (Category) | 31 (100.0%) | 0 (0.0%) |
| Total (Overall) | 1,306 (63.2%) | 759 (36.8%) |
Production, Transportation and Moving Occupations
The most common Production, Transportation and Moving occupations in Castle Pines Village are Material Moving (47 | 2.3%), Production (30 | 1.5%), and Transportation (9 | 0.4%).
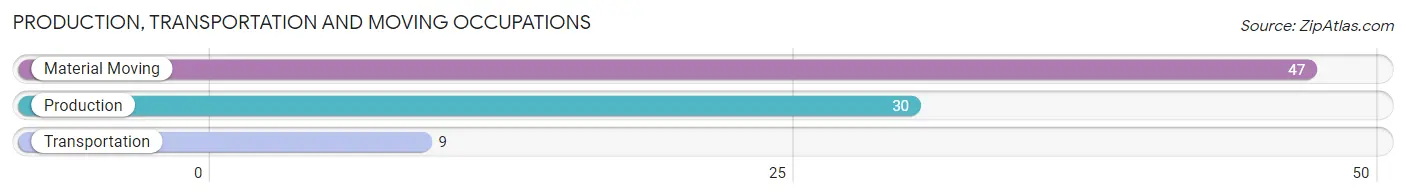
Production, Transportation and Moving Occupations by Sex
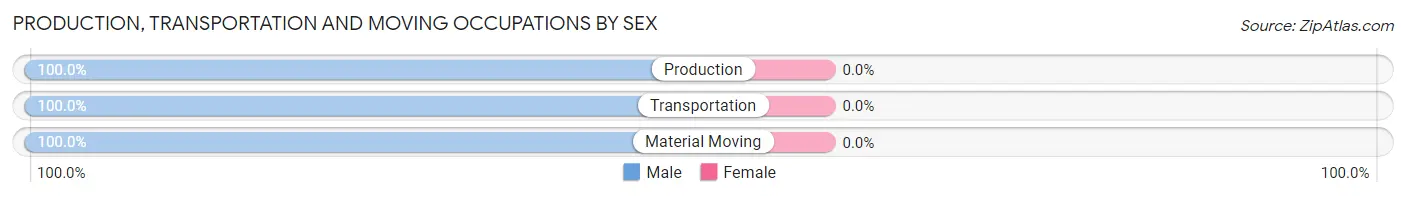
| Occupation | Male | Female |
| Production | 30 (100.0%) | 0 (0.0%) |
| Transportation | 9 (100.0%) | 0 (0.0%) |
| Material Moving | 47 (100.0%) | 0 (0.0%) |
| Total (Category) | 86 (100.0%) | 0 (0.0%) |
| Total (Overall) | 1,306 (63.2%) | 759 (36.8%) |
Employment Industries by Sex in Castle Pines Village
Employment Industries in Castle Pines Village
The major employment industries in Castle Pines Village include Professional & Scientific (678 | 32.8%), Health Care & Social Assistance (187 | 9.1%), Finance & Insurance (177 | 8.6%), Educational Services (159 | 7.7%), and Construction (126 | 6.1%).
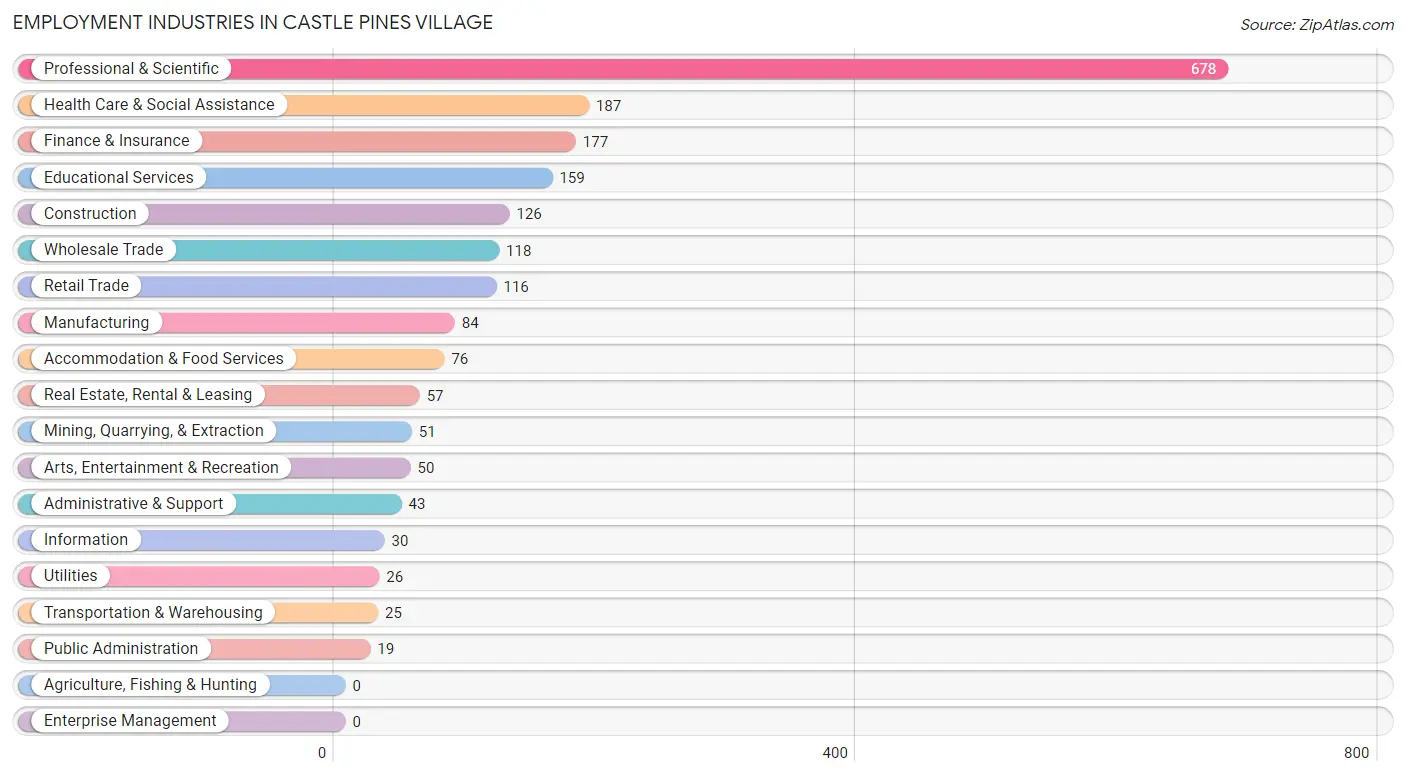
Employment Industries by Sex in Castle Pines Village
The Castle Pines Village industries that see more men than women are Public Administration (100.0%), Wholesale Trade (94.9%), and Manufacturing (85.7%), whereas the industries that tend to have a higher number of women are Educational Services (87.4%), Accommodation & Food Services (86.8%), and Arts, Entertainment & Recreation (76.0%).
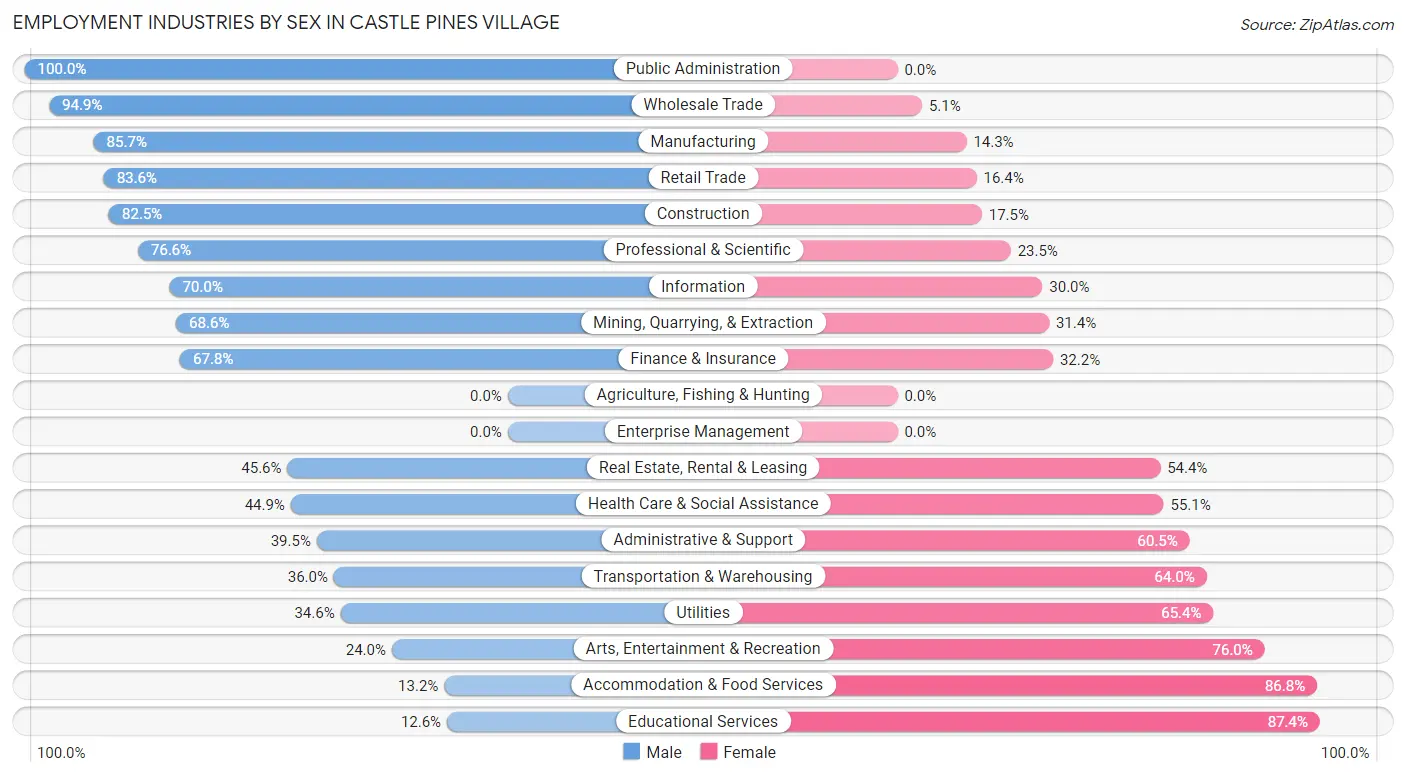
| Industry | Male | Female |
| Agriculture, Fishing & Hunting | 0 (0.0%) | 0 (0.0%) |
| Mining, Quarrying, & Extraction | 35 (68.6%) | 16 (31.4%) |
| Construction | 104 (82.5%) | 22 (17.5%) |
| Manufacturing | 72 (85.7%) | 12 (14.3%) |
| Wholesale Trade | 112 (94.9%) | 6 (5.1%) |
| Retail Trade | 97 (83.6%) | 19 (16.4%) |
| Transportation & Warehousing | 9 (36.0%) | 16 (64.0%) |
| Utilities | 9 (34.6%) | 17 (65.4%) |
| Information | 21 (70.0%) | 9 (30.0%) |
| Finance & Insurance | 120 (67.8%) | 57 (32.2%) |
| Real Estate, Rental & Leasing | 26 (45.6%) | 31 (54.4%) |
| Professional & Scientific | 519 (76.5%) | 159 (23.4%) |
| Enterprise Management | 0 (0.0%) | 0 (0.0%) |
| Administrative & Support | 17 (39.5%) | 26 (60.5%) |
| Educational Services | 20 (12.6%) | 139 (87.4%) |
| Health Care & Social Assistance | 84 (44.9%) | 103 (55.1%) |
| Arts, Entertainment & Recreation | 12 (24.0%) | 38 (76.0%) |
| Accommodation & Food Services | 10 (13.2%) | 66 (86.8%) |
| Public Administration | 19 (100.0%) | 0 (0.0%) |
| Total | 1,306 (63.2%) | 759 (36.8%) |
Education in Castle Pines Village
School Enrollment in Castle Pines Village
The most common levels of schooling among the 968 students in Castle Pines Village are high school (418 | 43.2%), elementary school (187 | 19.3%), and college / undergraduate (136 | 14.1%).
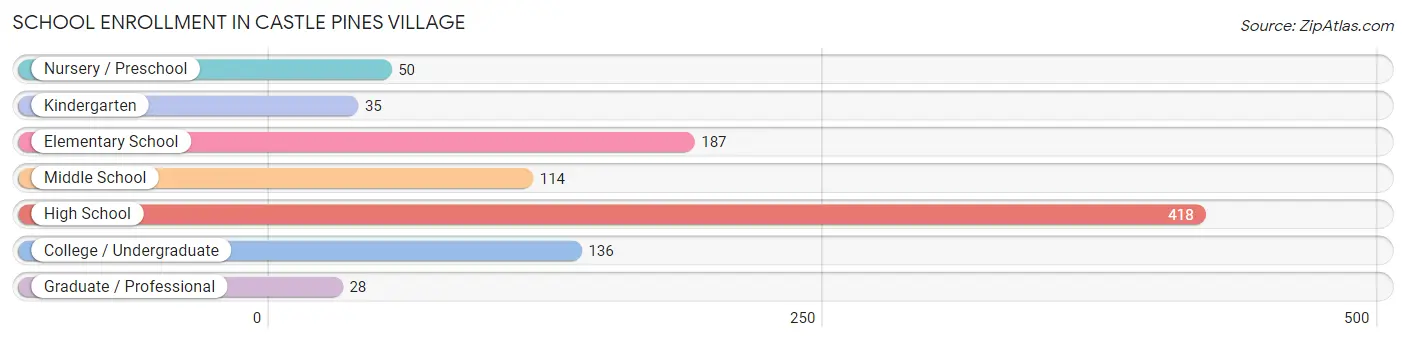
| School Level | # Students | % Students |
| Nursery / Preschool | 50 | 5.2% |
| Kindergarten | 35 | 3.6% |
| Elementary School | 187 | 19.3% |
| Middle School | 114 | 11.8% |
| High School | 418 | 43.2% |
| College / Undergraduate | 136 | 14.1% |
| Graduate / Professional | 28 | 2.9% |
| Total | 968 | 100.0% |
School Enrollment by Age by Funding Source in Castle Pines Village
Out of a total of 968 students who are enrolled in schools in Castle Pines Village, 250 (25.8%) attend a private institution, while the remaining 718 (74.2%) are enrolled in public schools. The age group of 25 to 34 year olds has the highest likelihood of being enrolled in private schools, with 3 (100.0% in the age bracket) enrolled. Conversely, the age group of 20 to 24 year olds has the lowest likelihood of being enrolled in a private school, with 61 (100.0% in the age bracket) attending a public institution.
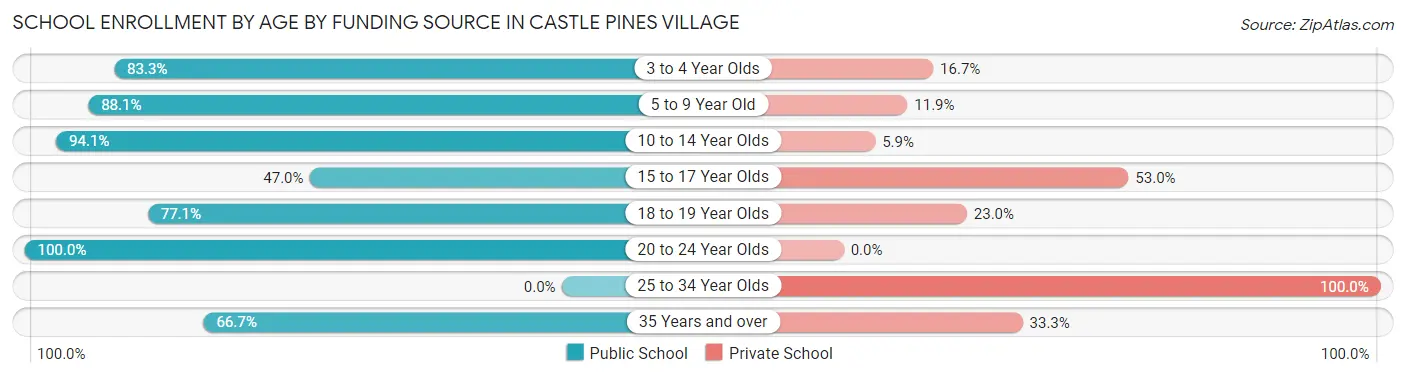
| Age Bracket | Public School | Private School |
| 3 to 4 Year Olds | 35 (83.3%) | 7 (16.7%) |
| 5 to 9 Year Old | 171 (88.1%) | 23 (11.9%) |
| 10 to 14 Year Olds | 176 (94.1%) | 11 (5.9%) |
| 15 to 17 Year Olds | 139 (47.0%) | 157 (53.0%) |
| 18 to 19 Year Olds | 94 (77.0%) | 28 (23.0%) |
| 20 to 24 Year Olds | 61 (100.0%) | 0 (0.0%) |
| 25 to 34 Year Olds | 0 (0.0%) | 3 (100.0%) |
| 35 Years and over | 42 (66.7%) | 21 (33.3%) |
| Total | 718 (74.2%) | 250 (25.8%) |
Educational Attainment by Field of Study in Castle Pines Village
Business (764 | 25.9%), social sciences (368 | 12.4%), engineering (255 | 8.6%), psychology (245 | 8.3%), and computers & mathematics (215 | 7.3%) are the most common fields of study among 2,955 individuals in Castle Pines Village who have obtained a bachelor's degree or higher.
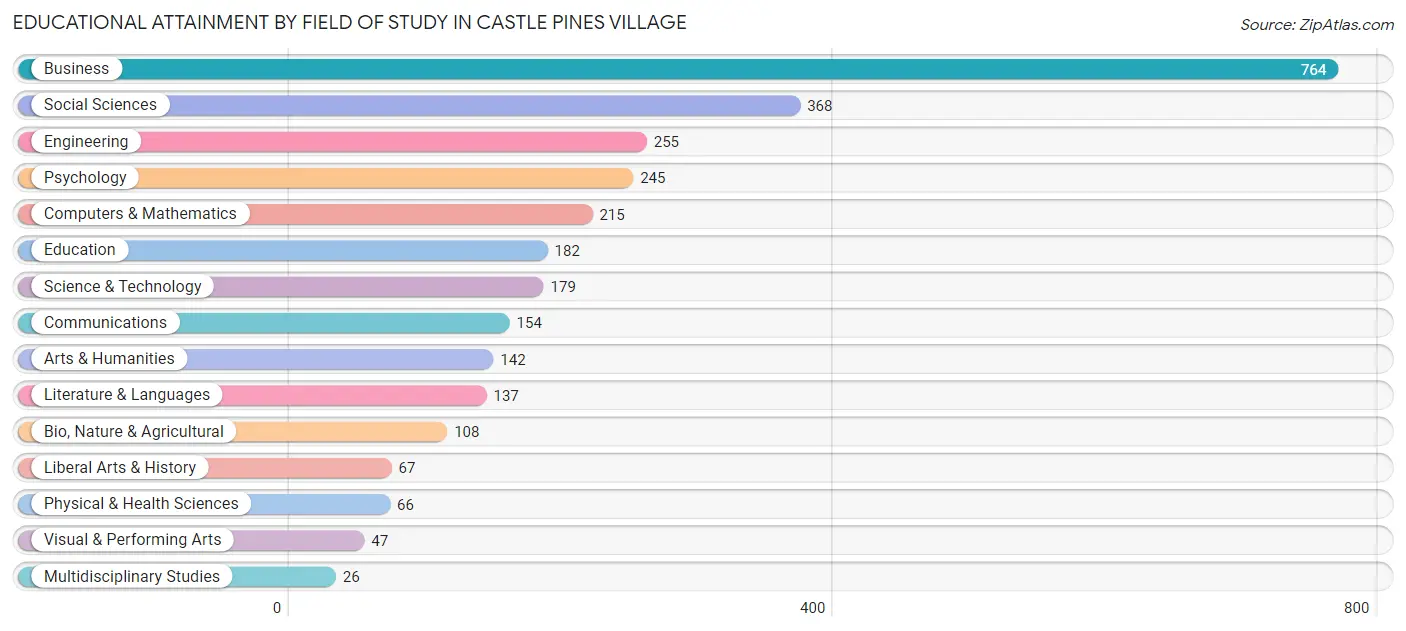
| Field of Study | # Graduates | % Graduates |
| Computers & Mathematics | 215 | 7.3% |
| Bio, Nature & Agricultural | 108 | 3.6% |
| Physical & Health Sciences | 66 | 2.2% |
| Psychology | 245 | 8.3% |
| Social Sciences | 368 | 12.4% |
| Engineering | 255 | 8.6% |
| Multidisciplinary Studies | 26 | 0.9% |
| Science & Technology | 179 | 6.1% |
| Business | 764 | 25.9% |
| Education | 182 | 6.2% |
| Literature & Languages | 137 | 4.6% |
| Liberal Arts & History | 67 | 2.3% |
| Visual & Performing Arts | 47 | 1.6% |
| Communications | 154 | 5.2% |
| Arts & Humanities | 142 | 4.8% |
| Total | 2,955 | 100.0% |
Transportation & Commute in Castle Pines Village
Vehicle Availability by Sex in Castle Pines Village
The most prevalent vehicle ownership categories in Castle Pines Village are males with 2 vehicles (564, accounting for 43.2%) and females with 2 vehicles (359, making up 74.3%).
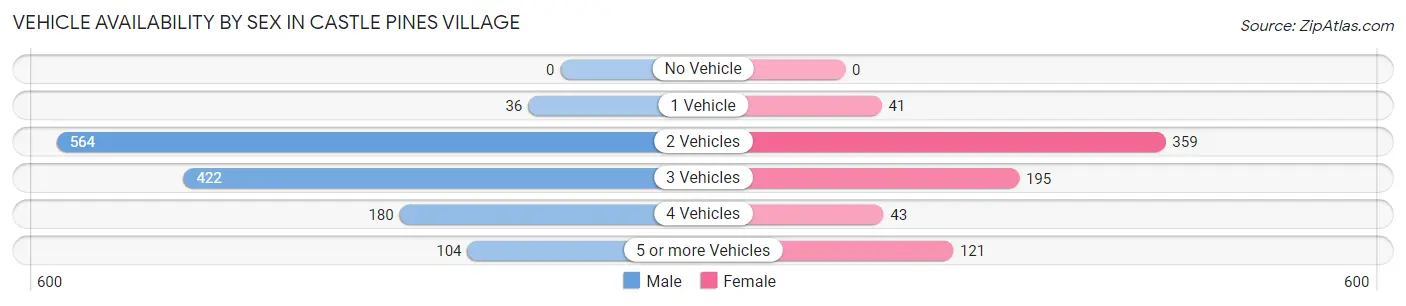
| Vehicles Available | Male | Female |
| No Vehicle | 0 (0.0%) | 0 (0.0%) |
| 1 Vehicle | 36 (2.8%) | 41 (5.4%) |
| 2 Vehicles | 564 (43.2%) | 359 (47.3%) |
| 3 Vehicles | 422 (32.3%) | 195 (25.7%) |
| 4 Vehicles | 180 (13.8%) | 43 (5.7%) |
| 5 or more Vehicles | 104 (8.0%) | 121 (15.9%) |
| Total | 1,306 (100.0%) | 759 (100.0%) |
Commute Time in Castle Pines Village
The most frequently occuring commute durations in Castle Pines Village are 15 to 19 minutes (271 commuters, 21.3%), 20 to 24 minutes (263 commuters, 20.7%), and 25 to 29 minutes (240 commuters, 18.9%).
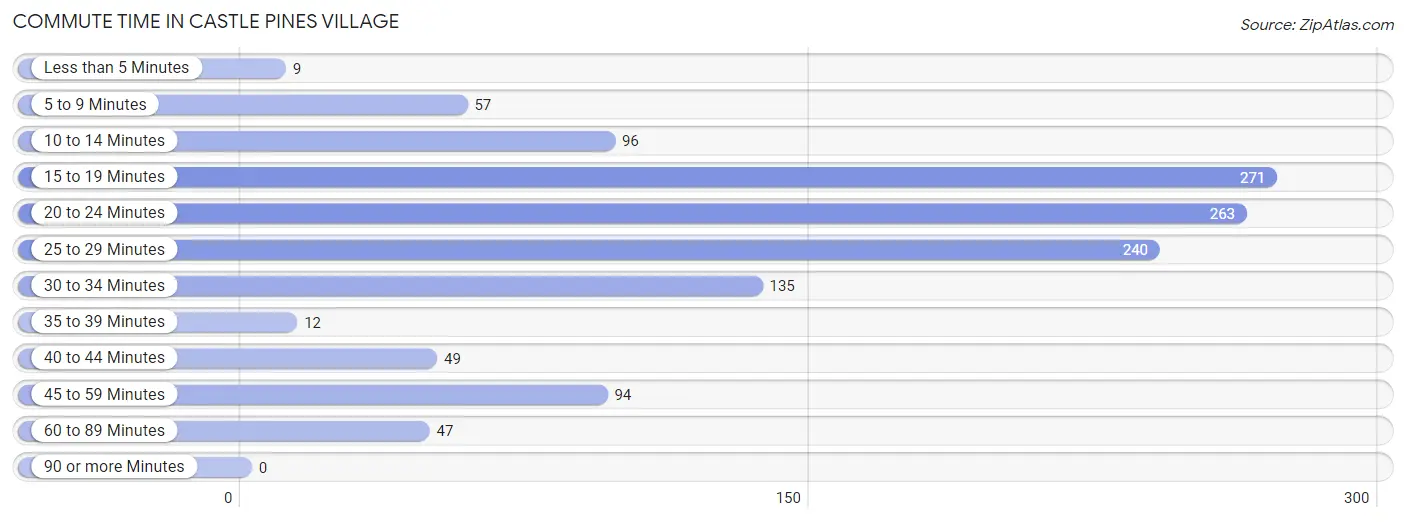
| Commute Time | # Commuters | % Commuters |
| Less than 5 Minutes | 9 | 0.7% |
| 5 to 9 Minutes | 57 | 4.5% |
| 10 to 14 Minutes | 96 | 7.5% |
| 15 to 19 Minutes | 271 | 21.3% |
| 20 to 24 Minutes | 263 | 20.7% |
| 25 to 29 Minutes | 240 | 18.9% |
| 30 to 34 Minutes | 135 | 10.6% |
| 35 to 39 Minutes | 12 | 0.9% |
| 40 to 44 Minutes | 49 | 3.8% |
| 45 to 59 Minutes | 94 | 7.4% |
| 60 to 89 Minutes | 47 | 3.7% |
| 90 or more Minutes | 0 | 0.0% |
Commute Time by Sex in Castle Pines Village
The most common commute times in Castle Pines Village are 20 to 24 minutes (224 commuters, 26.2%) for males and 15 to 19 minutes (93 commuters, 22.3%) for females.
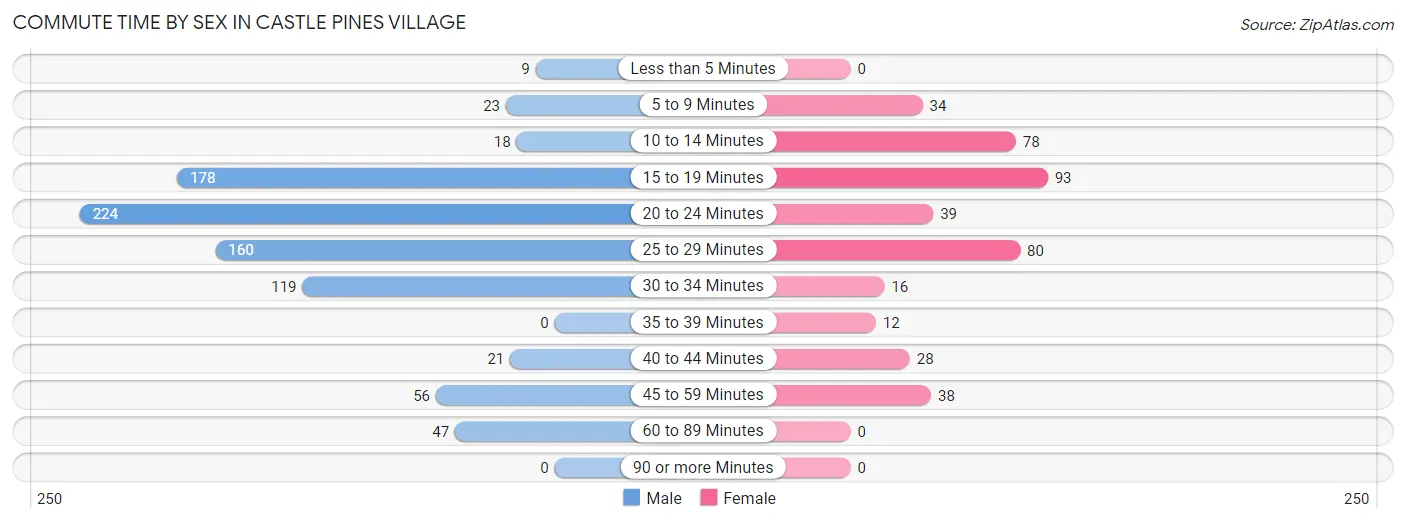
| Commute Time | Male | Female |
| Less than 5 Minutes | 9 (1.1%) | 0 (0.0%) |
| 5 to 9 Minutes | 23 (2.7%) | 34 (8.1%) |
| 10 to 14 Minutes | 18 (2.1%) | 78 (18.7%) |
| 15 to 19 Minutes | 178 (20.8%) | 93 (22.3%) |
| 20 to 24 Minutes | 224 (26.2%) | 39 (9.3%) |
| 25 to 29 Minutes | 160 (18.7%) | 80 (19.1%) |
| 30 to 34 Minutes | 119 (13.9%) | 16 (3.8%) |
| 35 to 39 Minutes | 0 (0.0%) | 12 (2.9%) |
| 40 to 44 Minutes | 21 (2.5%) | 28 (6.7%) |
| 45 to 59 Minutes | 56 (6.6%) | 38 (9.1%) |
| 60 to 89 Minutes | 47 (5.5%) | 0 (0.0%) |
| 90 or more Minutes | 0 (0.0%) | 0 (0.0%) |
Time of Departure to Work by Sex in Castle Pines Village
The most frequent times of departure to work in Castle Pines Village are 7:30 AM to 7:59 AM (217, 25.4%) for males and 7:00 AM to 7:29 AM (83, 19.9%) for females.
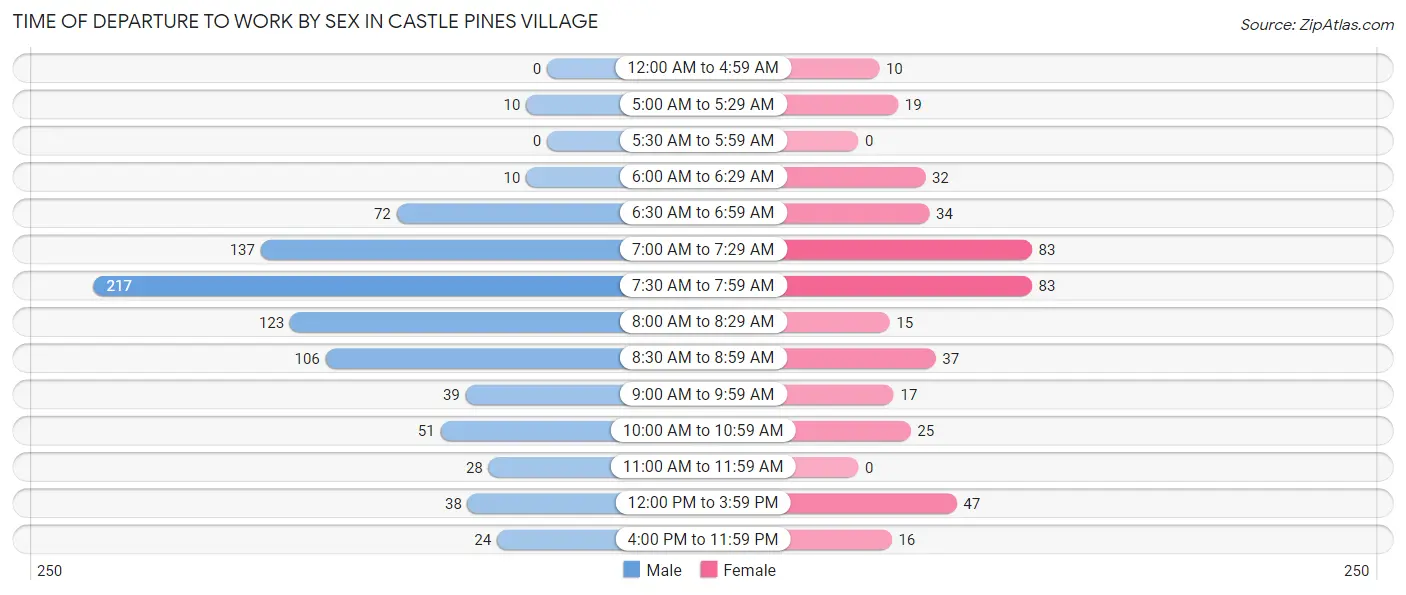
| Time of Departure | Male | Female |
| 12:00 AM to 4:59 AM | 0 (0.0%) | 10 (2.4%) |
| 5:00 AM to 5:29 AM | 10 (1.2%) | 19 (4.5%) |
| 5:30 AM to 5:59 AM | 0 (0.0%) | 0 (0.0%) |
| 6:00 AM to 6:29 AM | 10 (1.2%) | 32 (7.7%) |
| 6:30 AM to 6:59 AM | 72 (8.4%) | 34 (8.1%) |
| 7:00 AM to 7:29 AM | 137 (16.0%) | 83 (19.9%) |
| 7:30 AM to 7:59 AM | 217 (25.4%) | 83 (19.9%) |
| 8:00 AM to 8:29 AM | 123 (14.4%) | 15 (3.6%) |
| 8:30 AM to 8:59 AM | 106 (12.4%) | 37 (8.8%) |
| 9:00 AM to 9:59 AM | 39 (4.6%) | 17 (4.1%) |
| 10:00 AM to 10:59 AM | 51 (6.0%) | 25 (6.0%) |
| 11:00 AM to 11:59 AM | 28 (3.3%) | 0 (0.0%) |
| 12:00 PM to 3:59 PM | 38 (4.4%) | 47 (11.2%) |
| 4:00 PM to 11:59 PM | 24 (2.8%) | 16 (3.8%) |
| Total | 855 (100.0%) | 418 (100.0%) |
Housing Occupancy in Castle Pines Village
Occupancy by Ownership in Castle Pines Village
Of the total 1,657 dwellings in Castle Pines Village, owner-occupied units account for 1,650 (99.6%), while renter-occupied units make up 7 (0.4%).
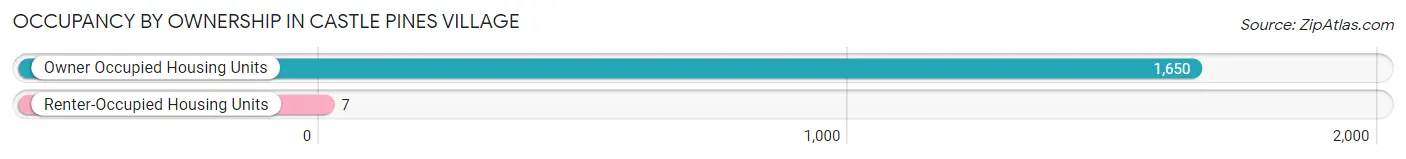
| Occupancy | # Housing Units | % Housing Units |
| Owner Occupied Housing Units | 1,650 | 99.6% |
| Renter-Occupied Housing Units | 7 | 0.4% |
| Total Occupied Housing Units | 1,657 | 100.0% |
Occupancy by Household Size in Castle Pines Village
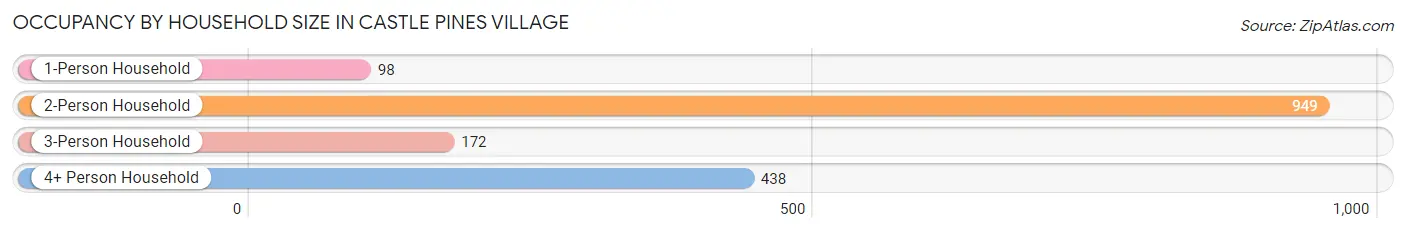
| Household Size | # Housing Units | % Housing Units |
| 1-Person Household | 98 | 5.9% |
| 2-Person Household | 949 | 57.3% |
| 3-Person Household | 172 | 10.4% |
| 4+ Person Household | 438 | 26.4% |
| Total Housing Units | 1,657 | 100.0% |
Occupancy by Ownership by Household Size in Castle Pines Village
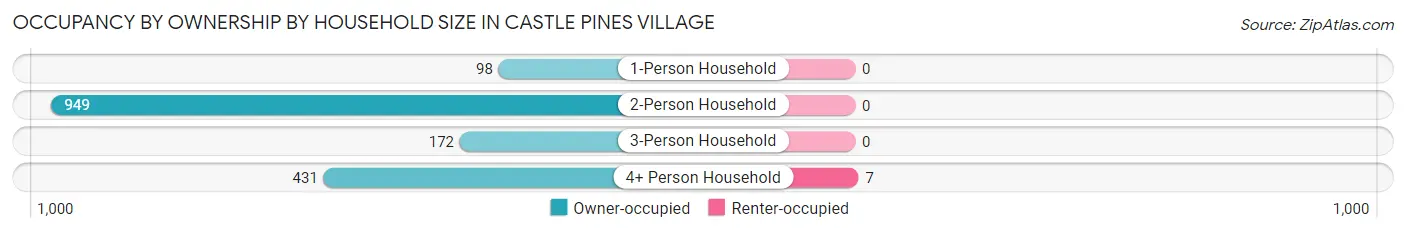
| Household Size | Owner-occupied | Renter-occupied |
| 1-Person Household | 98 (100.0%) | 0 (0.0%) |
| 2-Person Household | 949 (100.0%) | 0 (0.0%) |
| 3-Person Household | 172 (100.0%) | 0 (0.0%) |
| 4+ Person Household | 431 (98.4%) | 7 (1.6%) |
| Total Housing Units | 1,650 (99.6%) | 7 (0.4%) |
Occupancy by Educational Attainment in Castle Pines Village
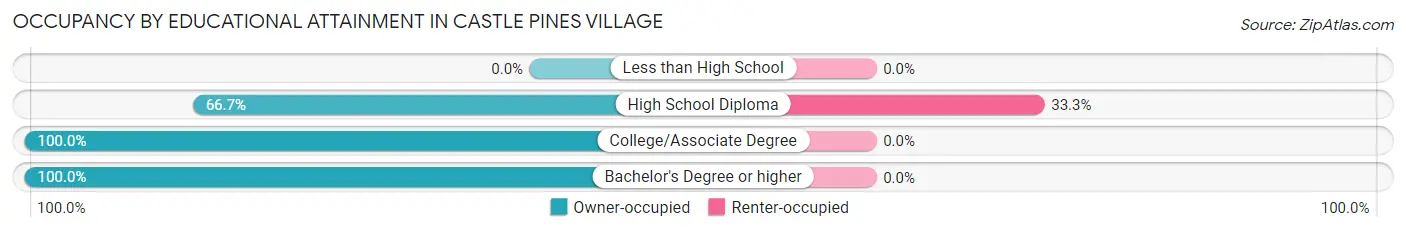
| Household Size | Owner-occupied | Renter-occupied |
| Less than High School | 0 (0.0%) | 0 (0.0%) |
| High School Diploma | 14 (66.7%) | 7 (33.3%) |
| College/Associate Degree | 231 (100.0%) | 0 (0.0%) |
| Bachelor's Degree or higher | 1,405 (100.0%) | 0 (0.0%) |
Occupancy by Age of Householder in Castle Pines Village
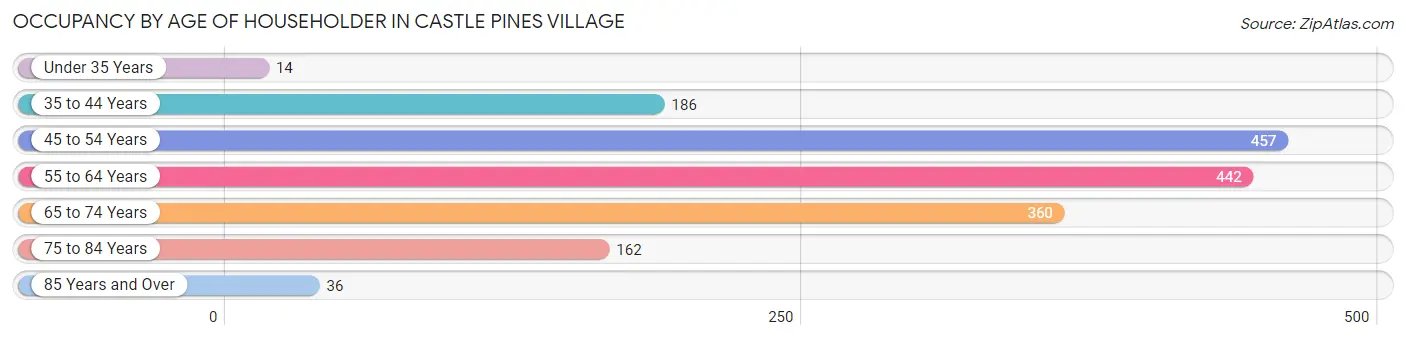
| Age Bracket | # Households | % Households |
| Under 35 Years | 14 | 0.8% |
| 35 to 44 Years | 186 | 11.2% |
| 45 to 54 Years | 457 | 27.6% |
| 55 to 64 Years | 442 | 26.7% |
| 65 to 74 Years | 360 | 21.7% |
| 75 to 84 Years | 162 | 9.8% |
| 85 Years and Over | 36 | 2.2% |
| Total | 1,657 | 100.0% |
Housing Finances in Castle Pines Village
Median Income by Occupancy in Castle Pines Village
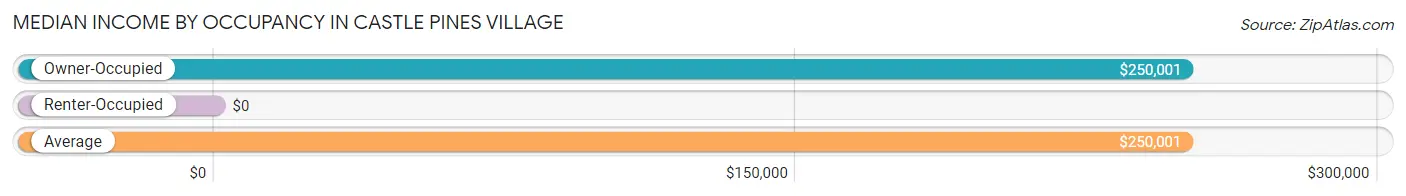
| Occupancy Type | # Households | Median Income |
| Owner-Occupied | 1,650 (99.6%) | $250,001 |
| Renter-Occupied | 7 (0.4%) | $0 |
| Average | 1,657 (100.0%) | $250,001 |
Occupancy by Householder Income Bracket in Castle Pines Village
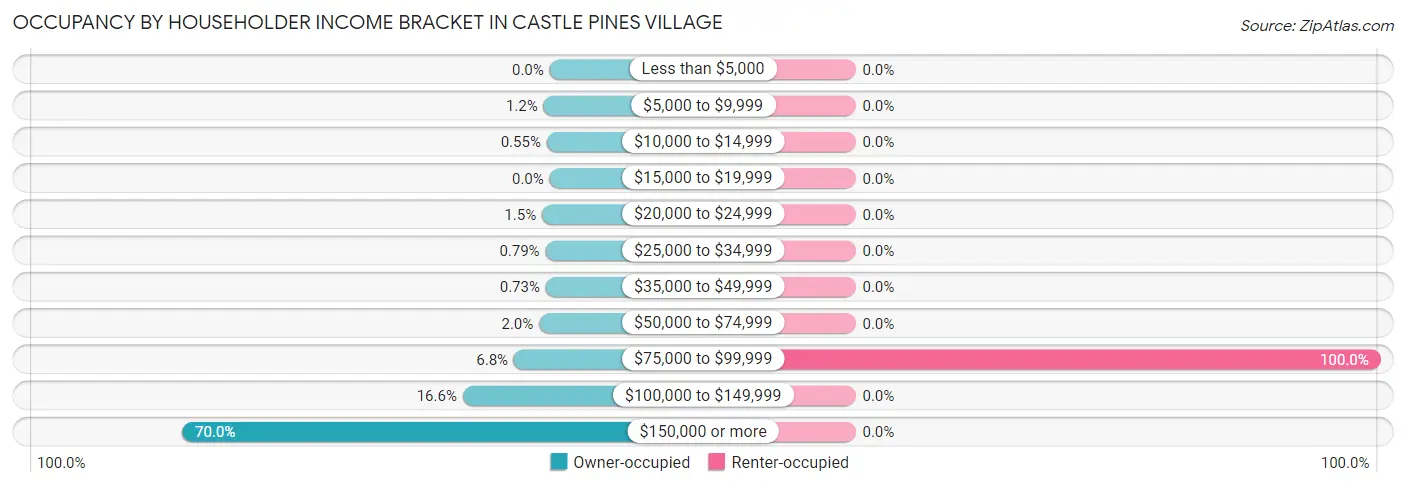
| Income Bracket | Owner-occupied | Renter-occupied |
| Less than $5,000 | 0 (0.0%) | 0 (0.0%) |
| $5,000 to $9,999 | 19 (1.1%) | 0 (0.0%) |
| $10,000 to $14,999 | 9 (0.5%) | 0 (0.0%) |
| $15,000 to $19,999 | 0 (0.0%) | 0 (0.0%) |
| $20,000 to $24,999 | 24 (1.5%) | 0 (0.0%) |
| $25,000 to $34,999 | 13 (0.8%) | 0 (0.0%) |
| $35,000 to $49,999 | 12 (0.7%) | 0 (0.0%) |
| $50,000 to $74,999 | 33 (2.0%) | 0 (0.0%) |
| $75,000 to $99,999 | 112 (6.8%) | 7 (100.0%) |
| $100,000 to $149,999 | 273 (16.6%) | 0 (0.0%) |
| $150,000 or more | 1,155 (70.0%) | 0 (0.0%) |
| Total | 1,650 (100.0%) | 7 (100.0%) |
Monthly Housing Cost Tiers in Castle Pines Village
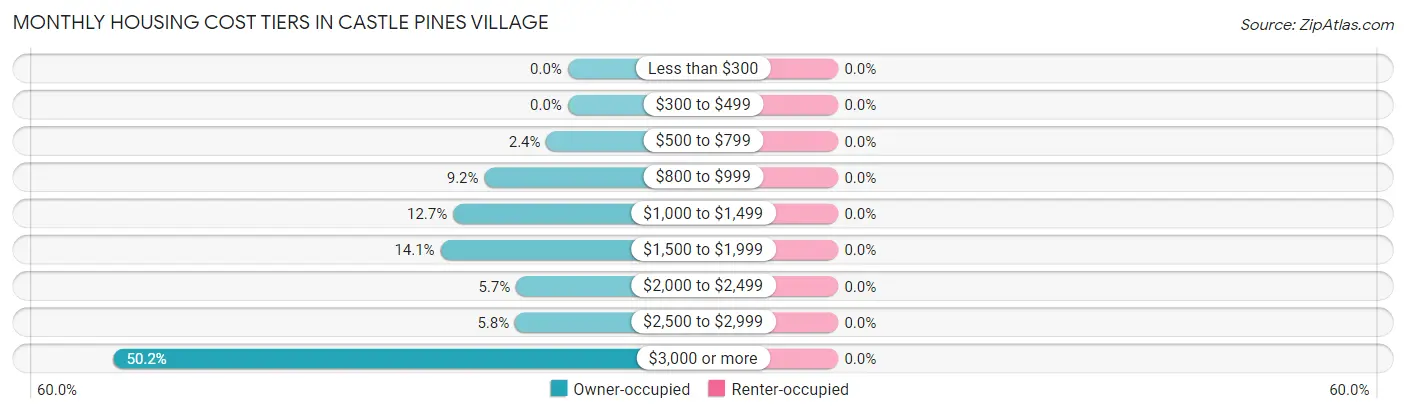
| Monthly Cost | Owner-occupied | Renter-occupied |
| Less than $300 | 0 (0.0%) | 0 (0.0%) |
| $300 to $499 | 0 (0.0%) | 0 (0.0%) |
| $500 to $799 | 39 (2.4%) | 0 (0.0%) |
| $800 to $999 | 152 (9.2%) | 0 (0.0%) |
| $1,000 to $1,499 | 209 (12.7%) | 0 (0.0%) |
| $1,500 to $1,999 | 232 (14.1%) | 0 (0.0%) |
| $2,000 to $2,499 | 94 (5.7%) | 0 (0.0%) |
| $2,500 to $2,999 | 96 (5.8%) | 0 (0.0%) |
| $3,000 or more | 828 (50.2%) | 0 (0.0%) |
| Total | 1,650 (100.0%) | 7 (100.0%) |
Physical Housing Characteristics in Castle Pines Village
Housing Structures in Castle Pines Village
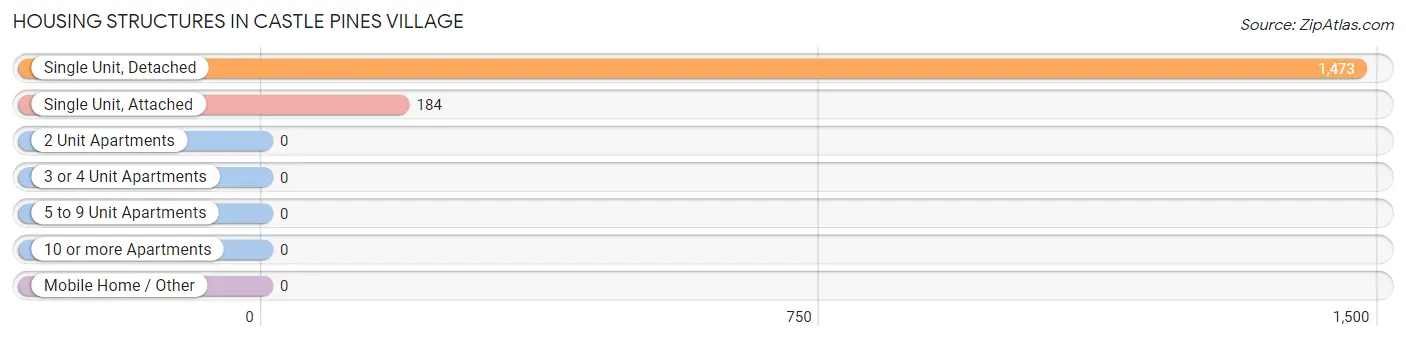
| Structure Type | # Housing Units | % Housing Units |
| Single Unit, Detached | 1,473 | 88.9% |
| Single Unit, Attached | 184 | 11.1% |
| 2 Unit Apartments | 0 | 0.0% |
| 3 or 4 Unit Apartments | 0 | 0.0% |
| 5 to 9 Unit Apartments | 0 | 0.0% |
| 10 or more Apartments | 0 | 0.0% |
| Mobile Home / Other | 0 | 0.0% |
| Total | 1,657 | 100.0% |
Housing Structures by Occupancy in Castle Pines Village
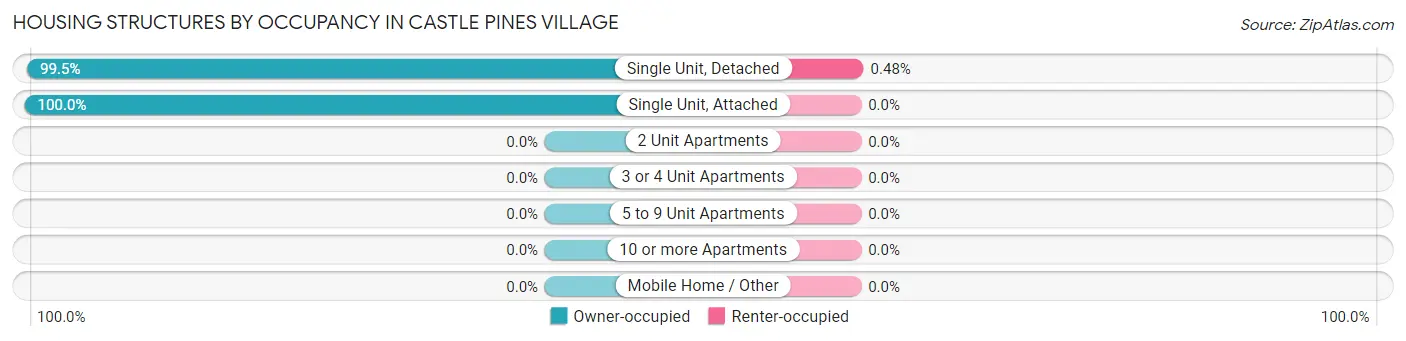
| Structure Type | Owner-occupied | Renter-occupied |
| Single Unit, Detached | 1,466 (99.5%) | 7 (0.5%) |
| Single Unit, Attached | 184 (100.0%) | 0 (0.0%) |
| 2 Unit Apartments | 0 (0.0%) | 0 (0.0%) |
| 3 or 4 Unit Apartments | 0 (0.0%) | 0 (0.0%) |
| 5 to 9 Unit Apartments | 0 (0.0%) | 0 (0.0%) |
| 10 or more Apartments | 0 (0.0%) | 0 (0.0%) |
| Mobile Home / Other | 0 (0.0%) | 0 (0.0%) |
| Total | 1,650 (99.6%) | 7 (0.4%) |
Housing Structures by Number of Rooms in Castle Pines Village
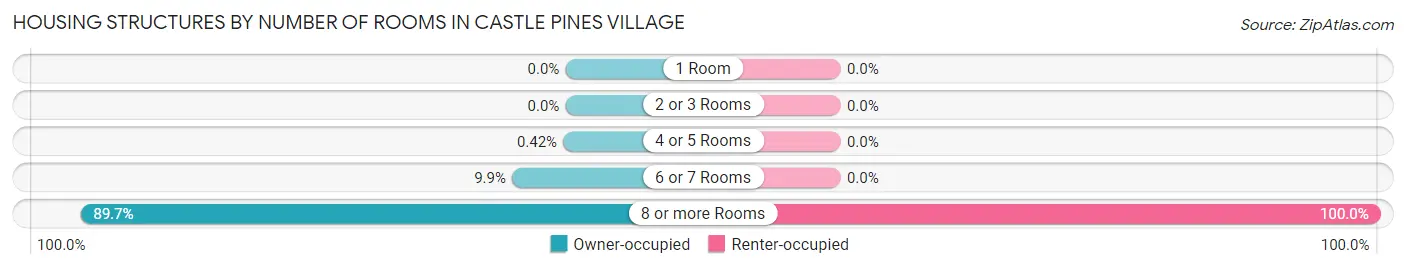
| Number of Rooms | Owner-occupied | Renter-occupied |
| 1 Room | 0 (0.0%) | 0 (0.0%) |
| 2 or 3 Rooms | 0 (0.0%) | 0 (0.0%) |
| 4 or 5 Rooms | 7 (0.4%) | 0 (0.0%) |
| 6 or 7 Rooms | 163 (9.9%) | 0 (0.0%) |
| 8 or more Rooms | 1,480 (89.7%) | 7 (100.0%) |
| Total | 1,650 (100.0%) | 7 (100.0%) |
Housing Structure by Heating Type in Castle Pines Village
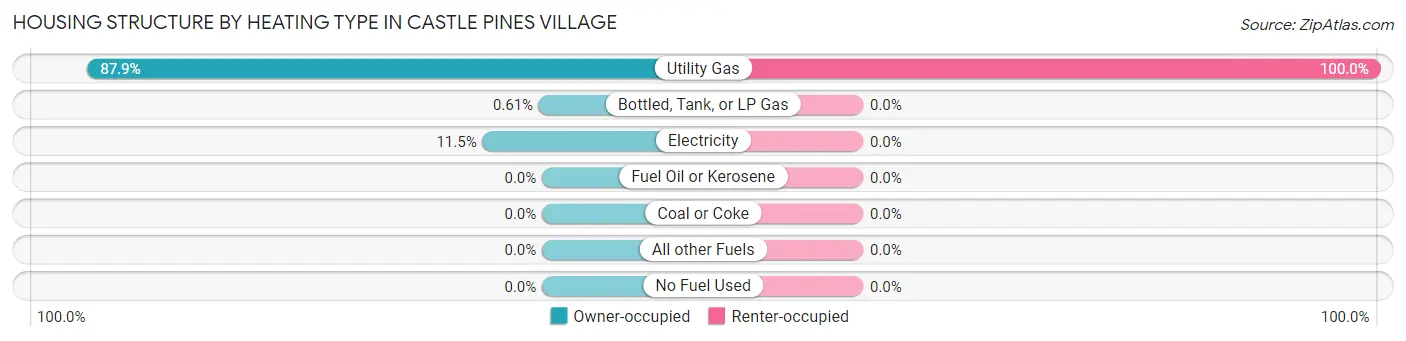
| Heating Type | Owner-occupied | Renter-occupied |
| Utility Gas | 1,450 (87.9%) | 7 (100.0%) |
| Bottled, Tank, or LP Gas | 10 (0.6%) | 0 (0.0%) |
| Electricity | 190 (11.5%) | 0 (0.0%) |
| Fuel Oil or Kerosene | 0 (0.0%) | 0 (0.0%) |
| Coal or Coke | 0 (0.0%) | 0 (0.0%) |
| All other Fuels | 0 (0.0%) | 0 (0.0%) |
| No Fuel Used | 0 (0.0%) | 0 (0.0%) |
| Total | 1,650 (100.0%) | 7 (100.0%) |
Household Vehicle Usage in Castle Pines Village
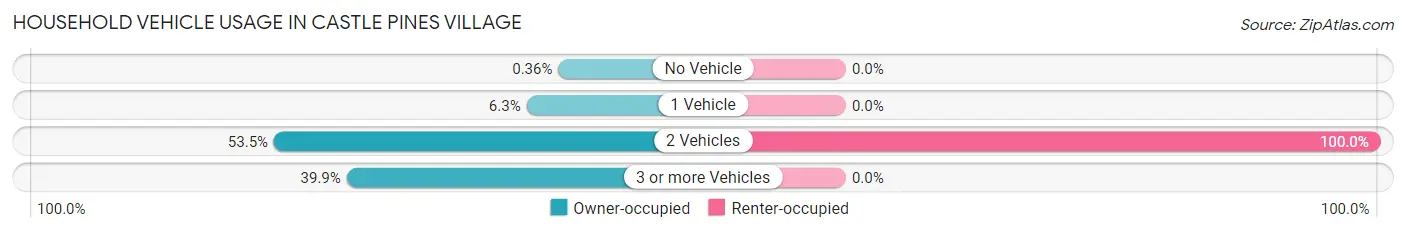
| Vehicles per Household | Owner-occupied | Renter-occupied |
| No Vehicle | 6 (0.4%) | 0 (0.0%) |
| 1 Vehicle | 104 (6.3%) | 0 (0.0%) |
| 2 Vehicles | 882 (53.4%) | 7 (100.0%) |
| 3 or more Vehicles | 658 (39.9%) | 0 (0.0%) |
| Total | 1,650 (100.0%) | 7 (100.0%) |
Real Estate & Mortgages in Castle Pines Village
Real Estate and Mortgage Overview in Castle Pines Village
| Characteristic | Without Mortgage | With Mortgage |
| Housing Units | 671 | 979 |
| Median Property Value | $1,238,500 | $1,196,000 |
| Median Household Income | $190,208 | $733 |
| Monthly Housing Costs | $1,440 | $814 |
| Real Estate Taxes | $8,259 | $0 |
Property Value by Mortgage Status in Castle Pines Village
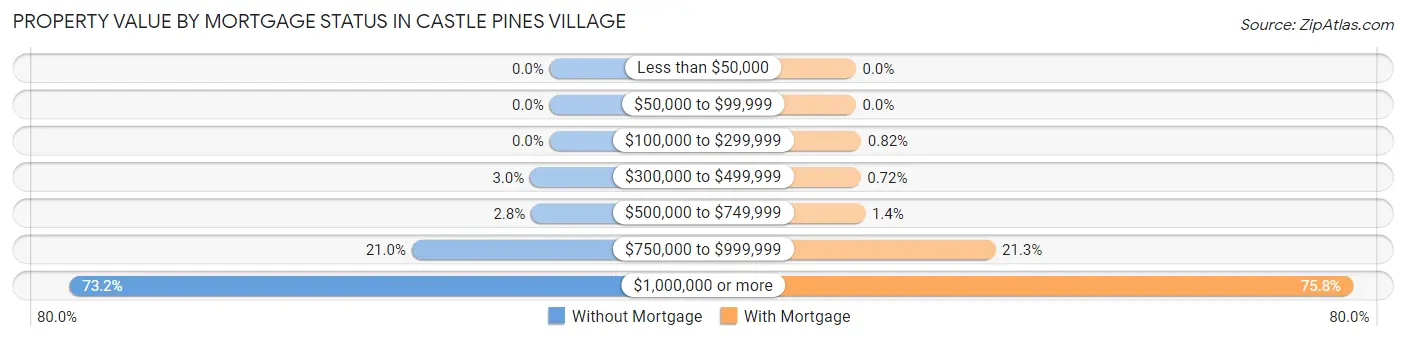
| Property Value | Without Mortgage | With Mortgage |
| Less than $50,000 | 0 (0.0%) | 0 (0.0%) |
| $50,000 to $99,999 | 0 (0.0%) | 0 (0.0%) |
| $100,000 to $299,999 | 0 (0.0%) | 8 (0.8%) |
| $300,000 to $499,999 | 20 (3.0%) | 7 (0.7%) |
| $500,000 to $749,999 | 19 (2.8%) | 14 (1.4%) |
| $750,000 to $999,999 | 141 (21.0%) | 208 (21.2%) |
| $1,000,000 or more | 491 (73.2%) | 742 (75.8%) |
| Total | 671 (100.0%) | 979 (100.0%) |
Household Income by Mortgage Status in Castle Pines Village
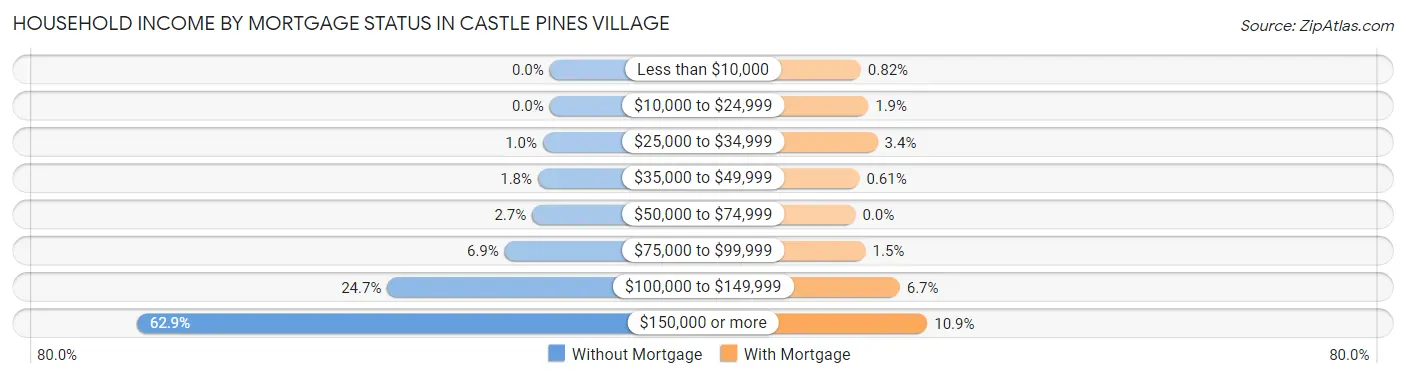
| Household Income | Without Mortgage | With Mortgage |
| Less than $10,000 | 0 (0.0%) | 8 (0.8%) |
| $10,000 to $24,999 | 0 (0.0%) | 19 (1.9%) |
| $25,000 to $34,999 | 7 (1.0%) | 33 (3.4%) |
| $35,000 to $49,999 | 12 (1.8%) | 6 (0.6%) |
| $50,000 to $74,999 | 18 (2.7%) | 0 (0.0%) |
| $75,000 to $99,999 | 46 (6.9%) | 15 (1.5%) |
| $100,000 to $149,999 | 166 (24.7%) | 66 (6.7%) |
| $150,000 or more | 422 (62.9%) | 107 (10.9%) |
| Total | 671 (100.0%) | 979 (100.0%) |
Property Value to Household Income Ratio in Castle Pines Village
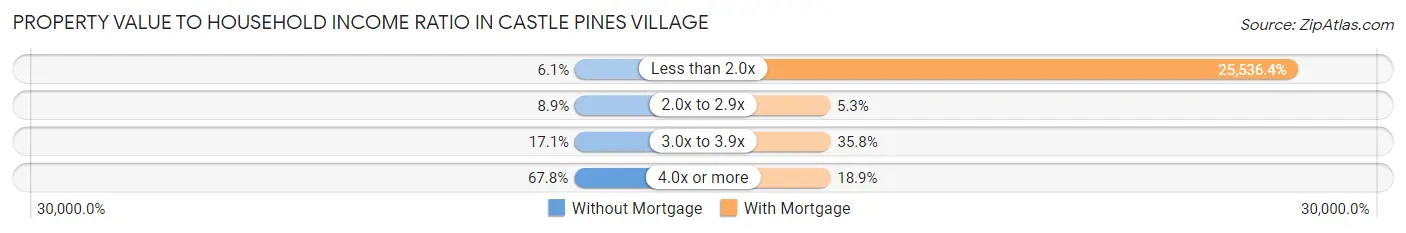
| Value-to-Income Ratio | Without Mortgage | With Mortgage |
| Less than 2.0x | 41 (6.1%) | 250,001 (25,536.4%) |
| 2.0x to 2.9x | 60 (8.9%) | 52 (5.3%) |
| 3.0x to 3.9x | 115 (17.1%) | 350 (35.7%) |
| 4.0x or more | 455 (67.8%) | 185 (18.9%) |
| Total | 671 (100.0%) | 979 (100.0%) |
Real Estate Taxes by Mortgage Status in Castle Pines Village
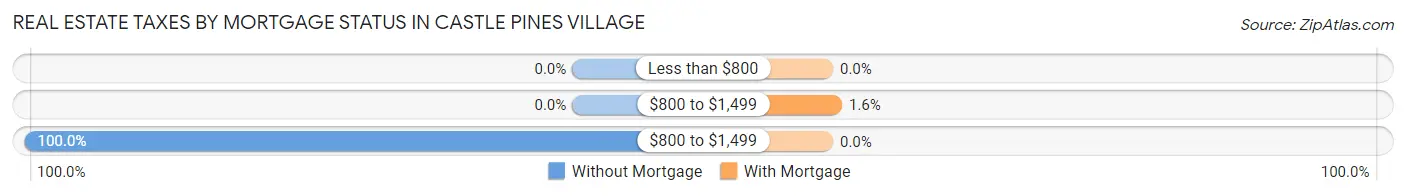
| Property Taxes | Without Mortgage | With Mortgage |
| Less than $800 | 0 (0.0%) | 0 (0.0%) |
| $800 to $1,499 | 0 (0.0%) | 16 (1.6%) |
| $800 to $1,499 | 671 (100.0%) | 0 (0.0%) |
| Total | 671 (100.0%) | 979 (100.0%) |
Health & Disability in Castle Pines Village
Health Insurance Coverage by Age in Castle Pines Village
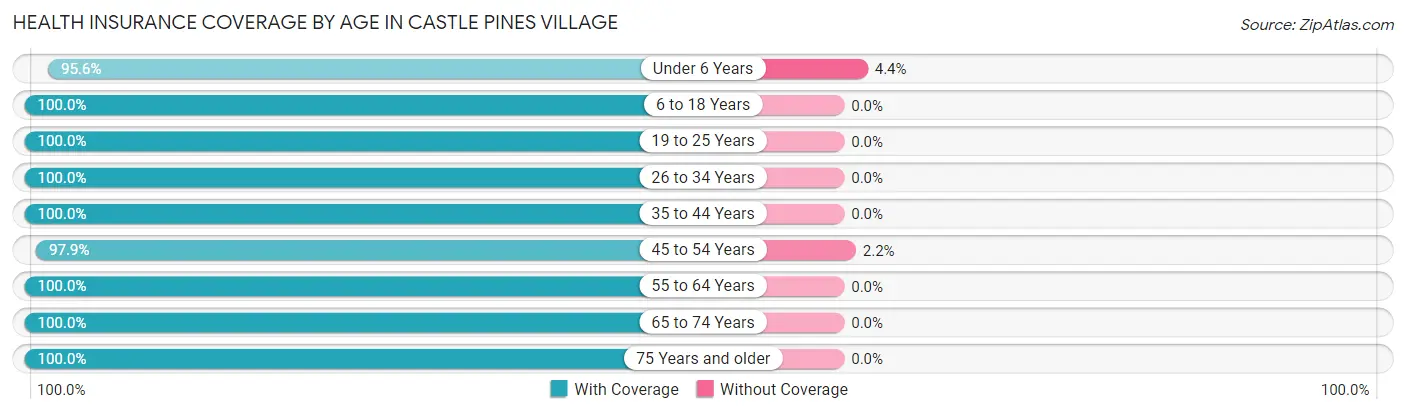
| Age Bracket | With Coverage | Without Coverage |
| Under 6 Years | 153 (95.6%) | 7 (4.4%) |
| 6 to 18 Years | 761 (100.0%) | 0 (0.0%) |
| 19 to 25 Years | 231 (100.0%) | 0 (0.0%) |
| 26 to 34 Years | 170 (100.0%) | 0 (0.0%) |
| 35 to 44 Years | 326 (100.0%) | 0 (0.0%) |
| 45 to 54 Years | 911 (97.9%) | 20 (2.1%) |
| 55 to 64 Years | 899 (100.0%) | 0 (0.0%) |
| 65 to 74 Years | 663 (100.0%) | 0 (0.0%) |
| 75 Years and older | 321 (100.0%) | 0 (0.0%) |
| Total | 4,435 (99.4%) | 27 (0.6%) |
Health Insurance Coverage by Citizenship Status in Castle Pines Village
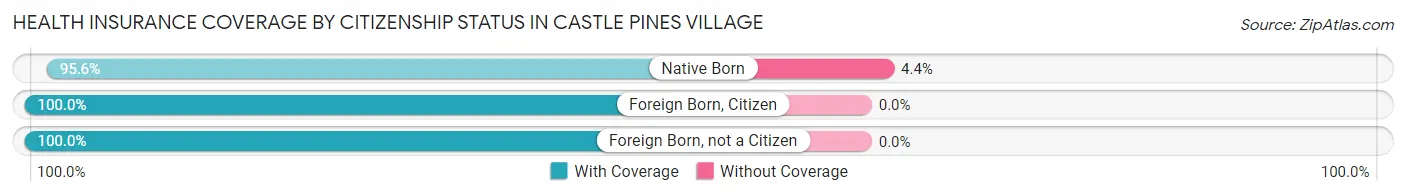
| Citizenship Status | With Coverage | Without Coverage |
| Native Born | 153 (95.6%) | 7 (4.4%) |
| Foreign Born, Citizen | 761 (100.0%) | 0 (0.0%) |
| Foreign Born, not a Citizen | 231 (100.0%) | 0 (0.0%) |
Health Insurance Coverage by Household Income in Castle Pines Village
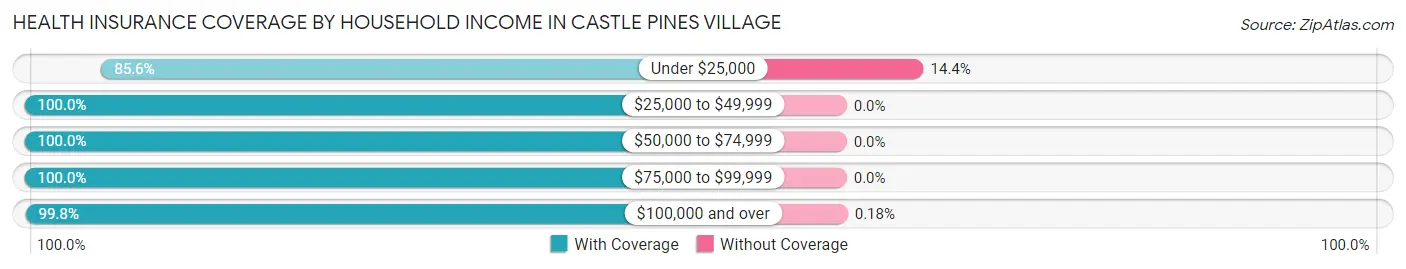
| Household Income | With Coverage | Without Coverage |
| Under $25,000 | 119 (85.6%) | 20 (14.4%) |
| $25,000 to $49,999 | 43 (100.0%) | 0 (0.0%) |
| $50,000 to $74,999 | 112 (100.0%) | 0 (0.0%) |
| $75,000 to $99,999 | 222 (100.0%) | 0 (0.0%) |
| $100,000 and over | 3,939 (99.8%) | 7 (0.2%) |
Public vs Private Health Insurance Coverage by Age in Castle Pines Village
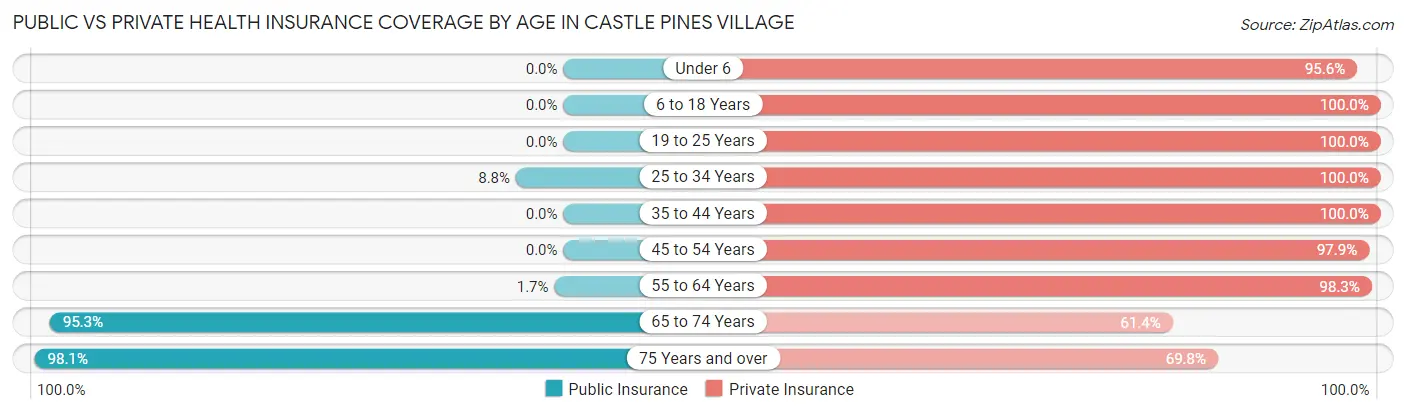
| Age Bracket | Public Insurance | Private Insurance |
| Under 6 | 0 (0.0%) | 153 (95.6%) |
| 6 to 18 Years | 0 (0.0%) | 761 (100.0%) |
| 19 to 25 Years | 0 (0.0%) | 231 (100.0%) |
| 25 to 34 Years | 15 (8.8%) | 170 (100.0%) |
| 35 to 44 Years | 0 (0.0%) | 326 (100.0%) |
| 45 to 54 Years | 0 (0.0%) | 911 (97.9%) |
| 55 to 64 Years | 15 (1.7%) | 884 (98.3%) |
| 65 to 74 Years | 632 (95.3%) | 407 (61.4%) |
| 75 Years and over | 315 (98.1%) | 224 (69.8%) |
| Total | 977 (21.9%) | 4,067 (91.1%) |
Disability Status by Sex by Age in Castle Pines Village
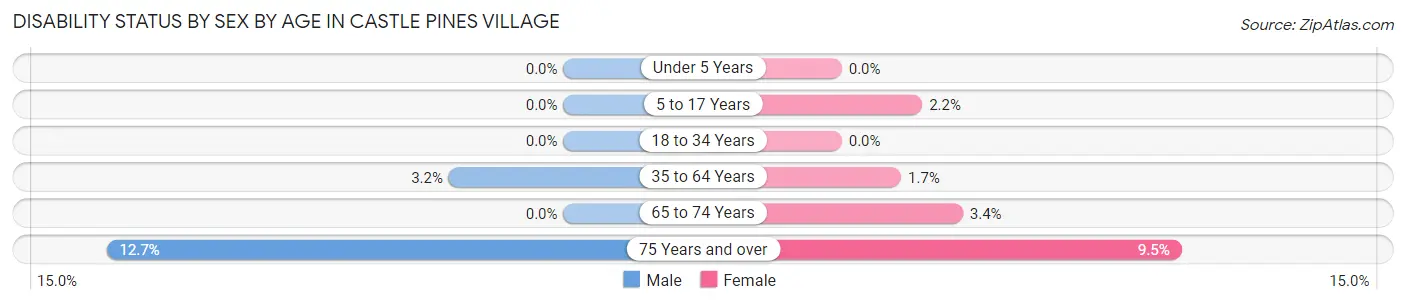
| Age Bracket | Male | Female |
| Under 5 Years | 0 (0.0%) | 0 (0.0%) |
| 5 to 17 Years | 0 (0.0%) | 9 (2.2%) |
| 18 to 34 Years | 0 (0.0%) | 0 (0.0%) |
| 35 to 64 Years | 34 (3.2%) | 18 (1.7%) |
| 65 to 74 Years | 0 (0.0%) | 10 (3.4%) |
| 75 Years and over | 22 (12.7%) | 14 (9.5%) |
Disability Class by Sex by Age in Castle Pines Village
Disability Class: Hearing Difficulty
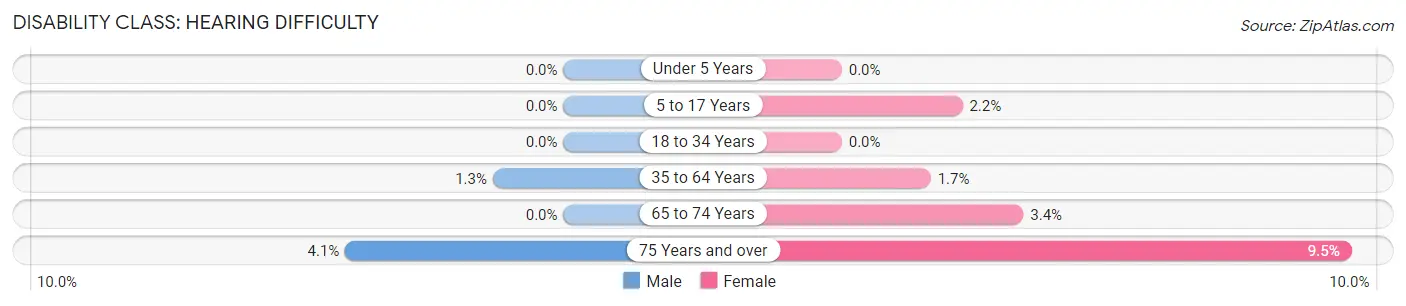
| Age Bracket | Male | Female |
| Under 5 Years | 0 (0.0%) | 0 (0.0%) |
| 5 to 17 Years | 0 (0.0%) | 9 (2.2%) |
| 18 to 34 Years | 0 (0.0%) | 0 (0.0%) |
| 35 to 64 Years | 14 (1.3%) | 18 (1.7%) |
| 65 to 74 Years | 0 (0.0%) | 10 (3.4%) |
| 75 Years and over | 7 (4.1%) | 14 (9.5%) |
Disability Class: Vision Difficulty
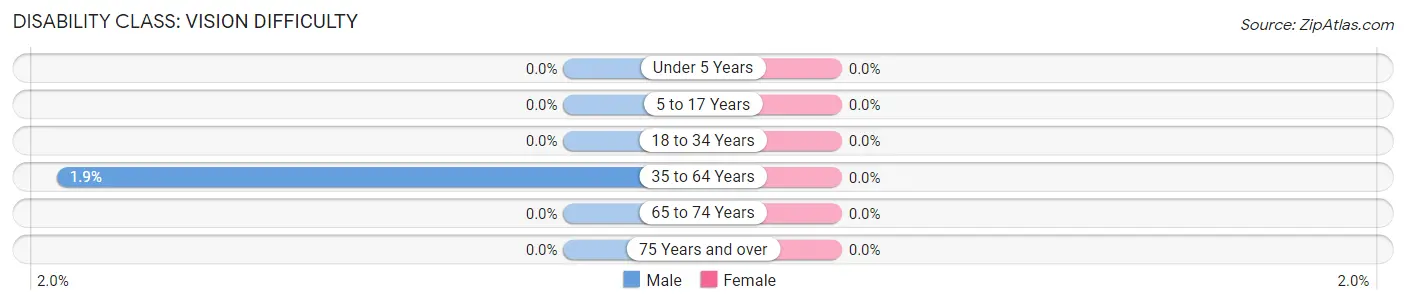
| Age Bracket | Male | Female |
| Under 5 Years | 0 (0.0%) | 0 (0.0%) |
| 5 to 17 Years | 0 (0.0%) | 0 (0.0%) |
| 18 to 34 Years | 0 (0.0%) | 0 (0.0%) |
| 35 to 64 Years | 20 (1.9%) | 0 (0.0%) |
| 65 to 74 Years | 0 (0.0%) | 0 (0.0%) |
| 75 Years and over | 0 (0.0%) | 0 (0.0%) |
Disability Class: Cognitive Difficulty
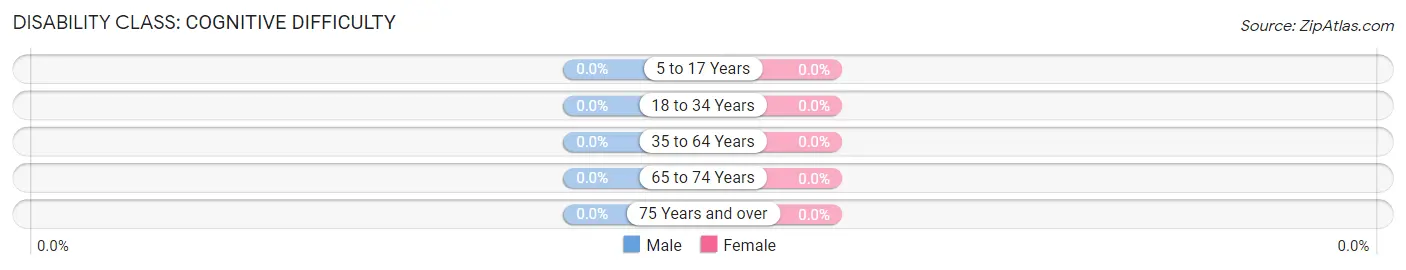
| Age Bracket | Male | Female |
| 5 to 17 Years | 0 (0.0%) | 0 (0.0%) |
| 18 to 34 Years | 0 (0.0%) | 0 (0.0%) |
| 35 to 64 Years | 0 (0.0%) | 0 (0.0%) |
| 65 to 74 Years | 0 (0.0%) | 0 (0.0%) |
| 75 Years and over | 0 (0.0%) | 0 (0.0%) |
Disability Class: Ambulatory Difficulty
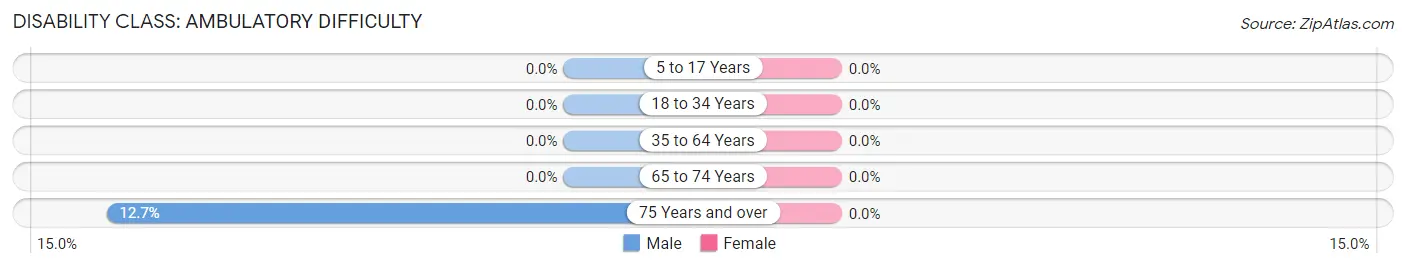
| Age Bracket | Male | Female |
| 5 to 17 Years | 0 (0.0%) | 0 (0.0%) |
| 18 to 34 Years | 0 (0.0%) | 0 (0.0%) |
| 35 to 64 Years | 0 (0.0%) | 0 (0.0%) |
| 65 to 74 Years | 0 (0.0%) | 0 (0.0%) |
| 75 Years and over | 22 (12.7%) | 0 (0.0%) |
Disability Class: Self-Care Difficulty
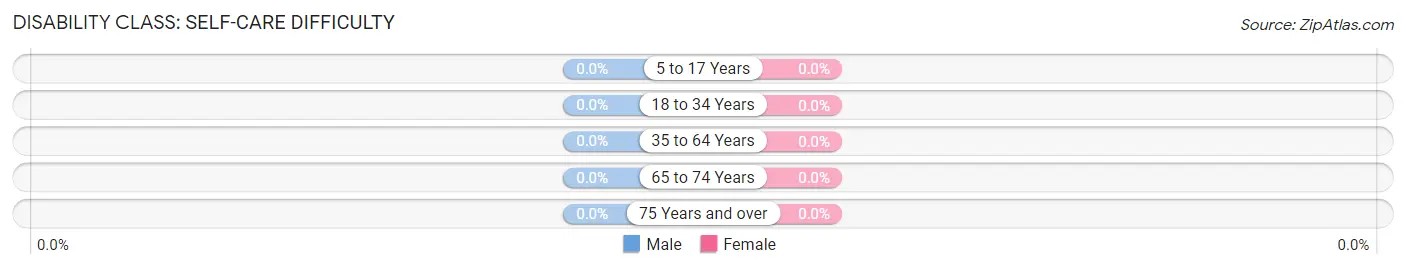
| Age Bracket | Male | Female |
| 5 to 17 Years | 0 (0.0%) | 0 (0.0%) |
| 18 to 34 Years | 0 (0.0%) | 0 (0.0%) |
| 35 to 64 Years | 0 (0.0%) | 0 (0.0%) |
| 65 to 74 Years | 0 (0.0%) | 0 (0.0%) |
| 75 Years and over | 0 (0.0%) | 0 (0.0%) |
Technology Access in Castle Pines Village
Computing Device Access in Castle Pines Village
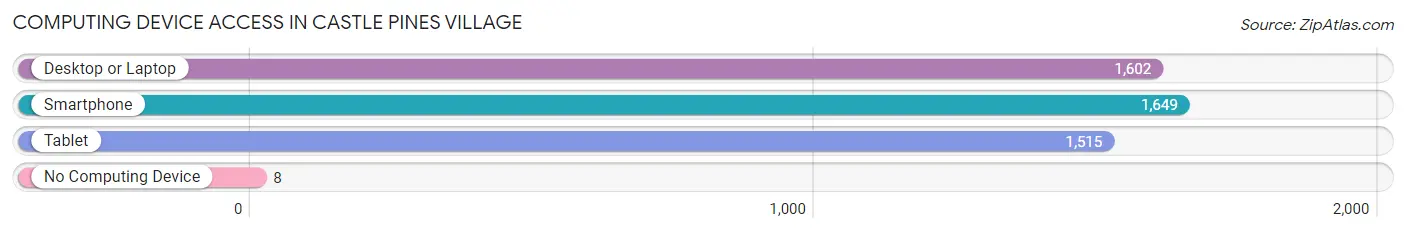
| Device Type | # Households | % Households |
| Desktop or Laptop | 1,602 | 96.7% |
| Smartphone | 1,649 | 99.5% |
| Tablet | 1,515 | 91.4% |
| No Computing Device | 8 | 0.5% |
| Total | 1,657 | 100.0% |
Internet Access in Castle Pines Village
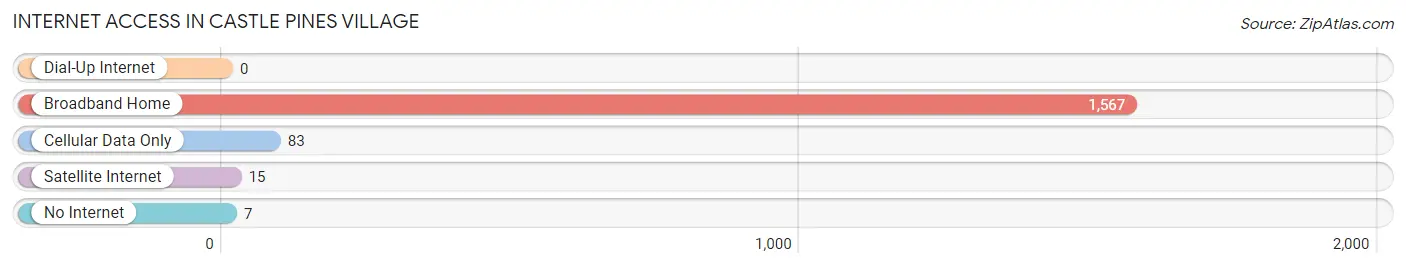
| Internet Type | # Households | % Households |
| Dial-Up Internet | 0 | 0.0% |
| Broadband Home | 1,567 | 94.6% |
| Cellular Data Only | 83 | 5.0% |
| Satellite Internet | 15 | 0.9% |
| No Internet | 7 | 0.4% |
| Total | 1,657 | 100.0% |
Castle Pines Village Summary
Castle Pines Village is a small, affluent community located in Douglas County, Colorado. It is situated just south of the city of Castle Rock and is part of the Denver-Aurora-Lakewood Metropolitan Statistical Area. The village was incorporated in 2008 and is home to approximately 10,000 people.
Geography
Castle Pines Village is located in the foothills of the Rocky Mountains, approximately 20 miles south of Denver. The village is situated at an elevation of 6,400 feet and is surrounded by rolling hills and open space. The terrain is mostly flat, with some areas of steep terrain. The village is bordered by the cities of Castle Rock to the north, Parker to the east, and Lone Tree to the south.
The climate in Castle Pines Village is semi-arid, with hot summers and cold winters. The average annual temperature is around 50 degrees Fahrenheit, with an average high of around 80 degrees in the summer and an average low of around 20 degrees in the winter. The average annual precipitation is around 16 inches.
Economy
The economy of Castle Pines Village is largely based on the service industry. The village is home to a variety of businesses, including restaurants, retail stores, and professional services. The village is also home to several corporate headquarters, including the headquarters of the software company Oracle.
The village is also home to several golf courses, including the Castle Pines Golf Club, which is one of the most prestigious golf courses in the country. The village is also home to several parks and trails, including the Castle Pines Trail, which is a popular hiking and biking trail.
Demographics
As of the 2010 census, the population of Castle Pines Village was 9,859. The population is predominantly white (90.3%), with a small percentage of African Americans (2.2%), Asians (2.1%), and Hispanics (3.3%). The median household income is $125,000, and the median home value is $521,000.
The village is home to a variety of religious denominations, including Catholic, Protestant, and Jewish. The village is also home to a variety of educational institutions, including the Douglas County School District, the University of Colorado Denver, and the Colorado School of Mines.
Conclusion
Castle Pines Village is a small, affluent community located in Douglas County, Colorado. It is situated just south of the city of Castle Rock and is part of the Denver-Aurora-Lakewood Metropolitan Statistical Area. The village was incorporated in 2008 and is home to approximately 10,000 people. The economy of Castle Pines Village is largely based on the service industry, and the village is home to several corporate headquarters, golf courses, parks, and trails. The population of Castle Pines Village is predominantly white, with a small percentage of African Americans, Asians, and Hispanics. The median household income is $125,000, and the median home value is $521,000. The village is home to a variety of religious denominations and educational institutions.
Common Questions
What is Per Capita Income in Castle Pines Village?
Per Capita income in Castle Pines Village is $132,948.
What is the Median Family Income in Castle Pines Village?
Median Family Income in Castle Pines Village is $250,001.
What is the Median Household income in Castle Pines Village?
Median Household Income in Castle Pines Village is $250,001.
What is Income or Wage Gap in Castle Pines Village?
Income or Wage Gap in Castle Pines Village is 43.2%.
Women in Castle Pines Village earn 56.8 cents for every dollar earned by a man.
What is Inequality or Gini Index in Castle Pines Village?
Inequality or Gini Index in Castle Pines Village is 0.43.
What is the Total Population of Castle Pines Village?
Total Population of Castle Pines Village is 4,462.
What is the Total Male Population of Castle Pines Village?
Total Male Population of Castle Pines Village is 2,247.
What is the Total Female Population of Castle Pines Village?
Total Female Population of Castle Pines Village is 2,215.
What is the Ratio of Males per 100 Females in Castle Pines Village?
There are 101.44 Males per 100 Females in Castle Pines Village.
What is the Ratio of Females per 100 Males in Castle Pines Village?
There are 98.58 Females per 100 Males in Castle Pines Village.
What is the Median Population Age in Castle Pines Village?
Median Population Age in Castle Pines Village is 52.7 Years.
What is the Average Family Size in Castle Pines Village
Average Family Size in Castle Pines Village is 2.8 People.
What is the Average Household Size in Castle Pines Village
Average Household Size in Castle Pines Village is 2.7 People.
How Large is the Labor Force in Castle Pines Village?
There are 2,190 People in the Labor Forcein in Castle Pines Village.
What is the Percentage of People in the Labor Force in Castle Pines Village?
57.0% of People are in the Labor Force in Castle Pines Village.
What is the Unemployment Rate in Castle Pines Village?
Unemployment Rate in Castle Pines Village is 5.7%.