Cities with the Highest Poverty Level in Iowa
RELATED REPORTS & OPTIONS
Highest Poverty
Iowa
Compare Cities
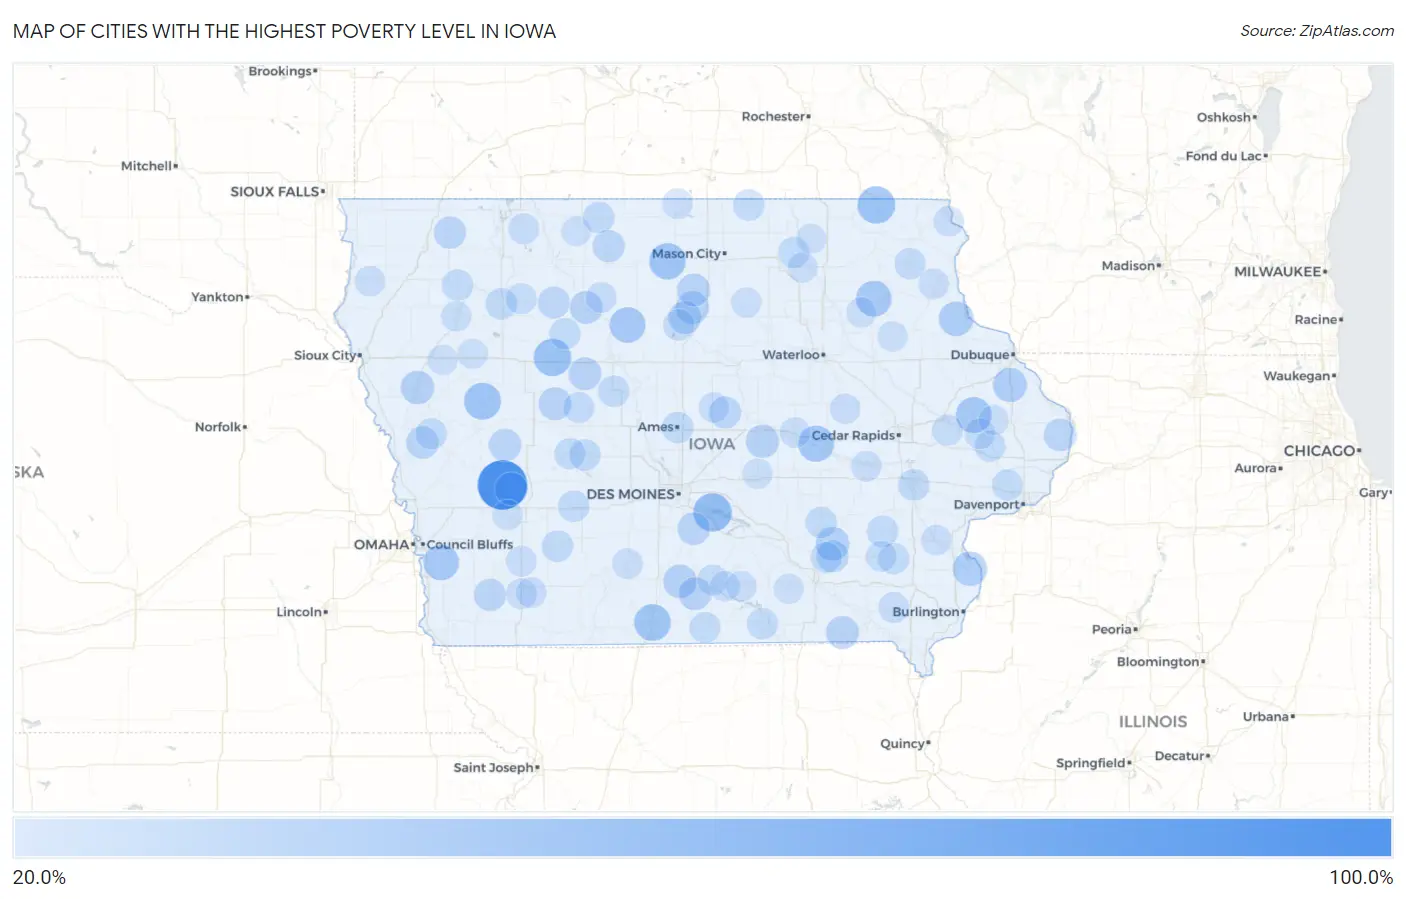
Map of Cities with the Highest Poverty Level in Iowa
0.0%
100.0%
Cities with the Highest Poverty Level in Iowa
| City | Poverty | vs State | vs National | |
| 1. | Jacksonville | 100.0% | 11.1%(+88.9)#1 | 12.5%(+87.5)#113 |
| 2. | Swan | 54.2% | 11.1%(+43.1)#2 | 12.5%(+41.7)#697 |
| 3. | Burr Oak | 50.0% | 11.1%(+38.9)#3 | 12.5%(+37.5)#903 |
| 4. | Jolley | 50.0% | 11.1%(+38.9)#4 | 12.5%(+37.5)#911 |
| 5. | Kiron | 47.7% | 11.1%(+36.5)#5 | 12.5%(+35.1)#1,046 |
| 6. | Decatur City | 46.6% | 11.1%(+35.5)#6 | 12.5%(+34.0)#1,135 |
| 7. | Duncan | 46.3% | 11.1%(+35.1)#7 | 12.5%(+33.7)#1,163 |
| 8. | Chelsea | 44.3% | 11.1%(+33.2)#8 | 12.5%(+31.8)#1,301 |
| 9. | Onslow | 43.5% | 11.1%(+32.3)#9 | 12.5%(+30.9)#1,372 |
| 10. | Randalia | 43.1% | 11.1%(+32.0)#10 | 12.5%(+30.5)#1,410 |
| 11. | Thor | 43.0% | 11.1%(+31.9)#11 | 12.5%(+30.5)#1,418 |
| 12. | Mineola | 42.3% | 11.1%(+31.2)#12 | 12.5%(+29.8)#1,479 |
| 13. | Osterdock | 39.1% | 11.1%(+28.0)#13 | 12.5%(+26.5)#1,784 |
| 14. | Oakville | 37.5% | 11.1%(+26.4)#14 | 12.5%(+25.0)#1,976 |
| 15. | Zwingle | 36.8% | 11.1%(+25.7)#15 | 12.5%(+24.3)#2,085 |
| 16. | Fairport | 35.7% | 11.1%(+24.6)#16 | 12.5%(+23.2)#2,247 |
| 17. | Hayesville | 35.3% | 11.1%(+24.2)#17 | 12.5%(+22.8)#2,316 |
| 18. | Woodburn | 34.2% | 11.1%(+23.1)#18 | 12.5%(+21.7)#2,482 |
| 19. | Oto | 34.2% | 11.1%(+23.1)#19 | 12.5%(+21.7)#2,491 |
| 20. | Ferguson | 33.3% | 11.1%(+22.2)#20 | 12.5%(+20.8)#2,659 |
| 21. | Milton | 32.5% | 11.1%(+21.4)#21 | 12.5%(+19.9)#2,841 |
| 22. | Lanesboro | 32.3% | 11.1%(+21.1)#22 | 12.5%(+19.7)#2,898 |
| 23. | Alexander | 32.2% | 11.1%(+21.1)#23 | 12.5%(+19.7)#2,909 |
| 24. | Rowan | 32.1% | 11.1%(+21.0)#24 | 12.5%(+19.6)#2,922 |
| 25. | Somers | 32.1% | 11.1%(+21.0)#25 | 12.5%(+19.6)#2,934 |
| 26. | Bradgate | 31.9% | 11.1%(+20.8)#26 | 12.5%(+19.4)#2,975 |
| 27. | Derby | 31.8% | 11.1%(+20.7)#27 | 12.5%(+19.3)#2,997 |
| 28. | Kimballton | 31.7% | 11.1%(+20.6)#28 | 12.5%(+19.2)#3,024 |
| 29. | Meservey | 31.7% | 11.1%(+20.6)#29 | 12.5%(+19.1)#3,031 |
| 30. | Ackworth | 31.1% | 11.1%(+20.0)#30 | 12.5%(+18.6)#3,158 |
| 31. | Aspinwall | 31.0% | 11.1%(+19.9)#31 | 12.5%(+18.5)#3,183 |
| 32. | Moorhead | 30.8% | 11.1%(+19.7)#32 | 12.5%(+18.3)#3,216 |
| 33. | Andover | 30.6% | 11.1%(+19.5)#33 | 12.5%(+18.0)#3,281 |
| 34. | Melvin | 29.4% | 11.1%(+18.3)#34 | 12.5%(+16.8)#3,569 |
| 35. | Burt | 29.2% | 11.1%(+18.1)#35 | 12.5%(+16.7)#3,611 |
| 36. | Martinsburg | 29.1% | 11.1%(+18.0)#36 | 12.5%(+16.6)#3,648 |
| 37. | St Anthony | 28.9% | 11.1%(+17.8)#37 | 12.5%(+16.4)#3,691 |
| 38. | Coburg | 28.9% | 11.1%(+17.8)#38 | 12.5%(+16.4)#3,701 |
| 39. | Havelock | 28.3% | 11.1%(+17.2)#39 | 12.5%(+15.8)#3,886 |
| 40. | Bagley | 27.0% | 11.1%(+15.8)#40 | 12.5%(+14.4)#4,330 |
| 41. | Harcourt | 26.9% | 11.1%(+15.8)#41 | 12.5%(+14.4)#4,334 |
| 42. | Ames | 26.8% | 11.1%(+15.7)#42 | 12.5%(+14.3)#4,382 |
| 43. | Iowa City | 26.7% | 11.1%(+15.6)#43 | 12.5%(+14.2)#4,402 |
| 44. | Swea City | 26.7% | 11.1%(+15.5)#44 | 12.5%(+14.1)#4,431 |
| 45. | Bridgewater | 26.6% | 11.1%(+15.5)#45 | 12.5%(+14.1)#4,449 |
| 46. | What Cheer | 26.4% | 11.1%(+15.3)#46 | 12.5%(+13.8)#4,523 |
| 47. | West Chester | 26.3% | 11.1%(+15.2)#47 | 12.5%(+13.8)#4,545 |
| 48. | Rembrandt | 26.3% | 11.1%(+15.1)#48 | 12.5%(+13.7)#4,565 |
| 49. | Casey | 26.1% | 11.1%(+15.0)#49 | 12.5%(+13.6)#4,613 |
| 50. | Coppock | 26.1% | 11.1%(+15.0)#50 | 12.5%(+13.6)#4,628 |
| 51. | Otranto | 26.1% | 11.1%(+15.0)#51 | 12.5%(+13.6)#4,630 |
| 52. | Galt | 26.0% | 11.1%(+14.9)#52 | 12.5%(+13.5)#4,673 |
| 53. | Calumet | 25.9% | 11.1%(+14.8)#54 | 12.5%(+13.4)#4,706 |
| 54. | Soldier | 25.9% | 11.1%(+14.8)#55 | 12.5%(+13.4)#4,707 |
| 55. | Bayard | 25.8% | 11.1%(+14.7)#56 | 12.5%(+13.3)#4,736 |
| 56. | Colwell | 25.8% | 11.1%(+14.7)#57 | 12.5%(+13.3)#4,739 |
| 57. | Postville | 25.7% | 11.1%(+14.6)#58 | 12.5%(+13.2)#4,779 |
| 58. | Centerville | 25.3% | 11.1%(+14.2)#59 | 12.5%(+12.7)#4,938 |
| 59. | Palmer | 25.2% | 11.1%(+14.1)#60 | 12.5%(+12.7)#4,970 |
| 60. | Maysville | 25.1% | 11.1%(+14.0)#61 | 12.5%(+12.6)#4,987 |
| 61. | Toronto | 25.0% | 11.1%(+13.9)#62 | 12.5%(+12.5)#5,063 |
| 62. | Allerton | 24.9% | 11.1%(+13.8)#63 | 12.5%(+12.4)#5,085 |
| 63. | Churdan | 24.8% | 11.1%(+13.7)#64 | 12.5%(+12.3)#5,120 |
| 64. | Hedrick | 24.8% | 11.1%(+13.7)#65 | 12.5%(+12.3)#5,122 |
| 65. | Terril | 24.6% | 11.1%(+13.5)#66 | 12.5%(+12.1)#5,234 |
| 66. | Marathon | 24.5% | 11.1%(+13.4)#67 | 12.5%(+12.0)#5,270 |
| 67. | Morley | 24.5% | 11.1%(+13.4)#68 | 12.5%(+12.0)#5,276 |
| 68. | Chariton | 24.2% | 11.1%(+13.0)#69 | 12.5%(+11.6)#5,405 |
| 69. | Bode | 23.8% | 11.1%(+12.7)#70 | 12.5%(+11.3)#5,545 |
| 70. | Oxford Junction | 23.6% | 11.1%(+12.5)#71 | 12.5%(+11.1)#5,640 |
| 71. | Hillsboro | 23.6% | 11.1%(+12.5)#72 | 12.5%(+11.1)#5,654 |
| 72. | Brighton | 23.5% | 11.1%(+12.4)#73 | 12.5%(+11.0)#5,702 |
| 73. | Villisca | 23.4% | 11.1%(+12.3)#74 | 12.5%(+10.9)#5,721 |
| 74. | Nodaway | 23.4% | 11.1%(+12.3)#75 | 12.5%(+10.9)#5,727 |
| 75. | Grant | 23.4% | 11.1%(+12.3)#76 | 12.5%(+10.9)#5,728 |
| 76. | South Amana | 23.2% | 11.1%(+12.1)#77 | 12.5%(+10.6)#5,862 |
| 77. | Lorimor | 23.1% | 11.1%(+12.0)#78 | 12.5%(+10.6)#5,899 |
| 78. | Melrose | 23.0% | 11.1%(+11.9)#79 | 12.5%(+10.5)#5,952 |
| 79. | Toledo | 23.0% | 11.1%(+11.9)#80 | 12.5%(+10.5)#5,964 |
| 80. | Russell | 22.9% | 11.1%(+11.8)#81 | 12.5%(+10.4)#5,990 |
| 81. | Garrison | 22.9% | 11.1%(+11.8)#82 | 12.5%(+10.3)#6,018 |
| 82. | Scarville | 22.8% | 11.1%(+11.7)#83 | 12.5%(+10.3)#6,058 |
| 83. | Farmersburg | 22.8% | 11.1%(+11.7)#84 | 12.5%(+10.2)#6,070 |
| 84. | Zearing | 22.8% | 11.1%(+11.6)#85 | 12.5%(+10.2)#6,072 |
| 85. | Fredonia | 22.6% | 11.1%(+11.5)#86 | 12.5%(+10.1)#6,139 |
| 86. | Ireton | 22.5% | 11.1%(+11.4)#87 | 12.5%(+10.0)#6,162 |
| 87. | Marne | 22.4% | 11.1%(+11.3)#88 | 12.5%(+9.91)#6,213 |
| 88. | Cherokee | 22.4% | 11.1%(+11.3)#89 | 12.5%(+9.85)#6,256 |
| 89. | Lansing | 22.3% | 11.1%(+11.2)#90 | 12.5%(+9.78)#6,302 |
| 90. | Aredale | 22.2% | 11.1%(+11.1)#91 | 12.5%(+9.69)#6,352 |
| 91. | Bassett | 22.0% | 11.1%(+10.9)#92 | 12.5%(+9.47)#6,461 |
| 92. | Cushing | 21.9% | 11.1%(+10.8)#93 | 12.5%(+9.40)#6,500 |
| 93. | Kellogg | 21.9% | 11.1%(+10.8)#94 | 12.5%(+9.36)#6,530 |
| 94. | Ringsted | 21.9% | 11.1%(+10.8)#95 | 12.5%(+9.33)#6,550 |
| 95. | Blakesburg | 21.8% | 11.1%(+10.7)#96 | 12.5%(+9.31)#6,558 |
| 96. | Galva | 21.8% | 11.1%(+10.7)#97 | 12.5%(+9.31)#6,559 |
| 97. | Westgate | 21.8% | 11.1%(+10.7)#98 | 12.5%(+9.31)#6,560 |
| 98. | Aurora | 21.8% | 11.1%(+10.7)#99 | 12.5%(+9.29)#6,573 |
| 99. | Baldwin | 21.8% | 11.1%(+10.7)#100 | 12.5%(+9.27)#6,587 |
| 100. | Elma | 21.5% | 11.1%(+10.4)#101 | 12.5%(+8.98)#6,754 |
Common Questions
What are the Top 10 Cities with the Highest Poverty Level in Iowa?
Top 10 Cities with the Highest Poverty Level in Iowa are:
#1
100.0%
#2
54.2%
#3
50.0%
#4
50.0%
#5
47.7%
#6
46.6%
#7
46.3%
#8
44.3%
#9
43.5%
#10
43.1%
What city has the Highest Poverty Level in Iowa?
Jacksonville has the Highest Poverty Level in Iowa with 100.0%.
What is the Poverty Level in the State of Iowa?
Poverty Level in Iowa is 11.1%.
What is the Poverty Level in the United States?
Poverty Level in the United States is 12.5%.