Zip Codes with the Highest Percentage of Households Without a Vehicle in Barton, VT
RELATED REPORTS & OPTIONS
Households without a Cars
Barton
Compare Zip Codes
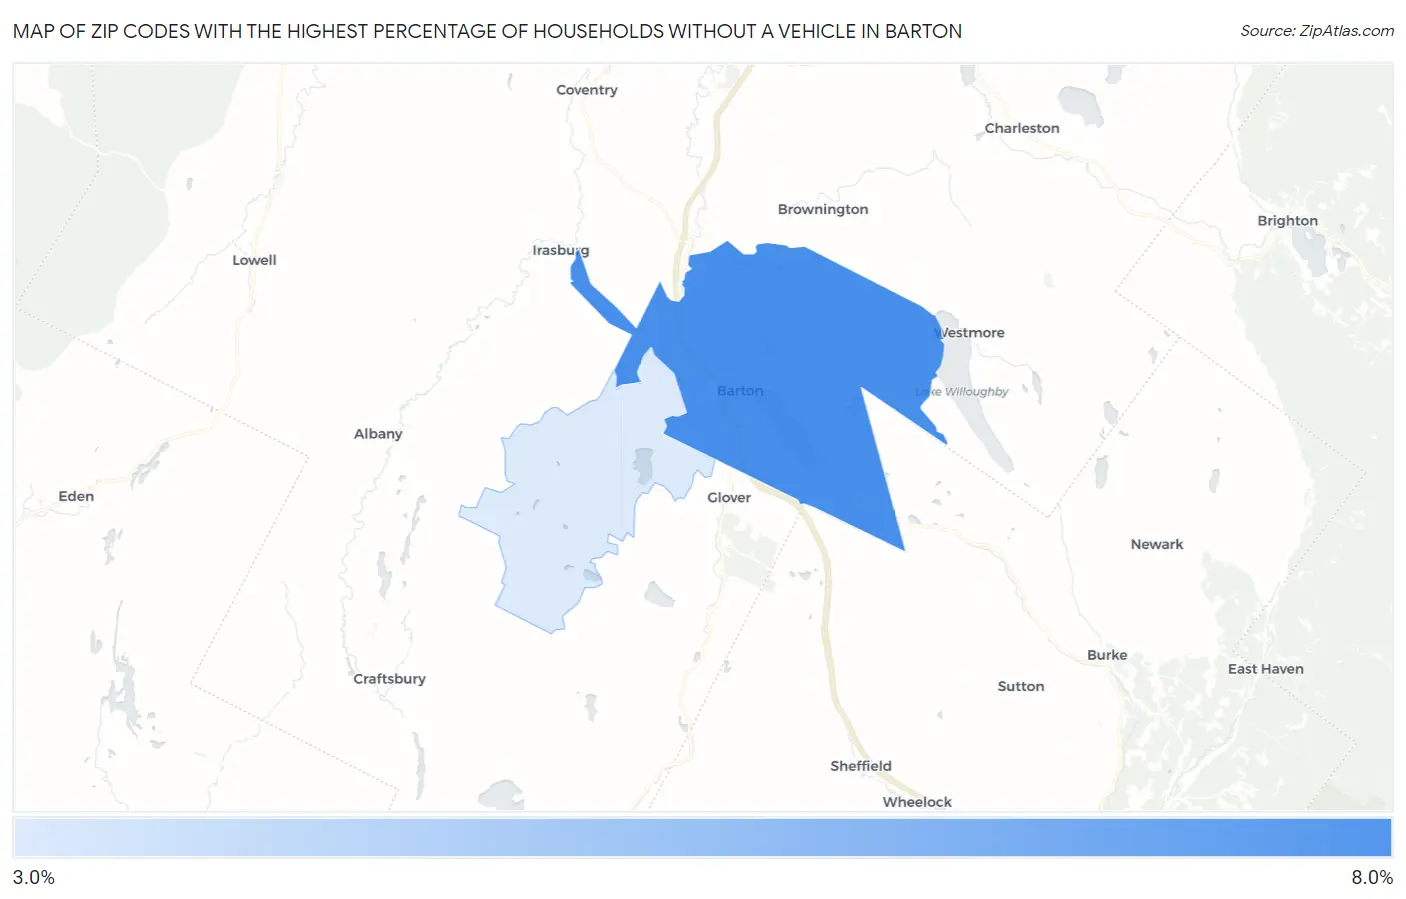
Map of Zip Codes with the Highest Percentage of Households Without a Vehicle in Barton
3.0%
6.9%
Zip Codes with the Highest Percentage of Households Without a Vehicle in Barton, VT
| Zip Code | Housholds Without a Car | vs State | vs National | |
| 1. | 05822 | 6.9% | 6.4%(+0.500)#45 | 8.3%(-1.40)#8,805 |
| 2. | 05875 | 3.0% | 6.4%(-3.40)#115 | 8.3%(-5.30)#19,332 |
1
Common Questions
What are the Top Zip Codes with the Highest Percentage of Households Without a Vehicle in Barton, VT?
Top Zip Codes with the Highest Percentage of Households Without a Vehicle in Barton, VT are:
What zip code has the Highest Percentage of Households Without a Vehicle in Barton, VT?
05822 has the Highest Percentage of Households Without a Vehicle in Barton, VT with 6.9%.
What is the Percentage of Households Without a Vehicle in Barton, VT?
Percentage of Households Without a Vehicle in Barton is 14.1%.
What is the Percentage of Households Without a Vehicle in Vermont?
Percentage of Households Without a Vehicle in Vermont is 6.4%.
What is the Percentage of Households Without a Vehicle in the United States?
Percentage of Households Without a Vehicle in the United States is 8.3%.