Zip Codes with the Highest Percentage of Households Without a Vehicle in Burlington, VT
RELATED REPORTS & OPTIONS
Households without a Cars
Burlington
Compare Zip Codes
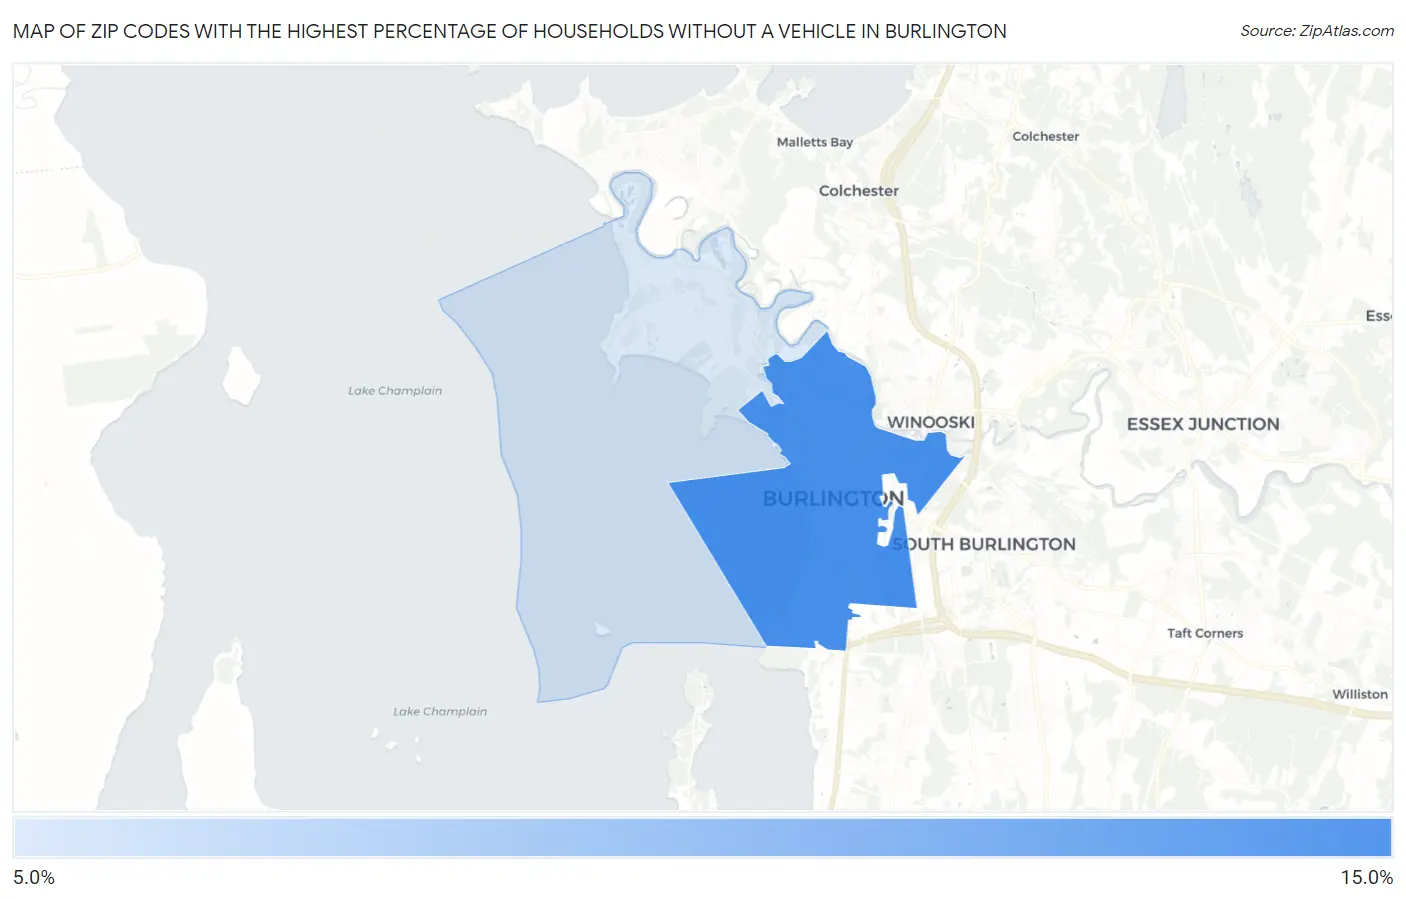
Map of Zip Codes with the Highest Percentage of Households Without a Vehicle in Burlington
7.2%
14.8%
Zip Codes with the Highest Percentage of Households Without a Vehicle in Burlington, VT
| Zip Code | Housholds Without a Car | vs State | vs National | |
| 1. | 05401 | 14.8% | 6.4%(+8.40)#5 | 8.3%(+6.50)#2,441 |
| 2. | 05408 | 7.2% | 6.4%(+0.800)#42 | 8.3%(-1.10)#8,250 |
1
Common Questions
What are the Top Zip Codes with the Highest Percentage of Households Without a Vehicle in Burlington, VT?
Top Zip Codes with the Highest Percentage of Households Without a Vehicle in Burlington, VT are:
What zip code has the Highest Percentage of Households Without a Vehicle in Burlington, VT?
05401 has the Highest Percentage of Households Without a Vehicle in Burlington, VT with 14.8%.
What is the Percentage of Households Without a Vehicle in Burlington, VT?
Percentage of Households Without a Vehicle in Burlington is 12.9%.
What is the Percentage of Households Without a Vehicle in Vermont?
Percentage of Households Without a Vehicle in Vermont is 6.4%.
What is the Percentage of Households Without a Vehicle in the United States?
Percentage of Households Without a Vehicle in the United States is 8.3%.