North Alamo, TX Map & Demographics
North Alamo Map
North Alamo Overview
$18,581
PER CAPITA INCOME
$51,382
AVG FAMILY INCOME
$50,935
AVG HOUSEHOLD INCOME
49.9%
WAGE / INCOME GAP [ % ]
50.1¢/ $1
WAGE / INCOME GAP [ $ ]
0.46
INEQUALITY / GINI INDEX
5,130
TOTAL POPULATION
2,204
MALE POPULATION
2,926
FEMALE POPULATION
75.32
MALES / 100 FEMALES
132.76
FEMALES / 100 MALES
26.5
MEDIAN AGE
3.9
AVG FAMILY SIZE
3.9
AVG HOUSEHOLD SIZE
1,869
LABOR FORCE [ PEOPLE ]
54.5%
PERCENT IN LABOR FORCE
4.9%
UNEMPLOYMENT RATE
Income in North Alamo
Income Overview in North Alamo
Per Capita Income in North Alamo is $18,581, while median incomes of families and households are $51,382 and $50,935 respectively.
| Characteristic | Number | Measure |
| Per Capita Income | 5,130 | $18,581 |
| Median Family Income | 1,255 | $51,382 |
| Mean Family Income | 1,255 | $70,252 |
| Median Household Income | 1,309 | $50,935 |
| Mean Household Income | 1,309 | $69,274 |
| Income Deficit | 1,255 | $0 |
| Wage / Income Gap (%) | 5,130 | 49.94% |
| Wage / Income Gap ($) | 5,130 | 50.06¢ per $1 |
| Gini / Inequality Index | 5,130 | 0.46 |
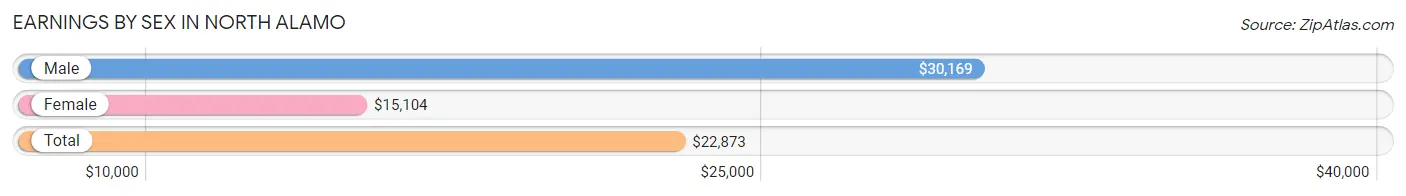
Earnings by Sex in North Alamo
Average Earnings in North Alamo are $22,873, $30,169 for men and $15,104 for women, a difference of 49.9%.
| Sex | Number | Average Earnings |
| Male | 1,068 (53.4%) | $30,169 |
| Female | 931 (46.6%) | $15,104 |
| Total | 1,999 (100.0%) | $22,873 |
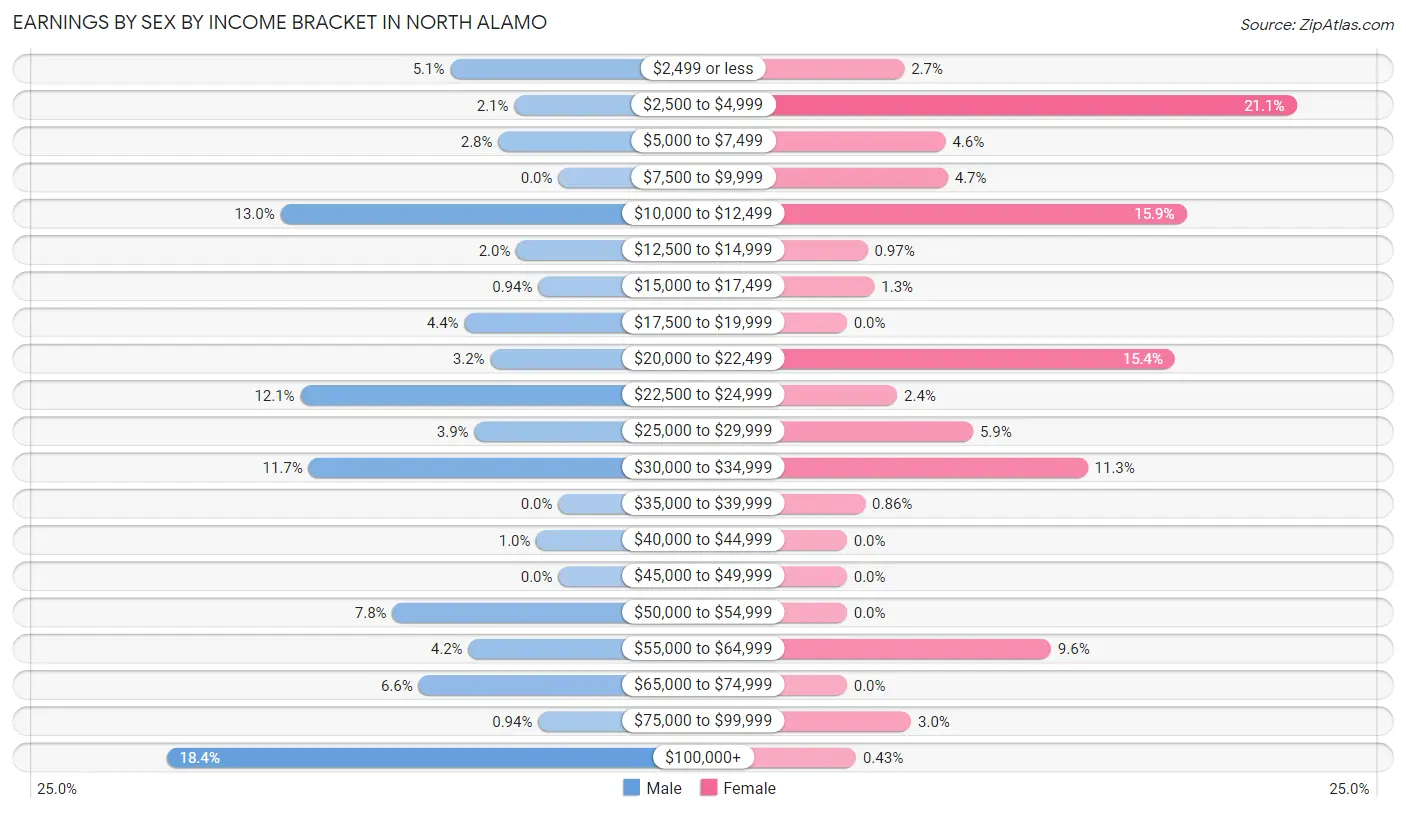
Earnings by Sex by Income Bracket in North Alamo
The most common earnings brackets in North Alamo are $100,000+ for men (196 | 18.3%) and $2,500 to $4,999 for women (196 | 21.0%).
| Income | Male | Female |
| $2,499 or less | 54 (5.1%) | 25 (2.7%) |
| $2,500 to $4,999 | 22 (2.1%) | 196 (21.0%) |
| $5,000 to $7,499 | 30 (2.8%) | 43 (4.6%) |
| $7,500 to $9,999 | 0 (0.0%) | 44 (4.7%) |
| $10,000 to $12,499 | 139 (13.0%) | 148 (15.9%) |
| $12,500 to $14,999 | 21 (2.0%) | 9 (1.0%) |
| $15,000 to $17,499 | 10 (0.9%) | 12 (1.3%) |
| $17,500 to $19,999 | 47 (4.4%) | 0 (0.0%) |
| $20,000 to $22,499 | 34 (3.2%) | 143 (15.4%) |
| $22,500 to $24,999 | 129 (12.1%) | 22 (2.4%) |
| $25,000 to $29,999 | 42 (3.9%) | 55 (5.9%) |
| $30,000 to $34,999 | 125 (11.7%) | 105 (11.3%) |
| $35,000 to $39,999 | 0 (0.0%) | 8 (0.9%) |
| $40,000 to $44,999 | 11 (1.0%) | 0 (0.0%) |
| $45,000 to $49,999 | 0 (0.0%) | 0 (0.0%) |
| $50,000 to $54,999 | 83 (7.8%) | 0 (0.0%) |
| $55,000 to $64,999 | 45 (4.2%) | 89 (9.6%) |
| $65,000 to $74,999 | 70 (6.6%) | 0 (0.0%) |
| $75,000 to $99,999 | 10 (0.9%) | 28 (3.0%) |
| $100,000+ | 196 (18.3%) | 4 (0.4%) |
| Total | 1,068 (100.0%) | 931 (100.0%) |
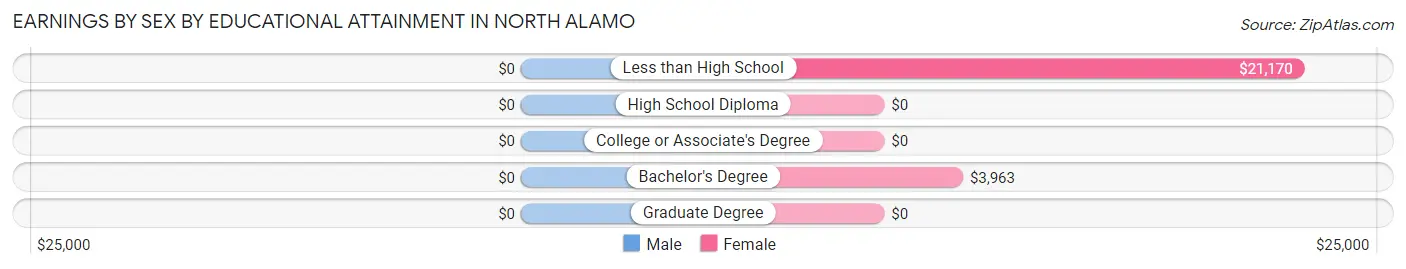
Earnings by Sex by Educational Attainment in North Alamo
| Educational Attainment | Male Income | Female Income |
| Less than High School | - | - |
| High School Diploma | - | - |
| College or Associate's Degree | - | - |
| Bachelor's Degree | - | - |
| Graduate Degree | - | - |
| Total | - | - |
Family Income in North Alamo
Family Income Brackets in North Alamo
According to the North Alamo family income data, there are 345 families falling into the $50,000 to $74,999 income range, which is the most common income bracket and makes up 27.5% of all families.
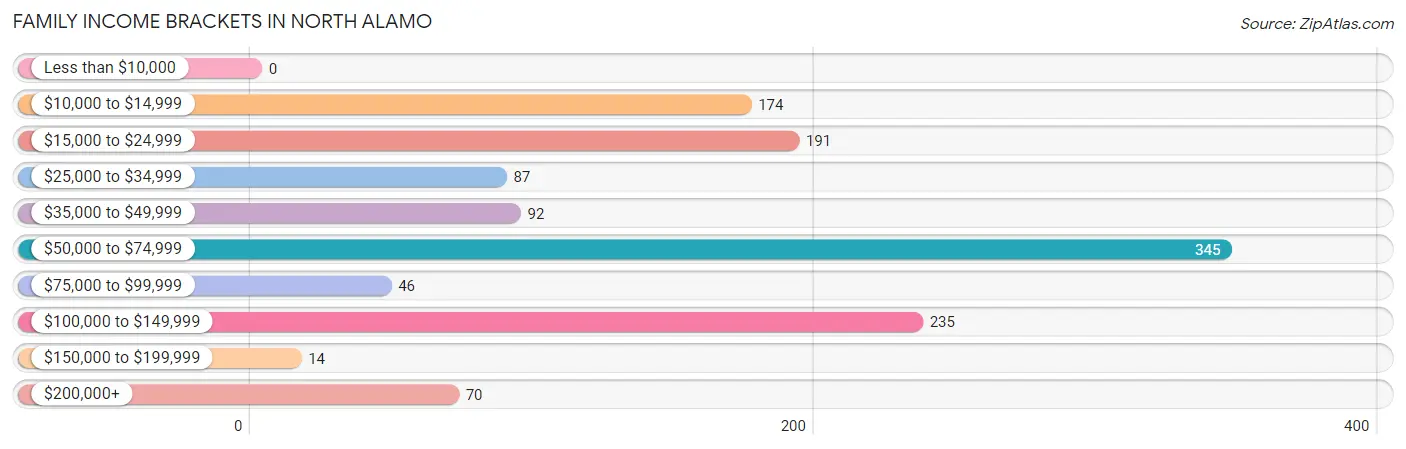
| Income Bracket | # Families | % Families |
| Less than $10,000 | 0 | 0.0% |
| $10,000 to $14,999 | 174 | 13.9% |
| $15,000 to $24,999 | 191 | 15.2% |
| $25,000 to $34,999 | 87 | 6.9% |
| $35,000 to $49,999 | 92 | 7.3% |
| $50,000 to $74,999 | 345 | 27.5% |
| $75,000 to $99,999 | 46 | 3.7% |
| $100,000 to $149,999 | 235 | 18.7% |
| $150,000 to $199,999 | 14 | 1.1% |
| $200,000+ | 70 | 5.6% |
Family Income by Famaliy Size in North Alamo
3-person families (267 | 21.3%) account for the highest median family income in North Alamo with $62,153 per family, while 2-person families (212 | 16.9%) have the highest median income of $20,818 per family member.
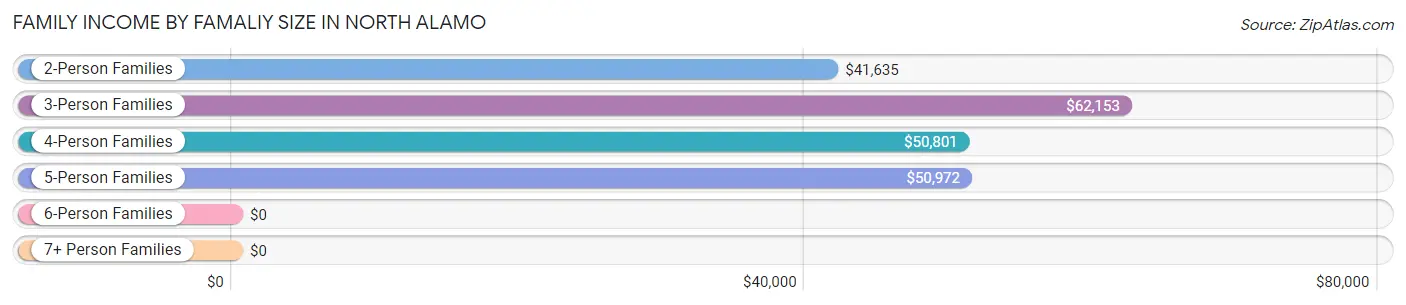
| Income Bracket | # Families | Median Income |
| 2-Person Families | 212 (16.9%) | $41,635 |
| 3-Person Families | 267 (21.3%) | $62,153 |
| 4-Person Families | 559 (44.5%) | $50,801 |
| 5-Person Families | 129 (10.3%) | $50,972 |
| 6-Person Families | 68 (5.4%) | $0 |
| 7+ Person Families | 20 (1.6%) | $0 |
| Total | 1,255 (100.0%) | $51,382 |
Family Income by Number of Earners in North Alamo
The median family income in North Alamo is $51,382, with families comprising 2 earners (344) having the highest median family income of $62,269, while families with 1 earner (711) have the lowest median family income of $41,034, accounting for 27.4% and 56.7% of families, respectively.
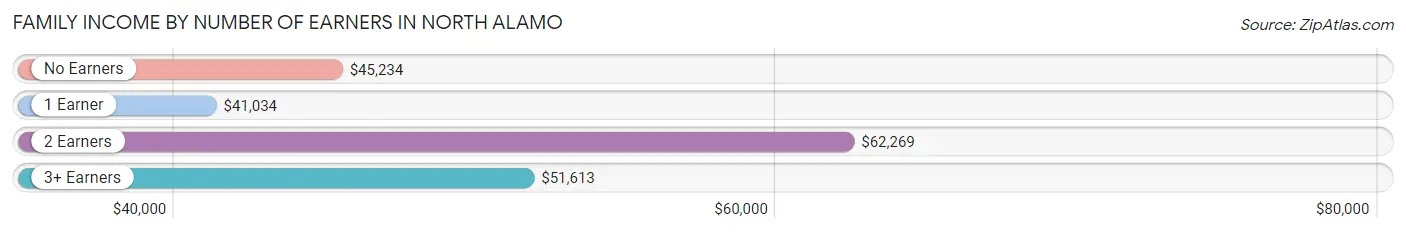
| Number of Earners | # Families | Median Income |
| No Earners | 49 (3.9%) | $45,234 |
| 1 Earner | 711 (56.7%) | $41,034 |
| 2 Earners | 344 (27.4%) | $62,269 |
| 3+ Earners | 151 (12.0%) | $51,613 |
| Total | 1,255 (100.0%) | $51,382 |
Household Income in North Alamo
Household Income Brackets in North Alamo
With 346 households falling in the category, the $50,000 to $74,999 income range is the most frequent in North Alamo, accounting for 26.4% of all households. In contrast, only 8 households (0.6%) fall into the less than $10,000 income bracket, making it the least populous group.
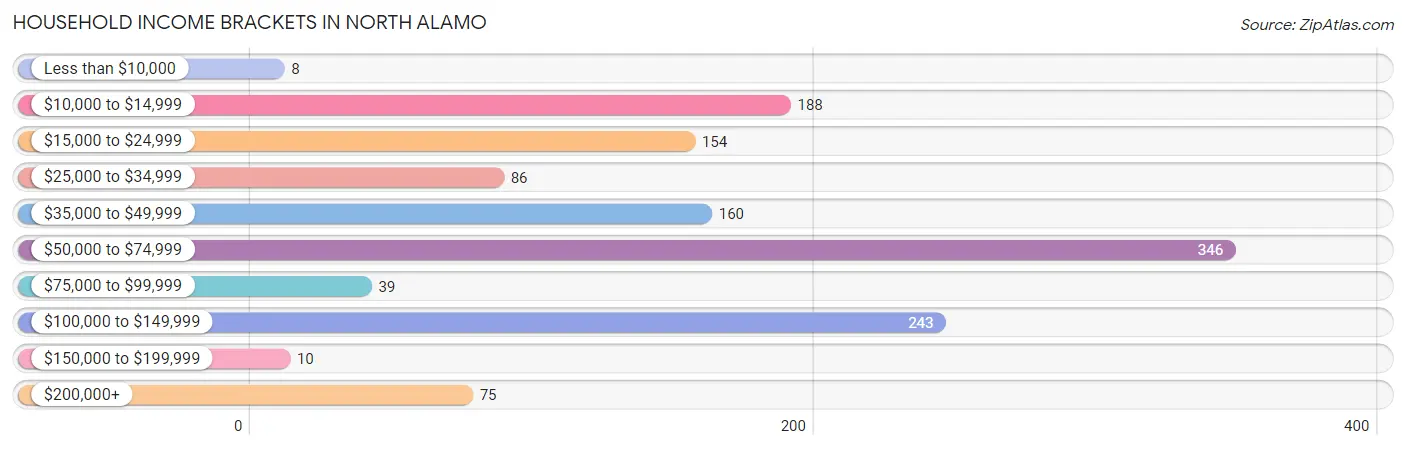
| Income Bracket | # Households | % Households |
| Less than $10,000 | 8 | 0.6% |
| $10,000 to $14,999 | 188 | 14.4% |
| $15,000 to $24,999 | 154 | 11.8% |
| $25,000 to $34,999 | 86 | 6.6% |
| $35,000 to $49,999 | 160 | 12.2% |
| $50,000 to $74,999 | 346 | 26.4% |
| $75,000 to $99,999 | 39 | 3.0% |
| $100,000 to $149,999 | 243 | 18.6% |
| $150,000 to $199,999 | 10 | 0.8% |
| $200,000+ | 75 | 5.7% |
Household Income by Householder Age in North Alamo
The median household income in North Alamo is $50,935, with the highest median household income of $77,981 found in the 25 to 44 years age bracket for the primary householder. A total of 529 households (40.4%) fall into this category. Meanwhile, the 15 to 24 years age bracket for the primary householder has the lowest median household income of $0, with 41 households (3.1%) in this group.
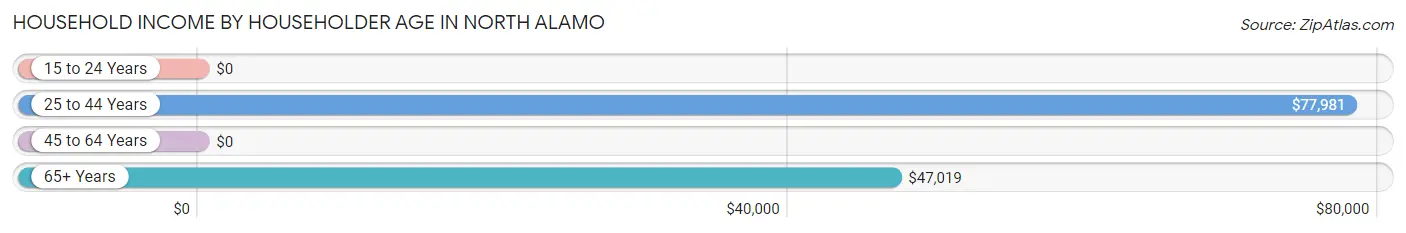
| Income Bracket | # Households | Median Income |
| 15 to 24 Years | 41 (3.1%) | $0 |
| 25 to 44 Years | 529 (40.4%) | $77,981 |
| 45 to 64 Years | 519 (39.7%) | $0 |
| 65+ Years | 220 (16.8%) | $47,019 |
| Total | 1,309 (100.0%) | $50,935 |
Poverty in North Alamo
Income Below Poverty by Sex and Age in North Alamo
With 20.5% poverty level for males and 33.4% for females among the residents of North Alamo, 16 and 17 year old males and 5 year old females are the most vulnerable to poverty, with 64 males (100.0%) and 40 females (69.0%) in their respective age groups living below the poverty level.
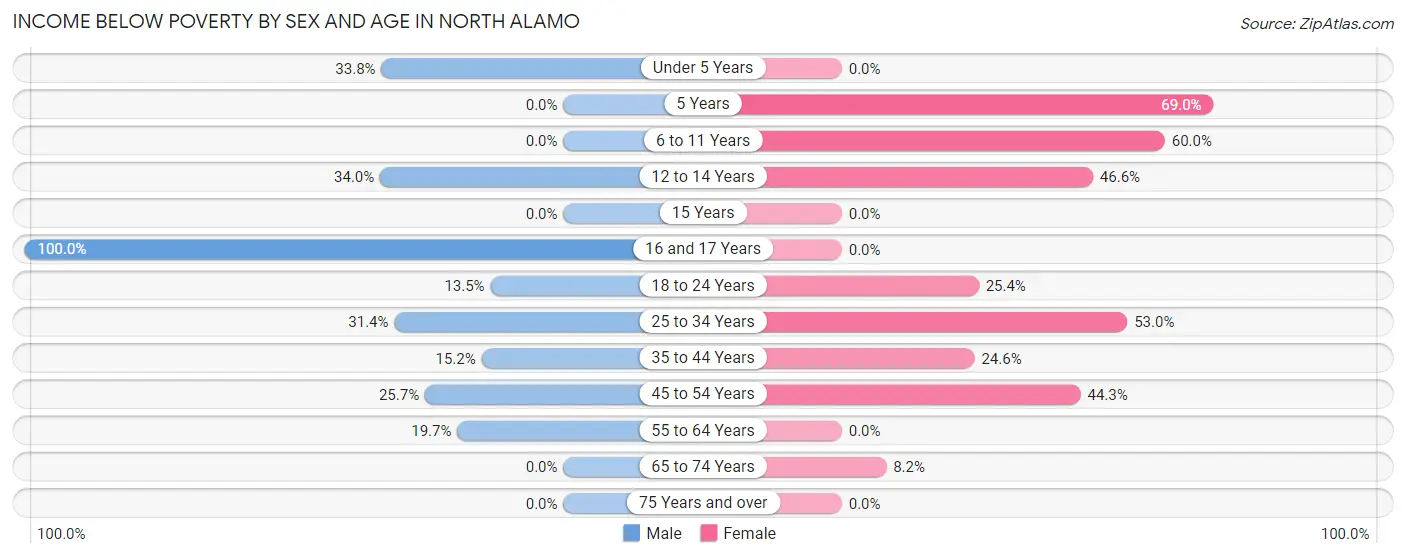
| Age Bracket | Male | Female |
| Under 5 Years | 51 (33.8%) | 0 (0.0%) |
| 5 Years | 0 (0.0%) | 40 (69.0%) |
| 6 to 11 Years | 0 (0.0%) | 271 (60.0%) |
| 12 to 14 Years | 101 (34.0%) | 117 (46.6%) |
| 15 Years | 0 (0.0%) | 0 (0.0%) |
| 16 and 17 Years | 64 (100.0%) | 0 (0.0%) |
| 18 to 24 Years | 41 (13.5%) | 62 (25.4%) |
| 25 to 34 Years | 48 (31.4%) | 178 (53.0%) |
| 35 to 44 Years | 56 (15.2%) | 99 (24.6%) |
| 45 to 54 Years | 66 (25.7%) | 179 (44.3%) |
| 55 to 64 Years | 25 (19.7%) | 0 (0.0%) |
| 65 to 74 Years | 0 (0.0%) | 22 (8.2%) |
| 75 Years and over | 0 (0.0%) | 0 (0.0%) |
| Total | 452 (20.5%) | 968 (33.4%) |
Income Above Poverty by Sex and Age in North Alamo
According to the poverty statistics in North Alamo, males aged 5 years and females aged under 5 years are the age groups that are most secure financially, with 100.0% of males and 100.0% of females in these age groups living above the poverty line.
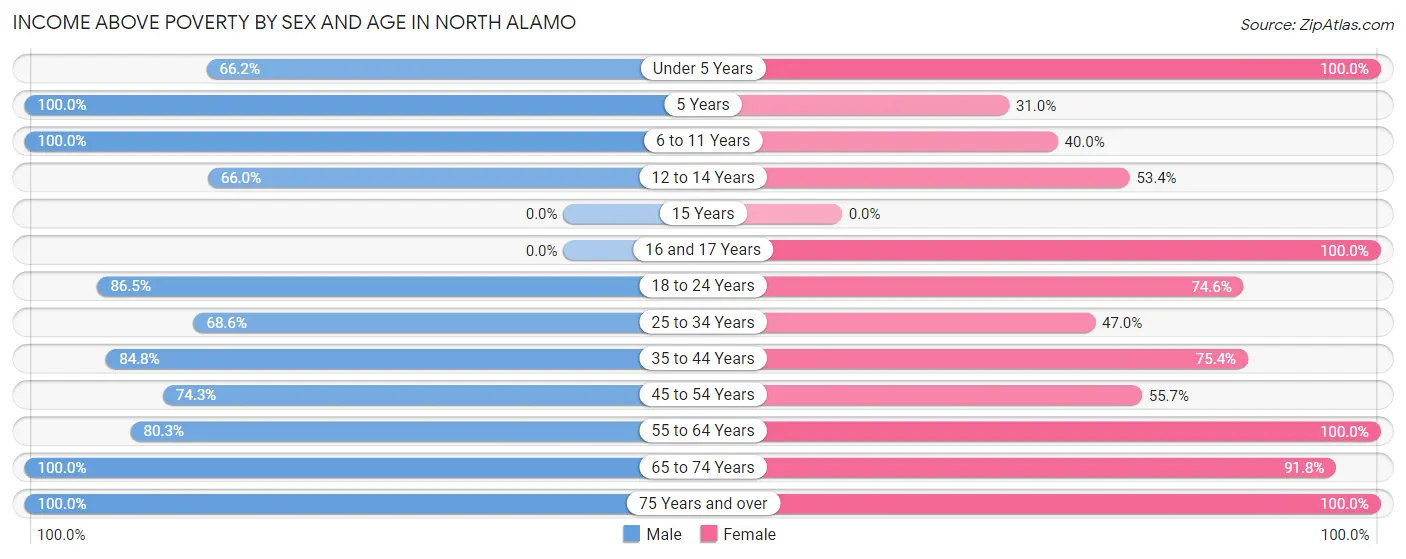
| Age Bracket | Male | Female |
| Under 5 Years | 100 (66.2%) | 132 (100.0%) |
| 5 Years | 68 (100.0%) | 18 (31.0%) |
| 6 to 11 Years | 265 (100.0%) | 181 (40.0%) |
| 12 to 14 Years | 196 (66.0%) | 134 (53.4%) |
| 15 Years | 0 (0.0%) | 0 (0.0%) |
| 16 and 17 Years | 0 (0.0%) | 177 (100.0%) |
| 18 to 24 Years | 262 (86.5%) | 182 (74.6%) |
| 25 to 34 Years | 105 (68.6%) | 158 (47.0%) |
| 35 to 44 Years | 313 (84.8%) | 303 (75.4%) |
| 45 to 54 Years | 191 (74.3%) | 225 (55.7%) |
| 55 to 64 Years | 102 (80.3%) | 100 (100.0%) |
| 65 to 74 Years | 94 (100.0%) | 245 (91.8%) |
| 75 Years and over | 56 (100.0%) | 76 (100.0%) |
| Total | 1,752 (79.5%) | 1,931 (66.6%) |
Income Below Poverty Among Married-Couple Families in North Alamo
The poverty statistics for married-couple families in North Alamo show that 15.1% or 99 of the total 655 families live below the poverty line. Families with 1 or 2 children have the highest poverty rate of 29.5%, comprising of 99 families. On the other hand, families with no children have the lowest poverty rate of 0.0%, which includes 0 families.
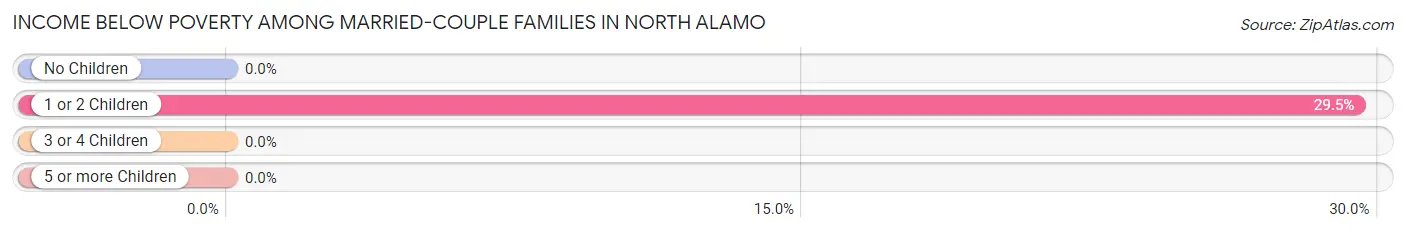
| Children | Above Poverty | Below Poverty |
| No Children | 219 (100.0%) | 0 (0.0%) |
| 1 or 2 Children | 237 (70.5%) | 99 (29.5%) |
| 3 or 4 Children | 100 (100.0%) | 0 (0.0%) |
| 5 or more Children | 0 (0.0%) | 0 (0.0%) |
| Total | 556 (84.9%) | 99 (15.1%) |
Income Below Poverty Among Single-Parent Households in North Alamo
According to the poverty data in North Alamo, 23.8% or 25 single-father households and 32.5% or 161 single-mother households are living below the poverty line. Among single-father households, those with 1 or 2 children have the highest poverty rate, with 25 households (23.8%) experiencing poverty. Likewise, among single-mother households, those with 3 or 4 children have the highest poverty rate, with 106 households (100.0%) falling below the poverty line.
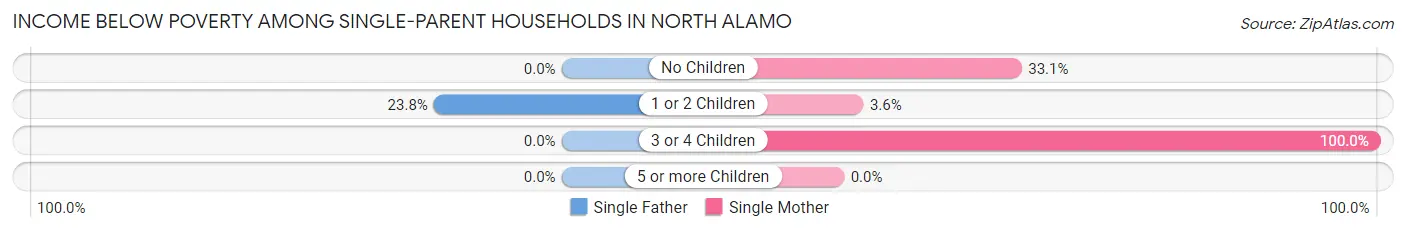
| Children | Single Father | Single Mother |
| No Children | 0 (0.0%) | 46 (33.1%) |
| 1 or 2 Children | 25 (23.8%) | 9 (3.6%) |
| 3 or 4 Children | 0 (0.0%) | 106 (100.0%) |
| 5 or more Children | 0 (0.0%) | 0 (0.0%) |
| Total | 25 (23.8%) | 161 (32.5%) |
Income Below Poverty Among Married-Couple vs Single-Parent Households in North Alamo
The poverty data for North Alamo shows that 99 of the married-couple family households (15.1%) and 186 of the single-parent households (31.0%) are living below the poverty level. Within the married-couple family households, those with 1 or 2 children have the highest poverty rate, with 99 households (29.5%) falling below the poverty line. Among the single-parent households, those with 3 or 4 children have the highest poverty rate, with 106 household (100.0%) living below poverty.
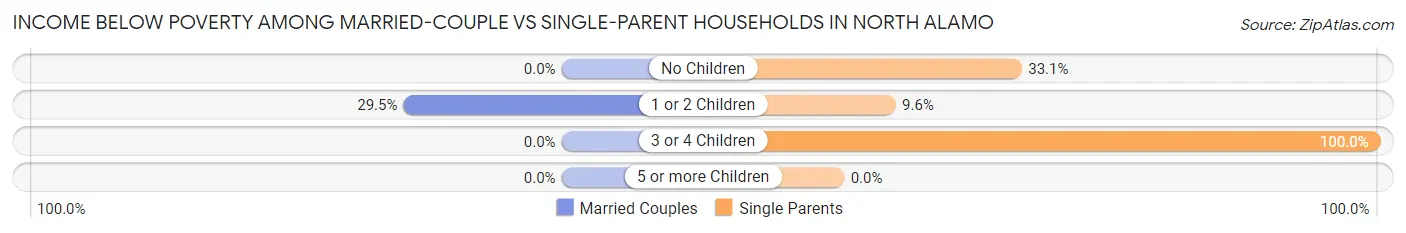
| Children | Married-Couple Families | Single-Parent Households |
| No Children | 0 (0.0%) | 46 (33.1%) |
| 1 or 2 Children | 99 (29.5%) | 34 (9.6%) |
| 3 or 4 Children | 0 (0.0%) | 106 (100.0%) |
| 5 or more Children | 0 (0.0%) | 0 (0.0%) |
| Total | 99 (15.1%) | 186 (31.0%) |
Race in North Alamo
The most populous races in North Alamo are Hispanic or Latino (4,945 | 96.4%), White / Caucasian (2,860 | 55.7%), and Two or more Races (2,007 | 39.1%).
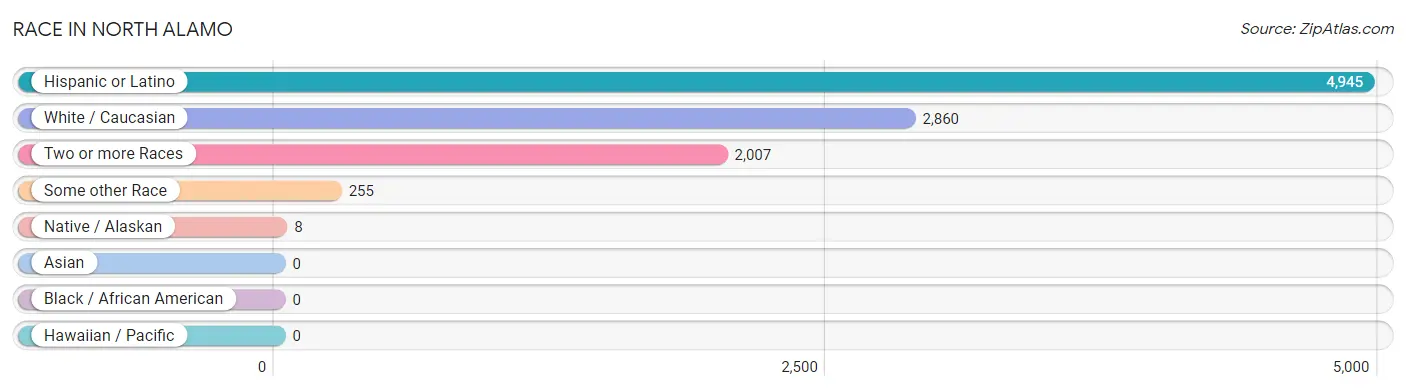
| Race | # Population | % Population |
| Asian | 0 | 0.0% |
| Black / African American | 0 | 0.0% |
| Hawaiian / Pacific | 0 | 0.0% |
| Hispanic or Latino | 4,945 | 96.4% |
| Native / Alaskan | 8 | 0.2% |
| White / Caucasian | 2,860 | 55.7% |
| Two or more Races | 2,007 | 39.1% |
| Some other Race | 255 | 5.0% |
| Total | 5,130 | 100.0% |
Ancestry in North Alamo
The most populous ancestries reported in North Alamo are Mexican (4,924 | 96.0%), German (42 | 0.8%), English (34 | 0.7%), Irish (28 | 0.5%), and American (20 | 0.4%), together accounting for 98.4% of all North Alamo residents.
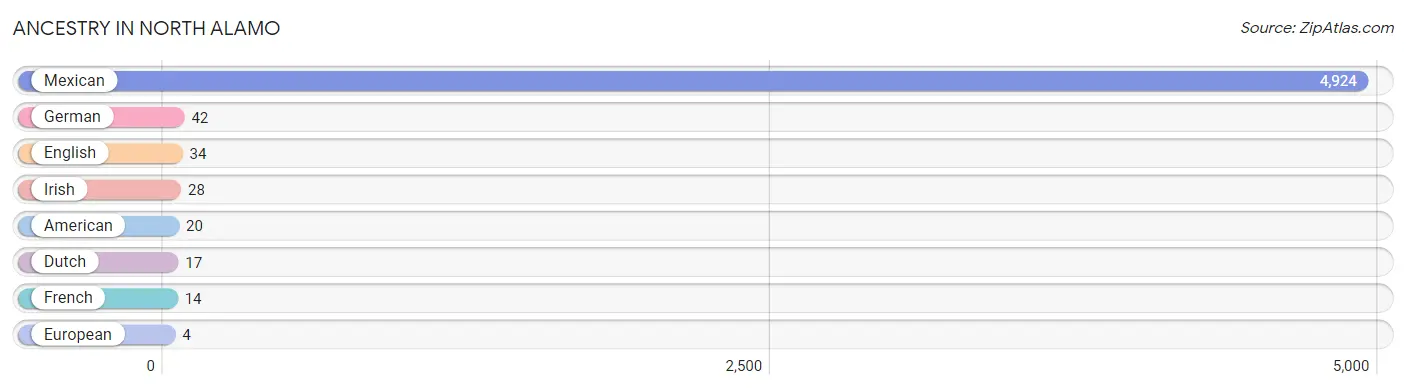
| Ancestry | # Population | % Population |
| American | 20 | 0.4% |
| Dutch | 17 | 0.3% |
| English | 34 | 0.7% |
| European | 4 | 0.1% |
| French | 14 | 0.3% |
| German | 42 | 0.8% |
| Irish | 28 | 0.5% |
| Mexican | 4,924 | 96.0% | View All 8 Rows |
Immigrants in North Alamo
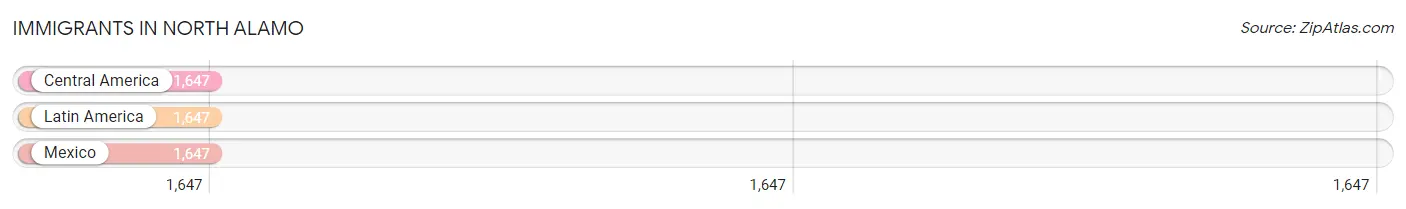
The most numerous immigrant groups reported in North Alamo came from Central America (1,647 | 32.1%), Latin America (1,647 | 32.1%), and Mexico (1,647 | 32.1%), together accounting for 96.3% of all North Alamo residents.
| Immigration Origin | # Population | % Population |
| Central America | 1,647 | 32.1% |
| Latin America | 1,647 | 32.1% |
| Mexico | 1,647 | 32.1% | View All 3 Rows |
Sex and Age in North Alamo
Sex and Age in North Alamo
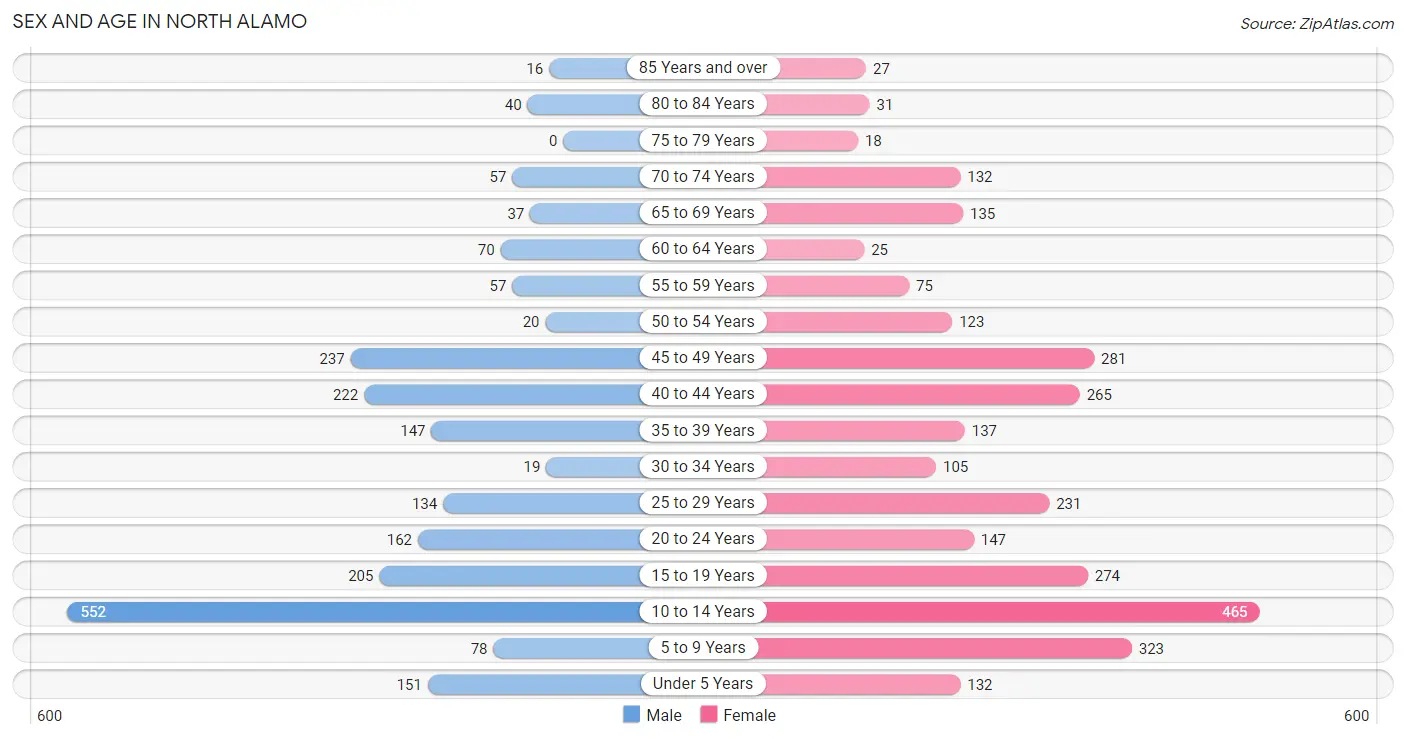
The most populous age groups in North Alamo are 10 to 14 Years (552 | 25.1%) for men and 10 to 14 Years (465 | 15.9%) for women.
| Age Bracket | Male | Female |
| Under 5 Years | 151 (6.9%) | 132 (4.5%) |
| 5 to 9 Years | 78 (3.5%) | 323 (11.0%) |
| 10 to 14 Years | 552 (25.1%) | 465 (15.9%) |
| 15 to 19 Years | 205 (9.3%) | 274 (9.4%) |
| 20 to 24 Years | 162 (7.3%) | 147 (5.0%) |
| 25 to 29 Years | 134 (6.1%) | 231 (7.9%) |
| 30 to 34 Years | 19 (0.9%) | 105 (3.6%) |
| 35 to 39 Years | 147 (6.7%) | 137 (4.7%) |
| 40 to 44 Years | 222 (10.1%) | 265 (9.1%) |
| 45 to 49 Years | 237 (10.7%) | 281 (9.6%) |
| 50 to 54 Years | 20 (0.9%) | 123 (4.2%) |
| 55 to 59 Years | 57 (2.6%) | 75 (2.6%) |
| 60 to 64 Years | 70 (3.2%) | 25 (0.9%) |
| 65 to 69 Years | 37 (1.7%) | 135 (4.6%) |
| 70 to 74 Years | 57 (2.6%) | 132 (4.5%) |
| 75 to 79 Years | 0 (0.0%) | 18 (0.6%) |
| 80 to 84 Years | 40 (1.8%) | 31 (1.1%) |
| 85 Years and over | 16 (0.7%) | 27 (0.9%) |
| Total | 2,204 (100.0%) | 2,926 (100.0%) |
Families and Households in North Alamo
Median Family Size in North Alamo
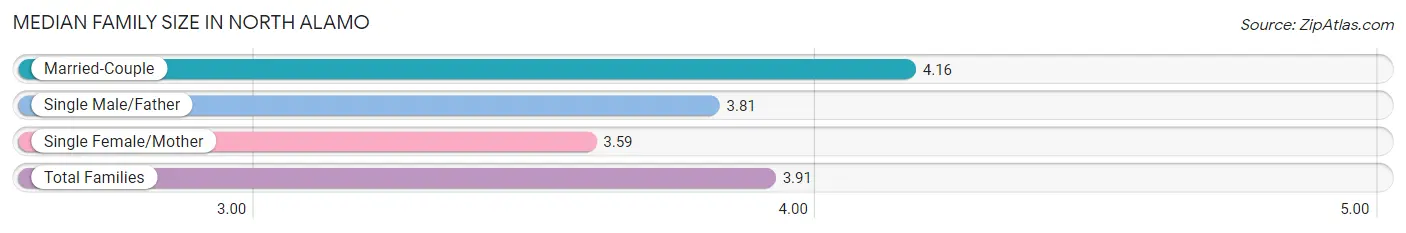
The median family size in North Alamo is 3.91 persons per family, with married-couple families (655 | 52.2%) accounting for the largest median family size of 4.16 persons per family. On the other hand, single female/mother families (495 | 39.4%) represent the smallest median family size with 3.59 persons per family.
| Family Type | # Families | Family Size |
| Married-Couple | 655 (52.2%) | 4.16 |
| Single Male/Father | 105 (8.4%) | 3.81 |
| Single Female/Mother | 495 (39.4%) | 3.59 |
| Total Families | 1,255 (100.0%) | 3.91 |
Median Household Size in North Alamo
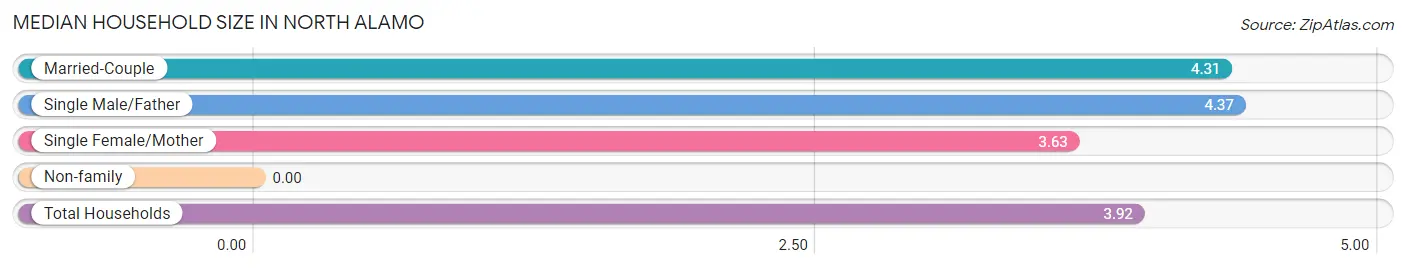
| Household Type | # Households | Household Size |
| Married-Couple | 655 (50.0%) | 4.31 |
| Single Male/Father | 105 (8.0%) | 4.37 |
| Single Female/Mother | 495 (37.8%) | 3.63 |
| Non-family | 54 (4.1%) | - |
| Total Households | 1,309 (100.0%) | 3.92 |
Household Size by Marriage Status in North Alamo
Out of a total of 1,309 households in North Alamo, 1,255 (95.9%) are family households, while 54 (4.1%) are nonfamily households. The most numerous type of family households are 4-person households, comprising 484, and the most common type of nonfamily households are 1-person households, comprising 54.
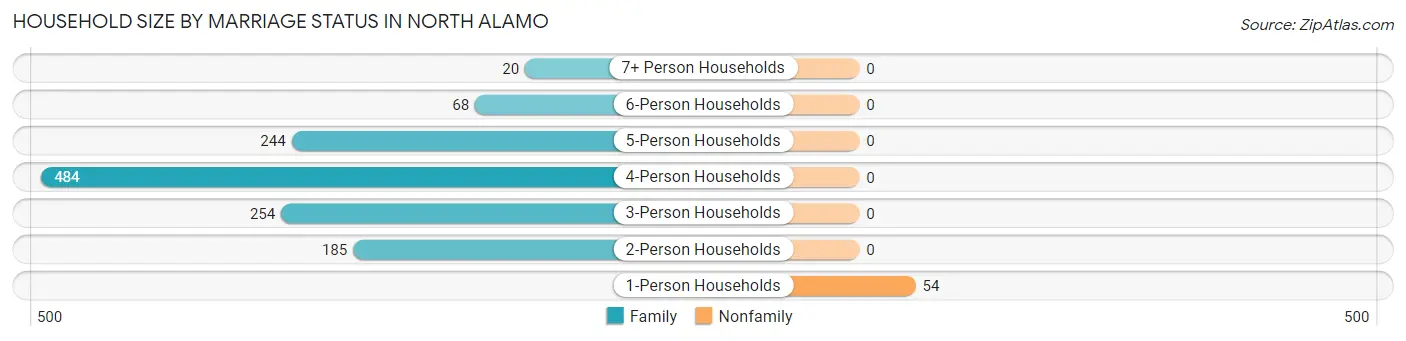
| Household Size | Family Households | Nonfamily Households |
| 1-Person Households | - | 54 (4.1%) |
| 2-Person Households | 185 (14.1%) | 0 (0.0%) |
| 3-Person Households | 254 (19.4%) | 0 (0.0%) |
| 4-Person Households | 484 (37.0%) | 0 (0.0%) |
| 5-Person Households | 244 (18.6%) | 0 (0.0%) |
| 6-Person Households | 68 (5.2%) | 0 (0.0%) |
| 7+ Person Households | 20 (1.5%) | 0 (0.0%) |
| Total | 1,255 (95.9%) | 54 (4.1%) |
Female Fertility in North Alamo
Fertility by Age in North Alamo
Average fertility rate in North Alamo is 72.0 births per 1,000 women. Women in the age bracket of 20 to 34 years have the highest fertility rate with 222.0 births per 1,000 women. Women in the age bracket of 20 to 34 years acount for 100.0% of all women with births.
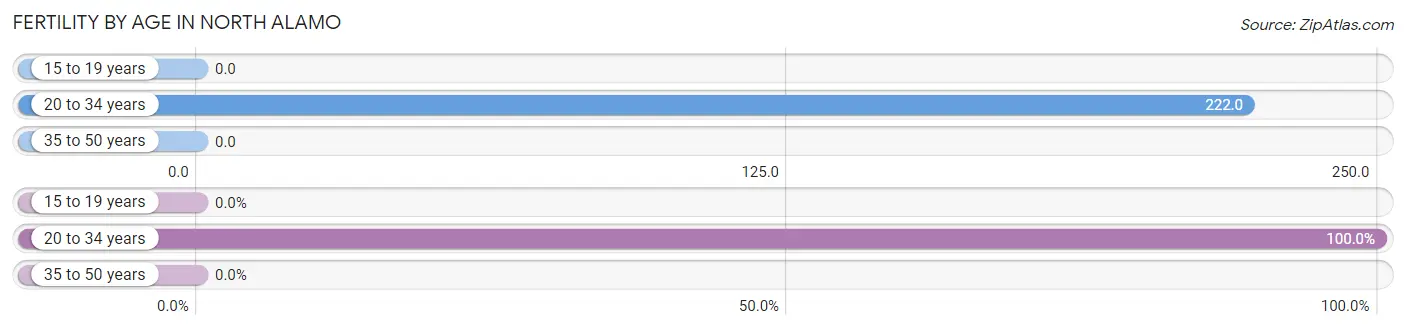
| Age Bracket | Women with Births | Births / 1,000 Women |
| 15 to 19 years | 0 (0.0%) | 0.0 |
| 20 to 34 years | 107 (100.0%) | 222.0 |
| 35 to 50 years | 0 (0.0%) | 0.0 |
| Total | 107 (100.0%) | 72.0 |
Fertility by Age by Marriage Status in North Alamo
92.5% of women with births (107) in North Alamo are married. The highest percentage of unmarried women with births falls into 20 to 34 years age bracket with 7.5% of them unmarried at the time of birth, while the lowest percentage of unmarried women with births belong to 20 to 34 years age bracket with 7.5% of them unmarried.
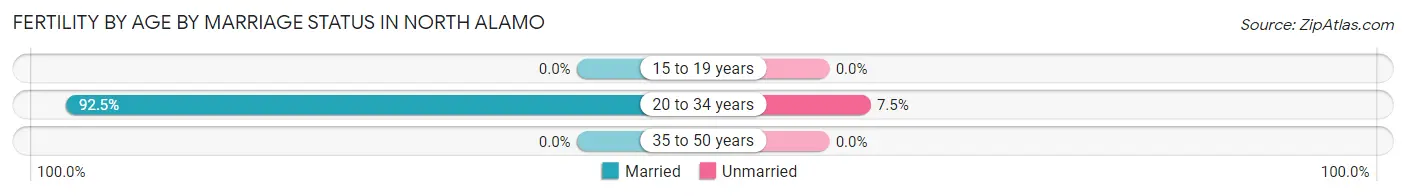
| Age Bracket | Married | Unmarried |
| 15 to 19 years | 0 (0.0%) | 0 (0.0%) |
| 20 to 34 years | 99 (92.5%) | 8 (7.5%) |
| 35 to 50 years | 0 (0.0%) | 0 (0.0%) |
| Total | 99 (92.5%) | 8 (7.5%) |
Fertility by Education in North Alamo
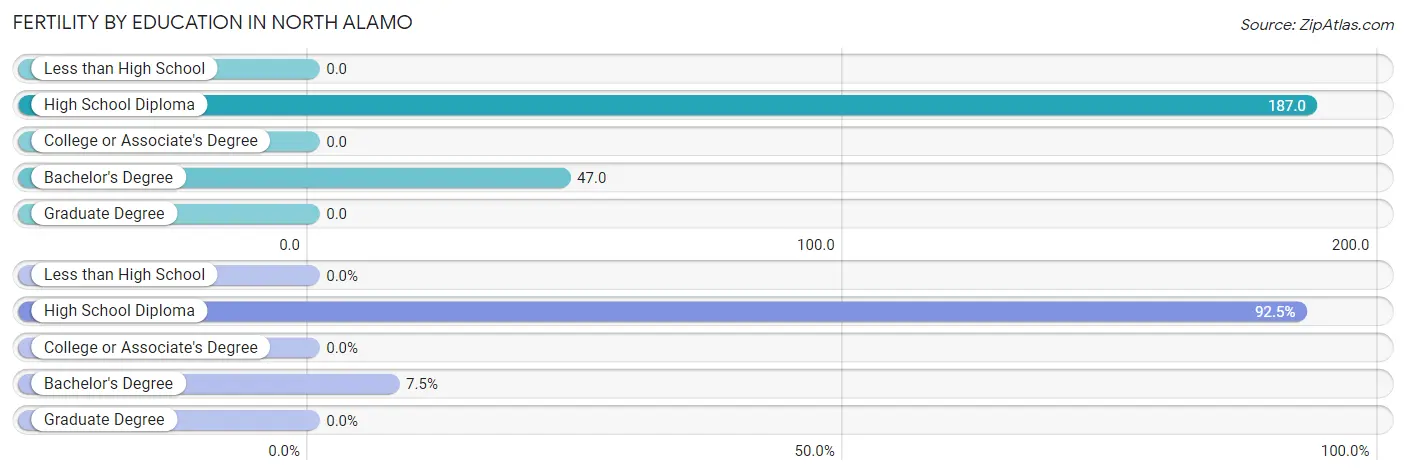
| Educational Attainment | Women with Births | Births / 1,000 Women |
| Less than High School | 0 (0.0%) | 0.0 |
| High School Diploma | 99 (92.5%) | 187.0 |
| College or Associate's Degree | 0 (0.0%) | 0.0 |
| Bachelor's Degree | 8 (7.5%) | 47.0 |
| Graduate Degree | 0 (0.0%) | 0.0 |
| Total | 107 (100.0%) | 72.0 |
Fertility by Education by Marriage Status in North Alamo
7.5% of women with births in North Alamo are unmarried. Women with the educational attainment of high school diploma are most likely to be married with 100.0% of them married at childbirth, while women with the educational attainment of bachelor's degree are least likely to be married with 100.0% of them unmarried at childbirth.
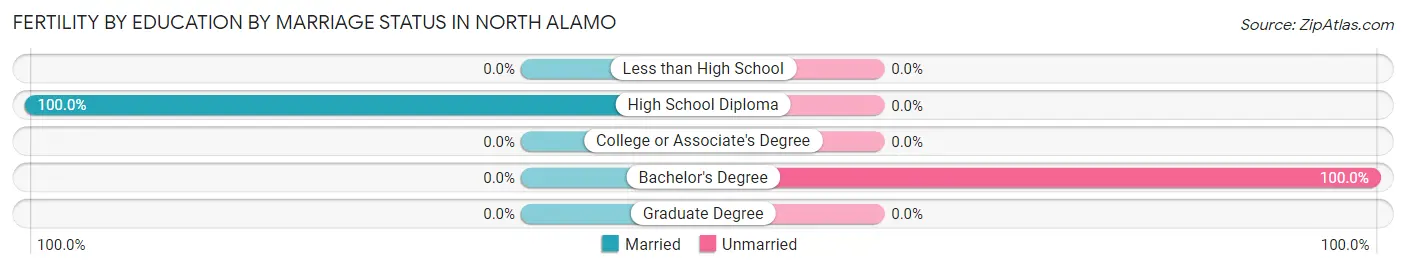
| Educational Attainment | Married | Unmarried |
| Less than High School | 0 (0.0%) | 0 (0.0%) |
| High School Diploma | 99 (100.0%) | 0 (0.0%) |
| College or Associate's Degree | 0 (0.0%) | 0 (0.0%) |
| Bachelor's Degree | 0 (0.0%) | 8 (100.0%) |
| Graduate Degree | 0 (0.0%) | 0 (0.0%) |
| Total | 99 (92.5%) | 8 (7.5%) |
Employment Characteristics in North Alamo
Employment by Class of Employer in North Alamo
Among the 1,757 employed individuals in North Alamo, private company employees (1,201 | 68.4%), local government employees (295 | 16.8%), and self-employed (not incorporated) (121 | 6.9%) make up the most common classes of employment.
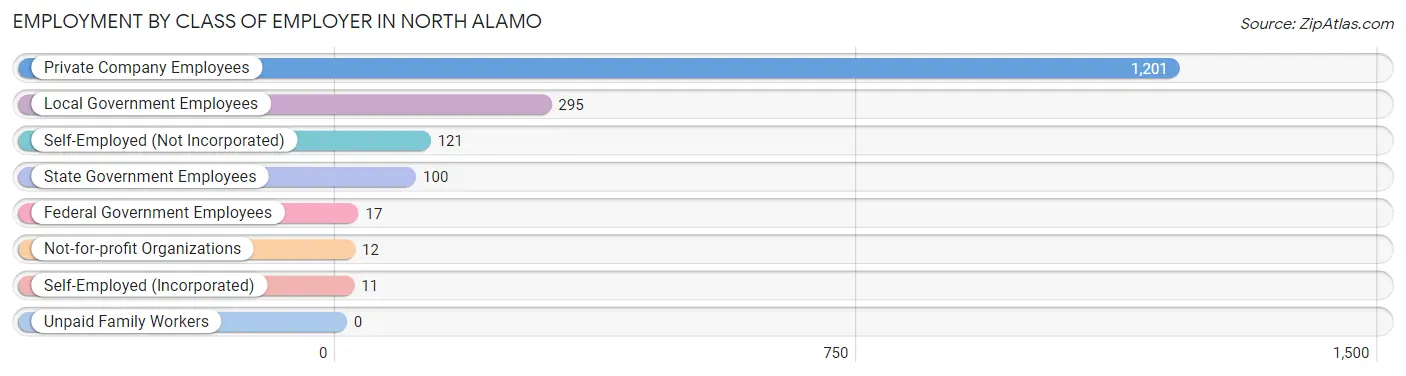
| Employer Class | # Employees | % Employees |
| Private Company Employees | 1,201 | 68.4% |
| Self-Employed (Incorporated) | 11 | 0.6% |
| Self-Employed (Not Incorporated) | 121 | 6.9% |
| Not-for-profit Organizations | 12 | 0.7% |
| Local Government Employees | 295 | 16.8% |
| State Government Employees | 100 | 5.7% |
| Federal Government Employees | 17 | 1.0% |
| Unpaid Family Workers | 0 | 0.0% |
| Total | 1,757 | 100.0% |
Employment Status by Age in North Alamo
According to the labor force statistics for North Alamo, out of the total population over 16 years of age (3,429), 54.5% or 1,869 individuals are in the labor force, with 4.9% or 92 of them unemployed. The age group with the highest labor force participation rate is 30 to 34 years, with 100.0% or 124 individuals in the labor force. Within the labor force, the 20 to 24 years age range has the highest percentage of unemployed individuals, with 22.6% or 49 of them being unemployed.
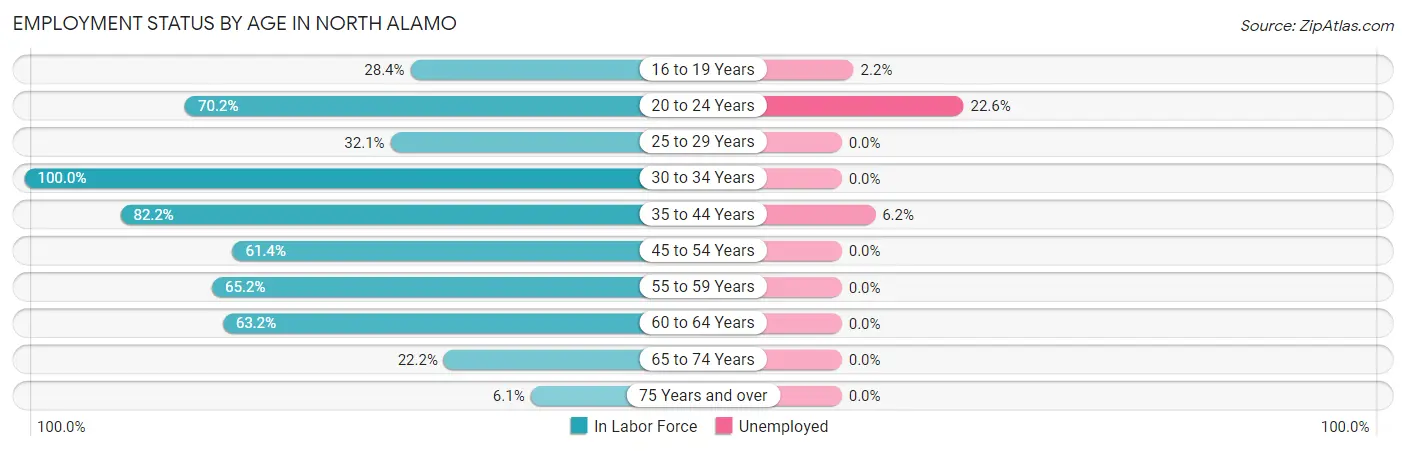
| Age Bracket | In Labor Force | Unemployed |
| 16 to 19 Years | 136 (28.4%) | 3 (2.2%) |
| 20 to 24 Years | 217 (70.2%) | 49 (22.6%) |
| 25 to 29 Years | 117 (32.1%) | 0 (0.0%) |
| 30 to 34 Years | 124 (100.0%) | 0 (0.0%) |
| 35 to 44 Years | 634 (82.2%) | 39 (6.2%) |
| 45 to 54 Years | 406 (61.4%) | 0 (0.0%) |
| 55 to 59 Years | 86 (65.2%) | 0 (0.0%) |
| 60 to 64 Years | 60 (63.2%) | 0 (0.0%) |
| 65 to 74 Years | 80 (22.2%) | 0 (0.0%) |
| 75 Years and over | 8 (6.1%) | 0 (0.0%) |
| Total | 1,869 (54.5%) | 92 (4.9%) |
Employment Status by Educational Attainment in North Alamo
According to labor force statistics for North Alamo, 66.4% of individuals (1,426) out of the total population between 25 and 64 years of age (2,148) are in the labor force, with 2.7% or 39 of them being unemployed. The group with the highest labor force participation rate are those with the educational attainment of bachelor's degree or higher, with 91.8% or 334 individuals in the labor force. Within the labor force, individuals with high school diploma education have the highest percentage of unemployment, with 11.0% or 39 of them being unemployed.
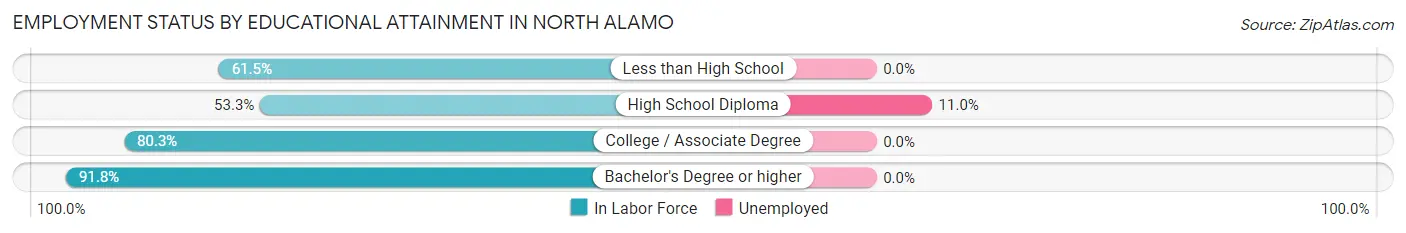
| Educational Attainment | In Labor Force | Unemployed |
| Less than High School | 523 (61.5%) | 0 (0.0%) |
| High School Diploma | 354 (53.3%) | 73 (11.0%) |
| College / Associate Degree | 216 (80.3%) | 0 (0.0%) |
| Bachelor's Degree or higher | 334 (91.8%) | 0 (0.0%) |
| Total | 1,426 (66.4%) | 58 (2.7%) |
Employment Occupations by Sex in North Alamo
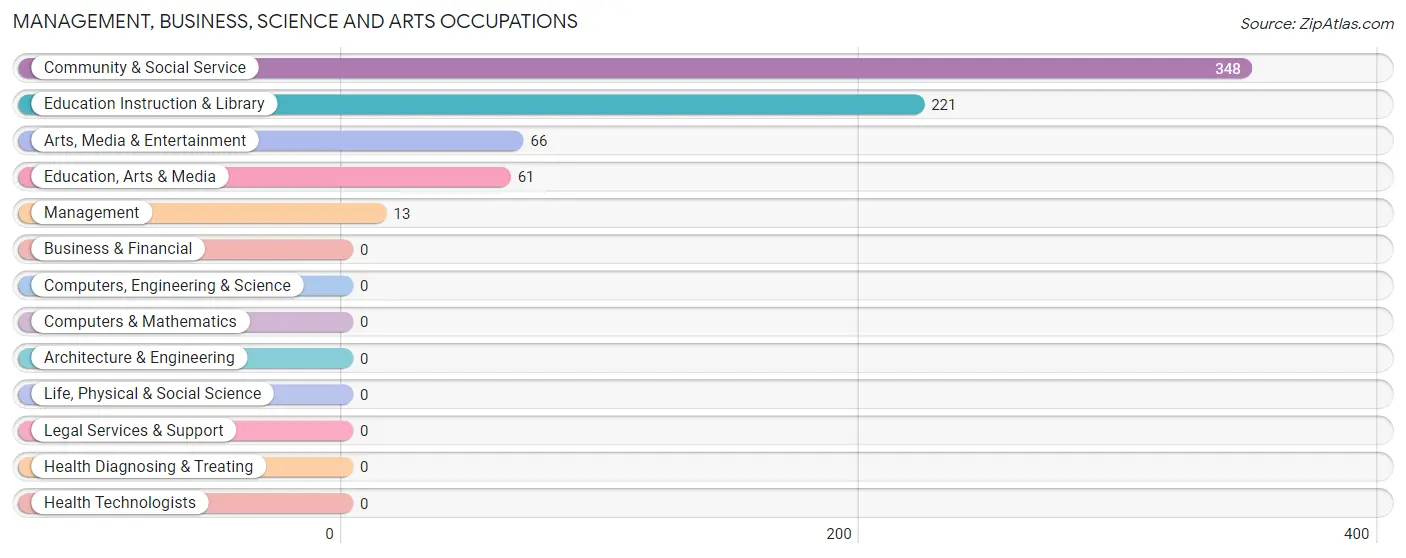
Management, Business, Science and Arts Occupations
The most common Management, Business, Science and Arts occupations in North Alamo are Community & Social Service (348 | 19.6%), Education Instruction & Library (221 | 12.4%), Arts, Media & Entertainment (66 | 3.7%), Education, Arts & Media (61 | 3.4%), and Management (13 | 0.7%).
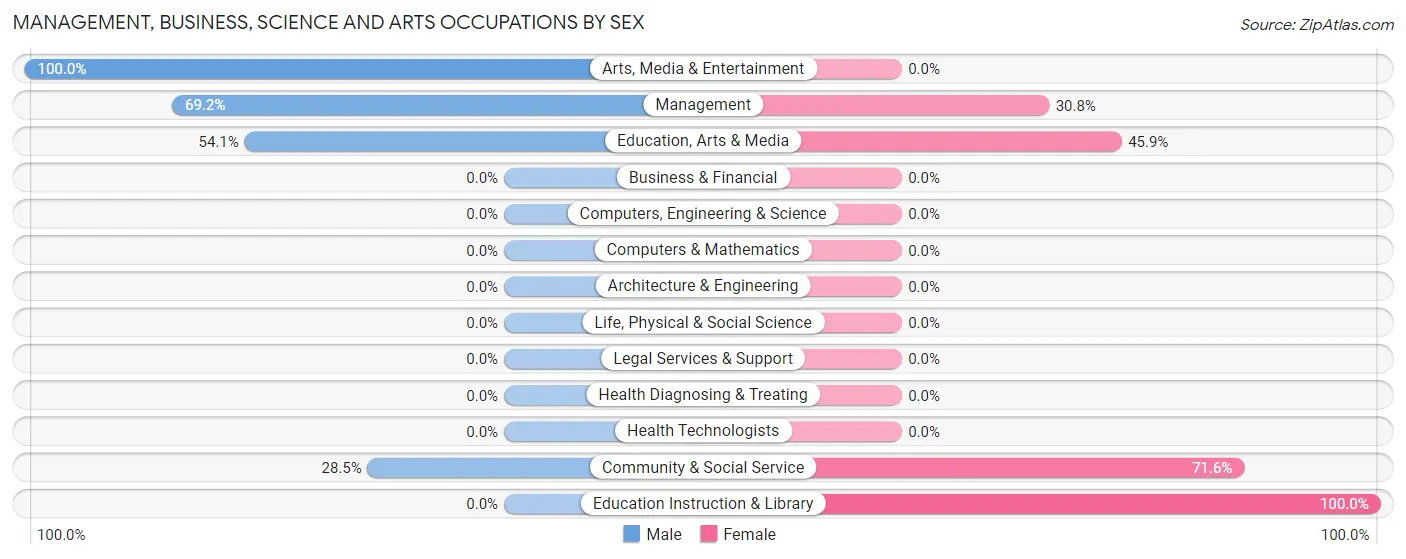
Management, Business, Science and Arts Occupations by Sex
Within the Management, Business, Science and Arts occupations in North Alamo, the most male-oriented occupations are Arts, Media & Entertainment (100.0%), Management (69.2%), and Education, Arts & Media (54.1%), while the most female-oriented occupations are Education Instruction & Library (100.0%), Community & Social Service (71.6%), and Education, Arts & Media (45.9%).
| Occupation | Male | Female |
| Management | 9 (69.2%) | 4 (30.8%) |
| Business & Financial | 0 (0.0%) | 0 (0.0%) |
| Computers, Engineering & Science | 0 (0.0%) | 0 (0.0%) |
| Computers & Mathematics | 0 (0.0%) | 0 (0.0%) |
| Architecture & Engineering | 0 (0.0%) | 0 (0.0%) |
| Life, Physical & Social Science | 0 (0.0%) | 0 (0.0%) |
| Community & Social Service | 99 (28.4%) | 249 (71.6%) |
| Education, Arts & Media | 33 (54.1%) | 28 (45.9%) |
| Legal Services & Support | 0 (0.0%) | 0 (0.0%) |
| Education Instruction & Library | 0 (0.0%) | 221 (100.0%) |
| Arts, Media & Entertainment | 66 (100.0%) | 0 (0.0%) |
| Health Diagnosing & Treating | 0 (0.0%) | 0 (0.0%) |
| Health Technologists | 0 (0.0%) | 0 (0.0%) |
| Total (Category) | 108 (29.9%) | 253 (70.1%) |
| Total (Overall) | 1,062 (59.8%) | 715 (40.2%) |
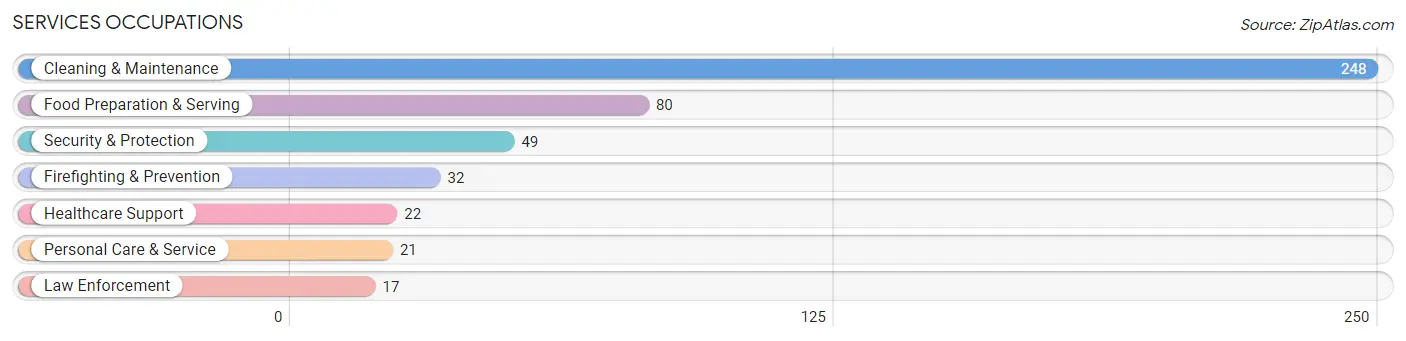
Services Occupations
The most common Services occupations in North Alamo are Cleaning & Maintenance (248 | 14.0%), Food Preparation & Serving (80 | 4.5%), Security & Protection (49 | 2.8%), Firefighting & Prevention (32 | 1.8%), and Healthcare Support (22 | 1.2%).
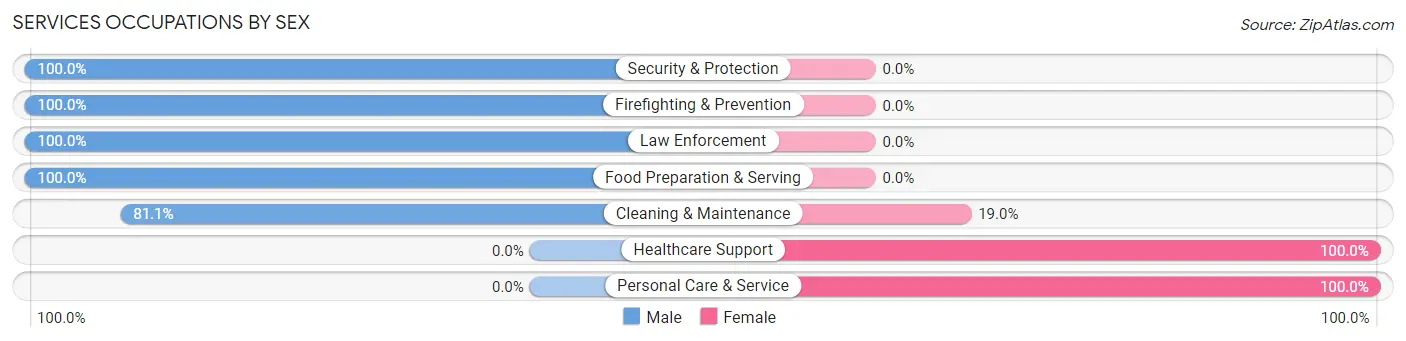
Services Occupations by Sex
Within the Services occupations in North Alamo, the most male-oriented occupations are Security & Protection (100.0%), Firefighting & Prevention (100.0%), and Law Enforcement (100.0%), while the most female-oriented occupations are Healthcare Support (100.0%), Personal Care & Service (100.0%), and Cleaning & Maintenance (19.0%).
| Occupation | Male | Female |
| Healthcare Support | 0 (0.0%) | 22 (100.0%) |
| Security & Protection | 49 (100.0%) | 0 (0.0%) |
| Firefighting & Prevention | 32 (100.0%) | 0 (0.0%) |
| Law Enforcement | 17 (100.0%) | 0 (0.0%) |
| Food Preparation & Serving | 80 (100.0%) | 0 (0.0%) |
| Cleaning & Maintenance | 201 (81.0%) | 47 (19.0%) |
| Personal Care & Service | 0 (0.0%) | 21 (100.0%) |
| Total (Category) | 330 (78.6%) | 90 (21.4%) |
| Total (Overall) | 1,062 (59.8%) | 715 (40.2%) |
Sales and Office Occupations
The most common Sales and Office occupations in North Alamo are Sales & Related (217 | 12.2%), and Office & Administration (206 | 11.6%).
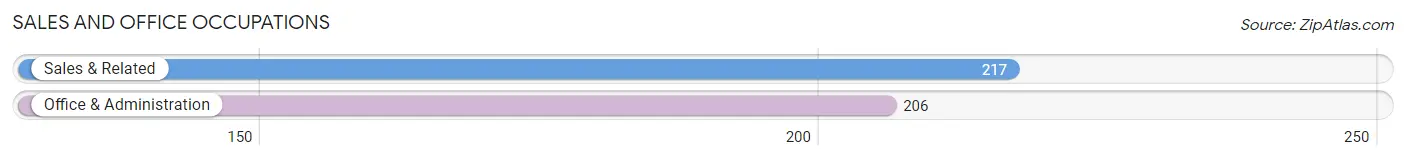
Sales and Office Occupations by Sex

| Occupation | Male | Female |
| Sales & Related | 166 (76.5%) | 51 (23.5%) |
| Office & Administration | 23 (11.2%) | 183 (88.8%) |
| Total (Category) | 189 (44.7%) | 234 (55.3%) |
| Total (Overall) | 1,062 (59.8%) | 715 (40.2%) |
Natural Resources, Construction and Maintenance Occupations
The most common Natural Resources, Construction and Maintenance occupations in North Alamo are Construction & Extraction (196 | 11.0%), and Installation, Maintenance & Repair (46 | 2.6%).
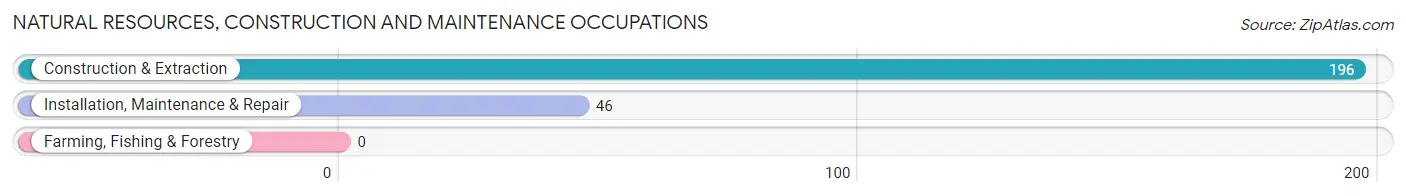
Natural Resources, Construction and Maintenance Occupations by Sex
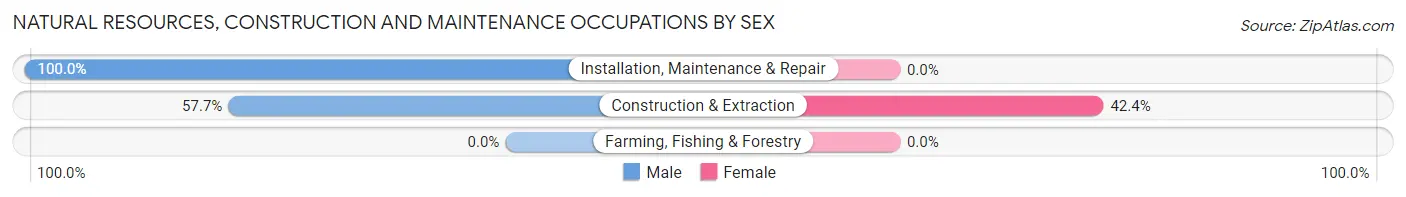
| Occupation | Male | Female |
| Farming, Fishing & Forestry | 0 (0.0%) | 0 (0.0%) |
| Construction & Extraction | 113 (57.7%) | 83 (42.3%) |
| Installation, Maintenance & Repair | 46 (100.0%) | 0 (0.0%) |
| Total (Category) | 159 (65.7%) | 83 (34.3%) |
| Total (Overall) | 1,062 (59.8%) | 715 (40.2%) |
Production, Transportation and Moving Occupations
The most common Production, Transportation and Moving occupations in North Alamo are Material Moving (134 | 7.5%), Transportation (117 | 6.6%), and Production (80 | 4.5%).
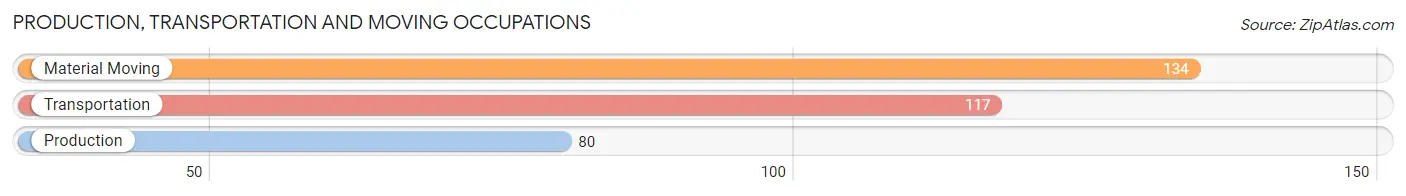
Production, Transportation and Moving Occupations by Sex
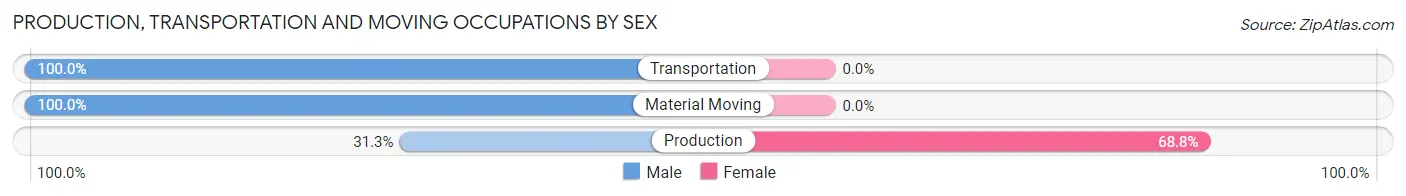
| Occupation | Male | Female |
| Production | 25 (31.2%) | 55 (68.8%) |
| Transportation | 117 (100.0%) | 0 (0.0%) |
| Material Moving | 134 (100.0%) | 0 (0.0%) |
| Total (Category) | 276 (83.4%) | 55 (16.6%) |
| Total (Overall) | 1,062 (59.8%) | 715 (40.2%) |
Employment Industries by Sex in North Alamo
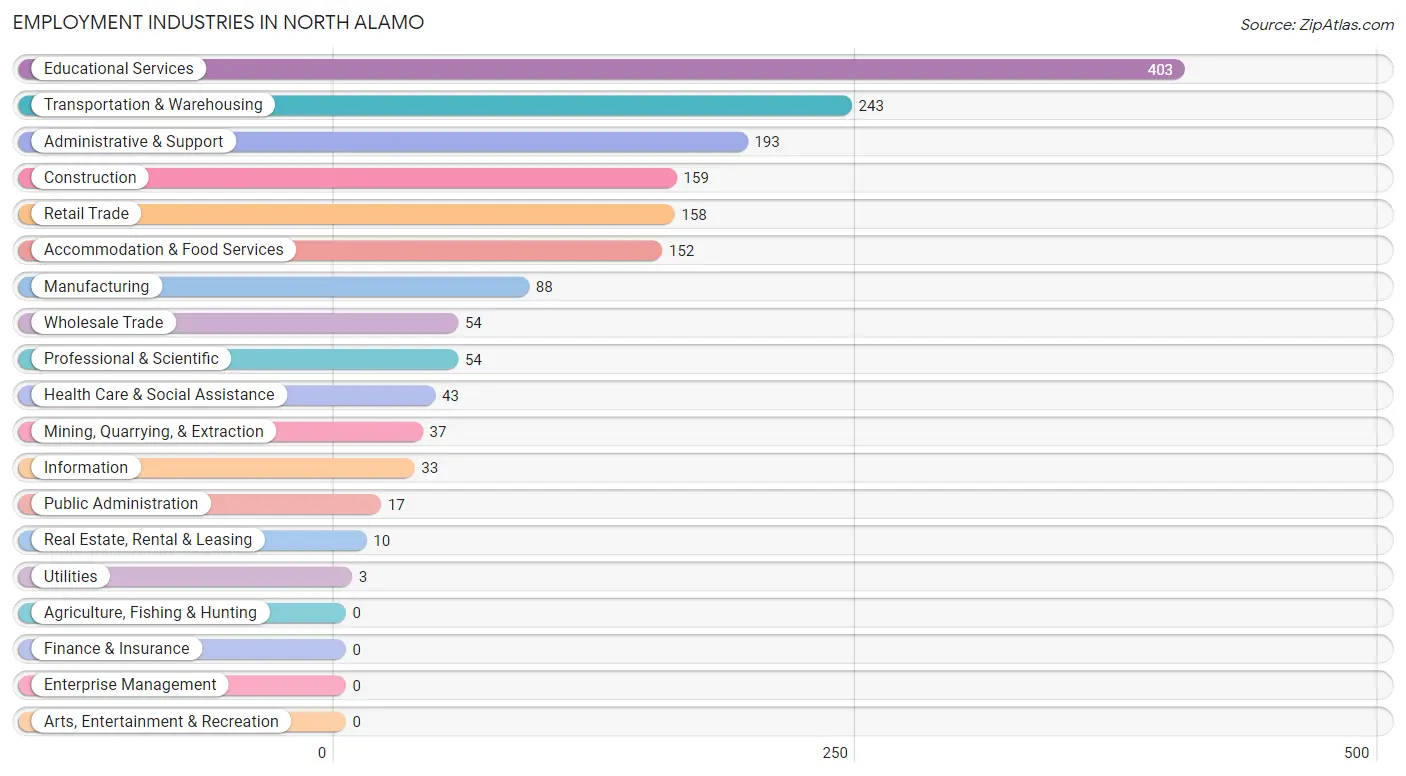
Employment Industries in North Alamo
The major employment industries in North Alamo include Educational Services (403 | 22.7%), Transportation & Warehousing (243 | 13.7%), Administrative & Support (193 | 10.9%), Construction (159 | 8.9%), and Retail Trade (158 | 8.9%).
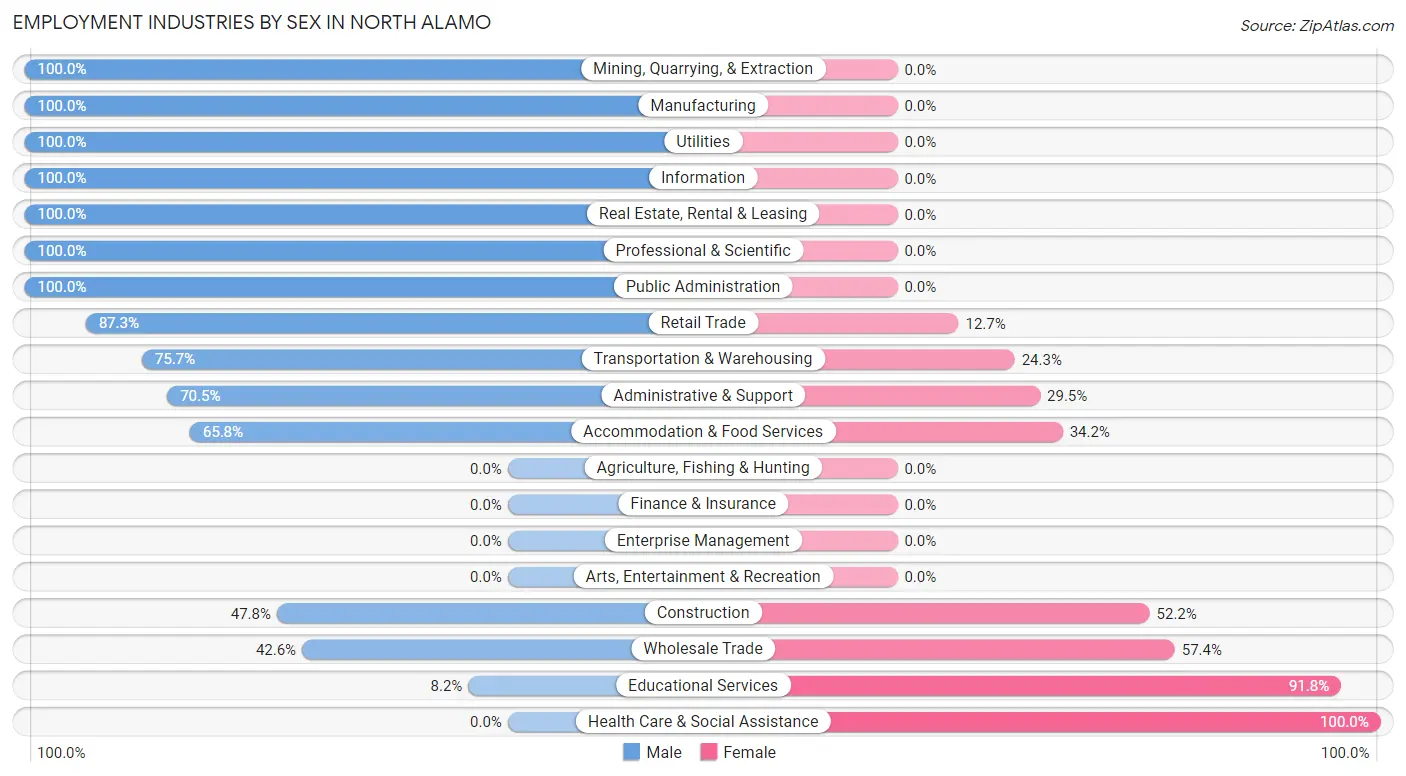
Employment Industries by Sex in North Alamo
The North Alamo industries that see more men than women are Mining, Quarrying, & Extraction (100.0%), Manufacturing (100.0%), and Utilities (100.0%), whereas the industries that tend to have a higher number of women are Health Care & Social Assistance (100.0%), Educational Services (91.8%), and Wholesale Trade (57.4%).
| Industry | Male | Female |
| Agriculture, Fishing & Hunting | 0 (0.0%) | 0 (0.0%) |
| Mining, Quarrying, & Extraction | 37 (100.0%) | 0 (0.0%) |
| Construction | 76 (47.8%) | 83 (52.2%) |
| Manufacturing | 88 (100.0%) | 0 (0.0%) |
| Wholesale Trade | 23 (42.6%) | 31 (57.4%) |
| Retail Trade | 138 (87.3%) | 20 (12.7%) |
| Transportation & Warehousing | 184 (75.7%) | 59 (24.3%) |
| Utilities | 3 (100.0%) | 0 (0.0%) |
| Information | 33 (100.0%) | 0 (0.0%) |
| Finance & Insurance | 0 (0.0%) | 0 (0.0%) |
| Real Estate, Rental & Leasing | 10 (100.0%) | 0 (0.0%) |
| Professional & Scientific | 54 (100.0%) | 0 (0.0%) |
| Enterprise Management | 0 (0.0%) | 0 (0.0%) |
| Administrative & Support | 136 (70.5%) | 57 (29.5%) |
| Educational Services | 33 (8.2%) | 370 (91.8%) |
| Health Care & Social Assistance | 0 (0.0%) | 43 (100.0%) |
| Arts, Entertainment & Recreation | 0 (0.0%) | 0 (0.0%) |
| Accommodation & Food Services | 100 (65.8%) | 52 (34.2%) |
| Public Administration | 17 (100.0%) | 0 (0.0%) |
| Total | 1,062 (59.8%) | 715 (40.2%) |
Education in North Alamo
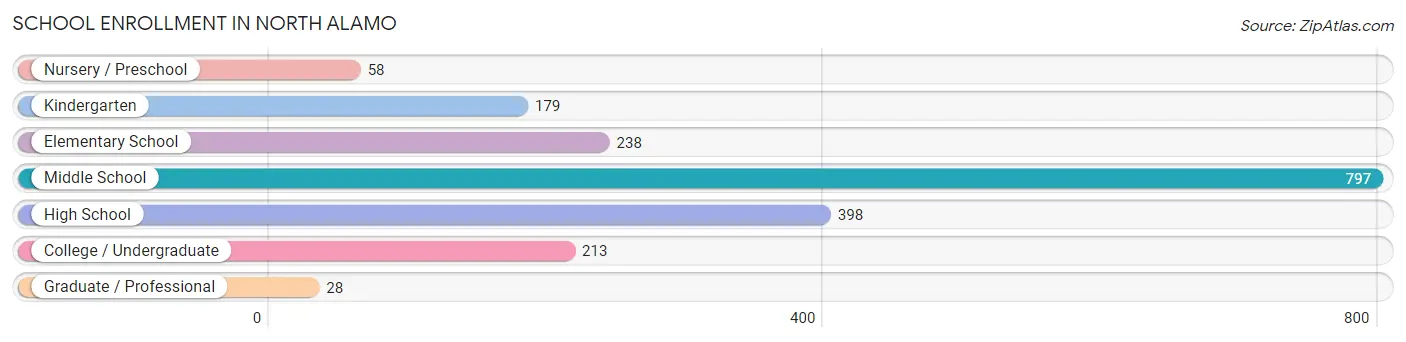
School Enrollment in North Alamo
The most common levels of schooling among the 1,911 students in North Alamo are middle school (797 | 41.7%), high school (398 | 20.8%), and elementary school (238 | 12.4%).
| School Level | # Students | % Students |
| Nursery / Preschool | 58 | 3.0% |
| Kindergarten | 179 | 9.4% |
| Elementary School | 238 | 12.4% |
| Middle School | 797 | 41.7% |
| High School | 398 | 20.8% |
| College / Undergraduate | 213 | 11.2% |
| Graduate / Professional | 28 | 1.5% |
| Total | 1,911 | 100.0% |
School Enrollment by Age by Funding Source in North Alamo
Out of a total of 1,911 students who are enrolled in schools in North Alamo, 82 (4.3%) attend a private institution, while the remaining 1,829 (95.7%) are enrolled in public schools. The age group of 35 years and over has the highest likelihood of being enrolled in private schools, with 83 (74.8% in the age bracket) enrolled. Conversely, the age group of 3 to 4 year olds has the lowest likelihood of being enrolled in a private school, with 20 (100.0% in the age bracket) attending a public institution.
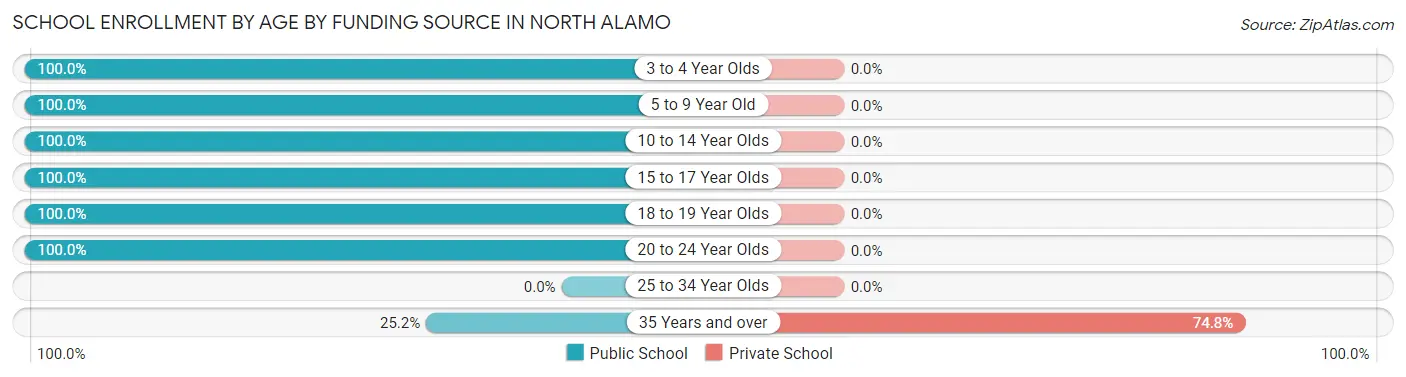
| Age Bracket | Public School | Private School |
| 3 to 4 Year Olds | 20 (100.0%) | 0 (0.0%) |
| 5 to 9 Year Old | 401 (100.0%) | 0 (0.0%) |
| 10 to 14 Year Olds | 1,017 (100.0%) | 0 (0.0%) |
| 15 to 17 Year Olds | 218 (100.0%) | 0 (0.0%) |
| 18 to 19 Year Olds | 79 (100.0%) | 0 (0.0%) |
| 20 to 24 Year Olds | 65 (100.0%) | 0 (0.0%) |
| 25 to 34 Year Olds | 0 (0.0%) | 0 (0.0%) |
| 35 Years and over | 28 (25.2%) | 83 (74.8%) |
| Total | 1,829 (95.7%) | 82 (4.3%) |
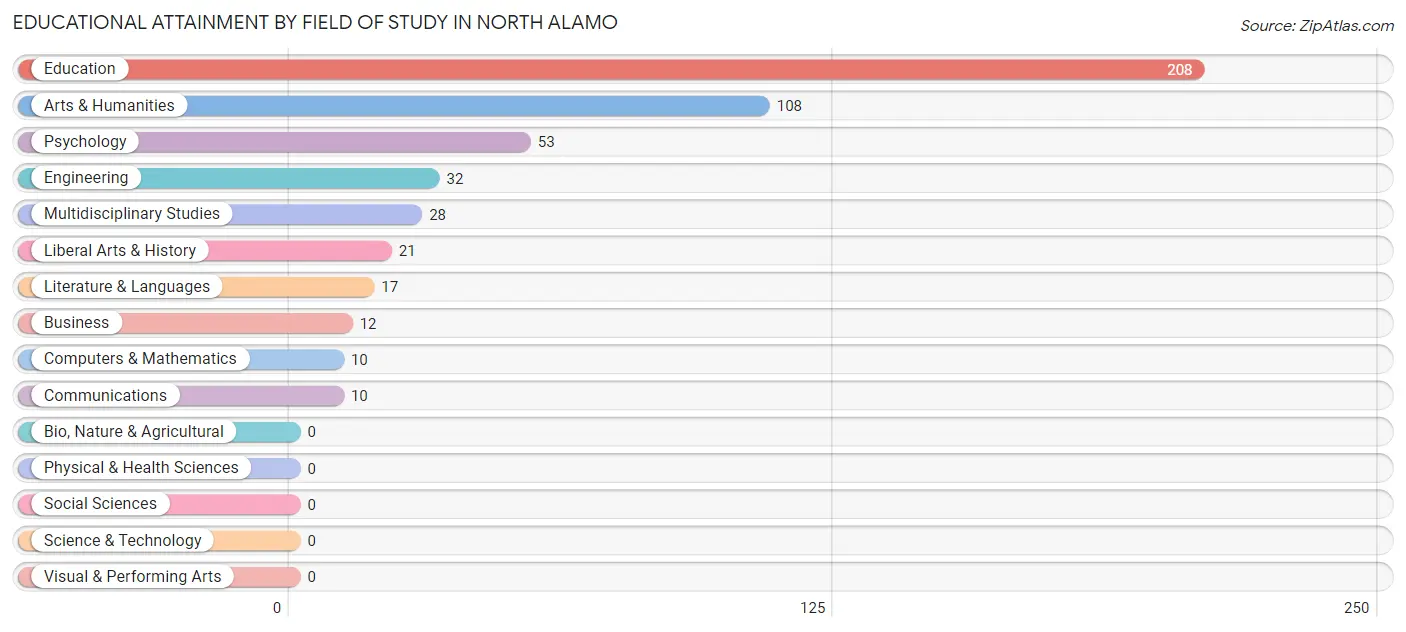
Educational Attainment by Field of Study in North Alamo
Education (208 | 41.7%), arts & humanities (108 | 21.6%), psychology (53 | 10.6%), engineering (32 | 6.4%), and multidisciplinary studies (28 | 5.6%) are the most common fields of study among 499 individuals in North Alamo who have obtained a bachelor's degree or higher.
| Field of Study | # Graduates | % Graduates |
| Computers & Mathematics | 10 | 2.0% |
| Bio, Nature & Agricultural | 0 | 0.0% |
| Physical & Health Sciences | 0 | 0.0% |
| Psychology | 53 | 10.6% |
| Social Sciences | 0 | 0.0% |
| Engineering | 32 | 6.4% |
| Multidisciplinary Studies | 28 | 5.6% |
| Science & Technology | 0 | 0.0% |
| Business | 12 | 2.4% |
| Education | 208 | 41.7% |
| Literature & Languages | 17 | 3.4% |
| Liberal Arts & History | 21 | 4.2% |
| Visual & Performing Arts | 0 | 0.0% |
| Communications | 10 | 2.0% |
| Arts & Humanities | 108 | 21.6% |
| Total | 499 | 100.0% |
Transportation & Commute in North Alamo
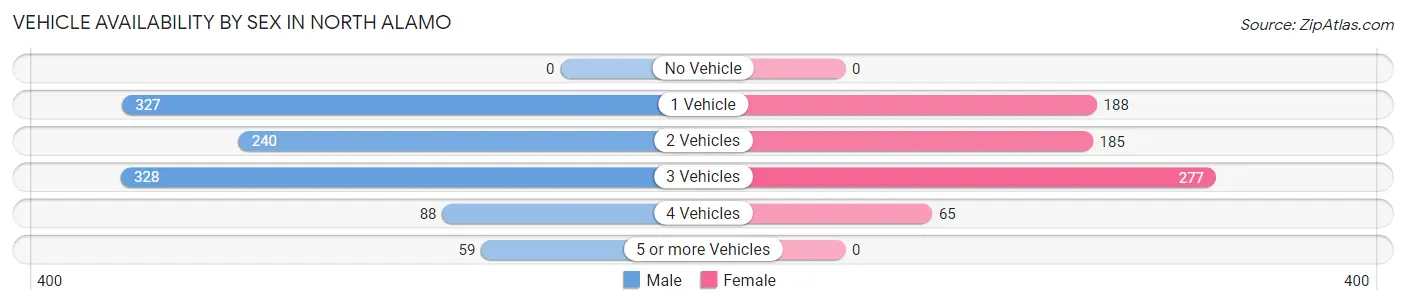
Vehicle Availability by Sex in North Alamo
The most prevalent vehicle ownership categories in North Alamo are males with 3 vehicles (328, accounting for 31.5%) and females with 3 vehicles (277, making up 45.9%).
| Vehicles Available | Male | Female |
| No Vehicle | 0 (0.0%) | 0 (0.0%) |
| 1 Vehicle | 327 (31.4%) | 188 (26.3%) |
| 2 Vehicles | 240 (23.0%) | 185 (25.9%) |
| 3 Vehicles | 328 (31.5%) | 277 (38.7%) |
| 4 Vehicles | 88 (8.5%) | 65 (9.1%) |
| 5 or more Vehicles | 59 (5.7%) | 0 (0.0%) |
| Total | 1,042 (100.0%) | 715 (100.0%) |
Commute Time in North Alamo
The most frequently occuring commute durations in North Alamo are 5 to 9 minutes (454 commuters, 25.8%), 30 to 34 minutes (370 commuters, 21.1%), and 15 to 19 minutes (354 commuters, 20.2%).

| Commute Time | # Commuters | % Commuters |
| Less than 5 Minutes | 66 | 3.8% |
| 5 to 9 Minutes | 454 | 25.8% |
| 10 to 14 Minutes | 156 | 8.9% |
| 15 to 19 Minutes | 354 | 20.2% |
| 20 to 24 Minutes | 175 | 10.0% |
| 25 to 29 Minutes | 0 | 0.0% |
| 30 to 34 Minutes | 370 | 21.1% |
| 35 to 39 Minutes | 3 | 0.2% |
| 40 to 44 Minutes | 0 | 0.0% |
| 45 to 59 Minutes | 30 | 1.7% |
| 60 to 89 Minutes | 149 | 8.5% |
| 90 or more Minutes | 0 | 0.0% |
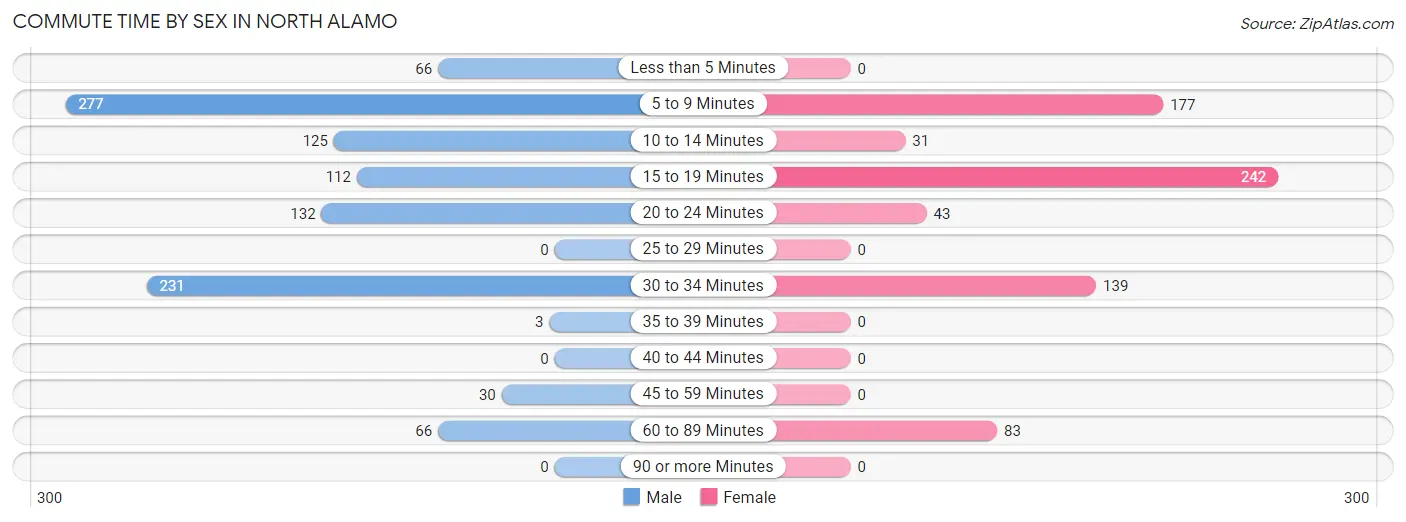
Commute Time by Sex in North Alamo
The most common commute times in North Alamo are 5 to 9 minutes (277 commuters, 26.6%) for males and 15 to 19 minutes (242 commuters, 33.9%) for females.
| Commute Time | Male | Female |
| Less than 5 Minutes | 66 (6.3%) | 0 (0.0%) |
| 5 to 9 Minutes | 277 (26.6%) | 177 (24.8%) |
| 10 to 14 Minutes | 125 (12.0%) | 31 (4.3%) |
| 15 to 19 Minutes | 112 (10.7%) | 242 (33.9%) |
| 20 to 24 Minutes | 132 (12.7%) | 43 (6.0%) |
| 25 to 29 Minutes | 0 (0.0%) | 0 (0.0%) |
| 30 to 34 Minutes | 231 (22.2%) | 139 (19.4%) |
| 35 to 39 Minutes | 3 (0.3%) | 0 (0.0%) |
| 40 to 44 Minutes | 0 (0.0%) | 0 (0.0%) |
| 45 to 59 Minutes | 30 (2.9%) | 0 (0.0%) |
| 60 to 89 Minutes | 66 (6.3%) | 83 (11.6%) |
| 90 or more Minutes | 0 (0.0%) | 0 (0.0%) |
Time of Departure to Work by Sex in North Alamo
The most frequent times of departure to work in North Alamo are 8:00 AM to 8:29 AM (225, 21.6%) for males and 8:00 AM to 8:29 AM (175, 24.5%) for females.
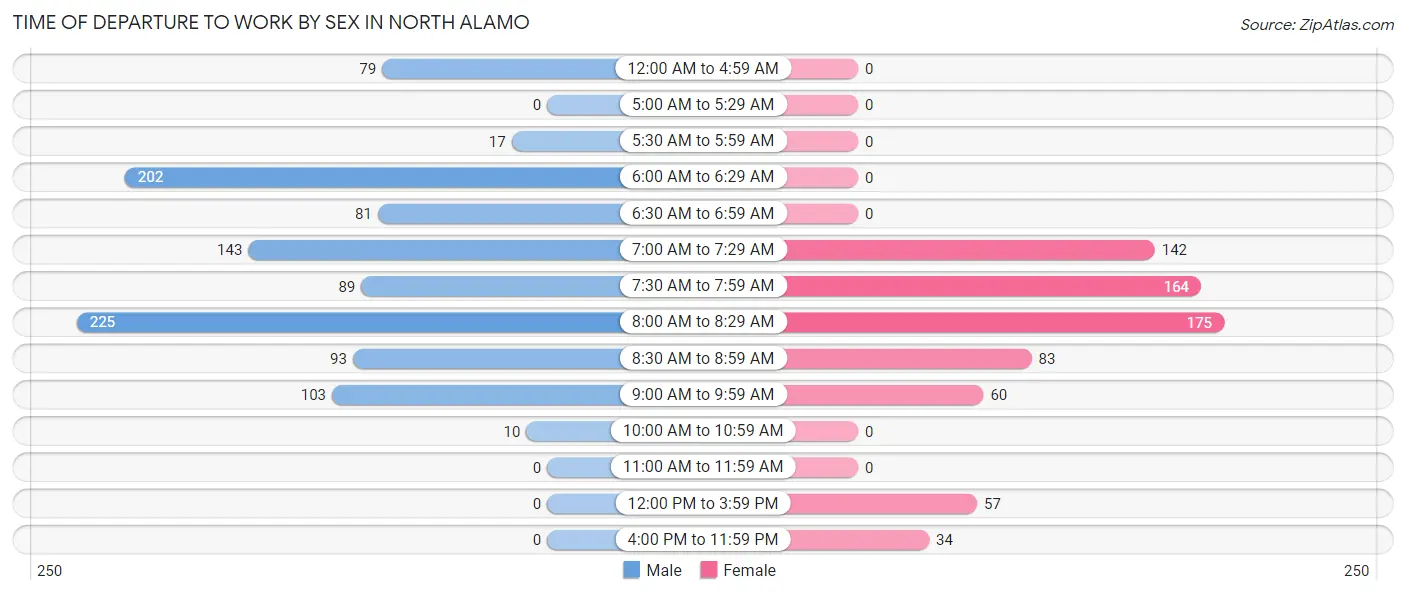
| Time of Departure | Male | Female |
| 12:00 AM to 4:59 AM | 79 (7.6%) | 0 (0.0%) |
| 5:00 AM to 5:29 AM | 0 (0.0%) | 0 (0.0%) |
| 5:30 AM to 5:59 AM | 17 (1.6%) | 0 (0.0%) |
| 6:00 AM to 6:29 AM | 202 (19.4%) | 0 (0.0%) |
| 6:30 AM to 6:59 AM | 81 (7.8%) | 0 (0.0%) |
| 7:00 AM to 7:29 AM | 143 (13.7%) | 142 (19.9%) |
| 7:30 AM to 7:59 AM | 89 (8.5%) | 164 (22.9%) |
| 8:00 AM to 8:29 AM | 225 (21.6%) | 175 (24.5%) |
| 8:30 AM to 8:59 AM | 93 (8.9%) | 83 (11.6%) |
| 9:00 AM to 9:59 AM | 103 (9.9%) | 60 (8.4%) |
| 10:00 AM to 10:59 AM | 10 (1.0%) | 0 (0.0%) |
| 11:00 AM to 11:59 AM | 0 (0.0%) | 0 (0.0%) |
| 12:00 PM to 3:59 PM | 0 (0.0%) | 57 (8.0%) |
| 4:00 PM to 11:59 PM | 0 (0.0%) | 34 (4.8%) |
| Total | 1,042 (100.0%) | 715 (100.0%) |
Housing Occupancy in North Alamo
Occupancy by Ownership in North Alamo
Of the total 1,309 dwellings in North Alamo, owner-occupied units account for 1,014 (77.5%), while renter-occupied units make up 295 (22.5%).
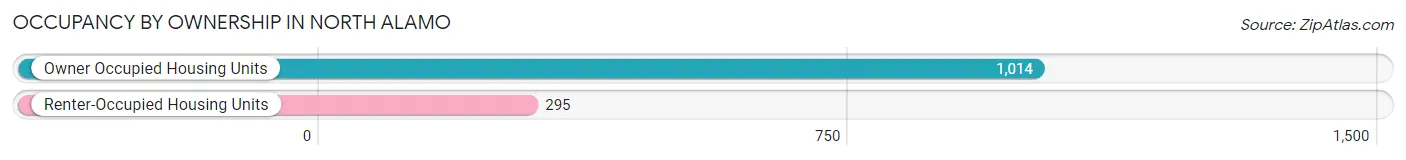
| Occupancy | # Housing Units | % Housing Units |
| Owner Occupied Housing Units | 1,014 | 77.5% |
| Renter-Occupied Housing Units | 295 | 22.5% |
| Total Occupied Housing Units | 1,309 | 100.0% |
Occupancy by Household Size in North Alamo
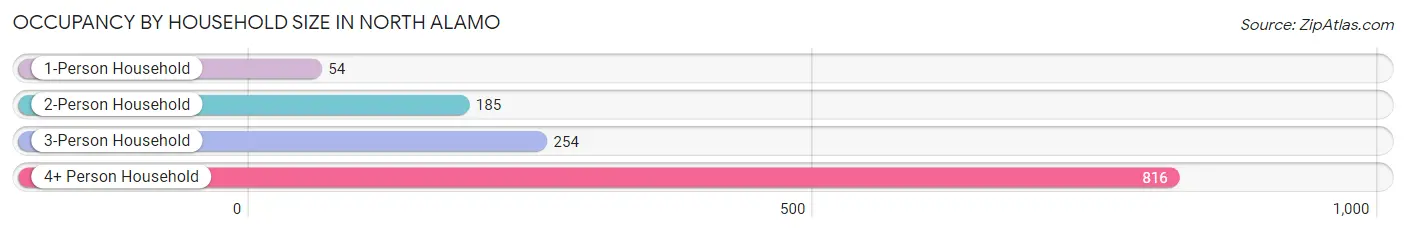
| Household Size | # Housing Units | % Housing Units |
| 1-Person Household | 54 | 4.1% |
| 2-Person Household | 185 | 14.1% |
| 3-Person Household | 254 | 19.4% |
| 4+ Person Household | 816 | 62.3% |
| Total Housing Units | 1,309 | 100.0% |
Occupancy by Ownership by Household Size in North Alamo
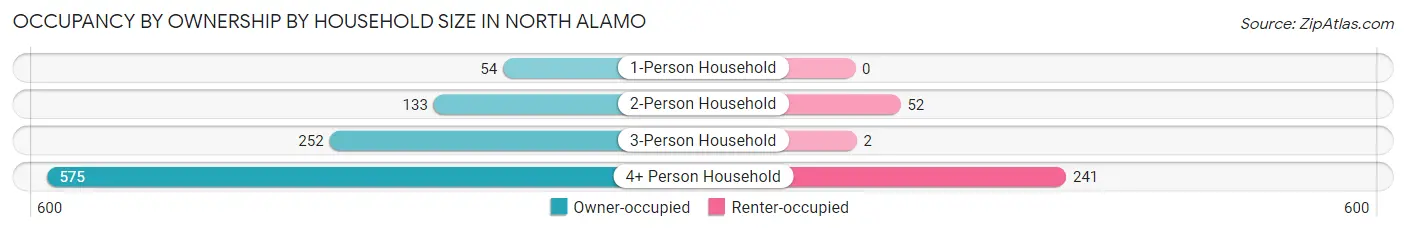
| Household Size | Owner-occupied | Renter-occupied |
| 1-Person Household | 54 (100.0%) | 0 (0.0%) |
| 2-Person Household | 133 (71.9%) | 52 (28.1%) |
| 3-Person Household | 252 (99.2%) | 2 (0.8%) |
| 4+ Person Household | 575 (70.5%) | 241 (29.5%) |
| Total Housing Units | 1,014 (77.5%) | 295 (22.5%) |
Occupancy by Educational Attainment in North Alamo
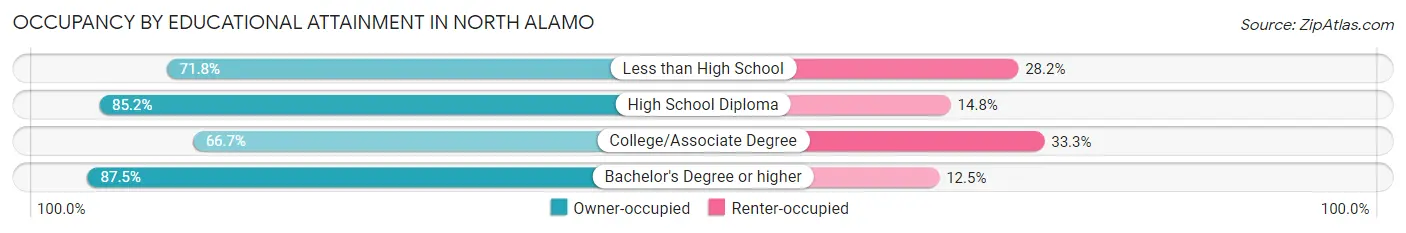
| Household Size | Owner-occupied | Renter-occupied |
| Less than High School | 413 (71.8%) | 162 (28.2%) |
| High School Diploma | 329 (85.2%) | 57 (14.8%) |
| College/Associate Degree | 104 (66.7%) | 52 (33.3%) |
| Bachelor's Degree or higher | 168 (87.5%) | 24 (12.5%) |
Occupancy by Age of Householder in North Alamo
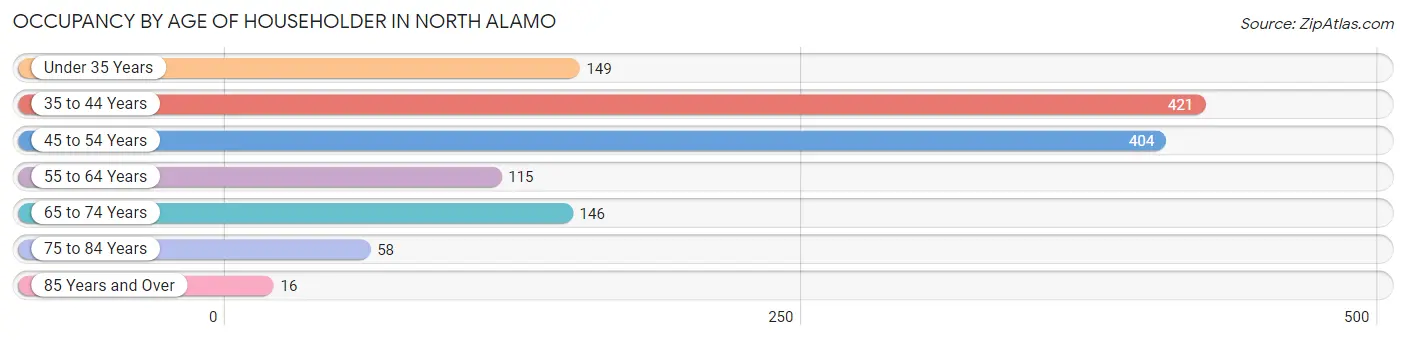
| Age Bracket | # Households | % Households |
| Under 35 Years | 149 | 11.4% |
| 35 to 44 Years | 421 | 32.2% |
| 45 to 54 Years | 404 | 30.9% |
| 55 to 64 Years | 115 | 8.8% |
| 65 to 74 Years | 146 | 11.2% |
| 75 to 84 Years | 58 | 4.4% |
| 85 Years and Over | 16 | 1.2% |
| Total | 1,309 | 100.0% |
Housing Finances in North Alamo
Median Income by Occupancy in North Alamo
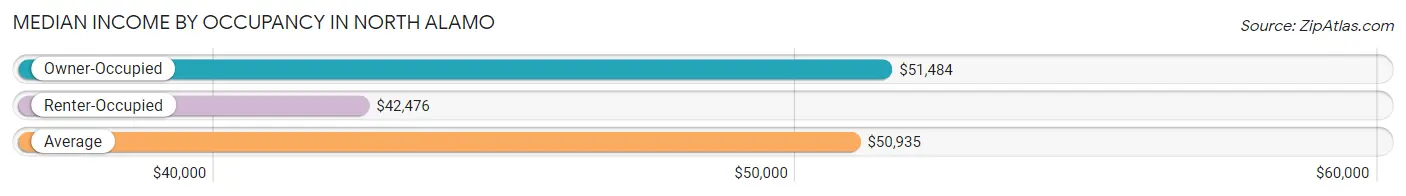
| Occupancy Type | # Households | Median Income |
| Owner-Occupied | 1,014 (77.5%) | $51,484 |
| Renter-Occupied | 295 (22.5%) | $42,476 |
| Average | 1,309 (100.0%) | $50,935 |
Occupancy by Householder Income Bracket in North Alamo
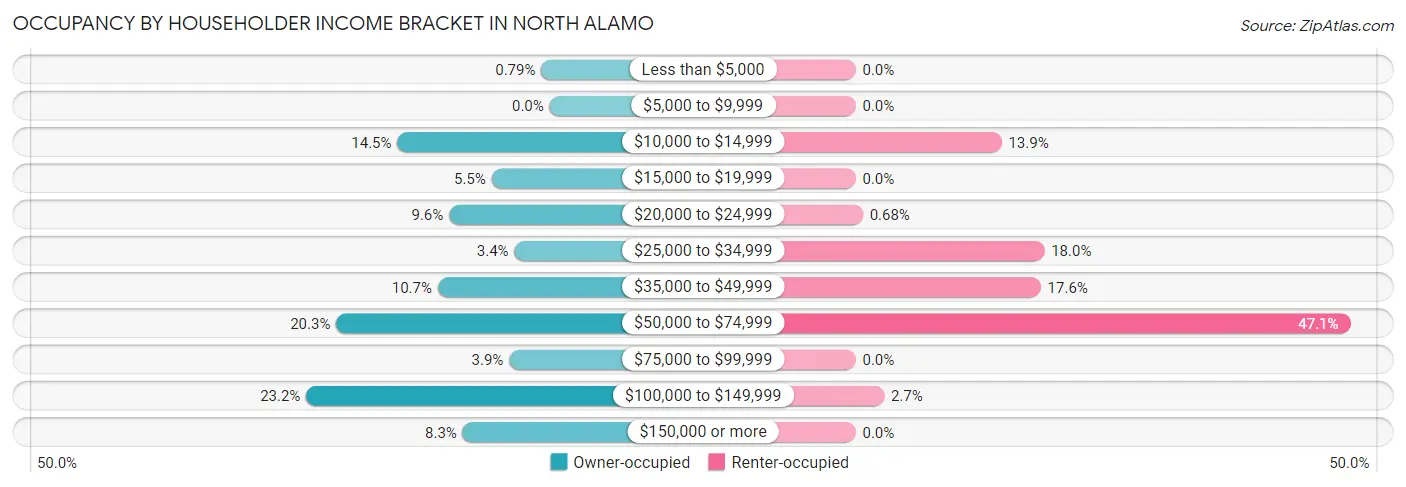
| Income Bracket | Owner-occupied | Renter-occupied |
| Less than $5,000 | 8 (0.8%) | 0 (0.0%) |
| $5,000 to $9,999 | 0 (0.0%) | 0 (0.0%) |
| $10,000 to $14,999 | 147 (14.5%) | 41 (13.9%) |
| $15,000 to $19,999 | 56 (5.5%) | 0 (0.0%) |
| $20,000 to $24,999 | 97 (9.6%) | 2 (0.7%) |
| $25,000 to $34,999 | 34 (3.4%) | 53 (18.0%) |
| $35,000 to $49,999 | 108 (10.6%) | 52 (17.6%) |
| $50,000 to $74,999 | 206 (20.3%) | 139 (47.1%) |
| $75,000 to $99,999 | 39 (3.8%) | 0 (0.0%) |
| $100,000 to $149,999 | 235 (23.2%) | 8 (2.7%) |
| $150,000 or more | 84 (8.3%) | 0 (0.0%) |
| Total | 1,014 (100.0%) | 295 (100.0%) |
Monthly Housing Cost Tiers in North Alamo
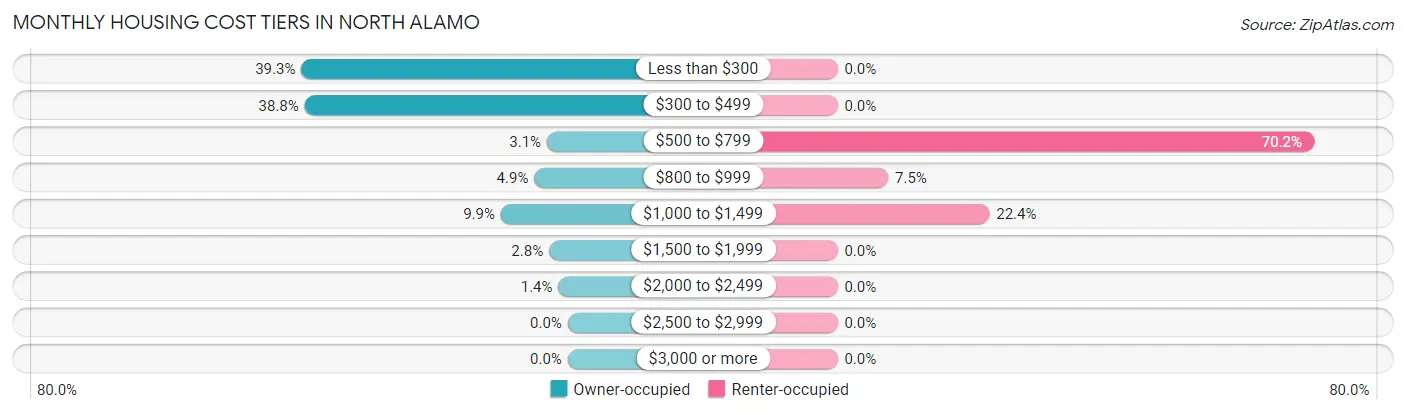
| Monthly Cost | Owner-occupied | Renter-occupied |
| Less than $300 | 398 (39.3%) | 0 (0.0%) |
| $300 to $499 | 393 (38.8%) | 0 (0.0%) |
| $500 to $799 | 31 (3.1%) | 207 (70.2%) |
| $800 to $999 | 50 (4.9%) | 22 (7.5%) |
| $1,000 to $1,499 | 100 (9.9%) | 66 (22.4%) |
| $1,500 to $1,999 | 28 (2.8%) | 0 (0.0%) |
| $2,000 to $2,499 | 14 (1.4%) | 0 (0.0%) |
| $2,500 to $2,999 | 0 (0.0%) | 0 (0.0%) |
| $3,000 or more | 0 (0.0%) | 0 (0.0%) |
| Total | 1,014 (100.0%) | 295 (100.0%) |
Physical Housing Characteristics in North Alamo
Housing Structures in North Alamo
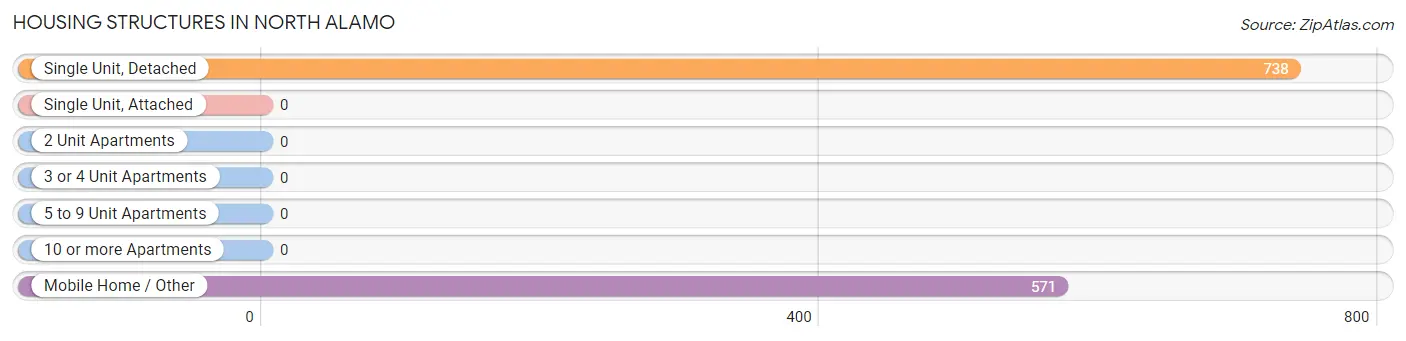
| Structure Type | # Housing Units | % Housing Units |
| Single Unit, Detached | 738 | 56.4% |
| Single Unit, Attached | 0 | 0.0% |
| 2 Unit Apartments | 0 | 0.0% |
| 3 or 4 Unit Apartments | 0 | 0.0% |
| 5 to 9 Unit Apartments | 0 | 0.0% |
| 10 or more Apartments | 0 | 0.0% |
| Mobile Home / Other | 571 | 43.6% |
| Total | 1,309 | 100.0% |
Housing Structures by Occupancy in North Alamo
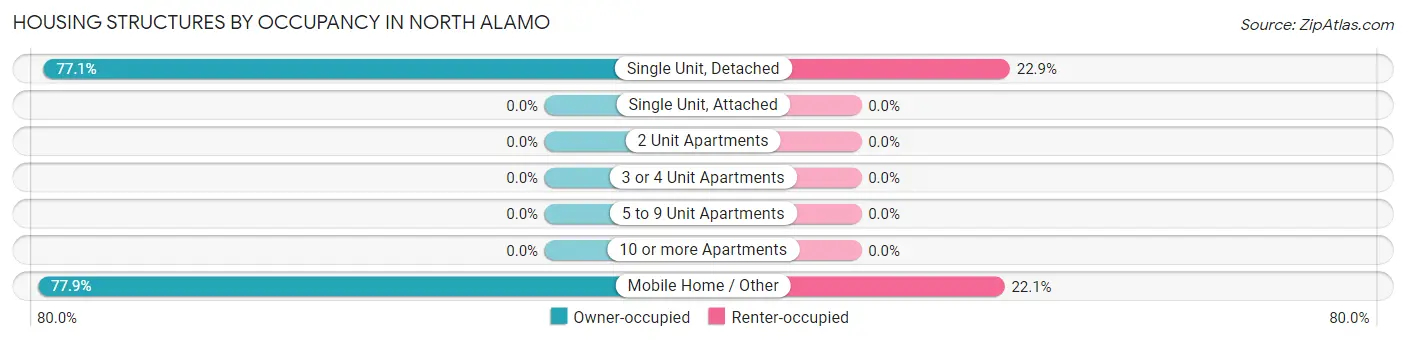
| Structure Type | Owner-occupied | Renter-occupied |
| Single Unit, Detached | 569 (77.1%) | 169 (22.9%) |
| Single Unit, Attached | 0 (0.0%) | 0 (0.0%) |
| 2 Unit Apartments | 0 (0.0%) | 0 (0.0%) |
| 3 or 4 Unit Apartments | 0 (0.0%) | 0 (0.0%) |
| 5 to 9 Unit Apartments | 0 (0.0%) | 0 (0.0%) |
| 10 or more Apartments | 0 (0.0%) | 0 (0.0%) |
| Mobile Home / Other | 445 (77.9%) | 126 (22.1%) |
| Total | 1,014 (77.5%) | 295 (22.5%) |
Housing Structures by Number of Rooms in North Alamo
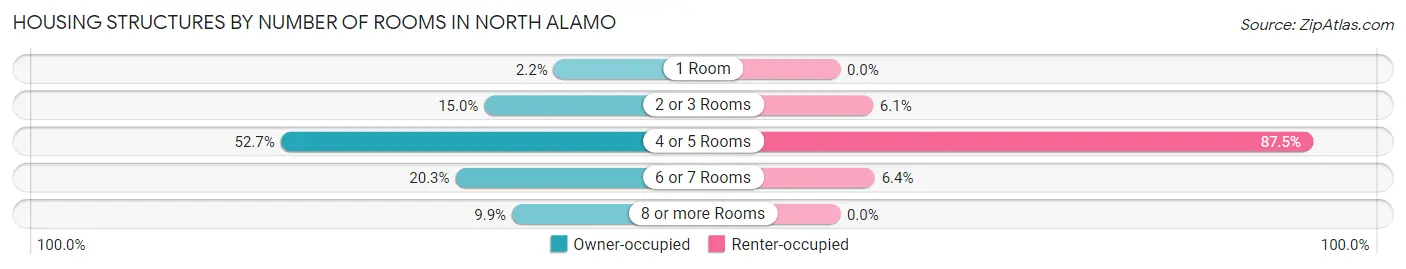
| Number of Rooms | Owner-occupied | Renter-occupied |
| 1 Room | 22 (2.2%) | 0 (0.0%) |
| 2 or 3 Rooms | 152 (15.0%) | 18 (6.1%) |
| 4 or 5 Rooms | 534 (52.7%) | 258 (87.5%) |
| 6 or 7 Rooms | 206 (20.3%) | 19 (6.4%) |
| 8 or more Rooms | 100 (9.9%) | 0 (0.0%) |
| Total | 1,014 (100.0%) | 295 (100.0%) |
Housing Structure by Heating Type in North Alamo
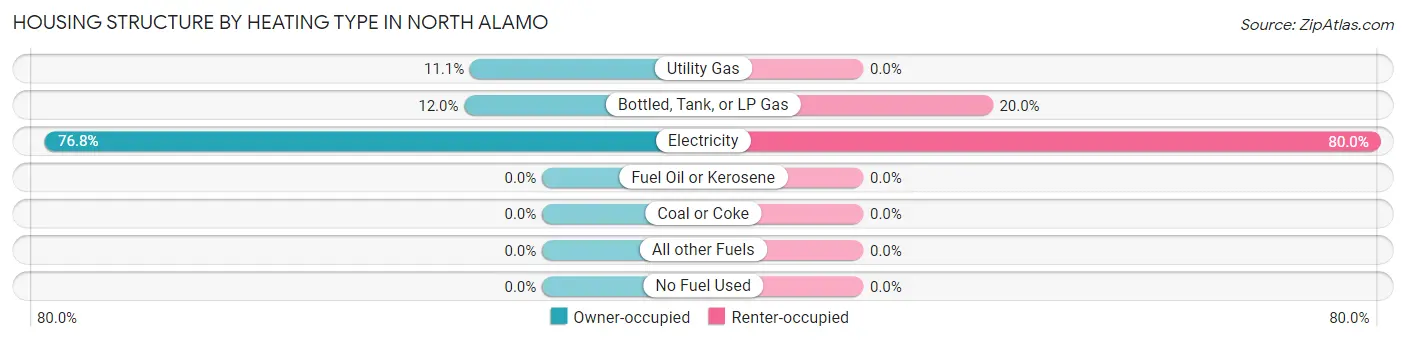
| Heating Type | Owner-occupied | Renter-occupied |
| Utility Gas | 113 (11.1%) | 0 (0.0%) |
| Bottled, Tank, or LP Gas | 122 (12.0%) | 59 (20.0%) |
| Electricity | 779 (76.8%) | 236 (80.0%) |
| Fuel Oil or Kerosene | 0 (0.0%) | 0 (0.0%) |
| Coal or Coke | 0 (0.0%) | 0 (0.0%) |
| All other Fuels | 0 (0.0%) | 0 (0.0%) |
| No Fuel Used | 0 (0.0%) | 0 (0.0%) |
| Total | 1,014 (100.0%) | 295 (100.0%) |
Household Vehicle Usage in North Alamo
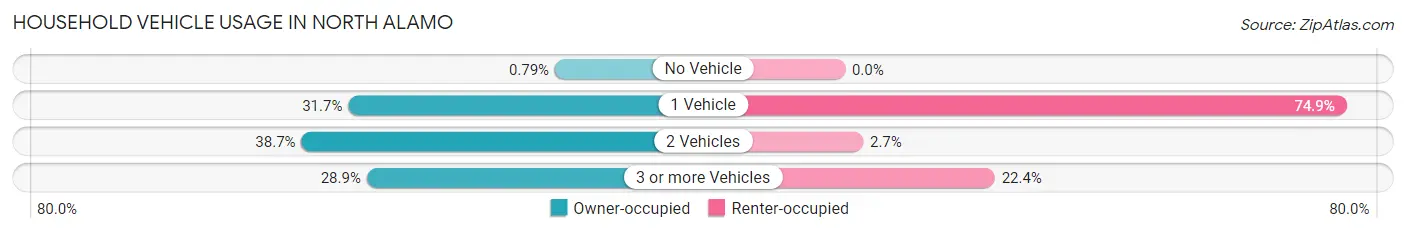
| Vehicles per Household | Owner-occupied | Renter-occupied |
| No Vehicle | 8 (0.8%) | 0 (0.0%) |
| 1 Vehicle | 321 (31.7%) | 221 (74.9%) |
| 2 Vehicles | 392 (38.7%) | 8 (2.7%) |
| 3 or more Vehicles | 293 (28.9%) | 66 (22.4%) |
| Total | 1,014 (100.0%) | 295 (100.0%) |
Real Estate & Mortgages in North Alamo
Real Estate and Mortgage Overview in North Alamo
| Characteristic | Without Mortgage | With Mortgage |
| Housing Units | 934 | 80 |
| Median Property Value | $64,300 | $242,900 |
| Median Household Income | $50,859 | $0 |
| Monthly Housing Costs | $310 | $0 |
| Real Estate Taxes | $1,076 | $0 |
Property Value by Mortgage Status in North Alamo
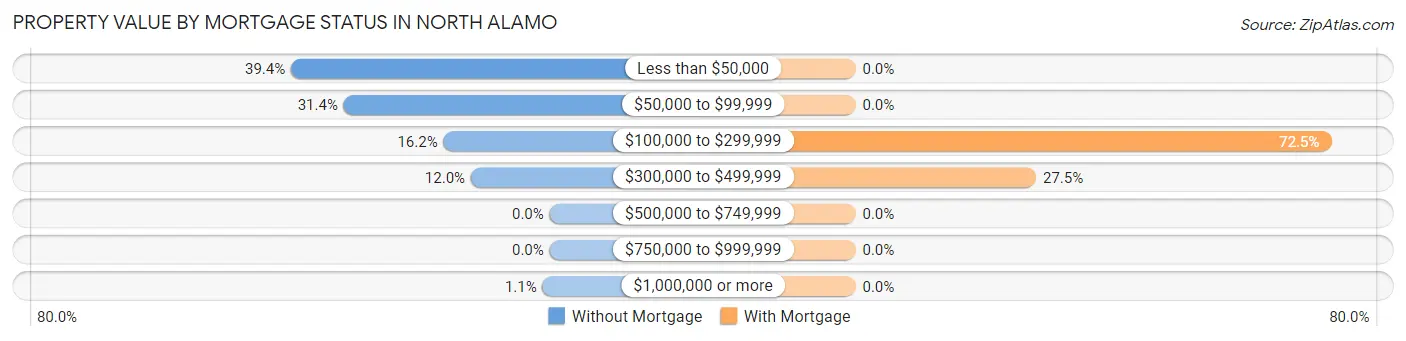
| Property Value | Without Mortgage | With Mortgage |
| Less than $50,000 | 368 (39.4%) | 0 (0.0%) |
| $50,000 to $99,999 | 293 (31.4%) | 0 (0.0%) |
| $100,000 to $299,999 | 151 (16.2%) | 58 (72.5%) |
| $300,000 to $499,999 | 112 (12.0%) | 22 (27.5%) |
| $500,000 to $749,999 | 0 (0.0%) | 0 (0.0%) |
| $750,000 to $999,999 | 0 (0.0%) | 0 (0.0%) |
| $1,000,000 or more | 10 (1.1%) | 0 (0.0%) |
| Total | 934 (100.0%) | 80 (100.0%) |
Household Income by Mortgage Status in North Alamo
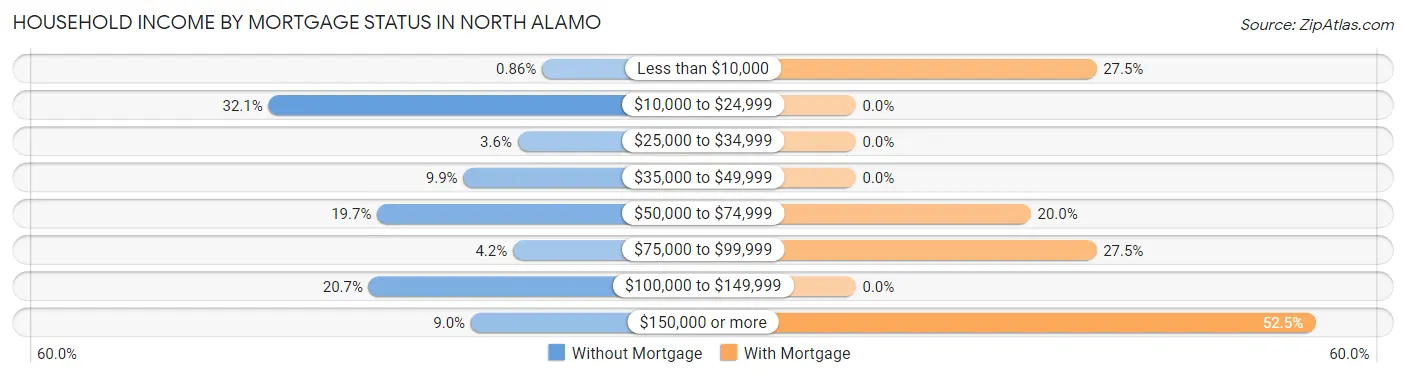
| Household Income | Without Mortgage | With Mortgage |
| Less than $10,000 | 8 (0.9%) | 22 (27.5%) |
| $10,000 to $24,999 | 300 (32.1%) | 0 (0.0%) |
| $25,000 to $34,999 | 34 (3.6%) | 0 (0.0%) |
| $35,000 to $49,999 | 92 (9.9%) | 0 (0.0%) |
| $50,000 to $74,999 | 184 (19.7%) | 16 (20.0%) |
| $75,000 to $99,999 | 39 (4.2%) | 22 (27.5%) |
| $100,000 to $149,999 | 193 (20.7%) | 0 (0.0%) |
| $150,000 or more | 84 (9.0%) | 42 (52.5%) |
| Total | 934 (100.0%) | 80 (100.0%) |
Property Value to Household Income Ratio in North Alamo
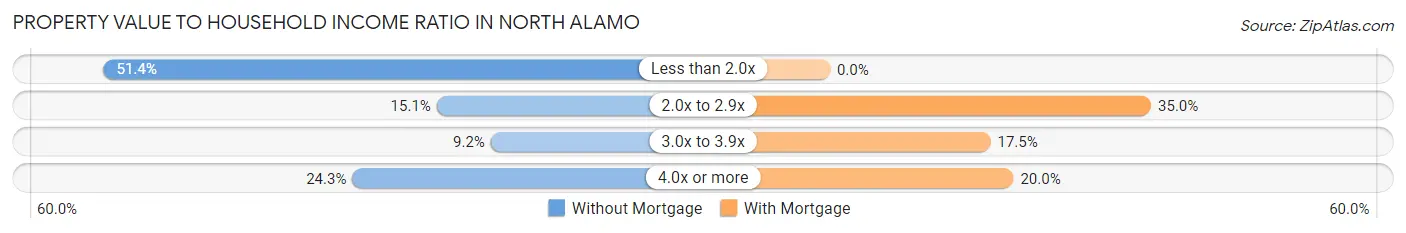
| Value-to-Income Ratio | Without Mortgage | With Mortgage |
| Less than 2.0x | 480 (51.4%) | 0 (0.0%) |
| 2.0x to 2.9x | 141 (15.1%) | 28 (35.0%) |
| 3.0x to 3.9x | 86 (9.2%) | 14 (17.5%) |
| 4.0x or more | 227 (24.3%) | 16 (20.0%) |
| Total | 934 (100.0%) | 80 (100.0%) |
Real Estate Taxes by Mortgage Status in North Alamo
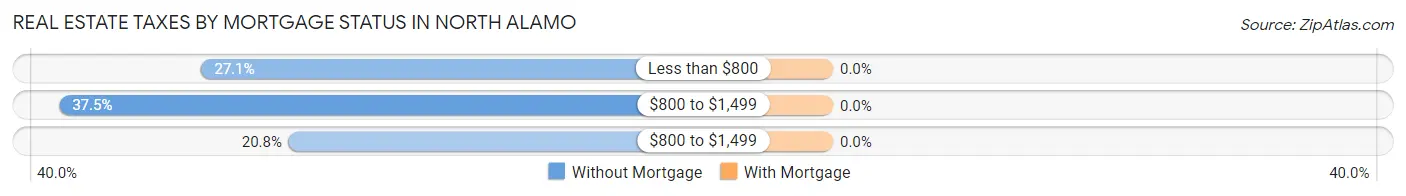
| Property Taxes | Without Mortgage | With Mortgage |
| Less than $800 | 253 (27.1%) | 0 (0.0%) |
| $800 to $1,499 | 350 (37.5%) | 0 (0.0%) |
| $800 to $1,499 | 194 (20.8%) | 0 (0.0%) |
| Total | 934 (100.0%) | 80 (100.0%) |
Health & Disability in North Alamo
Health Insurance Coverage by Age in North Alamo
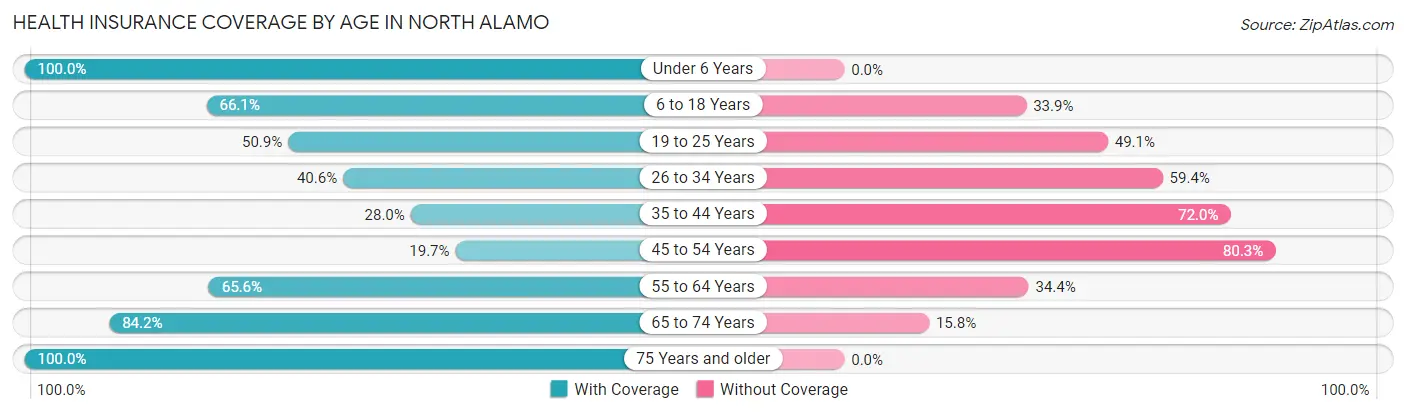
| Age Bracket | With Coverage | Without Coverage |
| Under 6 Years | 409 (100.0%) | 0 (0.0%) |
| 6 to 18 Years | 1,063 (66.1%) | 546 (33.9%) |
| 19 to 25 Years | 263 (50.9%) | 254 (49.1%) |
| 26 to 34 Years | 180 (40.6%) | 263 (59.4%) |
| 35 to 44 Years | 216 (28.0%) | 555 (72.0%) |
| 45 to 54 Years | 130 (19.7%) | 531 (80.3%) |
| 55 to 64 Years | 149 (65.6%) | 78 (34.4%) |
| 65 to 74 Years | 304 (84.2%) | 57 (15.8%) |
| 75 Years and older | 132 (100.0%) | 0 (0.0%) |
| Total | 2,846 (55.5%) | 2,284 (44.5%) |
Health Insurance Coverage by Citizenship Status in North Alamo
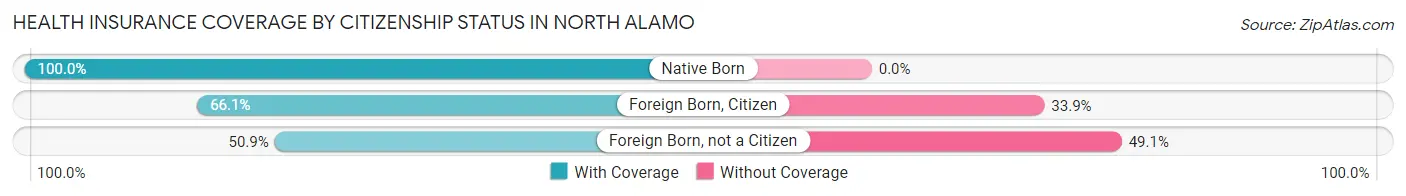
| Citizenship Status | With Coverage | Without Coverage |
| Native Born | 409 (100.0%) | 0 (0.0%) |
| Foreign Born, Citizen | 1,063 (66.1%) | 546 (33.9%) |
| Foreign Born, not a Citizen | 263 (50.9%) | 254 (49.1%) |
Health Insurance Coverage by Household Income in North Alamo
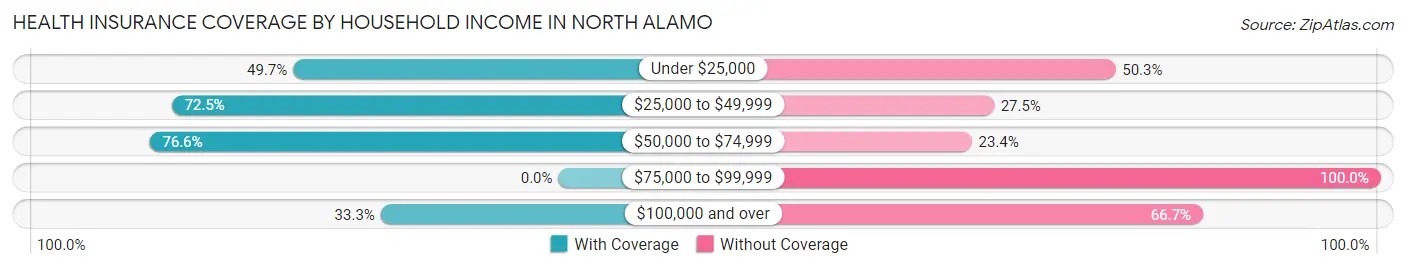
| Household Income | With Coverage | Without Coverage |
| Under $25,000 | 642 (49.7%) | 650 (50.3%) |
| $25,000 to $49,999 | 582 (72.5%) | 221 (27.5%) |
| $50,000 to $74,999 | 1,160 (76.6%) | 354 (23.4%) |
| $75,000 to $99,999 | 0 (0.0%) | 133 (100.0%) |
| $100,000 and over | 462 (33.3%) | 926 (66.7%) |
Public vs Private Health Insurance Coverage by Age in North Alamo
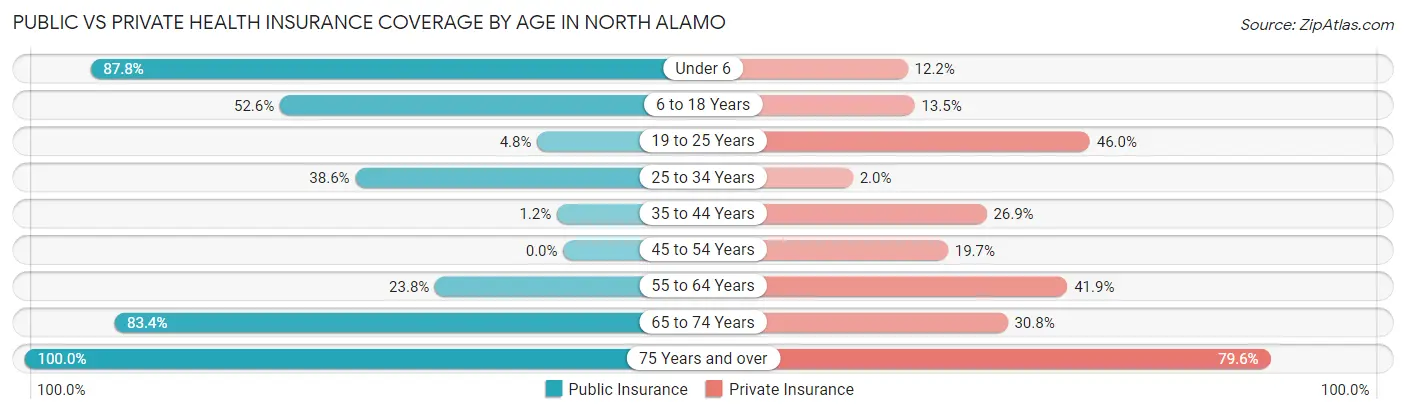
| Age Bracket | Public Insurance | Private Insurance |
| Under 6 | 359 (87.8%) | 50 (12.2%) |
| 6 to 18 Years | 846 (52.6%) | 217 (13.5%) |
| 19 to 25 Years | 25 (4.8%) | 238 (46.0%) |
| 25 to 34 Years | 171 (38.6%) | 9 (2.0%) |
| 35 to 44 Years | 9 (1.2%) | 207 (26.9%) |
| 45 to 54 Years | 0 (0.0%) | 130 (19.7%) |
| 55 to 64 Years | 54 (23.8%) | 95 (41.8%) |
| 65 to 74 Years | 301 (83.4%) | 111 (30.7%) |
| 75 Years and over | 132 (100.0%) | 105 (79.5%) |
| Total | 1,897 (37.0%) | 1,162 (22.7%) |
Disability Status by Sex by Age in North Alamo
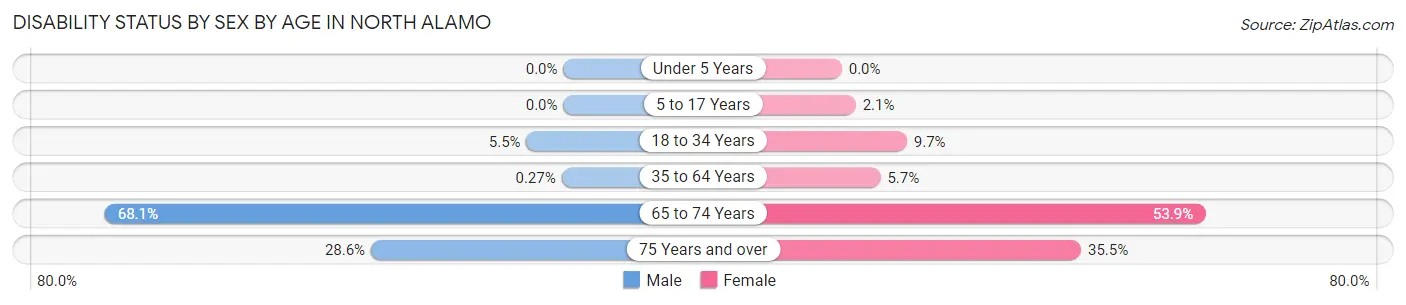
| Age Bracket | Male | Female |
| Under 5 Years | 0 (0.0%) | 0 (0.0%) |
| 5 to 17 Years | 0 (0.0%) | 20 (2.1%) |
| 18 to 34 Years | 25 (5.5%) | 56 (9.7%) |
| 35 to 64 Years | 2 (0.3%) | 52 (5.7%) |
| 65 to 74 Years | 64 (68.1%) | 144 (53.9%) |
| 75 Years and over | 16 (28.6%) | 27 (35.5%) |
Disability Class by Sex by Age in North Alamo
Disability Class: Hearing Difficulty
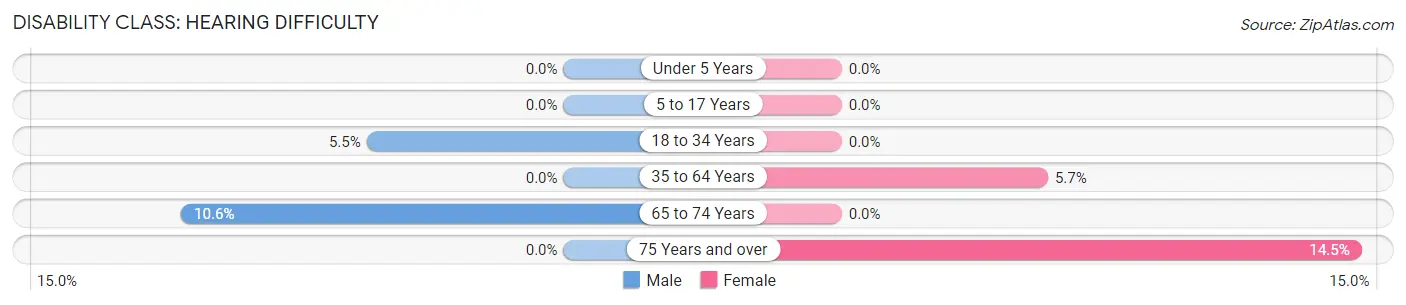
| Age Bracket | Male | Female |
| Under 5 Years | 0 (0.0%) | 0 (0.0%) |
| 5 to 17 Years | 0 (0.0%) | 0 (0.0%) |
| 18 to 34 Years | 25 (5.5%) | 0 (0.0%) |
| 35 to 64 Years | 0 (0.0%) | 52 (5.7%) |
| 65 to 74 Years | 10 (10.6%) | 0 (0.0%) |
| 75 Years and over | 0 (0.0%) | 11 (14.5%) |
Disability Class: Vision Difficulty
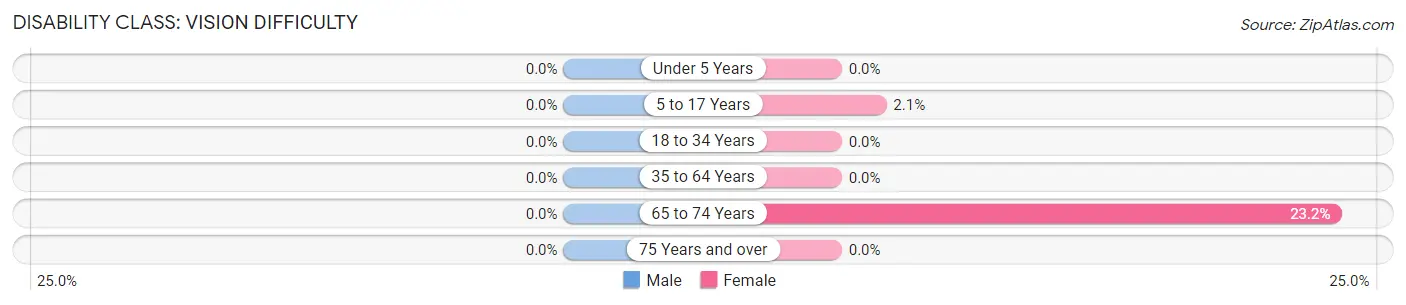
| Age Bracket | Male | Female |
| Under 5 Years | 0 (0.0%) | 0 (0.0%) |
| 5 to 17 Years | 0 (0.0%) | 20 (2.1%) |
| 18 to 34 Years | 0 (0.0%) | 0 (0.0%) |
| 35 to 64 Years | 0 (0.0%) | 0 (0.0%) |
| 65 to 74 Years | 0 (0.0%) | 62 (23.2%) |
| 75 Years and over | 0 (0.0%) | 0 (0.0%) |
Disability Class: Cognitive Difficulty
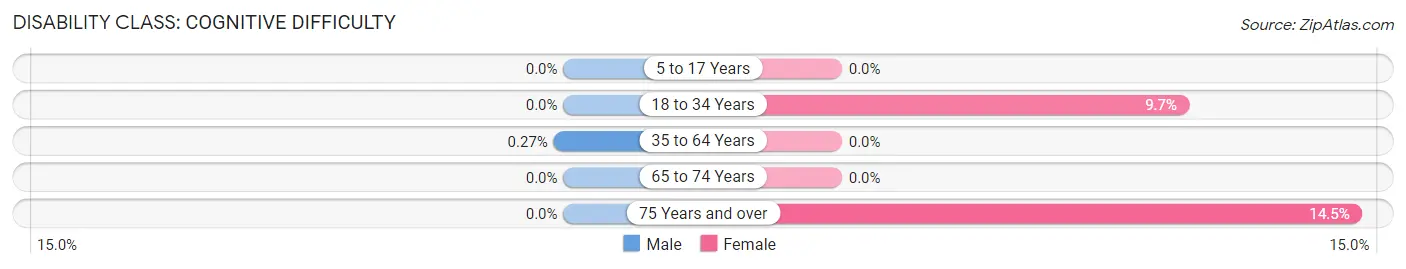
| Age Bracket | Male | Female |
| 5 to 17 Years | 0 (0.0%) | 0 (0.0%) |
| 18 to 34 Years | 0 (0.0%) | 56 (9.7%) |
| 35 to 64 Years | 2 (0.3%) | 0 (0.0%) |
| 65 to 74 Years | 0 (0.0%) | 0 (0.0%) |
| 75 Years and over | 0 (0.0%) | 11 (14.5%) |
Disability Class: Ambulatory Difficulty
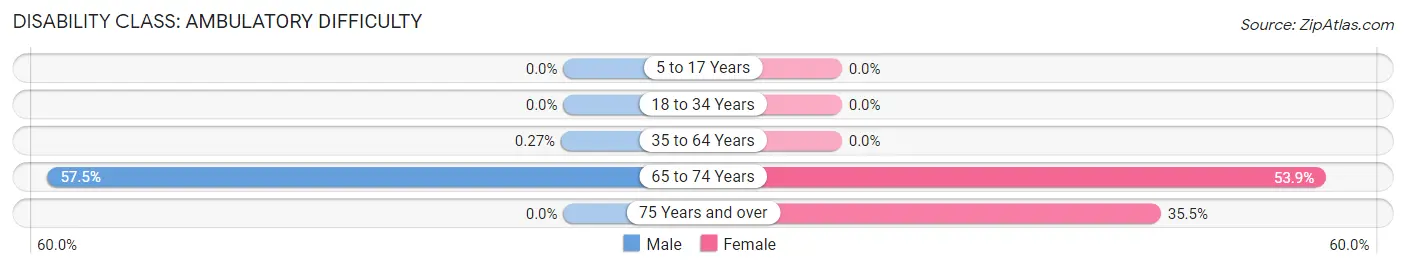
| Age Bracket | Male | Female |
| 5 to 17 Years | 0 (0.0%) | 0 (0.0%) |
| 18 to 34 Years | 0 (0.0%) | 0 (0.0%) |
| 35 to 64 Years | 2 (0.3%) | 0 (0.0%) |
| 65 to 74 Years | 54 (57.5%) | 144 (53.9%) |
| 75 Years and over | 0 (0.0%) | 27 (35.5%) |
Disability Class: Self-Care Difficulty
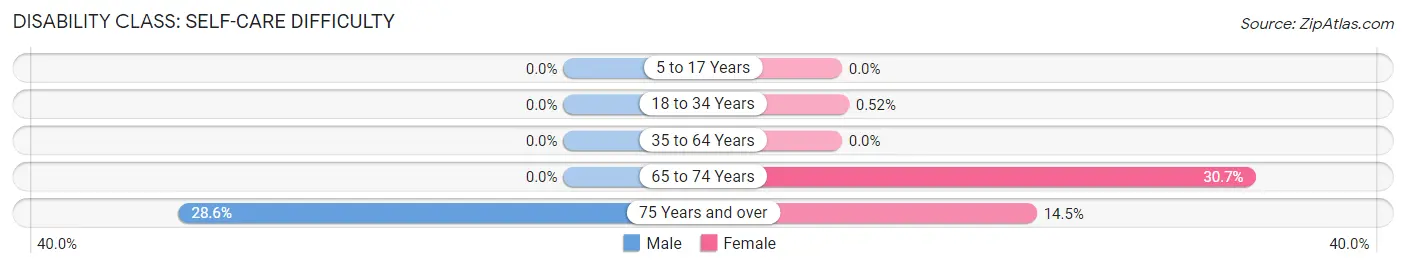
| Age Bracket | Male | Female |
| 5 to 17 Years | 0 (0.0%) | 0 (0.0%) |
| 18 to 34 Years | 0 (0.0%) | 3 (0.5%) |
| 35 to 64 Years | 0 (0.0%) | 0 (0.0%) |
| 65 to 74 Years | 0 (0.0%) | 82 (30.7%) |
| 75 Years and over | 16 (28.6%) | 11 (14.5%) |
Technology Access in North Alamo
Computing Device Access in North Alamo
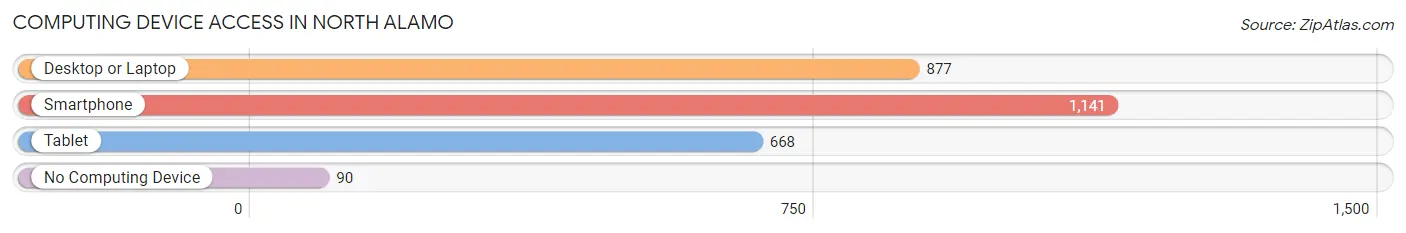
| Device Type | # Households | % Households |
| Desktop or Laptop | 877 | 67.0% |
| Smartphone | 1,141 | 87.2% |
| Tablet | 668 | 51.0% |
| No Computing Device | 90 | 6.9% |
| Total | 1,309 | 100.0% |
Internet Access in North Alamo
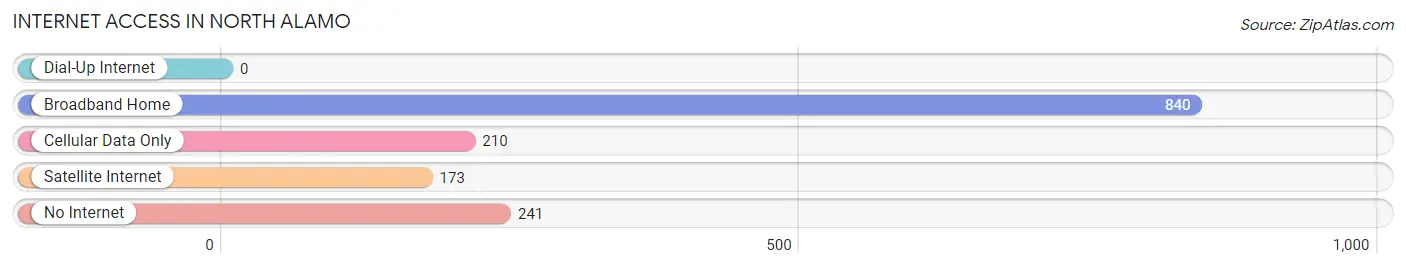
| Internet Type | # Households | % Households |
| Dial-Up Internet | 0 | 0.0% |
| Broadband Home | 840 | 64.2% |
| Cellular Data Only | 210 | 16.0% |
| Satellite Internet | 173 | 13.2% |
| No Internet | 241 | 18.4% |
| Total | 1,309 | 100.0% |
North Alamo Summary
North Alamo is a census-designated place (CDP) located in Hidalgo County, Texas, United States. The population was 2,845 at the 2010 census. It is part of the McAllen–Edinburg–Mission Metropolitan Statistical Area.
Geography
North Alamo is located at 26 17 17 North 98 14 17 West 26 288 98 238
According to the United States Census Bureau, the CDP has a total area of 1.2 square miles (3.1 km2), all of it land.
History
North Alamo was founded in the early 1900s by a group of Mexican-American farmers. The area was originally known as "La Lomita," which means "little hill" in Spanish. The name was changed to North Alamo in the 1950s when the area was annexed by the city of Alamo.
The area was primarily agricultural until the late 1970s, when the population began to grow rapidly due to an influx of Mexican immigrants. The population of North Alamo has continued to grow since then, and the area is now home to a diverse population of Mexican-Americans, Anglos, and other ethnic groups.
Economy
North Alamo is primarily a residential community, but it does have some commercial businesses. The area is home to several small businesses, including restaurants, grocery stores, and auto repair shops.
The economy of North Alamo is largely dependent on the local agricultural industry. The area is home to several large farms, which produce a variety of crops, including cotton, corn, and sorghum.
Demographics
As of the 2010 census, there were 2,845 people, 890 households, and 717 families residing in the CDP. The population density was 2,364.2 people per square mile (912.2/km2). There were 990 housing units at an average density of 825.0 per square mile (318.7/km2). The racial makeup of the CDP was 79.2% White, 0.7% African American, 0.2% Native American, 0.2% Asian, 16.7% from other races, and 3.0% from two or more races. Hispanic or Latino of any race were 97.2% of the population.
There were 890 households, out of which 44.2% had children under the age of 18 living with them, 57.3% were married couples living together, 17.3% had a female householder with no husband present, and 19.3% were non-families. 16.2% of all households were made up of individuals, and 6.7% had someone living alone who was 65 years of age or older. The average household size was 3.19 and the average family size was 3.56.
In the CDP, the population was spread out, with 32.2% under the age of 18, 10.2% from 18 to 24, 28.2% from 25 to 44, 19.7% from 45 to 64, and 9.7% who were 65 years of age or older. The median age was 30 years. For every 100 females, there were 95.2 males. For every 100 females age 18 and over, there were 91.2 males.
The median income for a household in the CDP was $20,938, and the median income for a family was $22,813. Males had a median income of $17,917 versus $14,375 for females. The per capita income for the CDP was $8,845. About 33.2% of families and 37.2% of the population were below the poverty line, including 45.2% of those under age 18 and 33.3% of those age 65 or over.
Common Questions
What is Per Capita Income in North Alamo?
Per Capita income in North Alamo is $18,581.
What is the Median Family Income in North Alamo?
Median Family Income in North Alamo is $51,382.
What is the Median Household income in North Alamo?
Median Household Income in North Alamo is $50,935.
What is Income or Wage Gap in North Alamo?
Income or Wage Gap in North Alamo is 49.9%.
Women in North Alamo earn 50.1 cents for every dollar earned by a man.
What is Inequality or Gini Index in North Alamo?
Inequality or Gini Index in North Alamo is 0.46.
What is the Total Population of North Alamo?
Total Population of North Alamo is 5,130.
What is the Total Male Population of North Alamo?
Total Male Population of North Alamo is 2,204.
What is the Total Female Population of North Alamo?
Total Female Population of North Alamo is 2,926.
What is the Ratio of Males per 100 Females in North Alamo?
There are 75.32 Males per 100 Females in North Alamo.
What is the Ratio of Females per 100 Males in North Alamo?
There are 132.76 Females per 100 Males in North Alamo.
What is the Median Population Age in North Alamo?
Median Population Age in North Alamo is 26.5 Years.
What is the Average Family Size in North Alamo
Average Family Size in North Alamo is 3.9 People.
What is the Average Household Size in North Alamo
Average Household Size in North Alamo is 3.9 People.
How Large is the Labor Force in North Alamo?
There are 1,869 People in the Labor Forcein in North Alamo.
What is the Percentage of People in the Labor Force in North Alamo?
54.5% of People are in the Labor Force in North Alamo.
What is the Unemployment Rate in North Alamo?
Unemployment Rate in North Alamo is 4.9%.