Zapata Ranch, TX Map & Demographics
Zapata Ranch Map
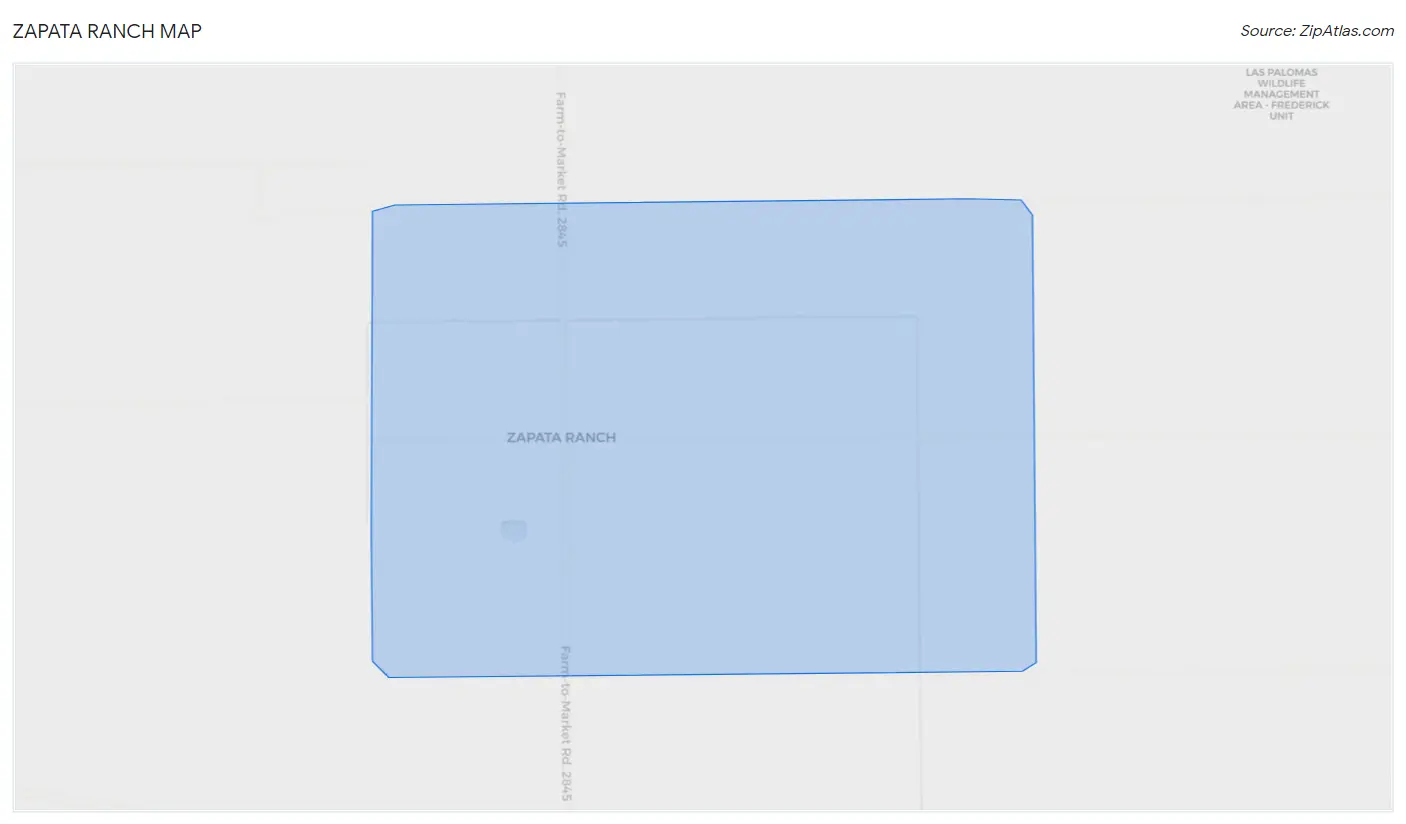
Zapata Ranch Overview
$40,941
PER CAPITA INCOME
$103,776
AVG HOUSEHOLD INCOME
0.15
INEQUALITY / GINI INDEX
246
TOTAL POPULATION
181
MALE POPULATION
65
FEMALE POPULATION
278.46
MALES / 100 FEMALES
35.91
FEMALES / 100 MALES
39.9
MEDIAN AGE
7.7
AVG FAMILY SIZE
3.1
AVG HOUSEHOLD SIZE
189
LABOR FORCE [ PEOPLE ]
76.8%
PERCENT IN LABOR FORCE
Income in Zapata Ranch
Income Overview in Zapata Ranch
| Characteristic | Number | Measure |
| Per Capita Income | 246 | $40,941 |
| Median Family Income | 25 | $0 |
| Mean Family Income | 25 | $93,456 |
| Median Household Income | 78 | $103,776 |
| Mean Household Income | 78 | $95,279 |
| Income Deficit | 25 | $0 |
| Wage / Income Gap (%) | 246 | 0.00% |
| Wage / Income Gap ($) | 246 | 100.00¢ per $1 |
| Gini / Inequality Index | 246 | 0.15 |
Earnings by Sex in Zapata Ranch
| Sex | Number | Average Earnings |
| Male | 165 (87.3%) | $0 |
| Female | 24 (12.7%) | $0 |
| Total | 189 (100.0%) | $0 |
Earnings by Sex by Income Bracket in Zapata Ranch
The most common earnings brackets in Zapata Ranch are $25,000 to $29,999 for men (99 | 60.0%) and $55,000 to $64,999 for women (15 | 62.5%).
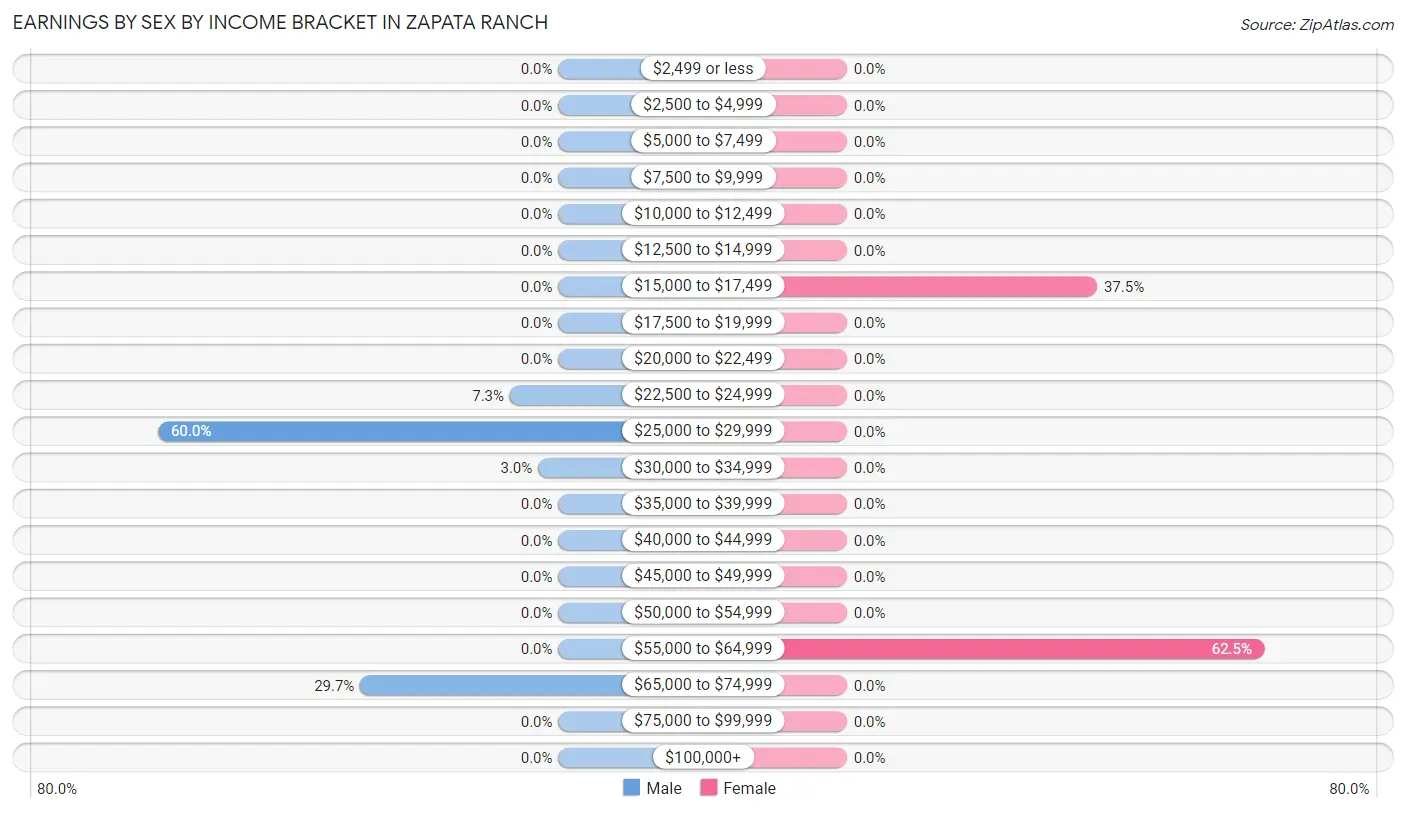
| Income | Male | Female |
| $2,499 or less | 0 (0.0%) | 0 (0.0%) |
| $2,500 to $4,999 | 0 (0.0%) | 0 (0.0%) |
| $5,000 to $7,499 | 0 (0.0%) | 0 (0.0%) |
| $7,500 to $9,999 | 0 (0.0%) | 0 (0.0%) |
| $10,000 to $12,499 | 0 (0.0%) | 0 (0.0%) |
| $12,500 to $14,999 | 0 (0.0%) | 0 (0.0%) |
| $15,000 to $17,499 | 0 (0.0%) | 9 (37.5%) |
| $17,500 to $19,999 | 0 (0.0%) | 0 (0.0%) |
| $20,000 to $22,499 | 0 (0.0%) | 0 (0.0%) |
| $22,500 to $24,999 | 12 (7.3%) | 0 (0.0%) |
| $25,000 to $29,999 | 99 (60.0%) | 0 (0.0%) |
| $30,000 to $34,999 | 5 (3.0%) | 0 (0.0%) |
| $35,000 to $39,999 | 0 (0.0%) | 0 (0.0%) |
| $40,000 to $44,999 | 0 (0.0%) | 0 (0.0%) |
| $45,000 to $49,999 | 0 (0.0%) | 0 (0.0%) |
| $50,000 to $54,999 | 0 (0.0%) | 0 (0.0%) |
| $55,000 to $64,999 | 0 (0.0%) | 15 (62.5%) |
| $65,000 to $74,999 | 49 (29.7%) | 0 (0.0%) |
| $75,000 to $99,999 | 0 (0.0%) | 0 (0.0%) |
| $100,000+ | 0 (0.0%) | 0 (0.0%) |
| Total | 165 (100.0%) | 24 (100.0%) |
Earnings by Sex by Educational Attainment in Zapata Ranch
| Educational Attainment | Male Income | Female Income |
| Less than High School | - | - |
| High School Diploma | - | - |
| College or Associate's Degree | - | - |
| Bachelor's Degree | - | - |
| Graduate Degree | - | - |
| Total | - | - |
Family Income in Zapata Ranch
Family Income Brackets in Zapata Ranch
According to the Zapata Ranch family income data, there are 15 families falling into the $100,000 to $149,999 income range, which is the most common income bracket and makes up 60.0% of all families.
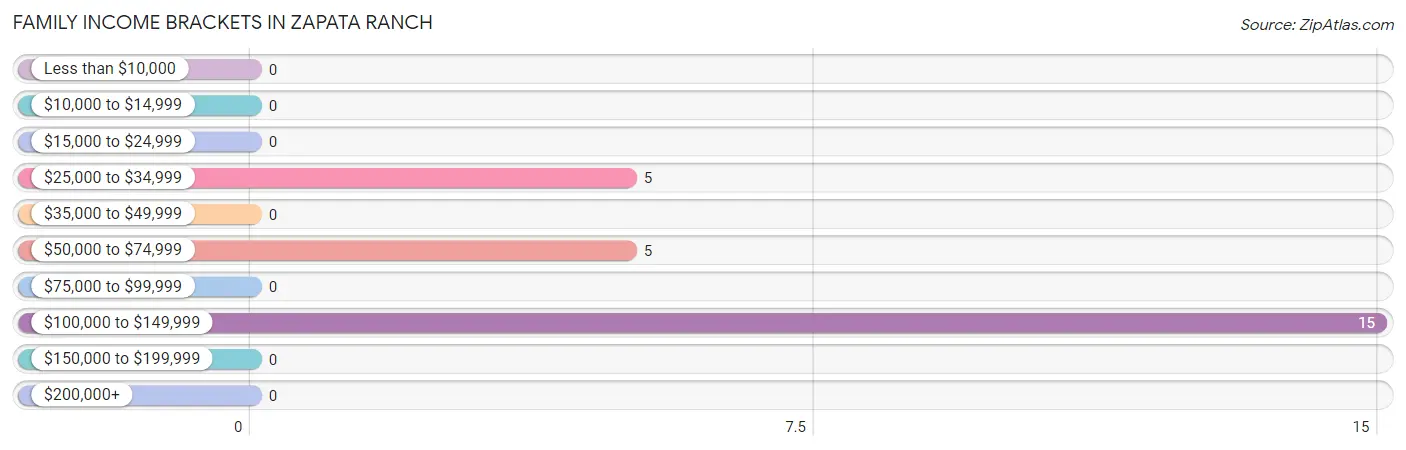
| Income Bracket | # Families | % Families |
| Less than $10,000 | 0 | 0.0% |
| $10,000 to $14,999 | 0 | 0.0% |
| $15,000 to $24,999 | 0 | 0.0% |
| $25,000 to $34,999 | 5 | 20.0% |
| $35,000 to $49,999 | 0 | 0.0% |
| $50,000 to $74,999 | 5 | 20.0% |
| $75,000 to $99,999 | 0 | 0.0% |
| $100,000 to $149,999 | 15 | 60.0% |
| $150,000 to $199,999 | 0 | 0.0% |
| $200,000+ | 0 | 0.0% |
Family Income by Famaliy Size in Zapata Ranch
| Income Bracket | # Families | Median Income |
| 2-Person Families | 5 (20.0%) | $0 |
| 3-Person Families | 15 (60.0%) | $0 |
| 4-Person Families | 5 (20.0%) | $0 |
| 5-Person Families | 0 (0.0%) | $0 |
| 6-Person Families | 0 (0.0%) | $0 |
| 7+ Person Families | 0 (0.0%) | $0 |
| Total | 25 (100.0%) | $0 |
Family Income by Number of Earners in Zapata Ranch
| Number of Earners | # Families | Median Income |
| No Earners | 0 (0.0%) | $0 |
| 1 Earner | 5 (20.0%) | $0 |
| 2 Earners | 20 (80.0%) | $0 |
| 3+ Earners | 0 (0.0%) | $0 |
| Total | 25 (100.0%) | $0 |
Household Income in Zapata Ranch
Household Income Brackets in Zapata Ranch
With 64 households falling in the category, the $100,000 to $149,999 income range is the most frequent in Zapata Ranch, accounting for 82.1% of all households.
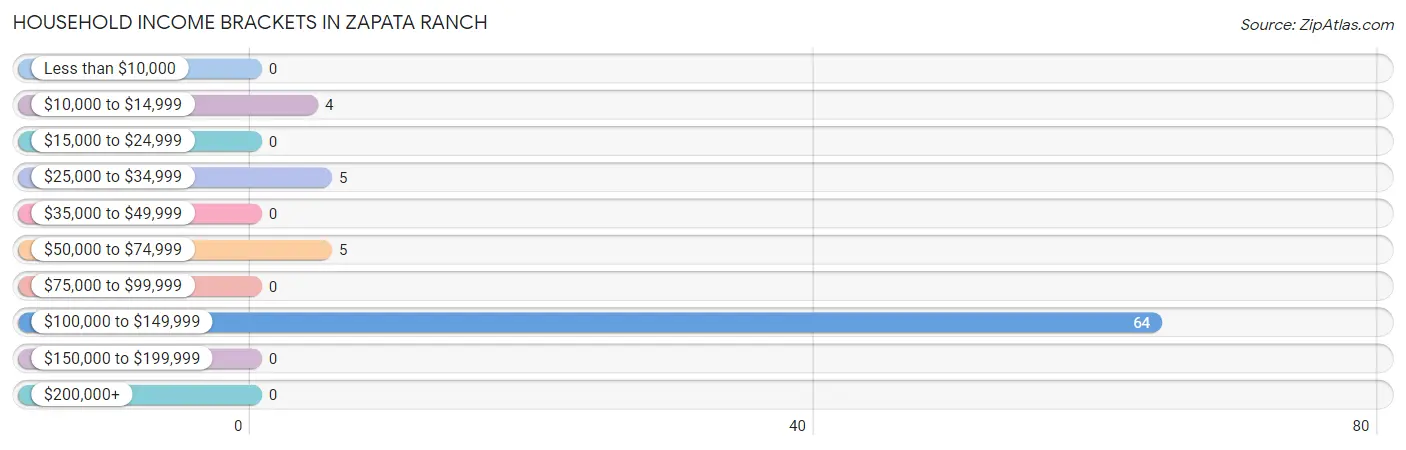
| Income Bracket | # Households | % Households |
| Less than $10,000 | 0 | 0.0% |
| $10,000 to $14,999 | 4 | 5.1% |
| $15,000 to $24,999 | 0 | 0.0% |
| $25,000 to $34,999 | 5 | 6.4% |
| $35,000 to $49,999 | 0 | 0.0% |
| $50,000 to $74,999 | 5 | 6.4% |
| $75,000 to $99,999 | 0 | 0.0% |
| $100,000 to $149,999 | 64 | 82.1% |
| $150,000 to $199,999 | 0 | 0.0% |
| $200,000+ | 0 | 0.0% |
Household Income by Householder Age in Zapata Ranch
The median household income in Zapata Ranch is $103,776, with the highest median household income of $103,393 found in the 65+ years age bracket for the primary householder. A total of 63 households (80.8%) fall into this category.
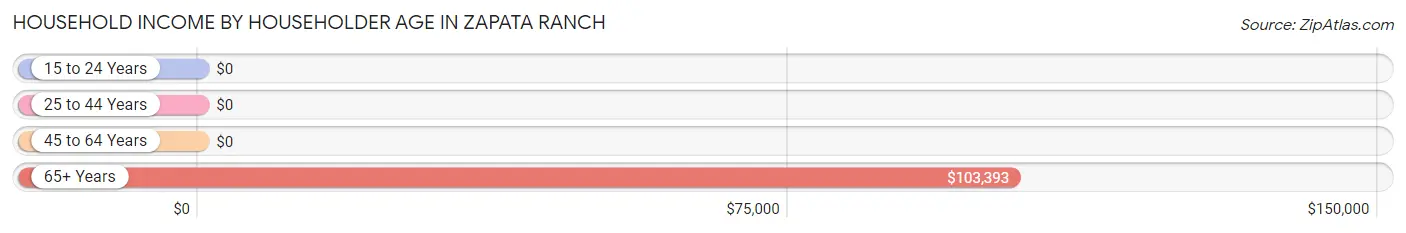
| Income Bracket | # Households | Median Income |
| 15 to 24 Years | 0 (0.0%) | $0 |
| 25 to 44 Years | 0 (0.0%) | $0 |
| 45 to 64 Years | 15 (19.2%) | $0 |
| 65+ Years | 63 (80.8%) | $103,393 |
| Total | 78 (100.0%) | $103,776 |
Poverty in Zapata Ranch
Income Below Poverty by Sex and Age in Zapata Ranch
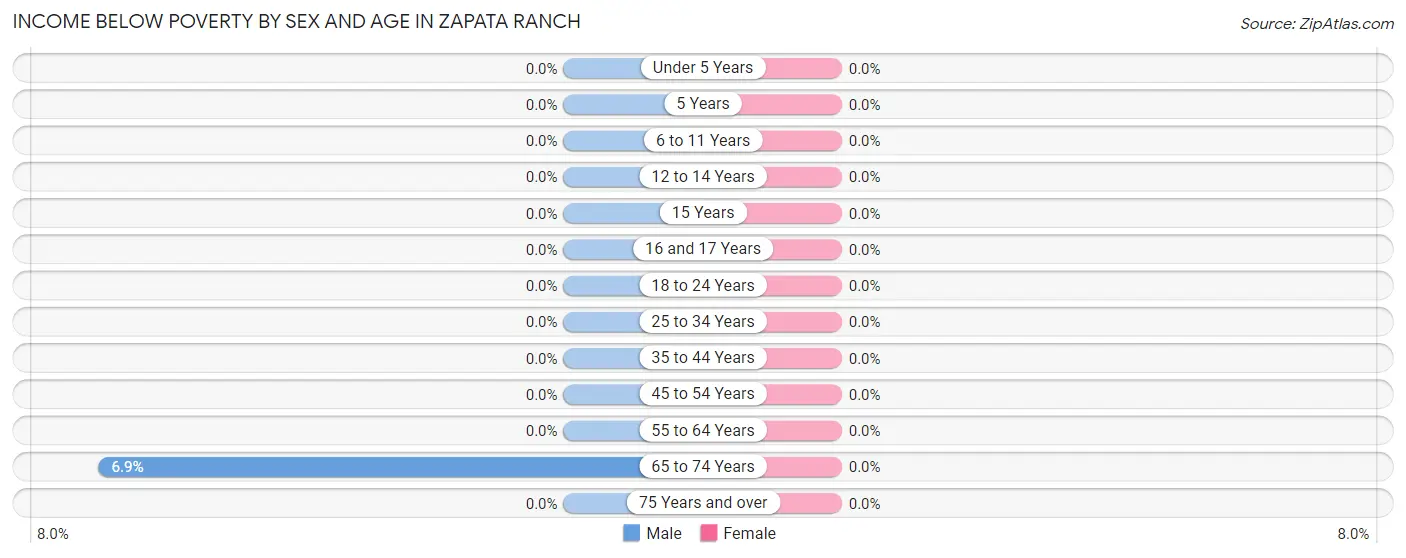
| Age Bracket | Male | Female |
| Under 5 Years | 0 (0.0%) | 0 (0.0%) |
| 5 Years | 0 (0.0%) | 0 (0.0%) |
| 6 to 11 Years | 0 (0.0%) | 0 (0.0%) |
| 12 to 14 Years | 0 (0.0%) | 0 (0.0%) |
| 15 Years | 0 (0.0%) | 0 (0.0%) |
| 16 and 17 Years | 0 (0.0%) | 0 (0.0%) |
| 18 to 24 Years | 0 (0.0%) | 0 (0.0%) |
| 25 to 34 Years | 0 (0.0%) | 0 (0.0%) |
| 35 to 44 Years | 0 (0.0%) | 0 (0.0%) |
| 45 to 54 Years | 0 (0.0%) | 0 (0.0%) |
| 55 to 64 Years | 0 (0.0%) | 0 (0.0%) |
| 65 to 74 Years | 4 (6.9%) | 0 (0.0%) |
| 75 Years and over | 0 (0.0%) | 0 (0.0%) |
| Total | 4 (2.2%) | 0 (0.0%) |
Income Above Poverty by Sex and Age in Zapata Ranch
According to the poverty statistics in Zapata Ranch, males aged 35 to 44 years and females aged 18 to 24 years are the age groups that are most secure financially, with 100.0% of males and 100.0% of females in these age groups living above the poverty line.
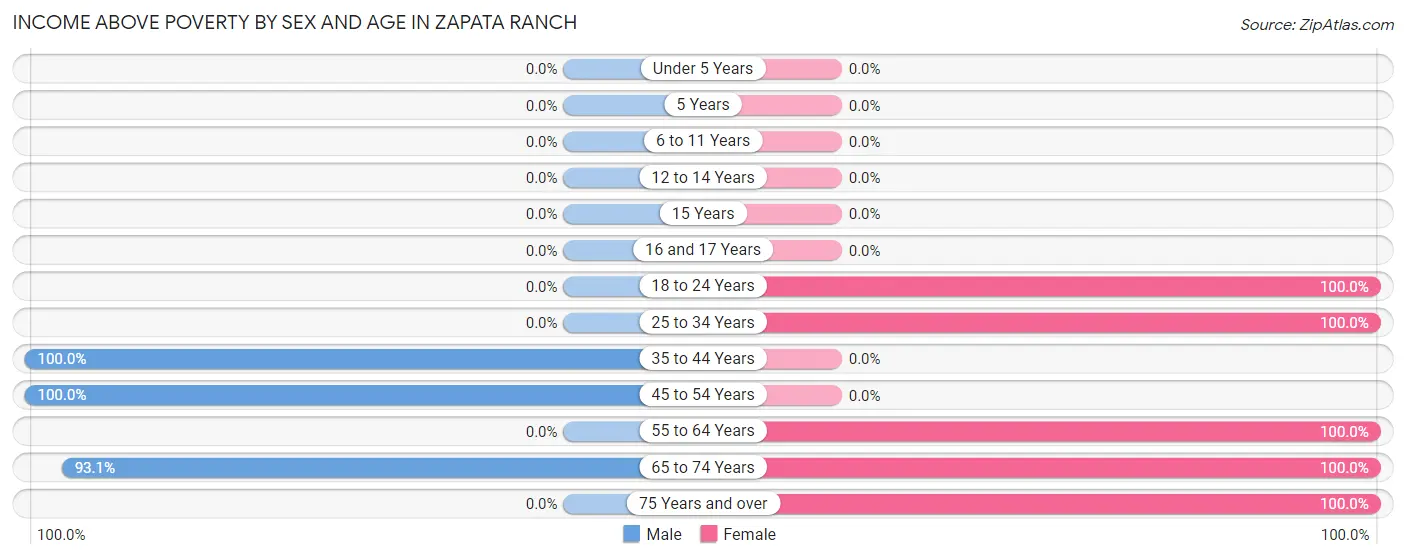
| Age Bracket | Male | Female |
| Under 5 Years | 0 (0.0%) | 0 (0.0%) |
| 5 Years | 0 (0.0%) | 0 (0.0%) |
| 6 to 11 Years | 0 (0.0%) | 0 (0.0%) |
| 12 to 14 Years | 0 (0.0%) | 0 (0.0%) |
| 15 Years | 0 (0.0%) | 0 (0.0%) |
| 16 and 17 Years | 0 (0.0%) | 0 (0.0%) |
| 18 to 24 Years | 0 (0.0%) | 28 (100.0%) |
| 25 to 34 Years | 0 (0.0%) | 9 (100.0%) |
| 35 to 44 Years | 99 (100.0%) | 0 (0.0%) |
| 45 to 54 Years | 24 (100.0%) | 0 (0.0%) |
| 55 to 64 Years | 0 (0.0%) | 15 (100.0%) |
| 65 to 74 Years | 54 (93.1%) | 8 (100.0%) |
| 75 Years and over | 0 (0.0%) | 5 (100.0%) |
| Total | 177 (97.8%) | 65 (100.0%) |
Income Below Poverty Among Married-Couple Families in Zapata Ranch
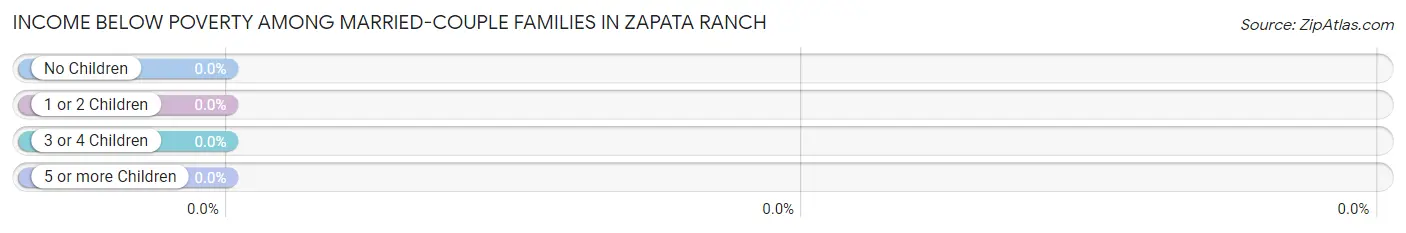
| Children | Above Poverty | Below Poverty |
| No Children | 5 (100.0%) | 0 (0.0%) |
| 1 or 2 Children | 0 (0.0%) | 0 (0.0%) |
| 3 or 4 Children | 0 (0.0%) | 0 (0.0%) |
| 5 or more Children | 0 (0.0%) | 0 (0.0%) |
| Total | 5 (100.0%) | 0 (0.0%) |
Income Below Poverty Among Single-Parent Households in Zapata Ranch
| Children | Single Father | Single Mother |
| No Children | 0 (0.0%) | 0 (0.0%) |
| 1 or 2 Children | 0 (0.0%) | 0 (0.0%) |
| 3 or 4 Children | 0 (0.0%) | 0 (0.0%) |
| 5 or more Children | 0 (0.0%) | 0 (0.0%) |
| Total | 0 (0.0%) | 0 (0.0%) |
Income Below Poverty Among Married-Couple vs Single-Parent Households in Zapata Ranch
| Children | Married-Couple Families | Single-Parent Households |
| No Children | 0 (0.0%) | 0 (0.0%) |
| 1 or 2 Children | 0 (0.0%) | 0 (0.0%) |
| 3 or 4 Children | 0 (0.0%) | 0 (0.0%) |
| 5 or more Children | 0 (0.0%) | 0 (0.0%) |
| Total | 0 (0.0%) | 0 (0.0%) |
Race in Zapata Ranch
The most populous races in Zapata Ranch are Hispanic or Latino (238 | 96.8%), Two or more Races (155 | 63.0%), and White / Caucasian (91 | 37.0%).
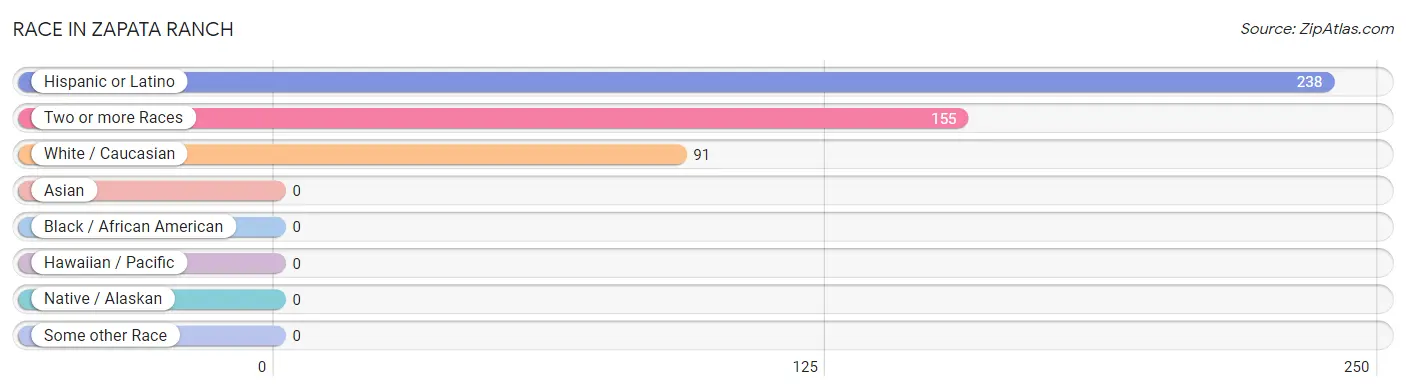
| Race | # Population | % Population |
| Asian | 0 | 0.0% |
| Black / African American | 0 | 0.0% |
| Hawaiian / Pacific | 0 | 0.0% |
| Hispanic or Latino | 238 | 96.8% |
| Native / Alaskan | 0 | 0.0% |
| White / Caucasian | 91 | 37.0% |
| Two or more Races | 155 | 63.0% |
| Some other Race | 0 | 0.0% |
| Total | 246 | 100.0% |
Ancestry in Zapata Ranch
The most populous ancestries reported in Zapata Ranch are Mexican (195 | 79.3%), American (38 | 15.4%), Apache (5 | 2.0%), and Spanish American (5 | 2.0%), together accounting for 98.8% of all Zapata Ranch residents.
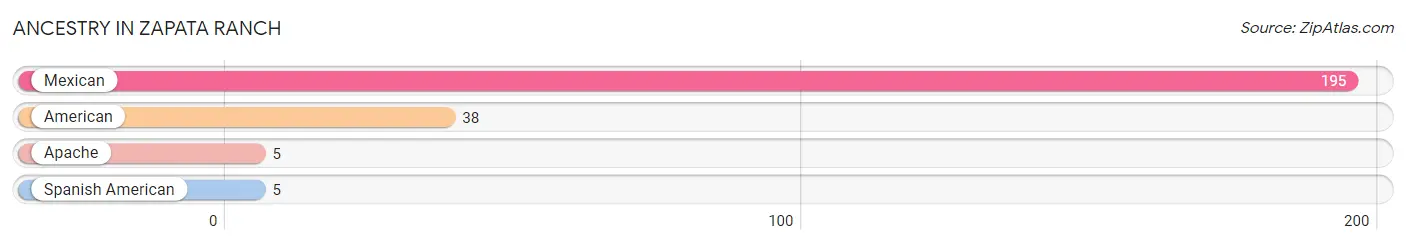
| Ancestry | # Population | % Population |
| American | 38 | 15.4% |
| Apache | 5 | 2.0% |
| Mexican | 195 | 79.3% |
| Spanish American | 5 | 2.0% | View All 4 Rows |
Immigrants in Zapata Ranch
The most numerous immigrant groups reported in Zapata Ranch came from Central America (49 | 19.9%), Latin America (49 | 19.9%), and Mexico (49 | 19.9%), together accounting for 59.8% of all Zapata Ranch residents.
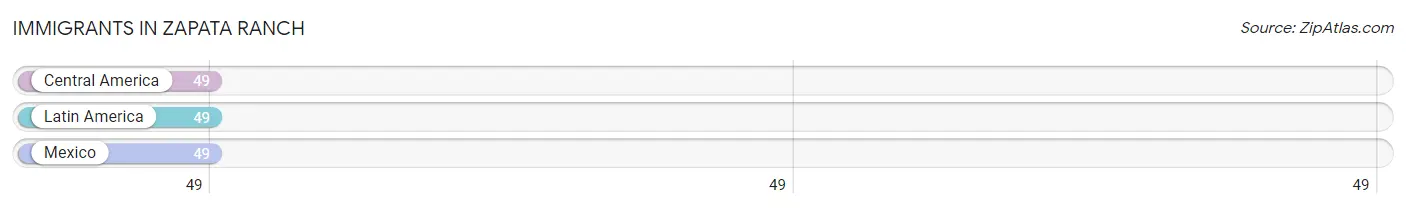
| Immigration Origin | # Population | % Population |
| Central America | 49 | 19.9% |
| Latin America | 49 | 19.9% |
| Mexico | 49 | 19.9% | View All 3 Rows |
Sex and Age in Zapata Ranch
Sex and Age in Zapata Ranch
The most populous age groups in Zapata Ranch are 35 to 39 Years (99 | 54.7%) for men and 15 to 19 Years (28 | 43.1%) for women.
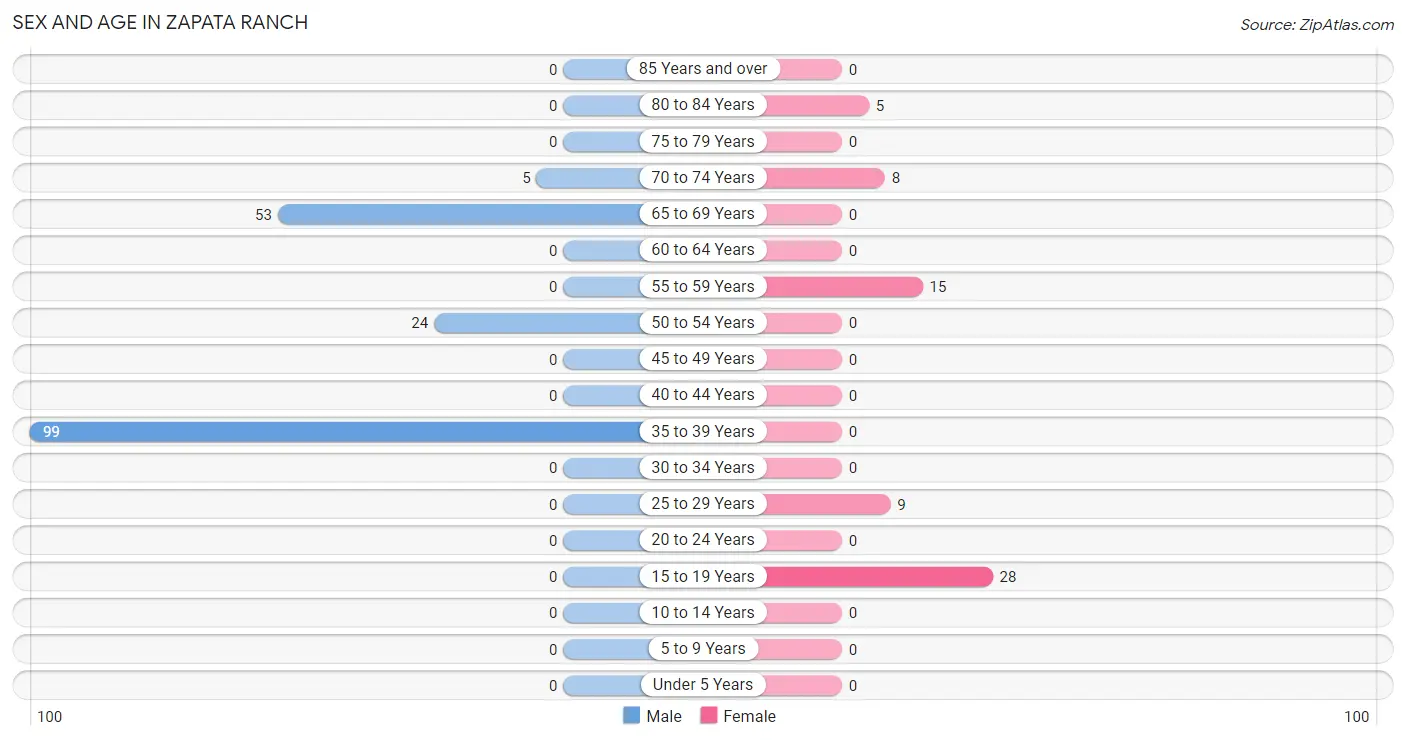
| Age Bracket | Male | Female |
| Under 5 Years | 0 (0.0%) | 0 (0.0%) |
| 5 to 9 Years | 0 (0.0%) | 0 (0.0%) |
| 10 to 14 Years | 0 (0.0%) | 0 (0.0%) |
| 15 to 19 Years | 0 (0.0%) | 28 (43.1%) |
| 20 to 24 Years | 0 (0.0%) | 0 (0.0%) |
| 25 to 29 Years | 0 (0.0%) | 9 (13.9%) |
| 30 to 34 Years | 0 (0.0%) | 0 (0.0%) |
| 35 to 39 Years | 99 (54.7%) | 0 (0.0%) |
| 40 to 44 Years | 0 (0.0%) | 0 (0.0%) |
| 45 to 49 Years | 0 (0.0%) | 0 (0.0%) |
| 50 to 54 Years | 24 (13.3%) | 0 (0.0%) |
| 55 to 59 Years | 0 (0.0%) | 15 (23.1%) |
| 60 to 64 Years | 0 (0.0%) | 0 (0.0%) |
| 65 to 69 Years | 53 (29.3%) | 0 (0.0%) |
| 70 to 74 Years | 5 (2.8%) | 8 (12.3%) |
| 75 to 79 Years | 0 (0.0%) | 0 (0.0%) |
| 80 to 84 Years | 0 (0.0%) | 5 (7.7%) |
| 85 Years and over | 0 (0.0%) | 0 (0.0%) |
| Total | 181 (100.0%) | 65 (100.0%) |
Families and Households in Zapata Ranch
Median Family Size in Zapata Ranch
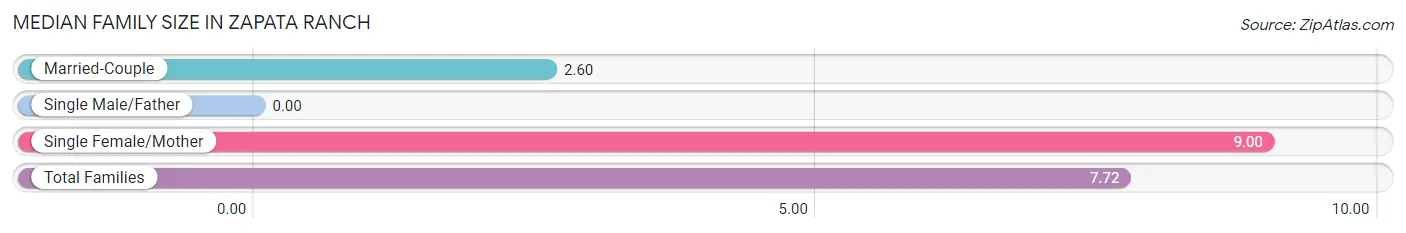
| Family Type | # Families | Family Size |
| Married-Couple | 5 (20.0%) | 2.60 |
| Single Male/Father | 0 (0.0%) | - |
| Single Female/Mother | 20 (80.0%) | 9.00 |
| Total Families | 25 (100.0%) | 7.72 |
Median Household Size in Zapata Ranch
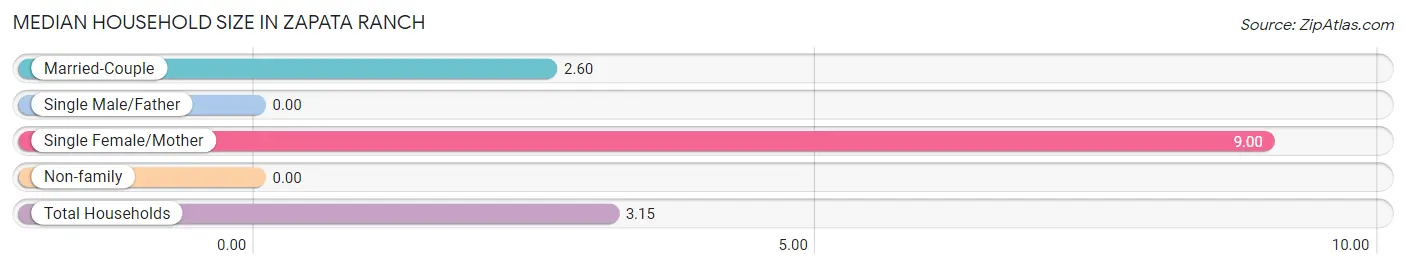
| Household Type | # Households | Household Size |
| Married-Couple | 5 (6.4%) | 2.60 |
| Single Male/Father | 0 (0.0%) | - |
| Single Female/Mother | 20 (25.6%) | 9.00 |
| Non-family | 53 (67.9%) | - |
| Total Households | 78 (100.0%) | 3.15 |
Household Size by Marriage Status in Zapata Ranch
Out of a total of 78 households in Zapata Ranch, 25 (32.1%) are family households, while 53 (67.9%) are nonfamily households. The most numerous type of family households are 3-person households, comprising 15, and the most common type of nonfamily households are 1-person households, comprising 53.
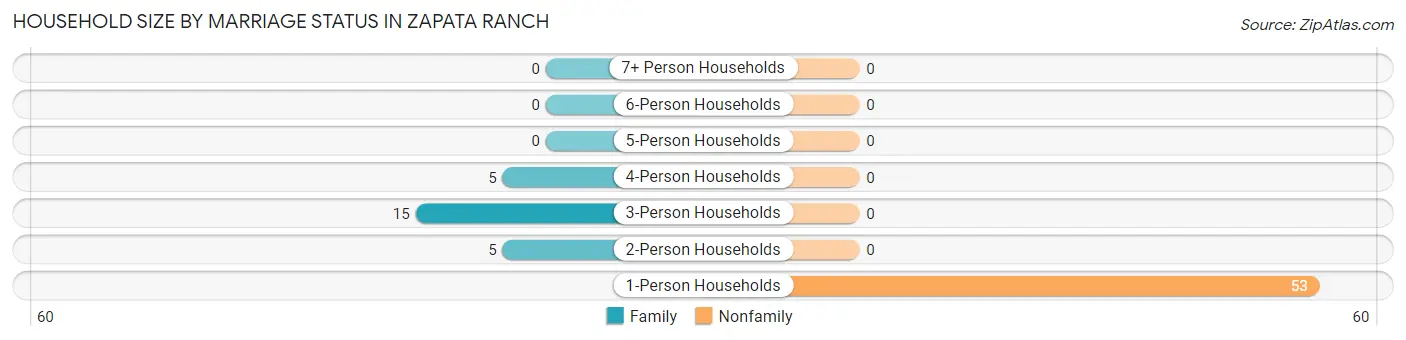
| Household Size | Family Households | Nonfamily Households |
| 1-Person Households | - | 53 (67.9%) |
| 2-Person Households | 5 (6.4%) | 0 (0.0%) |
| 3-Person Households | 15 (19.2%) | 0 (0.0%) |
| 4-Person Households | 5 (6.4%) | 0 (0.0%) |
| 5-Person Households | 0 (0.0%) | 0 (0.0%) |
| 6-Person Households | 0 (0.0%) | 0 (0.0%) |
| 7+ Person Households | 0 (0.0%) | 0 (0.0%) |
| Total | 25 (32.1%) | 53 (67.9%) |
Female Fertility in Zapata Ranch
Fertility by Age in Zapata Ranch
| Age Bracket | Women with Births | Births / 1,000 Women |
| 15 to 19 years | 0 (0.0%) | 0.0 |
| 20 to 34 years | 0 (0.0%) | 0.0 |
| 35 to 50 years | 0 (0.0%) | 0.0 |
| Total | 0 (0.0%) | 0.0 |
Fertility by Age by Marriage Status in Zapata Ranch
| Age Bracket | Married | Unmarried |
| 15 to 19 years | 0 (0.0%) | 0 (0.0%) |
| 20 to 34 years | 0 (0.0%) | 0 (0.0%) |
| 35 to 50 years | 0 (0.0%) | 0 (0.0%) |
| Total | 0 (0.0%) | 0 (0.0%) |
Fertility by Education in Zapata Ranch
| Educational Attainment | Women with Births | Births / 1,000 Women |
| Less than High School | 0 (0.0%) | 0.0 |
| High School Diploma | 0 (0.0%) | 0.0 |
| College or Associate's Degree | 0 (0.0%) | 0.0 |
| Bachelor's Degree | 0 (0.0%) | 0.0 |
| Graduate Degree | 0 (0.0%) | 0.0 |
| Total | 0 (0.0%) | 0.0 |
Fertility by Education by Marriage Status in Zapata Ranch
| Educational Attainment | Married | Unmarried |
| Less than High School | 0 (0.0%) | 0 (0.0%) |
| High School Diploma | 0 (0.0%) | 0 (0.0%) |
| College or Associate's Degree | 0 (0.0%) | 0 (0.0%) |
| Bachelor's Degree | 0 (0.0%) | 0 (0.0%) |
| Graduate Degree | 0 (0.0%) | 0 (0.0%) |
| Total | 0 (0.0%) | 0 (0.0%) |
Employment Characteristics in Zapata Ranch
Employment by Class of Employer in Zapata Ranch
Among the 189 employed individuals in Zapata Ranch, private company employees (174 | 92.1%), and federal government employees (15 | 7.9%) make up the most common classes of employment.
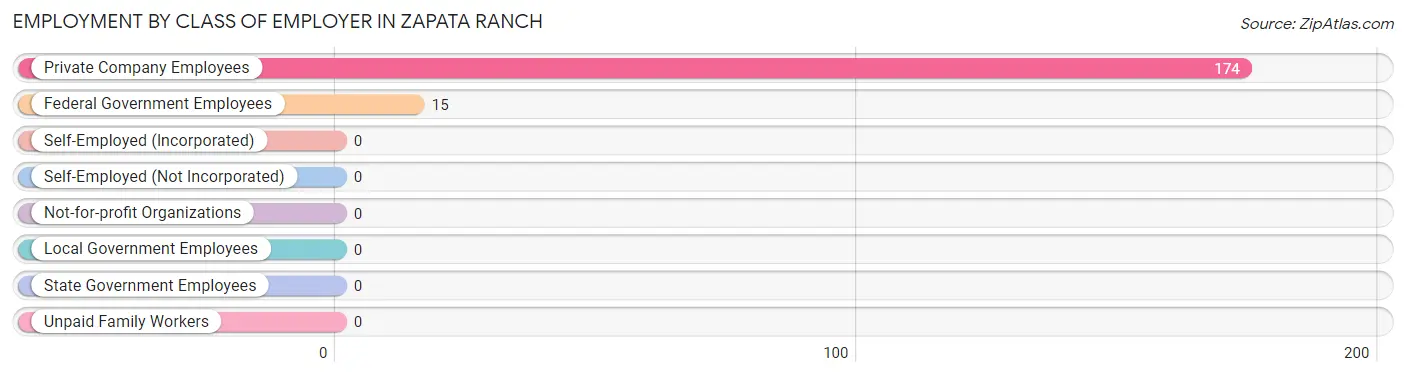
| Employer Class | # Employees | % Employees |
| Private Company Employees | 174 | 92.1% |
| Self-Employed (Incorporated) | 0 | 0.0% |
| Self-Employed (Not Incorporated) | 0 | 0.0% |
| Not-for-profit Organizations | 0 | 0.0% |
| Local Government Employees | 0 | 0.0% |
| State Government Employees | 0 | 0.0% |
| Federal Government Employees | 15 | 7.9% |
| Unpaid Family Workers | 0 | 0.0% |
| Total | 189 | 100.0% |
Employment Status by Age in Zapata Ranch
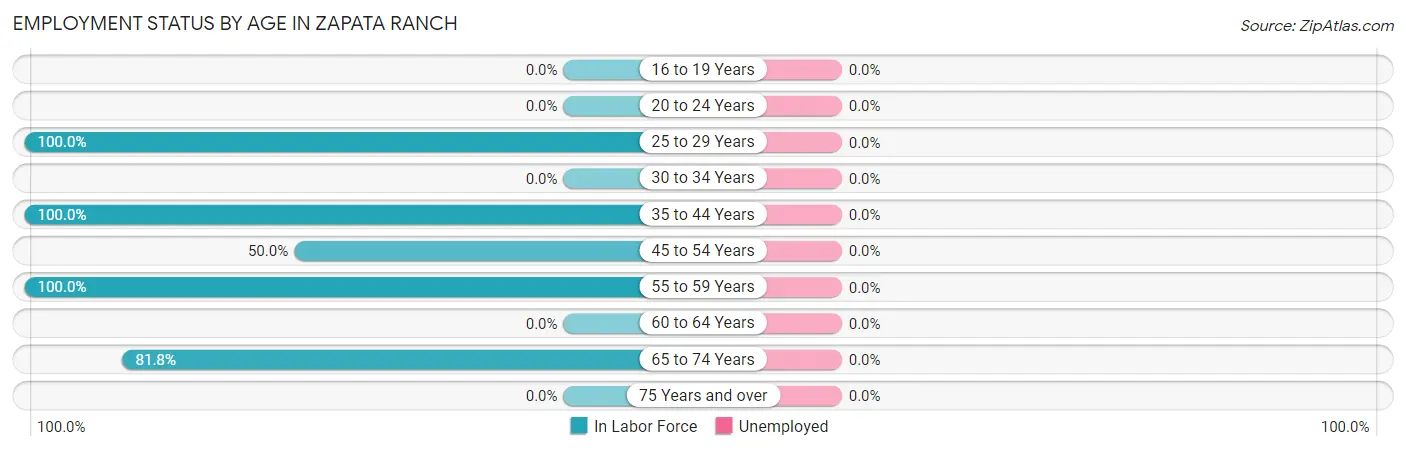
| Age Bracket | In Labor Force | Unemployed |
| 16 to 19 Years | 0 (0.0%) | 0 (0.0%) |
| 20 to 24 Years | 0 (0.0%) | 0 (0.0%) |
| 25 to 29 Years | 9 (100.0%) | 0 (0.0%) |
| 30 to 34 Years | 0 (0.0%) | 0 (0.0%) |
| 35 to 44 Years | 99 (100.0%) | 0 (0.0%) |
| 45 to 54 Years | 12 (50.0%) | 0 (0.0%) |
| 55 to 59 Years | 15 (100.0%) | 0 (0.0%) |
| 60 to 64 Years | 0 (0.0%) | 0 (0.0%) |
| 65 to 74 Years | 54 (81.8%) | 0 (0.0%) |
| 75 Years and over | 0 (0.0%) | 0 (0.0%) |
| Total | 189 (76.8%) | 0 (0.0%) |
Employment Status by Educational Attainment in Zapata Ranch
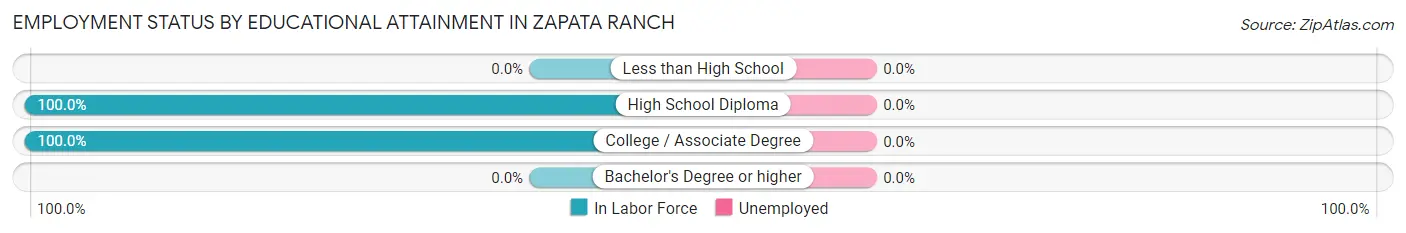
| Educational Attainment | In Labor Force | Unemployed |
| Less than High School | 0 (0.0%) | 0 (0.0%) |
| High School Diploma | 126 (100.0%) | 0 (0.0%) |
| College / Associate Degree | 9 (100.0%) | 0 (0.0%) |
| Bachelor's Degree or higher | 0 (0.0%) | 0 (0.0%) |
| Total | 135 (91.8%) | 0 (0.0%) |
Employment Occupations by Sex in Zapata Ranch
Management, Business, Science and Arts Occupations
The most common Management, Business, Science and Arts occupations in Zapata Ranch are Health Diagnosing & Treating (58 | 30.7%), and Health Technologists (49 | 25.9%).
Management, Business, Science and Arts Occupations by Sex
| Occupation | Male | Female |
| Management | 0 (0.0%) | 0 (0.0%) |
| Business & Financial | 0 (0.0%) | 0 (0.0%) |
| Computers, Engineering & Science | 0 (0.0%) | 0 (0.0%) |
| Computers & Mathematics | 0 (0.0%) | 0 (0.0%) |
| Architecture & Engineering | 0 (0.0%) | 0 (0.0%) |
| Life, Physical & Social Science | 0 (0.0%) | 0 (0.0%) |
| Community & Social Service | 0 (0.0%) | 0 (0.0%) |
| Education, Arts & Media | 0 (0.0%) | 0 (0.0%) |
| Legal Services & Support | 0 (0.0%) | 0 (0.0%) |
| Education Instruction & Library | 0 (0.0%) | 0 (0.0%) |
| Arts, Media & Entertainment | 0 (0.0%) | 0 (0.0%) |
| Health Diagnosing & Treating | 49 (84.5%) | 9 (15.5%) |
| Health Technologists | 49 (100.0%) | 0 (0.0%) |
| Total (Category) | 49 (84.5%) | 9 (15.5%) |
| Total (Overall) | 165 (87.3%) | 24 (12.7%) |
Services Occupations
The most common Services occupations in Zapata Ranch are , and Cleaning & Maintenance (5 | 2.6%).
Services Occupations by Sex
| Occupation | Male | Female |
| Healthcare Support | 0 (0.0%) | 0 (0.0%) |
| Security & Protection | 0 (0.0%) | 0 (0.0%) |
| Firefighting & Prevention | 0 (0.0%) | 0 (0.0%) |
| Law Enforcement | 0 (0.0%) | 0 (0.0%) |
| Food Preparation & Serving | 0 (0.0%) | 0 (0.0%) |
| Cleaning & Maintenance | 5 (100.0%) | 0 (0.0%) |
| Personal Care & Service | 0 (0.0%) | 0 (0.0%) |
| Total (Category) | 5 (100.0%) | 0 (0.0%) |
| Total (Overall) | 165 (87.3%) | 24 (12.7%) |
Sales and Office Occupations
The most common Sales and Office occupations in Zapata Ranch are , and Office & Administration (15 | 7.9%).
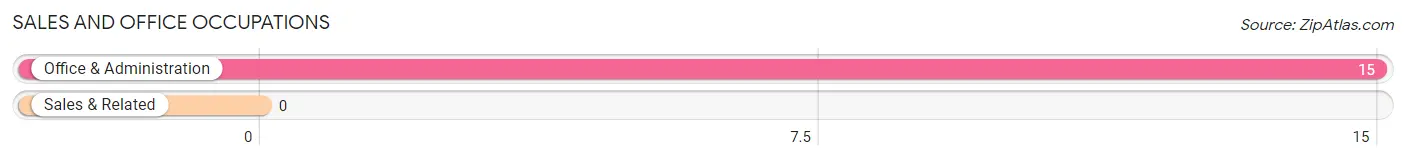
Sales and Office Occupations by Sex
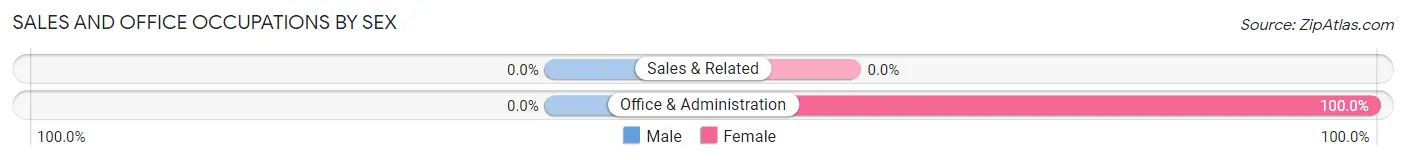
| Occupation | Male | Female |
| Sales & Related | 0 (0.0%) | 0 (0.0%) |
| Office & Administration | 0 (0.0%) | 15 (100.0%) |
| Total (Category) | 0 (0.0%) | 15 (100.0%) |
| Total (Overall) | 165 (87.3%) | 24 (12.7%) |
Natural Resources, Construction and Maintenance Occupations
The most common Natural Resources, Construction and Maintenance occupations in Zapata Ranch are , and Installation, Maintenance & Repair (12 | 6.4%).
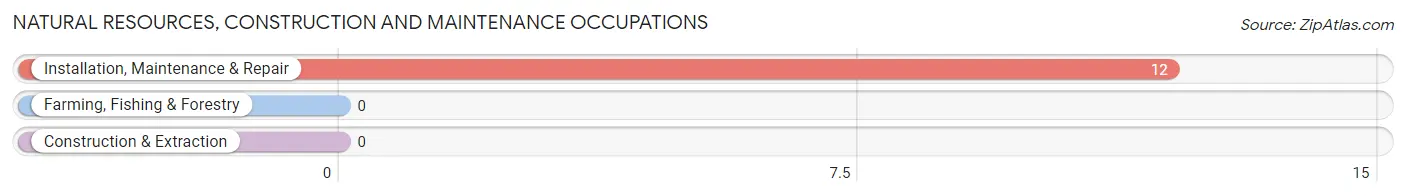
Natural Resources, Construction and Maintenance Occupations by Sex
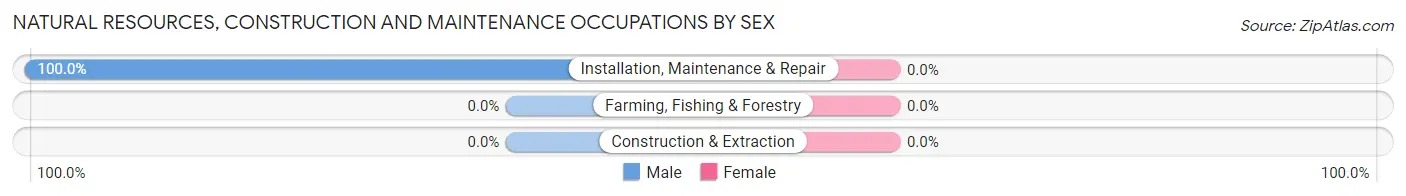
| Occupation | Male | Female |
| Farming, Fishing & Forestry | 0 (0.0%) | 0 (0.0%) |
| Construction & Extraction | 0 (0.0%) | 0 (0.0%) |
| Installation, Maintenance & Repair | 12 (100.0%) | 0 (0.0%) |
| Total (Category) | 12 (100.0%) | 0 (0.0%) |
| Total (Overall) | 165 (87.3%) | 24 (12.7%) |
Production, Transportation and Moving Occupations
The most common Production, Transportation and Moving occupations in Zapata Ranch are , and Transportation (99 | 52.4%).
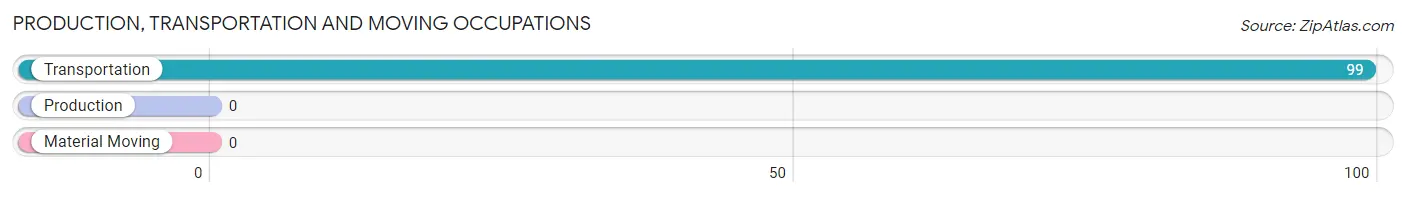
Production, Transportation and Moving Occupations by Sex
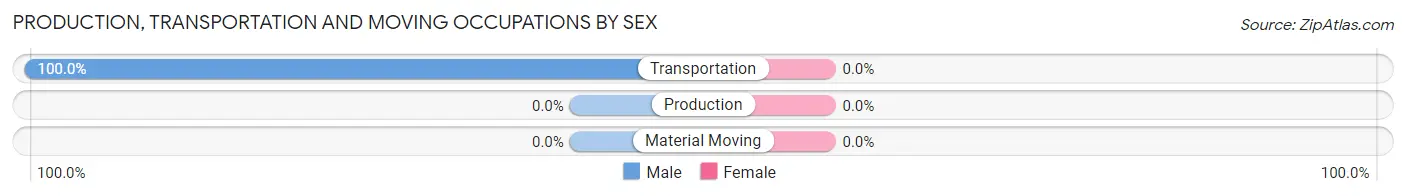
| Occupation | Male | Female |
| Production | 0 (0.0%) | 0 (0.0%) |
| Transportation | 99 (100.0%) | 0 (0.0%) |
| Material Moving | 0 (0.0%) | 0 (0.0%) |
| Total (Category) | 99 (100.0%) | 0 (0.0%) |
| Total (Overall) | 165 (87.3%) | 24 (12.7%) |
Employment Industries by Sex in Zapata Ranch
Employment Industries in Zapata Ranch
The major employment industries in Zapata Ranch include Transportation & Warehousing (99 | 52.4%), Health Care & Social Assistance (58 | 30.7%), Public Administration (15 | 7.9%), Retail Trade (12 | 6.4%), and Administrative & Support (5 | 2.6%).
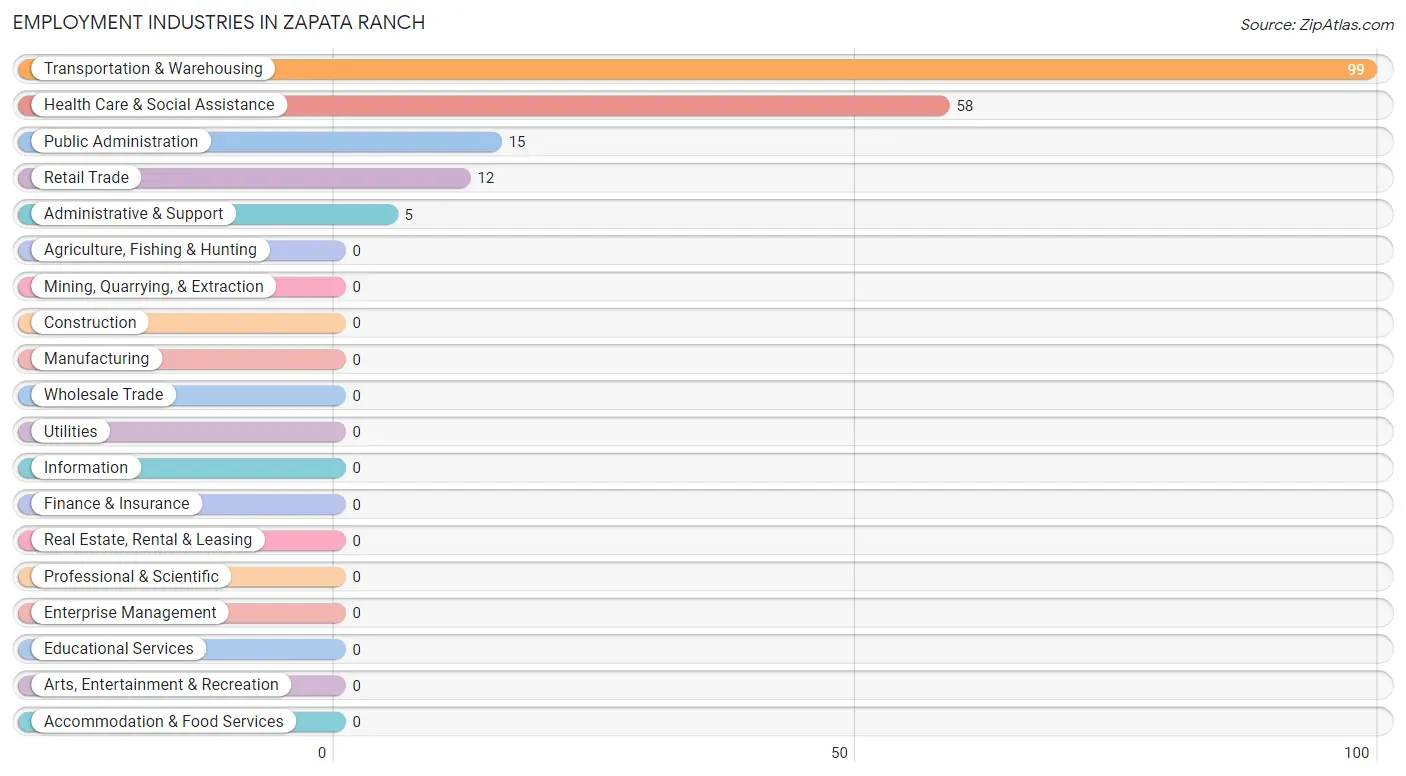
Employment Industries by Sex in Zapata Ranch
The Zapata Ranch industries that see more men than women are Retail Trade (100.0%), Transportation & Warehousing (100.0%), and Administrative & Support (100.0%), whereas the industries that tend to have a higher number of women are Public Administration (100.0%), and Health Care & Social Assistance (15.5%).
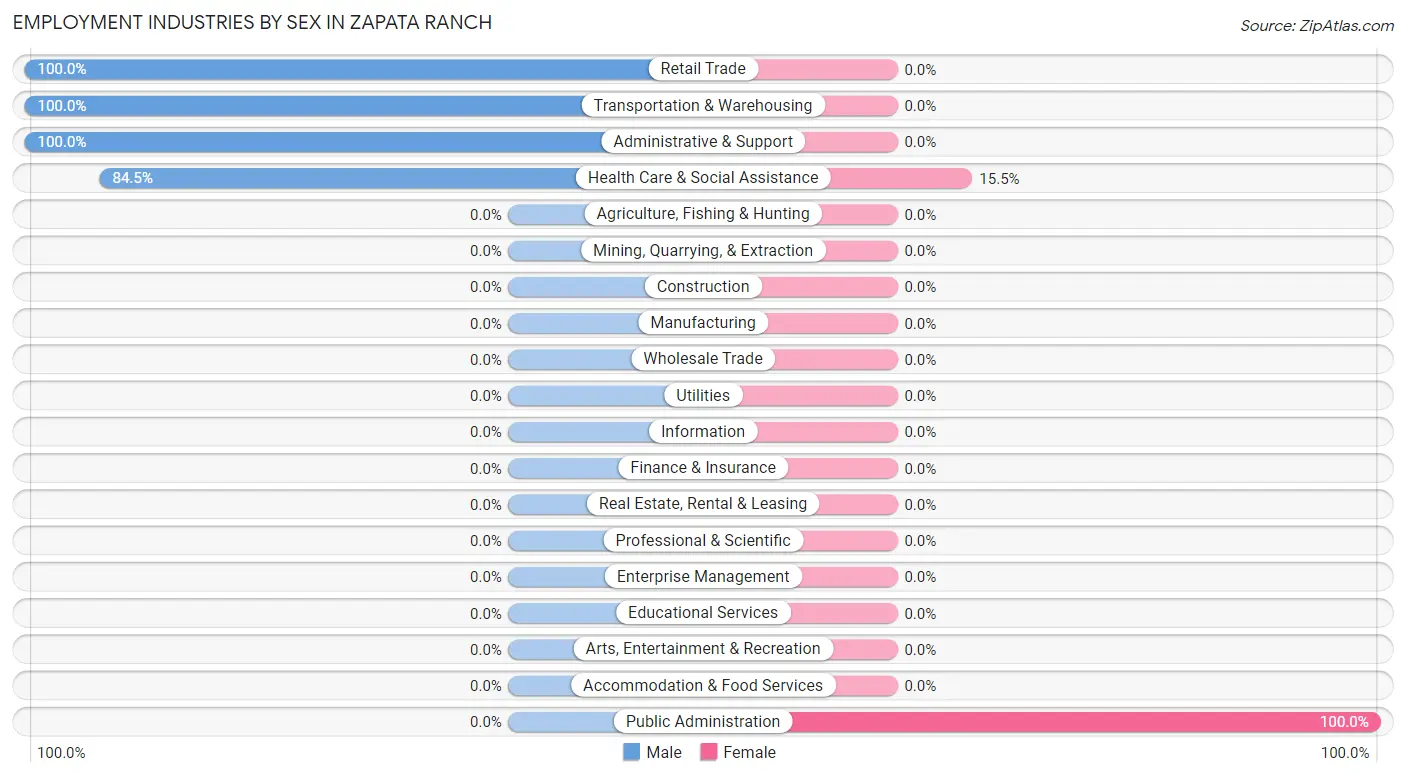
| Industry | Male | Female |
| Agriculture, Fishing & Hunting | 0 (0.0%) | 0 (0.0%) |
| Mining, Quarrying, & Extraction | 0 (0.0%) | 0 (0.0%) |
| Construction | 0 (0.0%) | 0 (0.0%) |
| Manufacturing | 0 (0.0%) | 0 (0.0%) |
| Wholesale Trade | 0 (0.0%) | 0 (0.0%) |
| Retail Trade | 12 (100.0%) | 0 (0.0%) |
| Transportation & Warehousing | 99 (100.0%) | 0 (0.0%) |
| Utilities | 0 (0.0%) | 0 (0.0%) |
| Information | 0 (0.0%) | 0 (0.0%) |
| Finance & Insurance | 0 (0.0%) | 0 (0.0%) |
| Real Estate, Rental & Leasing | 0 (0.0%) | 0 (0.0%) |
| Professional & Scientific | 0 (0.0%) | 0 (0.0%) |
| Enterprise Management | 0 (0.0%) | 0 (0.0%) |
| Administrative & Support | 5 (100.0%) | 0 (0.0%) |
| Educational Services | 0 (0.0%) | 0 (0.0%) |
| Health Care & Social Assistance | 49 (84.5%) | 9 (15.5%) |
| Arts, Entertainment & Recreation | 0 (0.0%) | 0 (0.0%) |
| Accommodation & Food Services | 0 (0.0%) | 0 (0.0%) |
| Public Administration | 0 (0.0%) | 15 (100.0%) |
| Total | 165 (87.3%) | 24 (12.7%) |
Education in Zapata Ranch
School Enrollment in Zapata Ranch
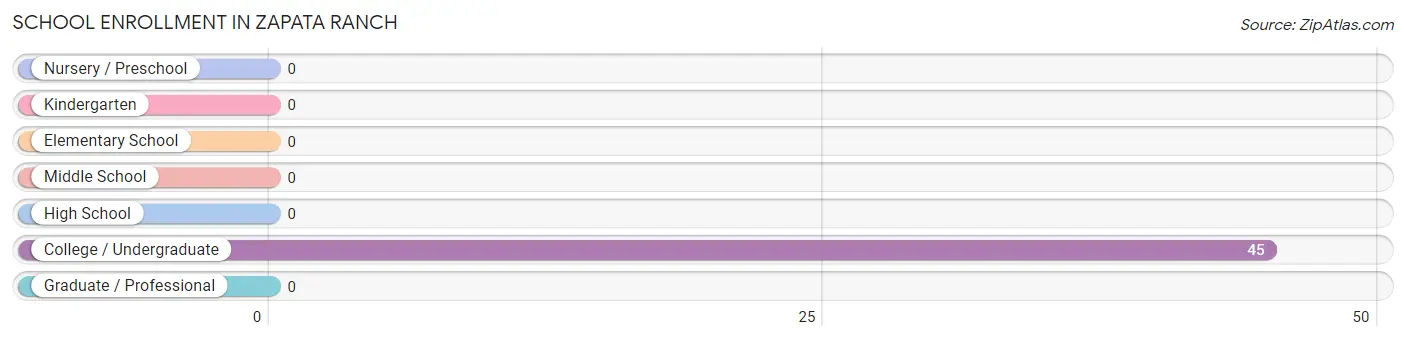
| School Level | # Students | % Students |
| Nursery / Preschool | 0 | 0.0% |
| Kindergarten | 0 | 0.0% |
| Elementary School | 0 | 0.0% |
| Middle School | 0 | 0.0% |
| High School | 0 | 0.0% |
| College / Undergraduate | 45 | 100.0% |
| Graduate / Professional | 0 | 0.0% |
| Total | 45 | 100.0% |
School Enrollment by Age by Funding Source in Zapata Ranch
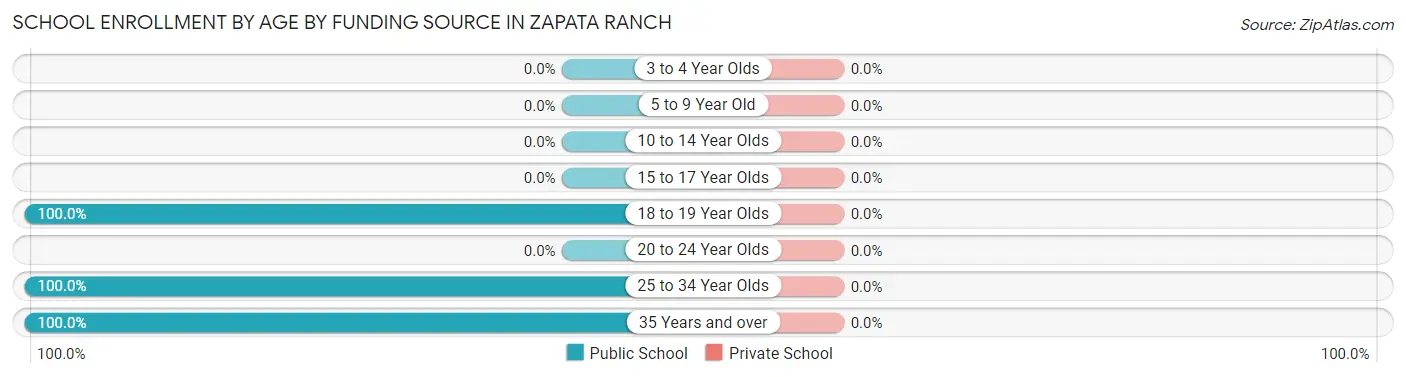
| Age Bracket | Public School | Private School |
| 3 to 4 Year Olds | 0 (0.0%) | 0 (0.0%) |
| 5 to 9 Year Old | 0 (0.0%) | 0 (0.0%) |
| 10 to 14 Year Olds | 0 (0.0%) | 0 (0.0%) |
| 15 to 17 Year Olds | 0 (0.0%) | 0 (0.0%) |
| 18 to 19 Year Olds | 28 (100.0%) | 0 (0.0%) |
| 20 to 24 Year Olds | 0 (0.0%) | 0 (0.0%) |
| 25 to 34 Year Olds | 9 (100.0%) | 0 (0.0%) |
| 35 Years and over | 8 (100.0%) | 0 (0.0%) |
| Total | 45 (100.0%) | 0 (0.0%) |
Educational Attainment by Field of Study in Zapata Ranch
| Field of Study | # Graduates | % Graduates |
| Computers & Mathematics | 0 | 0.0% |
| Bio, Nature & Agricultural | 0 | 0.0% |
| Physical & Health Sciences | 0 | 0.0% |
| Psychology | 0 | 0.0% |
| Social Sciences | 0 | 0.0% |
| Engineering | 0 | 0.0% |
| Multidisciplinary Studies | 0 | 0.0% |
| Science & Technology | 0 | 0.0% |
| Business | 0 | 0.0% |
| Education | 0 | 0.0% |
| Literature & Languages | 0 | 0.0% |
| Liberal Arts & History | 0 | 0.0% |
| Visual & Performing Arts | 0 | 0.0% |
| Communications | 0 | 0.0% |
| Arts & Humanities | 0 | 0.0% |
| Total | 0 | 0.0% |
Transportation & Commute in Zapata Ranch
Vehicle Availability by Sex in Zapata Ranch
The most prevalent vehicle ownership categories in Zapata Ranch are males with 3 vehicles (99, accounting for 60.0%) and females with 3 vehicles (15, making up 412.5%).
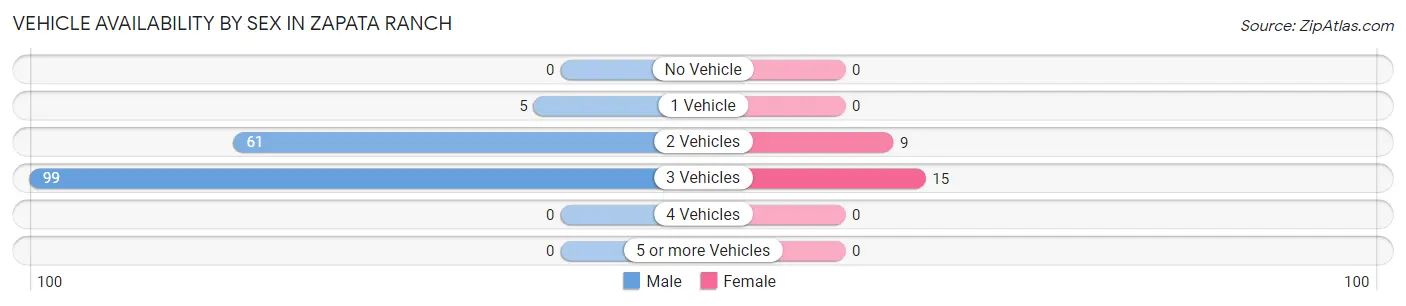
| Vehicles Available | Male | Female |
| No Vehicle | 0 (0.0%) | 0 (0.0%) |
| 1 Vehicle | 5 (3.0%) | 0 (0.0%) |
| 2 Vehicles | 61 (37.0%) | 9 (37.5%) |
| 3 Vehicles | 99 (60.0%) | 15 (62.5%) |
| 4 Vehicles | 0 (0.0%) | 0 (0.0%) |
| 5 or more Vehicles | 0 (0.0%) | 0 (0.0%) |
| Total | 165 (100.0%) | 24 (100.0%) |
Commute Time in Zapata Ranch
The most frequently occuring commute durations in Zapata Ranch are 45 to 59 minutes (99 commuters, 55.0%), 30 to 34 minutes (49 commuters, 27.2%), and 20 to 24 minutes (15 commuters, 8.3%).
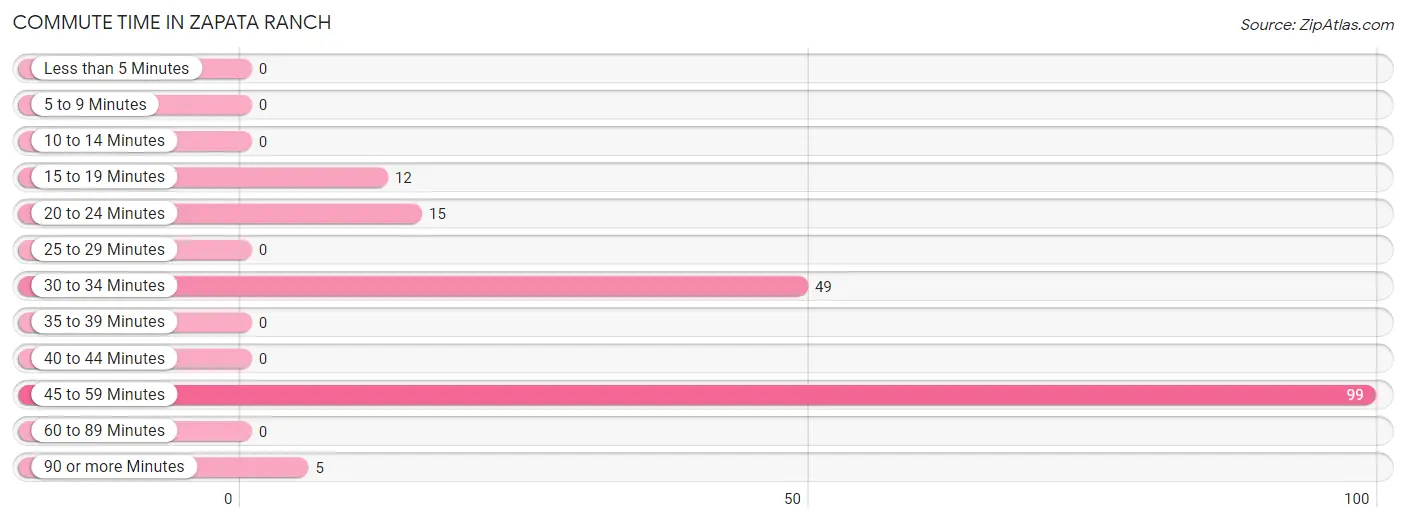
| Commute Time | # Commuters | % Commuters |
| Less than 5 Minutes | 0 | 0.0% |
| 5 to 9 Minutes | 0 | 0.0% |
| 10 to 14 Minutes | 0 | 0.0% |
| 15 to 19 Minutes | 12 | 6.7% |
| 20 to 24 Minutes | 15 | 8.3% |
| 25 to 29 Minutes | 0 | 0.0% |
| 30 to 34 Minutes | 49 | 27.2% |
| 35 to 39 Minutes | 0 | 0.0% |
| 40 to 44 Minutes | 0 | 0.0% |
| 45 to 59 Minutes | 99 | 55.0% |
| 60 to 89 Minutes | 0 | 0.0% |
| 90 or more Minutes | 5 | 2.8% |
Commute Time by Sex in Zapata Ranch
The most common commute times in Zapata Ranch are 45 to 59 minutes (99 commuters, 60.0%) for males and 20 to 24 minutes (15 commuters, 100.0%) for females.
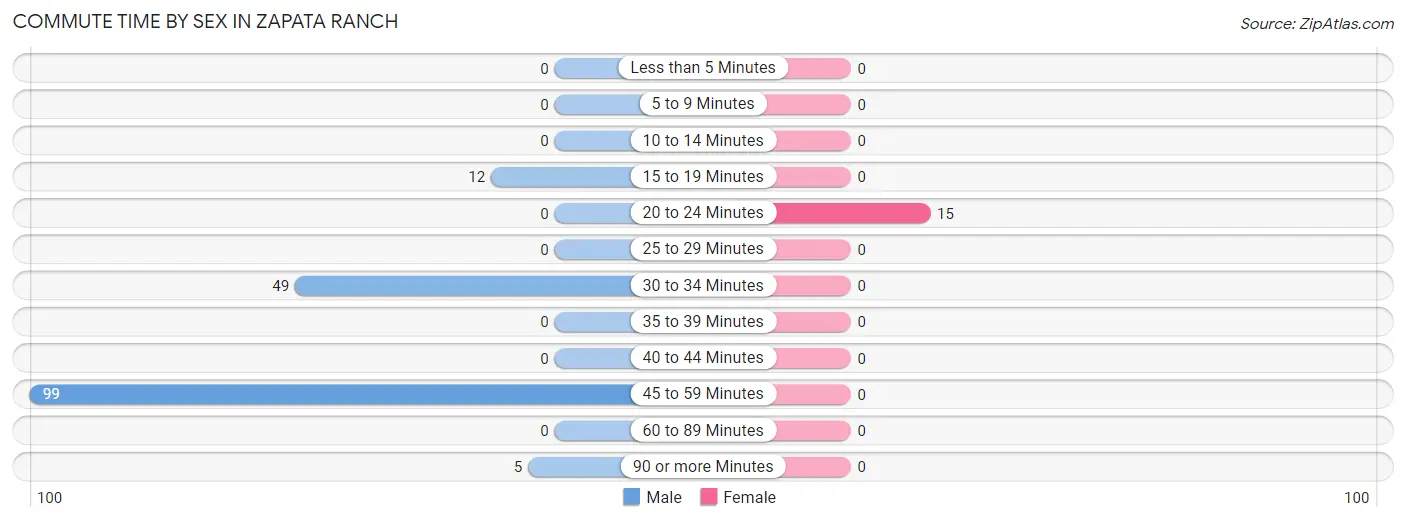
| Commute Time | Male | Female |
| Less than 5 Minutes | 0 (0.0%) | 0 (0.0%) |
| 5 to 9 Minutes | 0 (0.0%) | 0 (0.0%) |
| 10 to 14 Minutes | 0 (0.0%) | 0 (0.0%) |
| 15 to 19 Minutes | 12 (7.3%) | 0 (0.0%) |
| 20 to 24 Minutes | 0 (0.0%) | 15 (100.0%) |
| 25 to 29 Minutes | 0 (0.0%) | 0 (0.0%) |
| 30 to 34 Minutes | 49 (29.7%) | 0 (0.0%) |
| 35 to 39 Minutes | 0 (0.0%) | 0 (0.0%) |
| 40 to 44 Minutes | 0 (0.0%) | 0 (0.0%) |
| 45 to 59 Minutes | 99 (60.0%) | 0 (0.0%) |
| 60 to 89 Minutes | 0 (0.0%) | 0 (0.0%) |
| 90 or more Minutes | 5 (3.0%) | 0 (0.0%) |
Time of Departure to Work by Sex in Zapata Ranch
The most frequent times of departure to work in Zapata Ranch are 5:00 AM to 5:29 AM (99, 60.0%) for males and 7:30 AM to 7:59 AM (15, 100.0%) for females.
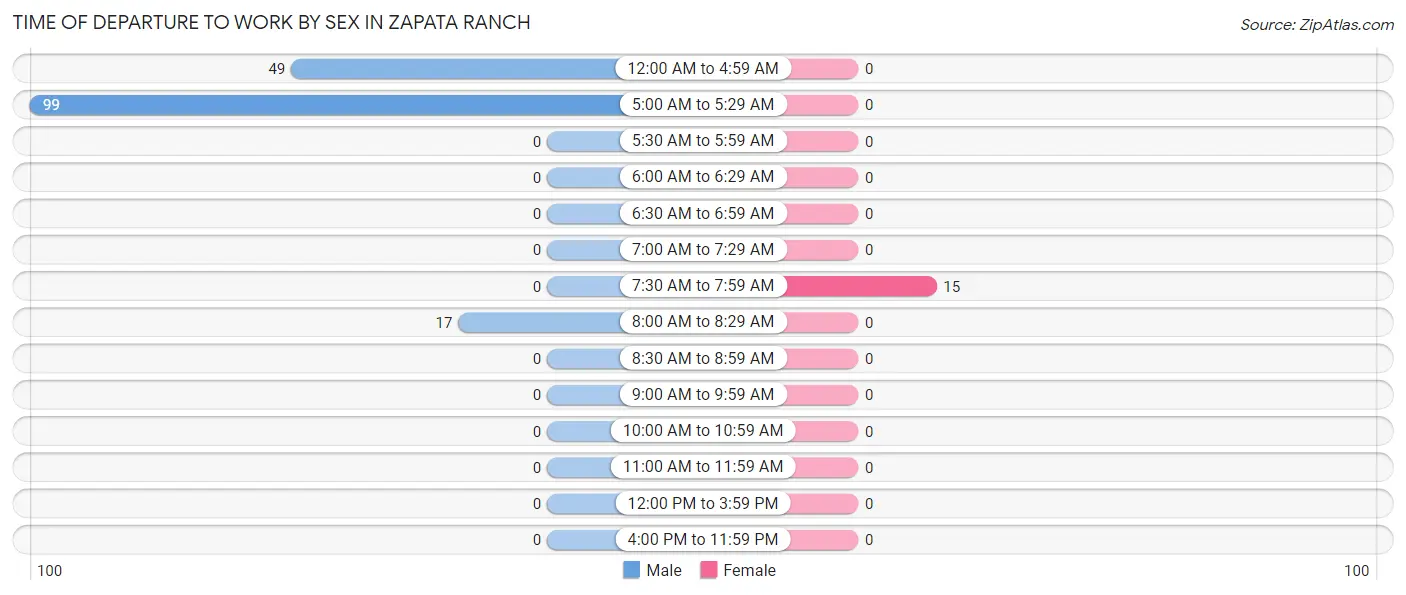
| Time of Departure | Male | Female |
| 12:00 AM to 4:59 AM | 49 (29.7%) | 0 (0.0%) |
| 5:00 AM to 5:29 AM | 99 (60.0%) | 0 (0.0%) |
| 5:30 AM to 5:59 AM | 0 (0.0%) | 0 (0.0%) |
| 6:00 AM to 6:29 AM | 0 (0.0%) | 0 (0.0%) |
| 6:30 AM to 6:59 AM | 0 (0.0%) | 0 (0.0%) |
| 7:00 AM to 7:29 AM | 0 (0.0%) | 0 (0.0%) |
| 7:30 AM to 7:59 AM | 0 (0.0%) | 15 (100.0%) |
| 8:00 AM to 8:29 AM | 17 (10.3%) | 0 (0.0%) |
| 8:30 AM to 8:59 AM | 0 (0.0%) | 0 (0.0%) |
| 9:00 AM to 9:59 AM | 0 (0.0%) | 0 (0.0%) |
| 10:00 AM to 10:59 AM | 0 (0.0%) | 0 (0.0%) |
| 11:00 AM to 11:59 AM | 0 (0.0%) | 0 (0.0%) |
| 12:00 PM to 3:59 PM | 0 (0.0%) | 0 (0.0%) |
| 4:00 PM to 11:59 PM | 0 (0.0%) | 0 (0.0%) |
| Total | 165 (100.0%) | 15 (100.0%) |
Housing Occupancy in Zapata Ranch
Occupancy by Ownership in Zapata Ranch
Of the total 78 dwellings in Zapata Ranch, owner-occupied units account for 73 (93.6%), while renter-occupied units make up 5 (6.4%).
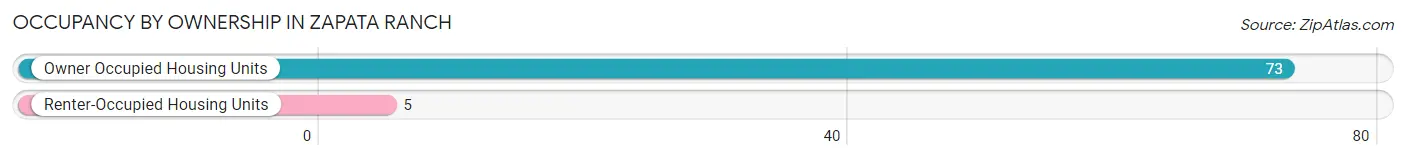
| Occupancy | # Housing Units | % Housing Units |
| Owner Occupied Housing Units | 73 | 93.6% |
| Renter-Occupied Housing Units | 5 | 6.4% |
| Total Occupied Housing Units | 78 | 100.0% |
Occupancy by Household Size in Zapata Ranch
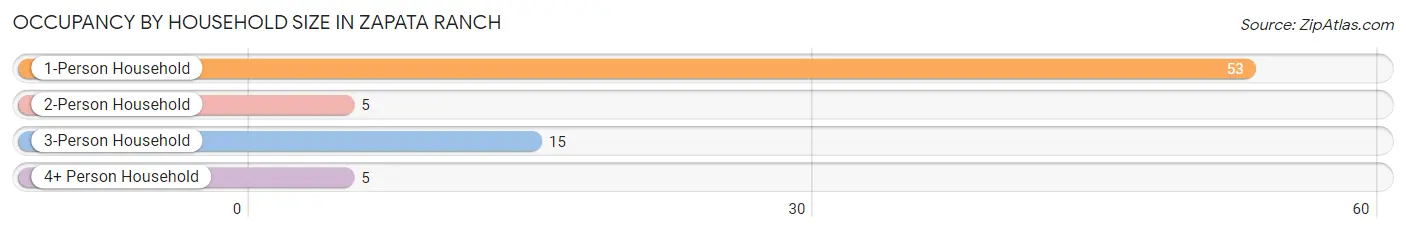
| Household Size | # Housing Units | % Housing Units |
| 1-Person Household | 53 | 67.9% |
| 2-Person Household | 5 | 6.4% |
| 3-Person Household | 15 | 19.2% |
| 4+ Person Household | 5 | 6.4% |
| Total Housing Units | 78 | 100.0% |
Occupancy by Ownership by Household Size in Zapata Ranch
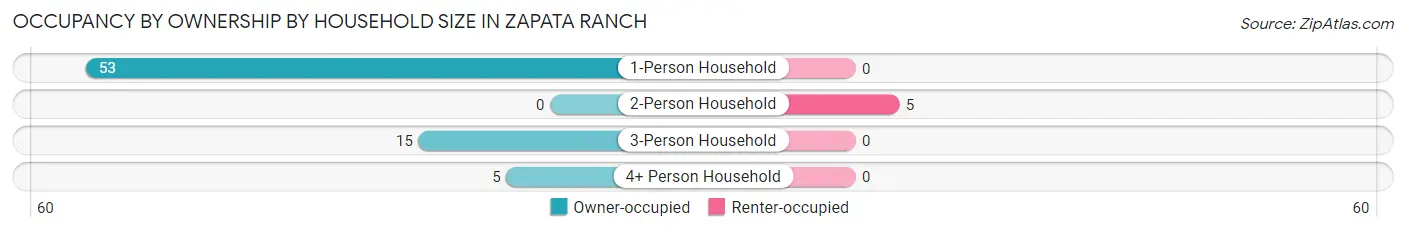
| Household Size | Owner-occupied | Renter-occupied |
| 1-Person Household | 53 (100.0%) | 0 (0.0%) |
| 2-Person Household | 0 (0.0%) | 5 (100.0%) |
| 3-Person Household | 15 (100.0%) | 0 (0.0%) |
| 4+ Person Household | 5 (100.0%) | 0 (0.0%) |
| Total Housing Units | 73 (93.6%) | 5 (6.4%) |
Occupancy by Educational Attainment in Zapata Ranch
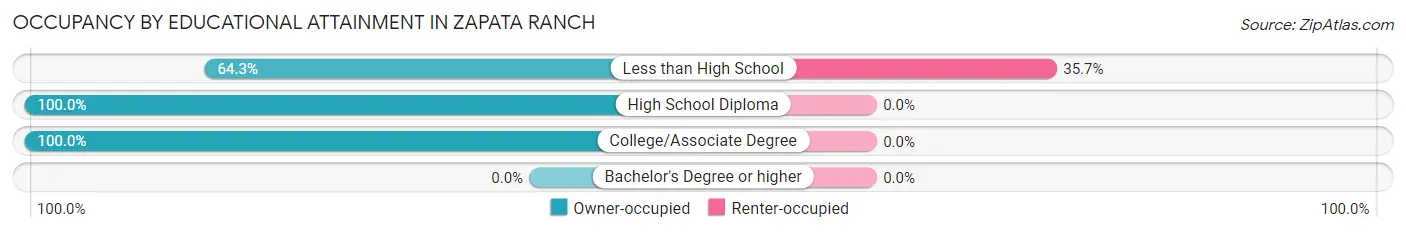
| Household Size | Owner-occupied | Renter-occupied |
| Less than High School | 9 (64.3%) | 5 (35.7%) |
| High School Diploma | 15 (100.0%) | 0 (0.0%) |
| College/Associate Degree | 49 (100.0%) | 0 (0.0%) |
| Bachelor's Degree or higher | 0 (0.0%) | 0 (0.0%) |
Occupancy by Age of Householder in Zapata Ranch
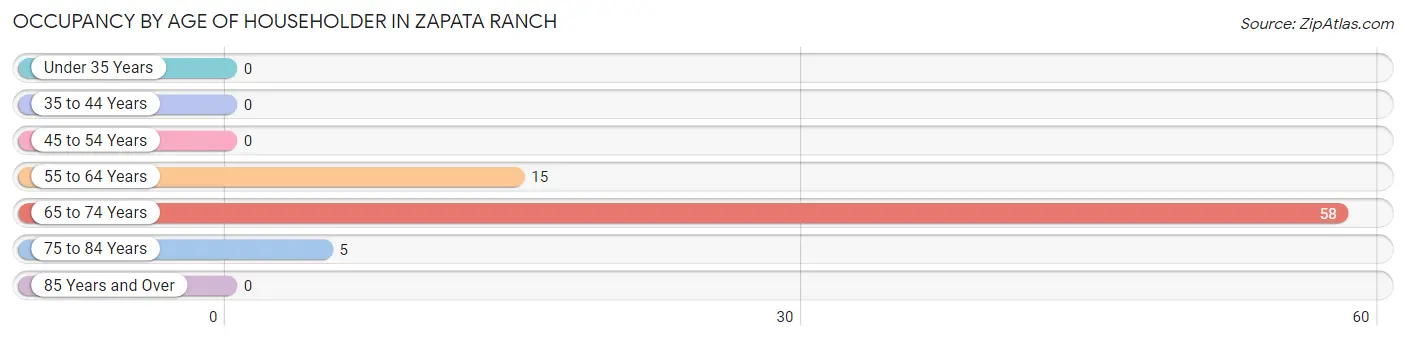
| Age Bracket | # Households | % Households |
| Under 35 Years | 0 | 0.0% |
| 35 to 44 Years | 0 | 0.0% |
| 45 to 54 Years | 0 | 0.0% |
| 55 to 64 Years | 15 | 19.2% |
| 65 to 74 Years | 58 | 74.4% |
| 75 to 84 Years | 5 | 6.4% |
| 85 Years and Over | 0 | 0.0% |
| Total | 78 | 100.0% |
Housing Finances in Zapata Ranch
Median Income by Occupancy in Zapata Ranch
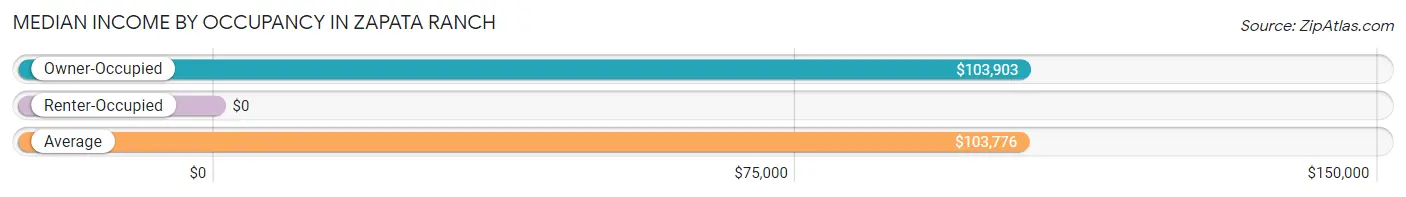
| Occupancy Type | # Households | Median Income |
| Owner-Occupied | 73 (93.6%) | $103,903 |
| Renter-Occupied | 5 (6.4%) | $0 |
| Average | 78 (100.0%) | $103,776 |
Occupancy by Householder Income Bracket in Zapata Ranch
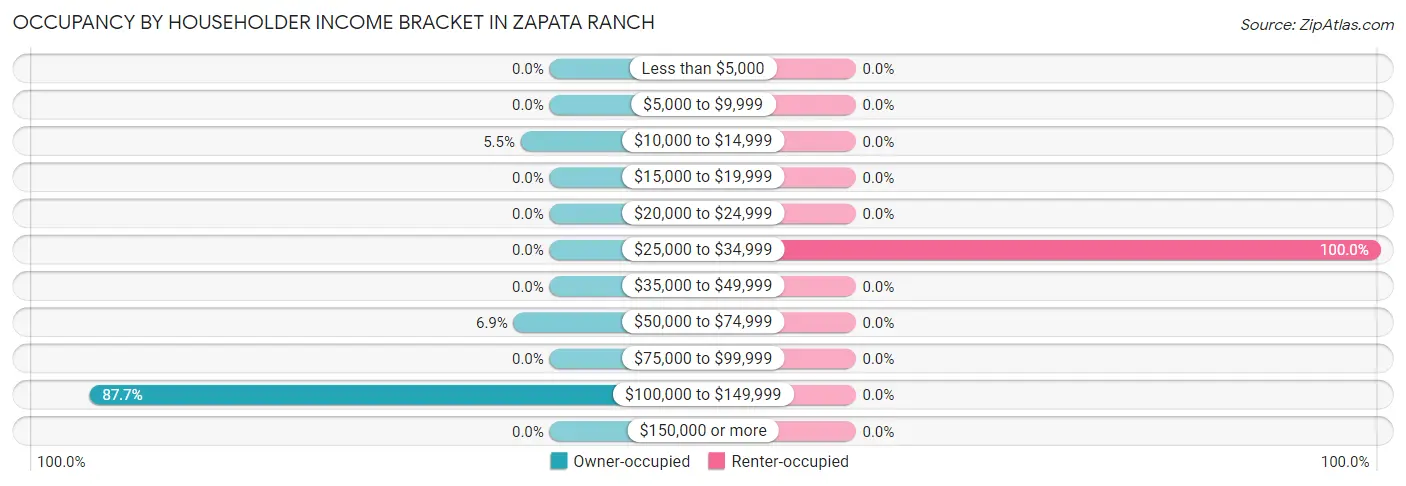
| Income Bracket | Owner-occupied | Renter-occupied |
| Less than $5,000 | 0 (0.0%) | 0 (0.0%) |
| $5,000 to $9,999 | 0 (0.0%) | 0 (0.0%) |
| $10,000 to $14,999 | 4 (5.5%) | 0 (0.0%) |
| $15,000 to $19,999 | 0 (0.0%) | 0 (0.0%) |
| $20,000 to $24,999 | 0 (0.0%) | 0 (0.0%) |
| $25,000 to $34,999 | 0 (0.0%) | 5 (100.0%) |
| $35,000 to $49,999 | 0 (0.0%) | 0 (0.0%) |
| $50,000 to $74,999 | 5 (6.9%) | 0 (0.0%) |
| $75,000 to $99,999 | 0 (0.0%) | 0 (0.0%) |
| $100,000 to $149,999 | 64 (87.7%) | 0 (0.0%) |
| $150,000 or more | 0 (0.0%) | 0 (0.0%) |
| Total | 73 (100.0%) | 5 (100.0%) |
Monthly Housing Cost Tiers in Zapata Ranch
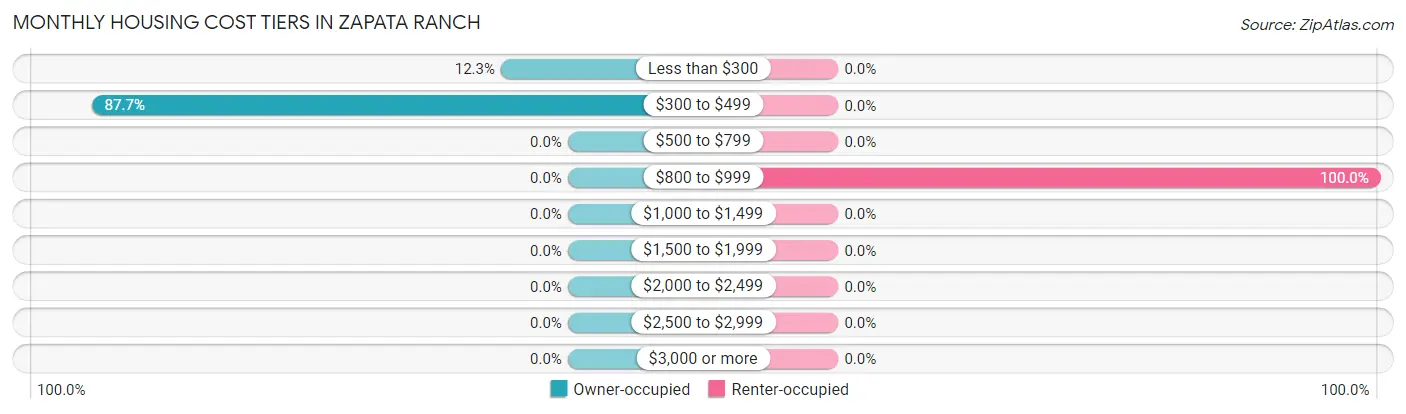
| Monthly Cost | Owner-occupied | Renter-occupied |
| Less than $300 | 9 (12.3%) | 0 (0.0%) |
| $300 to $499 | 64 (87.7%) | 0 (0.0%) |
| $500 to $799 | 0 (0.0%) | 0 (0.0%) |
| $800 to $999 | 0 (0.0%) | 5 (100.0%) |
| $1,000 to $1,499 | 0 (0.0%) | 0 (0.0%) |
| $1,500 to $1,999 | 0 (0.0%) | 0 (0.0%) |
| $2,000 to $2,499 | 0 (0.0%) | 0 (0.0%) |
| $2,500 to $2,999 | 0 (0.0%) | 0 (0.0%) |
| $3,000 or more | 0 (0.0%) | 0 (0.0%) |
| Total | 73 (100.0%) | 5 (100.0%) |
Physical Housing Characteristics in Zapata Ranch
Housing Structures in Zapata Ranch
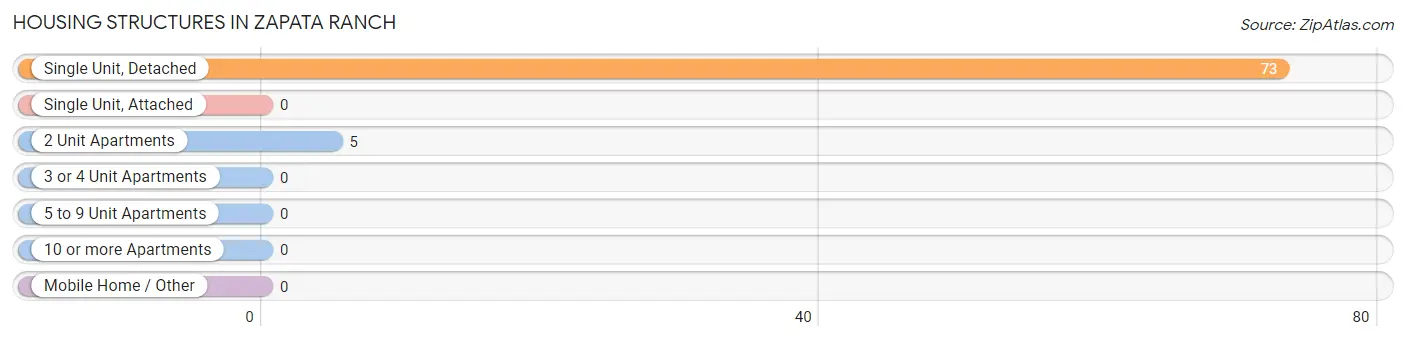
| Structure Type | # Housing Units | % Housing Units |
| Single Unit, Detached | 73 | 93.6% |
| Single Unit, Attached | 0 | 0.0% |
| 2 Unit Apartments | 5 | 6.4% |
| 3 or 4 Unit Apartments | 0 | 0.0% |
| 5 to 9 Unit Apartments | 0 | 0.0% |
| 10 or more Apartments | 0 | 0.0% |
| Mobile Home / Other | 0 | 0.0% |
| Total | 78 | 100.0% |
Housing Structures by Occupancy in Zapata Ranch
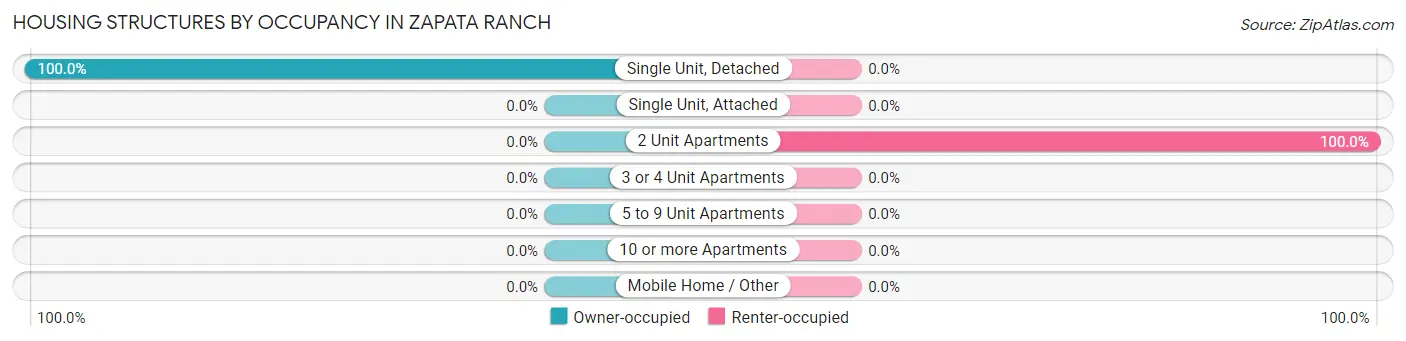
| Structure Type | Owner-occupied | Renter-occupied |
| Single Unit, Detached | 73 (100.0%) | 0 (0.0%) |
| Single Unit, Attached | 0 (0.0%) | 0 (0.0%) |
| 2 Unit Apartments | 0 (0.0%) | 5 (100.0%) |
| 3 or 4 Unit Apartments | 0 (0.0%) | 0 (0.0%) |
| 5 to 9 Unit Apartments | 0 (0.0%) | 0 (0.0%) |
| 10 or more Apartments | 0 (0.0%) | 0 (0.0%) |
| Mobile Home / Other | 0 (0.0%) | 0 (0.0%) |
| Total | 73 (93.6%) | 5 (6.4%) |
Housing Structures by Number of Rooms in Zapata Ranch
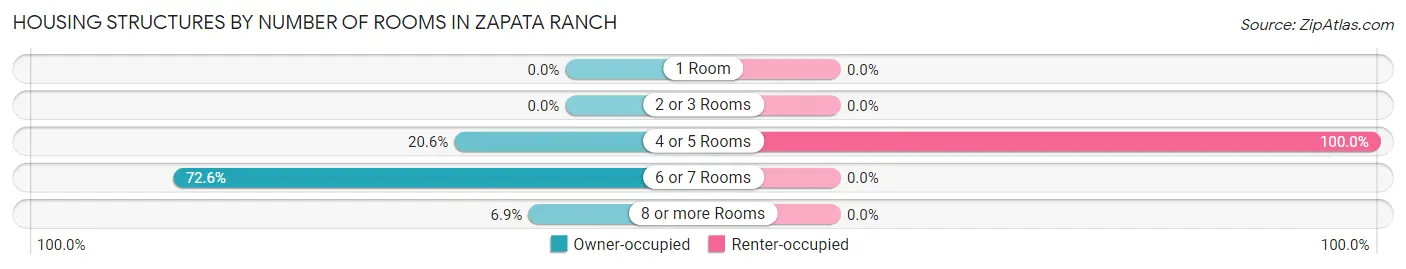
| Number of Rooms | Owner-occupied | Renter-occupied |
| 1 Room | 0 (0.0%) | 0 (0.0%) |
| 2 or 3 Rooms | 0 (0.0%) | 0 (0.0%) |
| 4 or 5 Rooms | 15 (20.5%) | 5 (100.0%) |
| 6 or 7 Rooms | 53 (72.6%) | 0 (0.0%) |
| 8 or more Rooms | 5 (6.9%) | 0 (0.0%) |
| Total | 73 (100.0%) | 5 (100.0%) |
Housing Structure by Heating Type in Zapata Ranch
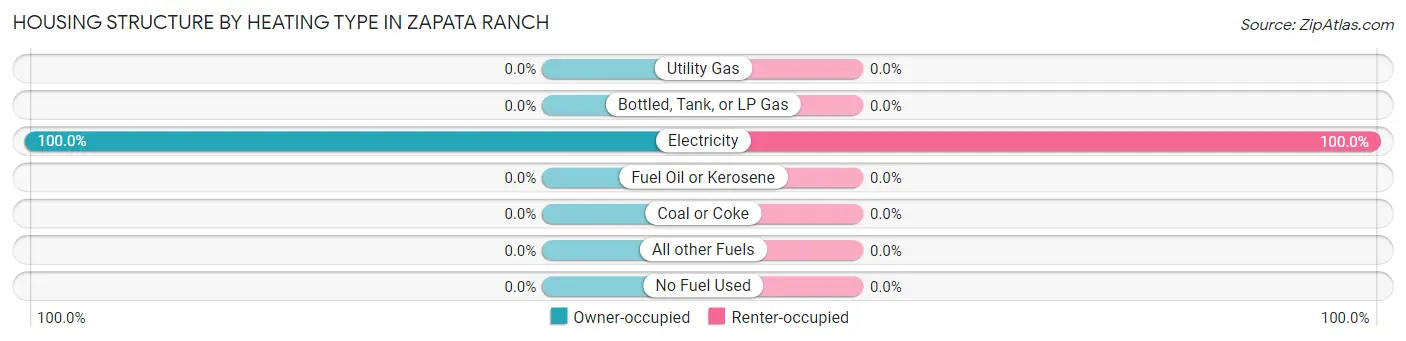
| Heating Type | Owner-occupied | Renter-occupied |
| Utility Gas | 0 (0.0%) | 0 (0.0%) |
| Bottled, Tank, or LP Gas | 0 (0.0%) | 0 (0.0%) |
| Electricity | 73 (100.0%) | 5 (100.0%) |
| Fuel Oil or Kerosene | 0 (0.0%) | 0 (0.0%) |
| Coal or Coke | 0 (0.0%) | 0 (0.0%) |
| All other Fuels | 0 (0.0%) | 0 (0.0%) |
| No Fuel Used | 0 (0.0%) | 0 (0.0%) |
| Total | 73 (100.0%) | 5 (100.0%) |
Household Vehicle Usage in Zapata Ranch
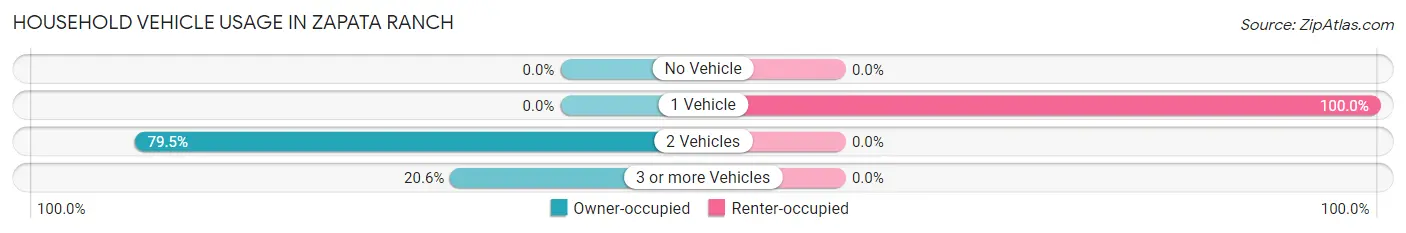
| Vehicles per Household | Owner-occupied | Renter-occupied |
| No Vehicle | 0 (0.0%) | 0 (0.0%) |
| 1 Vehicle | 0 (0.0%) | 5 (100.0%) |
| 2 Vehicles | 58 (79.4%) | 0 (0.0%) |
| 3 or more Vehicles | 15 (20.5%) | 0 (0.0%) |
| Total | 73 (100.0%) | 5 (100.0%) |
Real Estate & Mortgages in Zapata Ranch
Real Estate and Mortgage Overview in Zapata Ranch
| Characteristic | Without Mortgage | With Mortgage |
| Housing Units | 73 | 0 |
| Median Property Value | $65,600 | $0 |
| Median Household Income | $103,903 | $0 |
| Monthly Housing Costs | $321 | $0 |
| Real Estate Taxes | - | - |
Property Value by Mortgage Status in Zapata Ranch
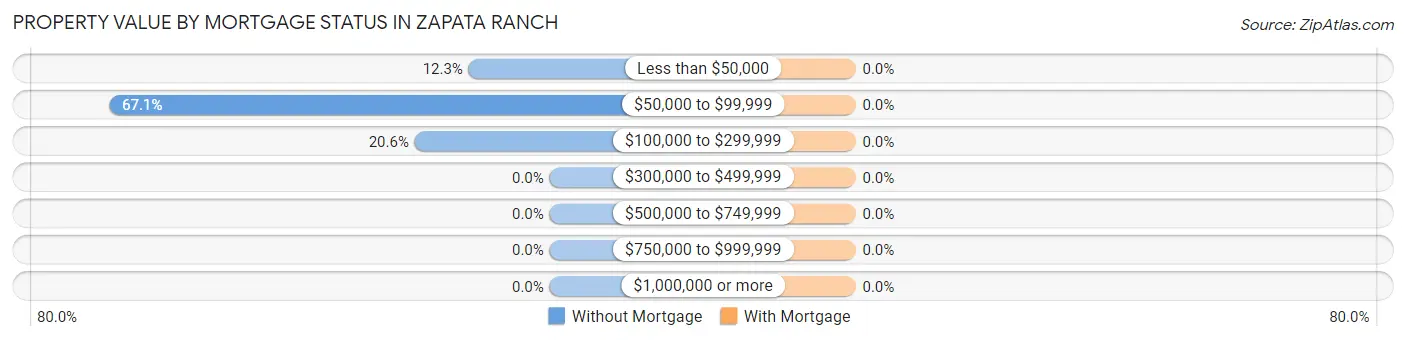
| Property Value | Without Mortgage | With Mortgage |
| Less than $50,000 | 9 (12.3%) | 0 (0.0%) |
| $50,000 to $99,999 | 49 (67.1%) | 0 (0.0%) |
| $100,000 to $299,999 | 15 (20.5%) | 0 (0.0%) |
| $300,000 to $499,999 | 0 (0.0%) | 0 (0.0%) |
| $500,000 to $749,999 | 0 (0.0%) | 0 (0.0%) |
| $750,000 to $999,999 | 0 (0.0%) | 0 (0.0%) |
| $1,000,000 or more | 0 (0.0%) | 0 (0.0%) |
| Total | 73 (100.0%) | 0 (0.0%) |
Household Income by Mortgage Status in Zapata Ranch
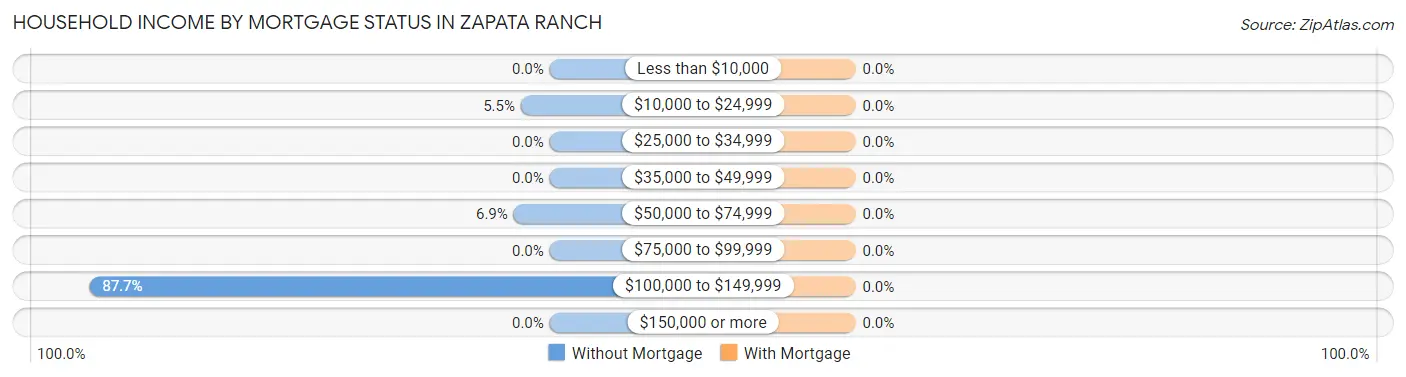
| Household Income | Without Mortgage | With Mortgage |
| Less than $10,000 | 0 (0.0%) | 0 (0.0%) |
| $10,000 to $24,999 | 4 (5.5%) | 0 (0.0%) |
| $25,000 to $34,999 | 0 (0.0%) | 0 (0.0%) |
| $35,000 to $49,999 | 0 (0.0%) | 0 (0.0%) |
| $50,000 to $74,999 | 5 (6.9%) | 0 (0.0%) |
| $75,000 to $99,999 | 0 (0.0%) | 0 (0.0%) |
| $100,000 to $149,999 | 64 (87.7%) | 0 (0.0%) |
| $150,000 or more | 0 (0.0%) | 0 (0.0%) |
| Total | 73 (100.0%) | 0 (0.0%) |
Property Value to Household Income Ratio in Zapata Ranch
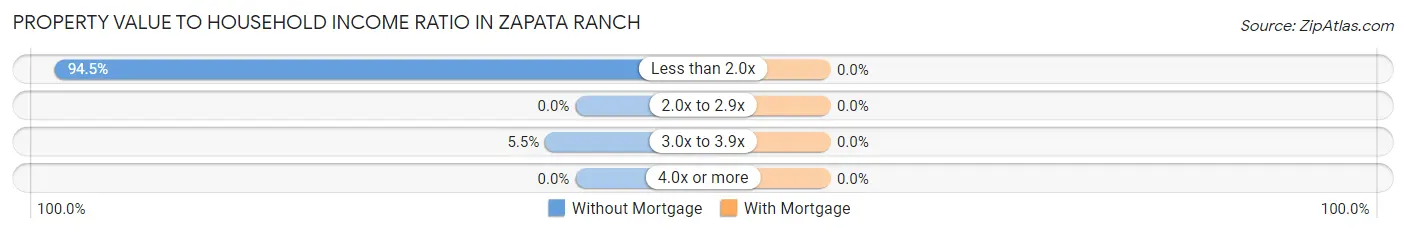
| Value-to-Income Ratio | Without Mortgage | With Mortgage |
| Less than 2.0x | 69 (94.5%) | 0 (0.0%) |
| 2.0x to 2.9x | 0 (0.0%) | 0 (0.0%) |
| 3.0x to 3.9x | 4 (5.5%) | 0 (0.0%) |
| 4.0x or more | 0 (0.0%) | 0 (0.0%) |
| Total | 73 (100.0%) | 0 (0.0%) |
Real Estate Taxes by Mortgage Status in Zapata Ranch
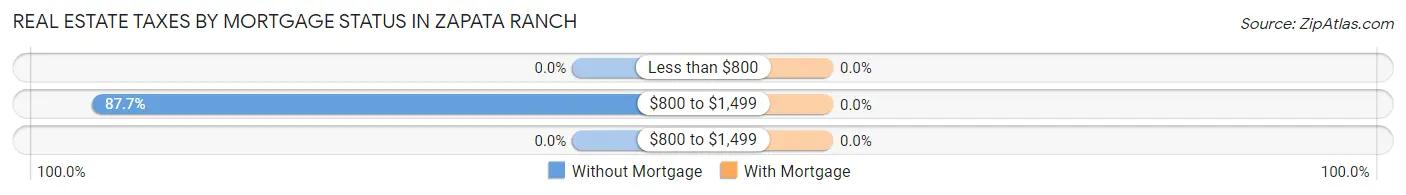
| Property Taxes | Without Mortgage | With Mortgage |
| Less than $800 | 0 (0.0%) | 0 (0.0%) |
| $800 to $1,499 | 64 (87.7%) | 0 (0.0%) |
| $800 to $1,499 | 0 (0.0%) | 0 (0.0%) |
| Total | 73 (100.0%) | 0 (0.0%) |
Health & Disability in Zapata Ranch
Health Insurance Coverage by Age in Zapata Ranch
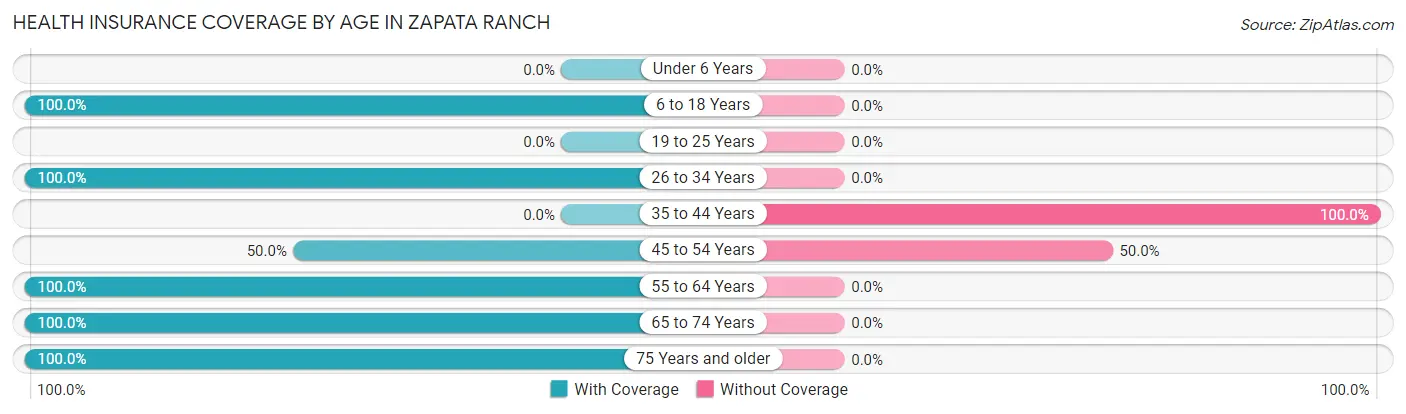
| Age Bracket | With Coverage | Without Coverage |
| Under 6 Years | 0 (0.0%) | 0 (0.0%) |
| 6 to 18 Years | 28 (100.0%) | 0 (0.0%) |
| 19 to 25 Years | 0 (0.0%) | 0 (0.0%) |
| 26 to 34 Years | 9 (100.0%) | 0 (0.0%) |
| 35 to 44 Years | 0 (0.0%) | 99 (100.0%) |
| 45 to 54 Years | 12 (50.0%) | 12 (50.0%) |
| 55 to 64 Years | 15 (100.0%) | 0 (0.0%) |
| 65 to 74 Years | 66 (100.0%) | 0 (0.0%) |
| 75 Years and older | 5 (100.0%) | 0 (0.0%) |
| Total | 135 (54.9%) | 111 (45.1%) |
Health Insurance Coverage by Citizenship Status in Zapata Ranch
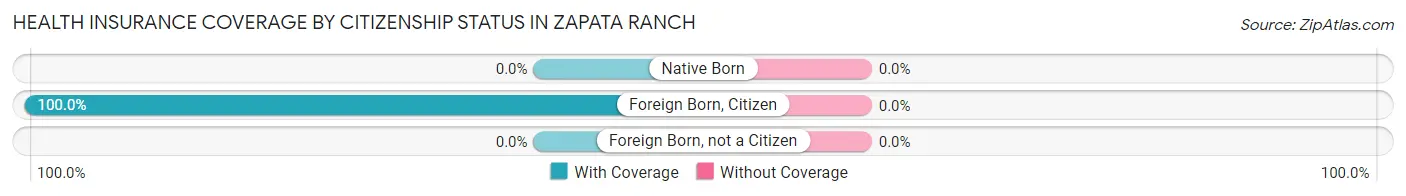
| Citizenship Status | With Coverage | Without Coverage |
| Native Born | 0 (0.0%) | 0 (0.0%) |
| Foreign Born, Citizen | 28 (100.0%) | 0 (0.0%) |
| Foreign Born, not a Citizen | 0 (0.0%) | 0 (0.0%) |
Health Insurance Coverage by Household Income in Zapata Ranch
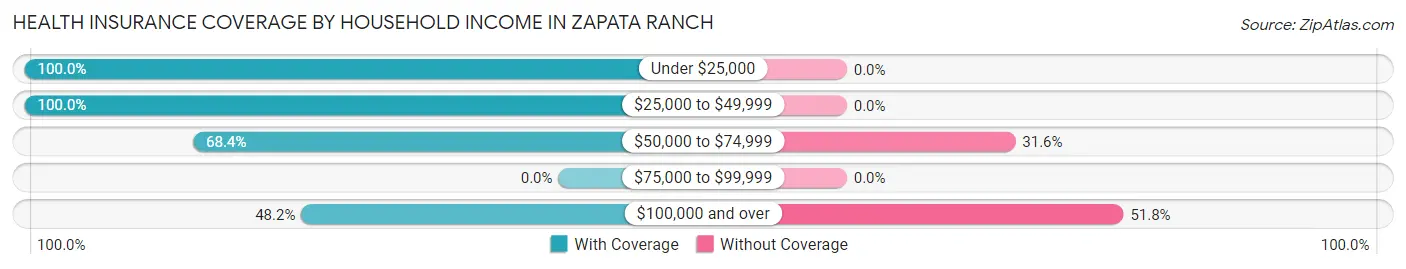
| Household Income | With Coverage | Without Coverage |
| Under $25,000 | 4 (100.0%) | 0 (0.0%) |
| $25,000 to $49,999 | 13 (100.0%) | 0 (0.0%) |
| $50,000 to $74,999 | 26 (68.4%) | 12 (31.6%) |
| $75,000 to $99,999 | 0 (0.0%) | 0 (0.0%) |
| $100,000 and over | 92 (48.2%) | 99 (51.8%) |
Public vs Private Health Insurance Coverage by Age in Zapata Ranch
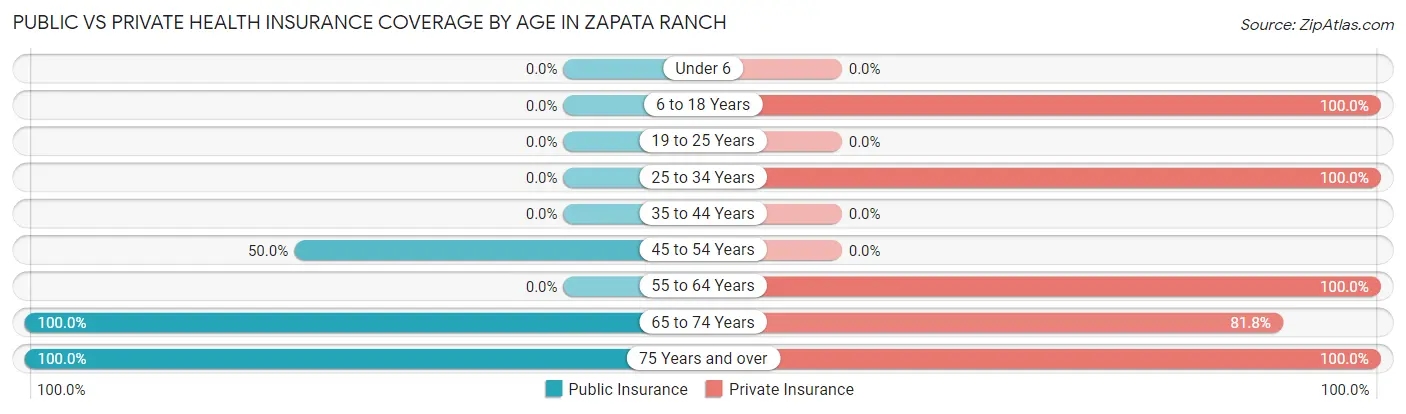
| Age Bracket | Public Insurance | Private Insurance |
| Under 6 | 0 (0.0%) | 0 (0.0%) |
| 6 to 18 Years | 0 (0.0%) | 28 (100.0%) |
| 19 to 25 Years | 0 (0.0%) | 0 (0.0%) |
| 25 to 34 Years | 0 (0.0%) | 9 (100.0%) |
| 35 to 44 Years | 0 (0.0%) | 0 (0.0%) |
| 45 to 54 Years | 12 (50.0%) | 0 (0.0%) |
| 55 to 64 Years | 0 (0.0%) | 15 (100.0%) |
| 65 to 74 Years | 66 (100.0%) | 54 (81.8%) |
| 75 Years and over | 5 (100.0%) | 5 (100.0%) |
| Total | 83 (33.7%) | 111 (45.1%) |
Disability Status by Sex by Age in Zapata Ranch
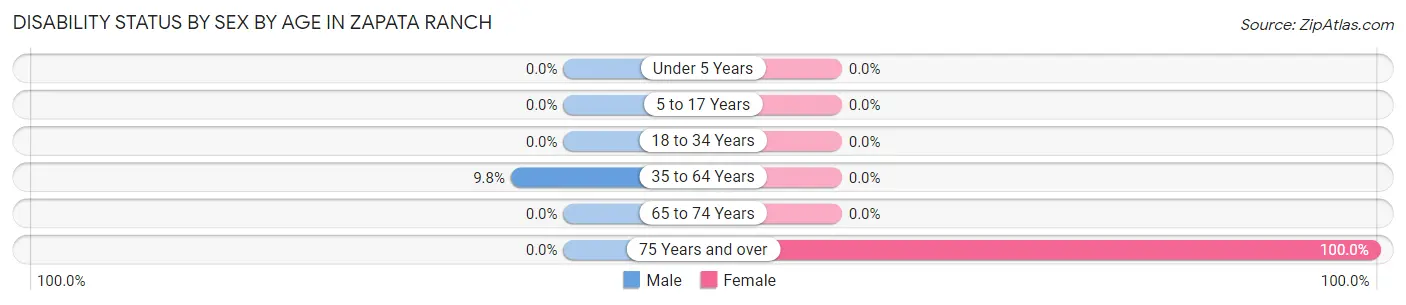
| Age Bracket | Male | Female |
| Under 5 Years | 0 (0.0%) | 0 (0.0%) |
| 5 to 17 Years | 0 (0.0%) | 0 (0.0%) |
| 18 to 34 Years | 0 (0.0%) | 0 (0.0%) |
| 35 to 64 Years | 12 (9.8%) | 0 (0.0%) |
| 65 to 74 Years | 0 (0.0%) | 0 (0.0%) |
| 75 Years and over | 0 (0.0%) | 5 (100.0%) |
Disability Class by Sex by Age in Zapata Ranch
Disability Class: Hearing Difficulty
| Age Bracket | Male | Female |
| Under 5 Years | 0 (0.0%) | 0 (0.0%) |
| 5 to 17 Years | 0 (0.0%) | 0 (0.0%) |
| 18 to 34 Years | 0 (0.0%) | 0 (0.0%) |
| 35 to 64 Years | 0 (0.0%) | 0 (0.0%) |
| 65 to 74 Years | 0 (0.0%) | 0 (0.0%) |
| 75 Years and over | 0 (0.0%) | 0 (0.0%) |
Disability Class: Vision Difficulty
| Age Bracket | Male | Female |
| Under 5 Years | 0 (0.0%) | 0 (0.0%) |
| 5 to 17 Years | 0 (0.0%) | 0 (0.0%) |
| 18 to 34 Years | 0 (0.0%) | 0 (0.0%) |
| 35 to 64 Years | 0 (0.0%) | 0 (0.0%) |
| 65 to 74 Years | 0 (0.0%) | 0 (0.0%) |
| 75 Years and over | 0 (0.0%) | 0 (0.0%) |
Disability Class: Cognitive Difficulty
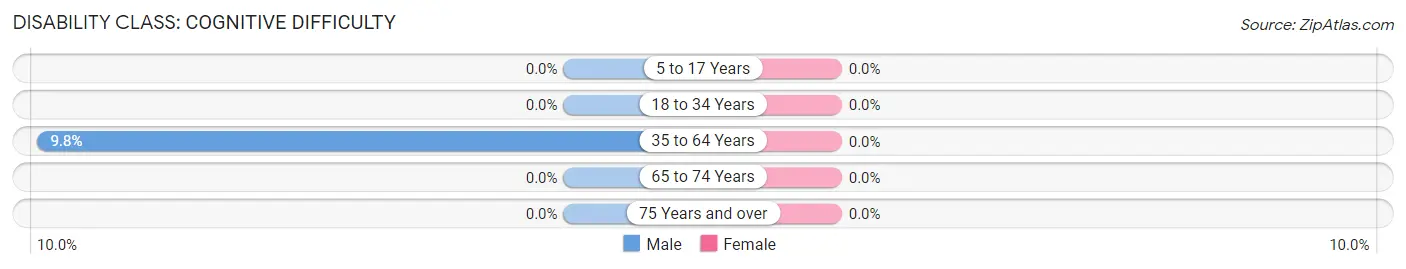
| Age Bracket | Male | Female |
| 5 to 17 Years | 0 (0.0%) | 0 (0.0%) |
| 18 to 34 Years | 0 (0.0%) | 0 (0.0%) |
| 35 to 64 Years | 12 (9.8%) | 0 (0.0%) |
| 65 to 74 Years | 0 (0.0%) | 0 (0.0%) |
| 75 Years and over | 0 (0.0%) | 0 (0.0%) |
Disability Class: Ambulatory Difficulty
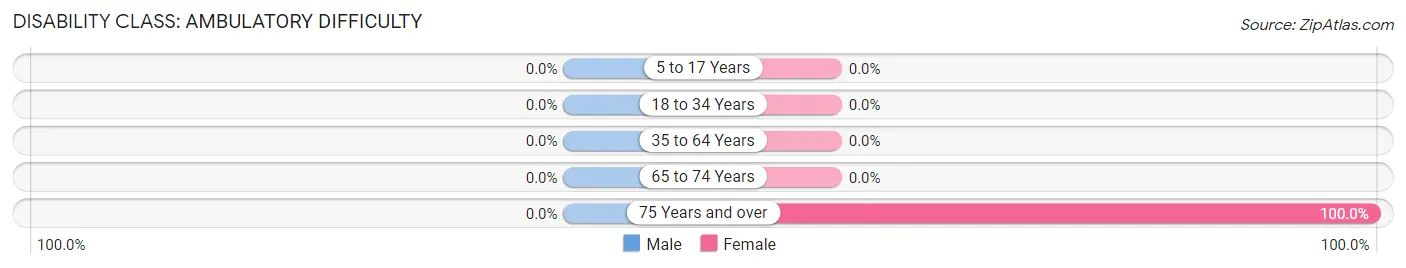
| Age Bracket | Male | Female |
| 5 to 17 Years | 0 (0.0%) | 0 (0.0%) |
| 18 to 34 Years | 0 (0.0%) | 0 (0.0%) |
| 35 to 64 Years | 0 (0.0%) | 0 (0.0%) |
| 65 to 74 Years | 0 (0.0%) | 0 (0.0%) |
| 75 Years and over | 0 (0.0%) | 5 (100.0%) |
Disability Class: Self-Care Difficulty
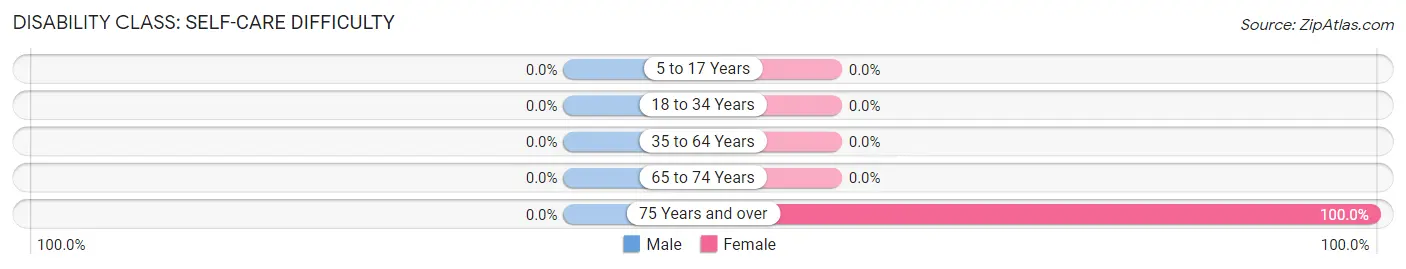
| Age Bracket | Male | Female |
| 5 to 17 Years | 0 (0.0%) | 0 (0.0%) |
| 18 to 34 Years | 0 (0.0%) | 0 (0.0%) |
| 35 to 64 Years | 0 (0.0%) | 0 (0.0%) |
| 65 to 74 Years | 0 (0.0%) | 0 (0.0%) |
| 75 Years and over | 0 (0.0%) | 5 (100.0%) |
Technology Access in Zapata Ranch
Computing Device Access in Zapata Ranch
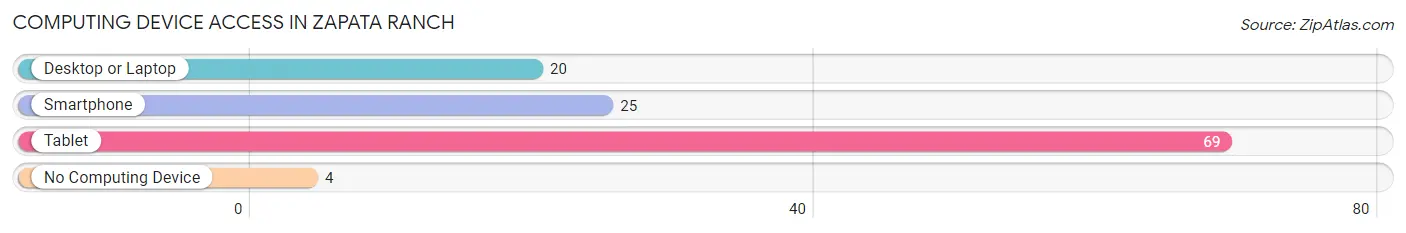
| Device Type | # Households | % Households |
| Desktop or Laptop | 20 | 25.6% |
| Smartphone | 25 | 32.1% |
| Tablet | 69 | 88.5% |
| No Computing Device | 4 | 5.1% |
| Total | 78 | 100.0% |
Internet Access in Zapata Ranch
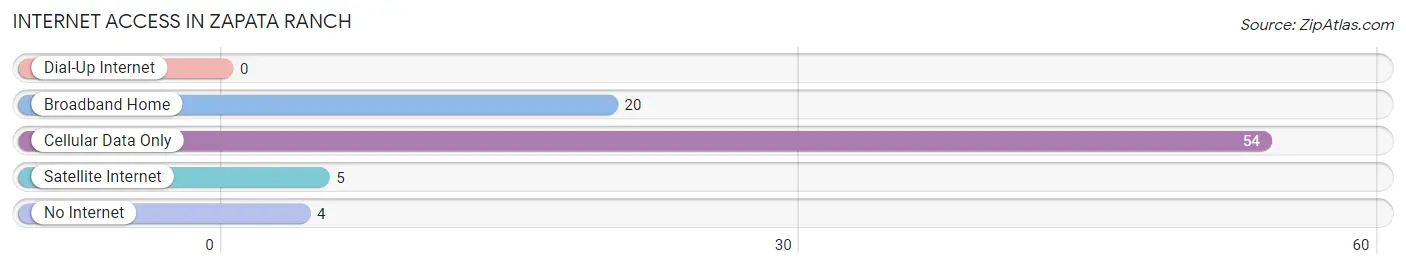
| Internet Type | # Households | % Households |
| Dial-Up Internet | 0 | 0.0% |
| Broadband Home | 20 | 25.6% |
| Cellular Data Only | 54 | 69.2% |
| Satellite Internet | 5 | 6.4% |
| No Internet | 4 | 5.1% |
| Total | 78 | 100.0% |
Zapata Ranch Summary
Zapata Ranch is a small unincorporated community located in Zapata County, Texas. It is situated on the banks of the Rio Grande, approximately 30 miles south of Laredo. The town is named after the famous Mexican revolutionary, Emiliano Zapata, and is home to a population of just over 1,000 people.
History
The area that is now Zapata Ranch was originally inhabited by the Coahuiltecan Indians. The first Europeans to settle in the area were Spanish missionaries in the late 1700s. The area was then part of the Mexican state of Coahuila y Tejas until 1836 when it became part of the Republic of Texas.
In 1848, the area was granted to the heirs of Don Jose Antonio Zapata, a Mexican revolutionary who fought alongside Emiliano Zapata. The Zapata family established a large ranch in the area and it became known as the Zapata Ranch.
In the late 1800s, the area was settled by a number of German and Czech immigrants. These immigrants established small farms and ranches in the area and the town of Zapata Ranch was established in 1891.
Geography
Zapata Ranch is located in the Rio Grande Valley of South Texas. The town is situated on the banks of the Rio Grande, approximately 30 miles south of Laredo. The area is characterized by flat terrain and is mostly covered in grasslands and shrublands. The climate is semi-arid with hot summers and mild winters.
Economy
The economy of Zapata Ranch is largely based on agriculture. The area is known for its production of cotton, sorghum, corn, and wheat. The town is also home to a number of small businesses, including restaurants, grocery stores, and gas stations.
Demographics
As of the 2010 census, the population of Zapata Ranch was 1,072. The racial makeup of the town was 94.3% White, 0.7% African American, 0.3% Native American, 0.2% Asian, and 4.5% from other races. The median household income was $25,972 and the median family income was $30,972.
Conclusion
Zapata Ranch is a small unincorporated community located in Zapata County, Texas. It is situated on the banks of the Rio Grande, approximately 30 miles south of Laredo. The town is named after the famous Mexican revolutionary, Emiliano Zapata, and is home to a population of just over 1,000 people. The economy of Zapata Ranch is largely based on agriculture and the town is also home to a number of small businesses. As of the 2010 census, the population of Zapata Ranch was 1,072. The racial makeup of the town was 94.3% White, 0.7% African American, 0.3% Native American, 0.2% Asian, and 4.5% from other races.
Common Questions
What is Per Capita Income in Zapata Ranch?
Per Capita income in Zapata Ranch is $40,941.
What is the Median Household income in Zapata Ranch?
Median Household Income in Zapata Ranch is $103,776.
What is Inequality or Gini Index in Zapata Ranch?
Inequality or Gini Index in Zapata Ranch is 0.15.
What is the Total Population of Zapata Ranch?
Total Population of Zapata Ranch is 246.
What is the Total Male Population of Zapata Ranch?
Total Male Population of Zapata Ranch is 181.
What is the Total Female Population of Zapata Ranch?
Total Female Population of Zapata Ranch is 65.
What is the Ratio of Males per 100 Females in Zapata Ranch?
There are 278.46 Males per 100 Females in Zapata Ranch.
What is the Ratio of Females per 100 Males in Zapata Ranch?
There are 35.91 Females per 100 Males in Zapata Ranch.
What is the Median Population Age in Zapata Ranch?
Median Population Age in Zapata Ranch is 39.9 Years.
What is the Average Family Size in Zapata Ranch
Average Family Size in Zapata Ranch is 7.7 People.
What is the Average Household Size in Zapata Ranch
Average Household Size in Zapata Ranch is 3.1 People.
How Large is the Labor Force in Zapata Ranch?
There are 189 People in the Labor Forcein in Zapata Ranch.
What is the Percentage of People in the Labor Force in Zapata Ranch?
76.8% of People are in the Labor Force in Zapata Ranch.