Rosser, TX Map & Demographics
Rosser Map
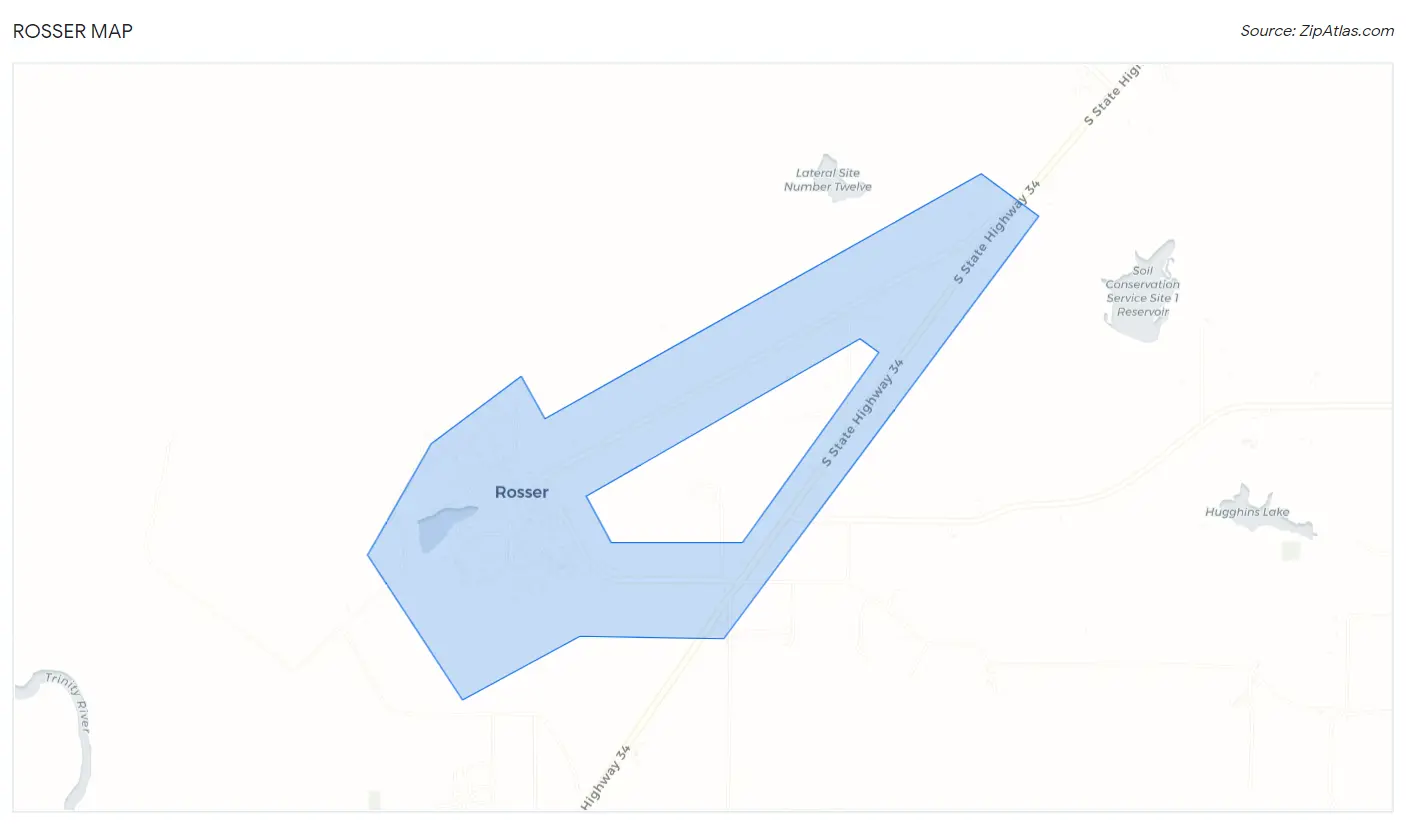
Rosser Overview
$29,163
PER CAPITA INCOME
$103,750
AVG FAMILY INCOME
$88,214
AVG HOUSEHOLD INCOME
19.8%
WAGE / INCOME GAP [ % ]
80.2¢/ $1
WAGE / INCOME GAP [ $ ]
0.43
INEQUALITY / GINI INDEX
437
TOTAL POPULATION
233
MALE POPULATION
204
FEMALE POPULATION
114.22
MALES / 100 FEMALES
87.55
FEMALES / 100 MALES
40.3
MEDIAN AGE
5.0
AVG FAMILY SIZE
3.5
AVG HOUSEHOLD SIZE
208
LABOR FORCE [ PEOPLE ]
65.2%
PERCENT IN LABOR FORCE
5.8%
UNEMPLOYMENT RATE
Rosser Zip Codes
Income in Rosser
Income Overview in Rosser
Per Capita Income in Rosser is $29,163, while median incomes of families and households are $103,750 and $88,214 respectively.
| Characteristic | Number | Measure |
| Per Capita Income | 437 | $29,163 |
| Median Family Income | 76 | $103,750 |
| Mean Family Income | 76 | $113,934 |
| Median Household Income | 124 | $88,214 |
| Mean Household Income | 124 | $80,723 |
| Income Deficit | 76 | $0 |
| Wage / Income Gap (%) | 437 | 19.82% |
| Wage / Income Gap ($) | 437 | 80.18¢ per $1 |
| Gini / Inequality Index | 437 | 0.43 |
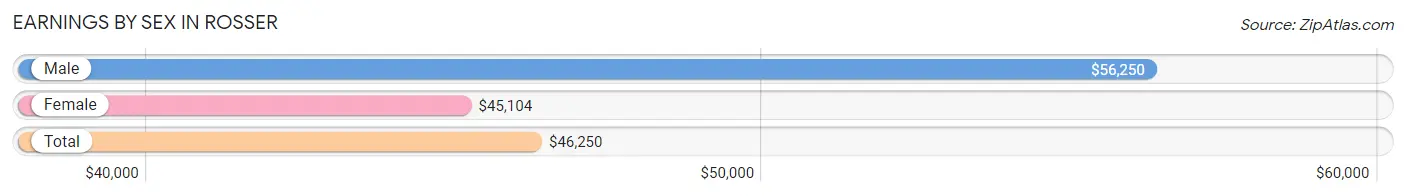
Earnings by Sex in Rosser
Average Earnings in Rosser are $46,250, $56,250 for men and $45,104 for women, a difference of 19.8%.
| Sex | Number | Average Earnings |
| Male | 118 (55.9%) | $56,250 |
| Female | 93 (44.1%) | $45,104 |
| Total | 211 (100.0%) | $46,250 |
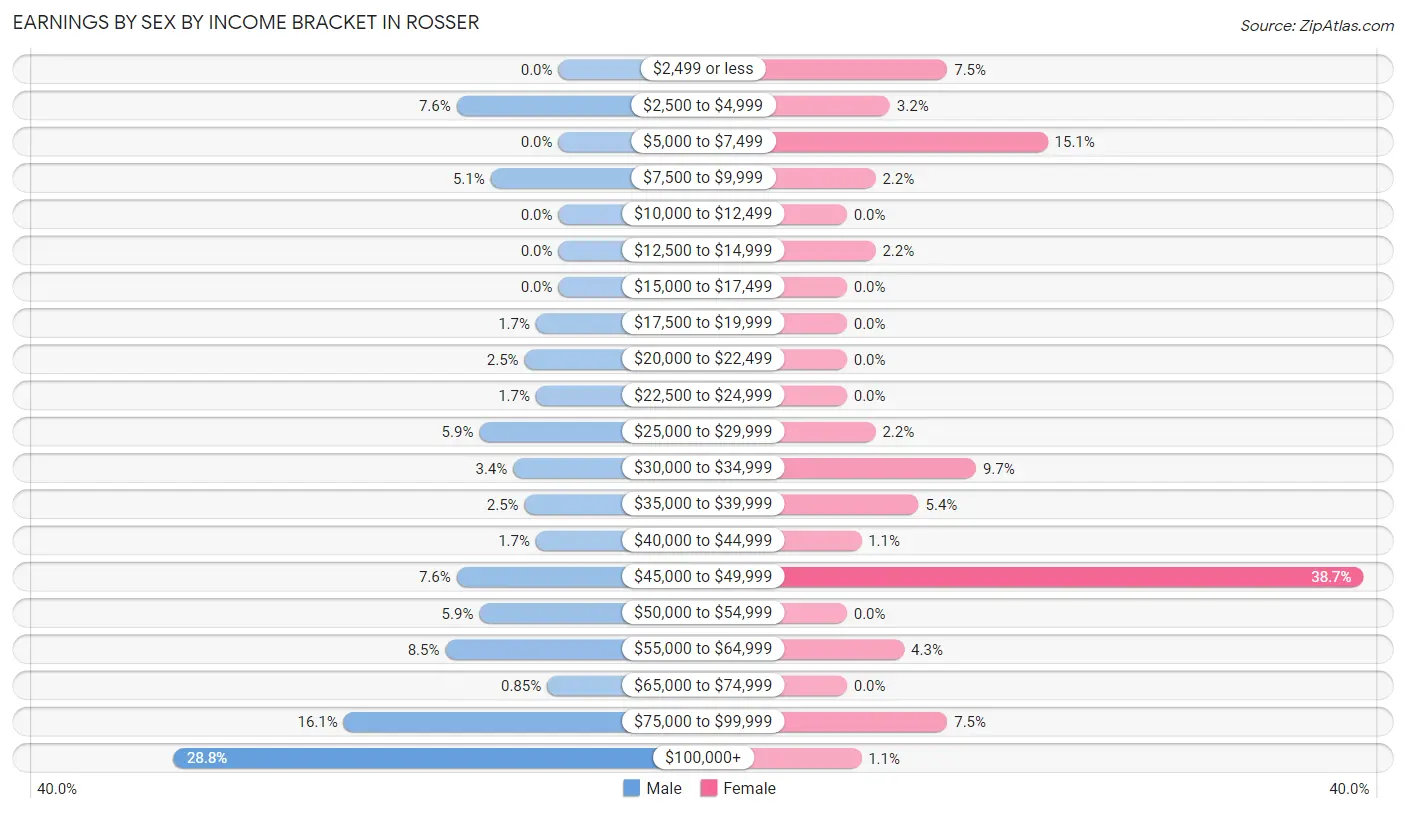
Earnings by Sex by Income Bracket in Rosser
The most common earnings brackets in Rosser are $100,000+ for men (34 | 28.8%) and $45,000 to $49,999 for women (36 | 38.7%).
| Income | Male | Female |
| $2,499 or less | 0 (0.0%) | 7 (7.5%) |
| $2,500 to $4,999 | 9 (7.6%) | 3 (3.2%) |
| $5,000 to $7,499 | 0 (0.0%) | 14 (15.0%) |
| $7,500 to $9,999 | 6 (5.1%) | 2 (2.1%) |
| $10,000 to $12,499 | 0 (0.0%) | 0 (0.0%) |
| $12,500 to $14,999 | 0 (0.0%) | 2 (2.1%) |
| $15,000 to $17,499 | 0 (0.0%) | 0 (0.0%) |
| $17,500 to $19,999 | 2 (1.7%) | 0 (0.0%) |
| $20,000 to $22,499 | 3 (2.5%) | 0 (0.0%) |
| $22,500 to $24,999 | 2 (1.7%) | 0 (0.0%) |
| $25,000 to $29,999 | 7 (5.9%) | 2 (2.1%) |
| $30,000 to $34,999 | 4 (3.4%) | 9 (9.7%) |
| $35,000 to $39,999 | 3 (2.5%) | 5 (5.4%) |
| $40,000 to $44,999 | 2 (1.7%) | 1 (1.1%) |
| $45,000 to $49,999 | 9 (7.6%) | 36 (38.7%) |
| $50,000 to $54,999 | 7 (5.9%) | 0 (0.0%) |
| $55,000 to $64,999 | 10 (8.5%) | 4 (4.3%) |
| $65,000 to $74,999 | 1 (0.9%) | 0 (0.0%) |
| $75,000 to $99,999 | 19 (16.1%) | 7 (7.5%) |
| $100,000+ | 34 (28.8%) | 1 (1.1%) |
| Total | 118 (100.0%) | 93 (100.0%) |
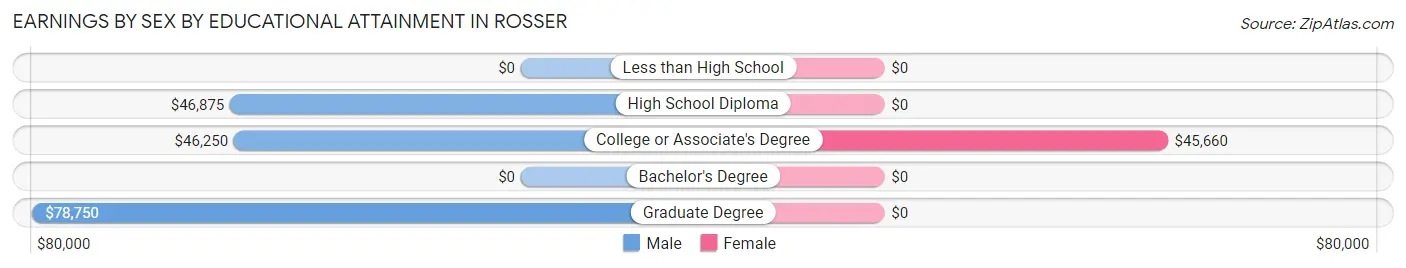
Earnings by Sex by Educational Attainment in Rosser
Average earnings in Rosser are $56,750 for men and $45,243 for women, a difference of 20.3%. Men with an educational attainment of graduate degree enjoy the highest average annual earnings of $78,750, while those with college or associate's degree education earn the least with $46,250. Women with an educational attainment of college or associate's degree earn the most with the average annual earnings of $45,660, while those with college or associate's degree education have the smallest earnings of $45,660.
| Educational Attainment | Male Income | Female Income |
| Less than High School | - | - |
| High School Diploma | $46,875 | $0 |
| College or Associate's Degree | $46,250 | $45,660 |
| Bachelor's Degree | - | - |
| Graduate Degree | $78,750 | $0 |
| Total | $56,750 | $45,243 |
Family Income in Rosser
Family Income Brackets in Rosser
According to the Rosser family income data, there are 22 families falling into the $75,000 to $99,999 income range, which is the most common income bracket and makes up 28.9% of all families.
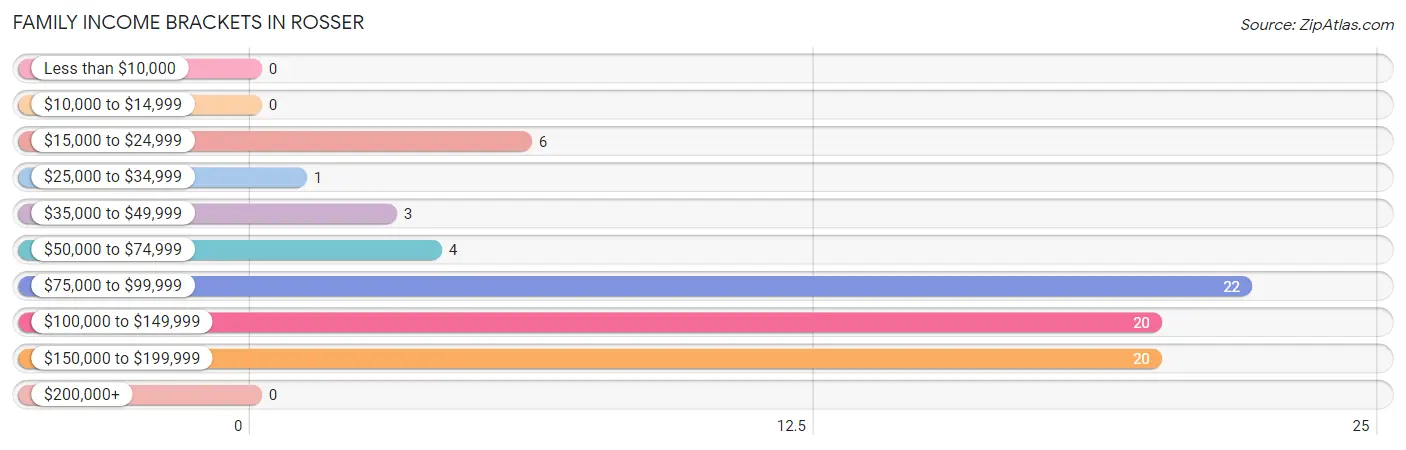
| Income Bracket | # Families | % Families |
| Less than $10,000 | 0 | 0.0% |
| $10,000 to $14,999 | 0 | 0.0% |
| $15,000 to $24,999 | 6 | 7.9% |
| $25,000 to $34,999 | 1 | 1.3% |
| $35,000 to $49,999 | 3 | 3.9% |
| $50,000 to $74,999 | 4 | 5.3% |
| $75,000 to $99,999 | 22 | 28.9% |
| $100,000 to $149,999 | 20 | 26.3% |
| $150,000 to $199,999 | 20 | 26.3% |
| $200,000+ | 0 | 0.0% |
Family Income by Famaliy Size in Rosser
6-person families (10 | 13.2%) account for the highest median family income in Rosser with $113,750 per family, while 2-person families (36 | 47.4%) have the highest median income of $45,500 per family member.
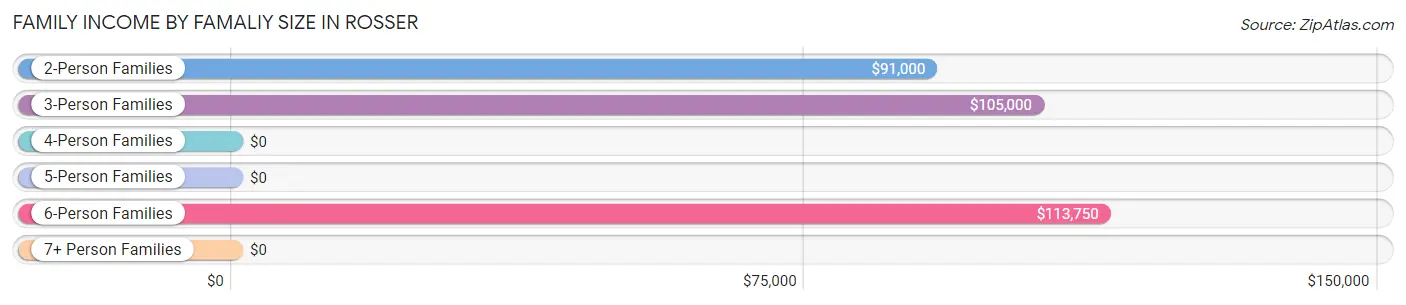
| Income Bracket | # Families | Median Income |
| 2-Person Families | 36 (47.4%) | $91,000 |
| 3-Person Families | 8 (10.5%) | $105,000 |
| 4-Person Families | 2 (2.6%) | $0 |
| 5-Person Families | 2 (2.6%) | $0 |
| 6-Person Families | 10 (13.2%) | $113,750 |
| 7+ Person Families | 18 (23.7%) | $0 |
| Total | 76 (100.0%) | $103,750 |
Family Income by Number of Earners in Rosser
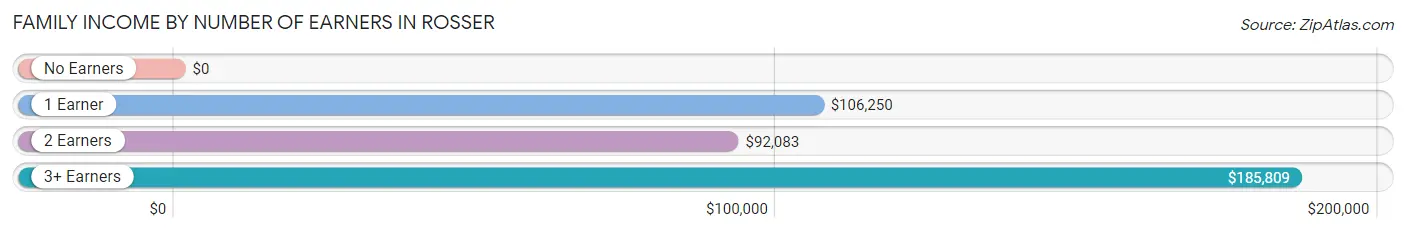
| Number of Earners | # Families | Median Income |
| No Earners | 6 (7.9%) | $0 |
| 1 Earner | 14 (18.4%) | $106,250 |
| 2 Earners | 33 (43.4%) | $92,083 |
| 3+ Earners | 23 (30.3%) | $185,809 |
| Total | 76 (100.0%) | $103,750 |
Household Income in Rosser
Household Income Brackets in Rosser
With 29 households falling in the category, the $75,000 to $99,999 income range is the most frequent in Rosser, accounting for 23.4% of all households.
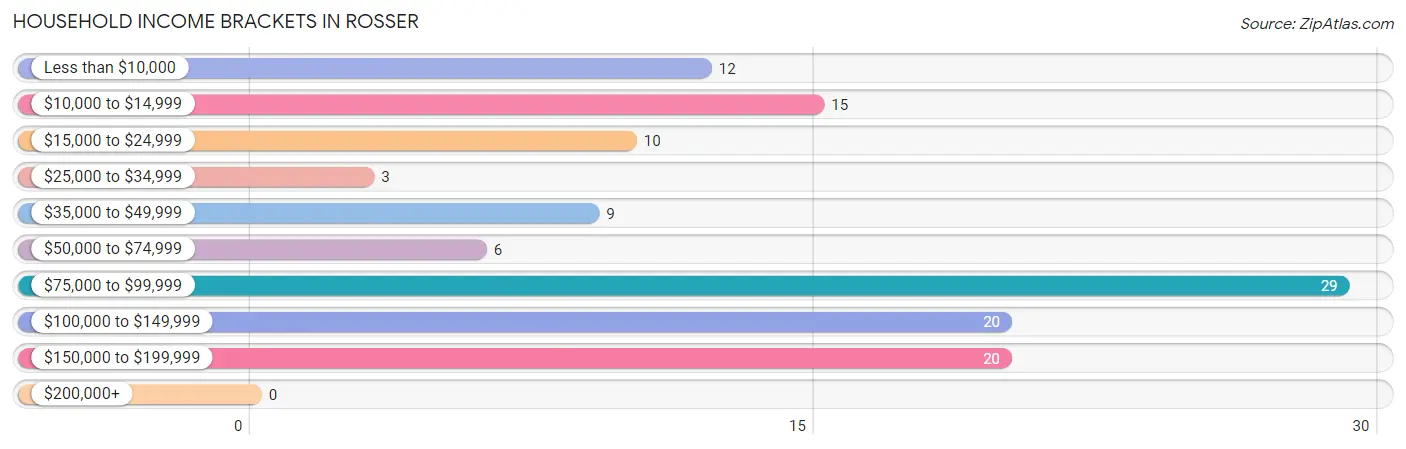
| Income Bracket | # Households | % Households |
| Less than $10,000 | 12 | 9.7% |
| $10,000 to $14,999 | 15 | 12.1% |
| $15,000 to $24,999 | 10 | 8.1% |
| $25,000 to $34,999 | 3 | 2.4% |
| $35,000 to $49,999 | 9 | 7.3% |
| $50,000 to $74,999 | 6 | 4.8% |
| $75,000 to $99,999 | 29 | 23.4% |
| $100,000 to $149,999 | 20 | 16.1% |
| $150,000 to $199,999 | 20 | 16.1% |
| $200,000+ | 0 | 0.0% |
Household Income by Householder Age in Rosser
The median household income in Rosser is $88,214, with the highest median household income of $91,000 found in the 45 to 64 years age bracket for the primary householder. A total of 74 households (59.7%) fall into this category.
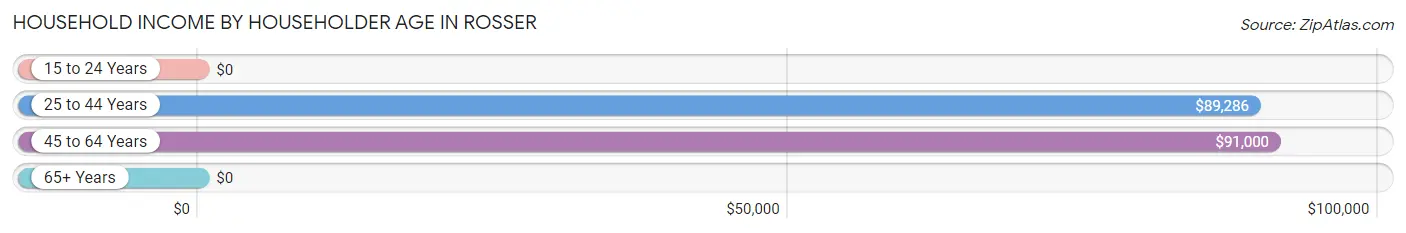
| Income Bracket | # Households | Median Income |
| 15 to 24 Years | 0 (0.0%) | $0 |
| 25 to 44 Years | 18 (14.5%) | $89,286 |
| 45 to 64 Years | 74 (59.7%) | $91,000 |
| 65+ Years | 32 (25.8%) | $0 |
| Total | 124 (100.0%) | $88,214 |
Poverty in Rosser
Income Below Poverty by Sex and Age in Rosser
With 11.6% poverty level for males and 3.0% for females among the residents of Rosser, 45 to 54 year old males and 45 to 54 year old females are the most vulnerable to poverty, with 19 males (67.9%) and 6 females (17.6%) in their respective age groups living below the poverty level.
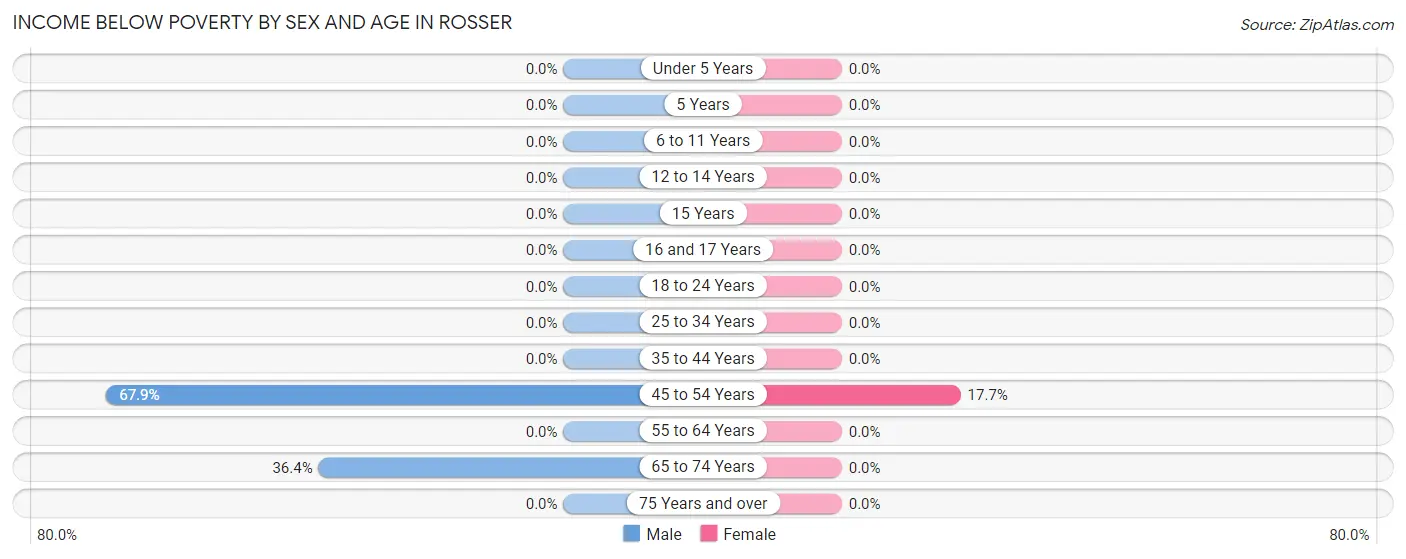
| Age Bracket | Male | Female |
| Under 5 Years | 0 (0.0%) | 0 (0.0%) |
| 5 Years | 0 (0.0%) | 0 (0.0%) |
| 6 to 11 Years | 0 (0.0%) | 0 (0.0%) |
| 12 to 14 Years | 0 (0.0%) | 0 (0.0%) |
| 15 Years | 0 (0.0%) | 0 (0.0%) |
| 16 and 17 Years | 0 (0.0%) | 0 (0.0%) |
| 18 to 24 Years | 0 (0.0%) | 0 (0.0%) |
| 25 to 34 Years | 0 (0.0%) | 0 (0.0%) |
| 35 to 44 Years | 0 (0.0%) | 0 (0.0%) |
| 45 to 54 Years | 19 (67.9%) | 6 (17.6%) |
| 55 to 64 Years | 0 (0.0%) | 0 (0.0%) |
| 65 to 74 Years | 8 (36.4%) | 0 (0.0%) |
| 75 Years and over | 0 (0.0%) | 0 (0.0%) |
| Total | 27 (11.6%) | 6 (3.0%) |
Income Above Poverty by Sex and Age in Rosser
According to the poverty statistics in Rosser, males aged under 5 years and females aged under 5 years are the age groups that are most secure financially, with 100.0% of males and 100.0% of females in these age groups living above the poverty line.
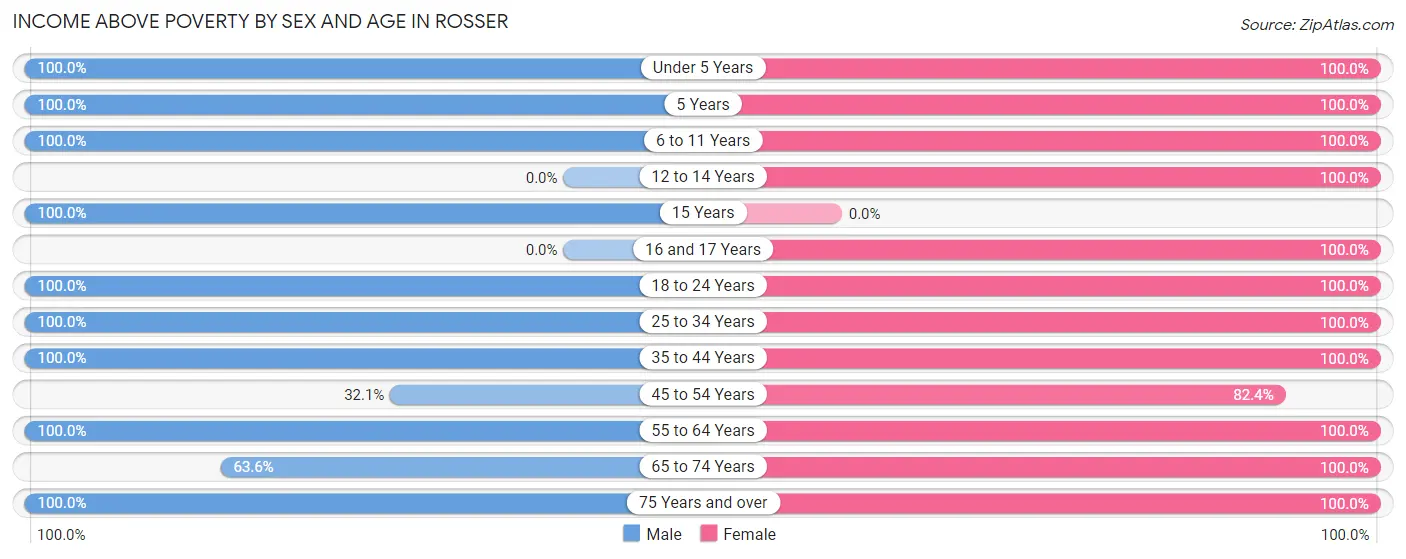
| Age Bracket | Male | Female |
| Under 5 Years | 11 (100.0%) | 2 (100.0%) |
| 5 Years | 2 (100.0%) | 2 (100.0%) |
| 6 to 11 Years | 53 (100.0%) | 38 (100.0%) |
| 12 to 14 Years | 0 (0.0%) | 4 (100.0%) |
| 15 Years | 5 (100.0%) | 0 (0.0%) |
| 16 and 17 Years | 0 (0.0%) | 1 (100.0%) |
| 18 to 24 Years | 4 (100.0%) | 5 (100.0%) |
| 25 to 34 Years | 26 (100.0%) | 40 (100.0%) |
| 35 to 44 Years | 47 (100.0%) | 15 (100.0%) |
| 45 to 54 Years | 9 (32.1%) | 28 (82.4%) |
| 55 to 64 Years | 27 (100.0%) | 30 (100.0%) |
| 65 to 74 Years | 14 (63.6%) | 19 (100.0%) |
| 75 Years and over | 8 (100.0%) | 13 (100.0%) |
| Total | 206 (88.4%) | 197 (97.0%) |
Income Below Poverty Among Married-Couple Families in Rosser
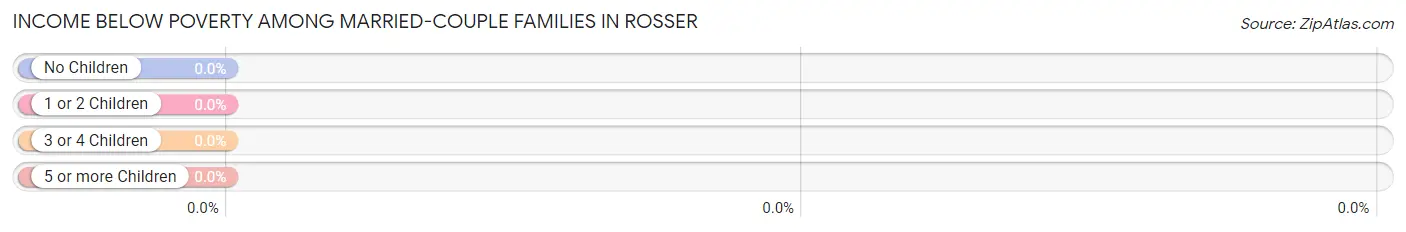
| Children | Above Poverty | Below Poverty |
| No Children | 37 (100.0%) | 0 (0.0%) |
| 1 or 2 Children | 14 (100.0%) | 0 (0.0%) |
| 3 or 4 Children | 2 (100.0%) | 0 (0.0%) |
| 5 or more Children | 1 (100.0%) | 0 (0.0%) |
| Total | 54 (100.0%) | 0 (0.0%) |
Income Below Poverty Among Single-Parent Households in Rosser
| Children | Single Father | Single Mother |
| No Children | 0 (0.0%) | 0 (0.0%) |
| 1 or 2 Children | 0 (0.0%) | 0 (0.0%) |
| 3 or 4 Children | 0 (0.0%) | 0 (0.0%) |
| 5 or more Children | 0 (0.0%) | 0 (0.0%) |
| Total | 0 (0.0%) | 0 (0.0%) |
Income Below Poverty Among Married-Couple vs Single-Parent Households in Rosser
| Children | Married-Couple Families | Single-Parent Households |
| No Children | 0 (0.0%) | 0 (0.0%) |
| 1 or 2 Children | 0 (0.0%) | 0 (0.0%) |
| 3 or 4 Children | 0 (0.0%) | 0 (0.0%) |
| 5 or more Children | 0 (0.0%) | 0 (0.0%) |
| Total | 0 (0.0%) | 0 (0.0%) |
Race in Rosser
The most populous races in Rosser are White / Caucasian (193 | 44.2%), Two or more Races (124 | 28.4%), and Black / African American (117 | 26.8%).
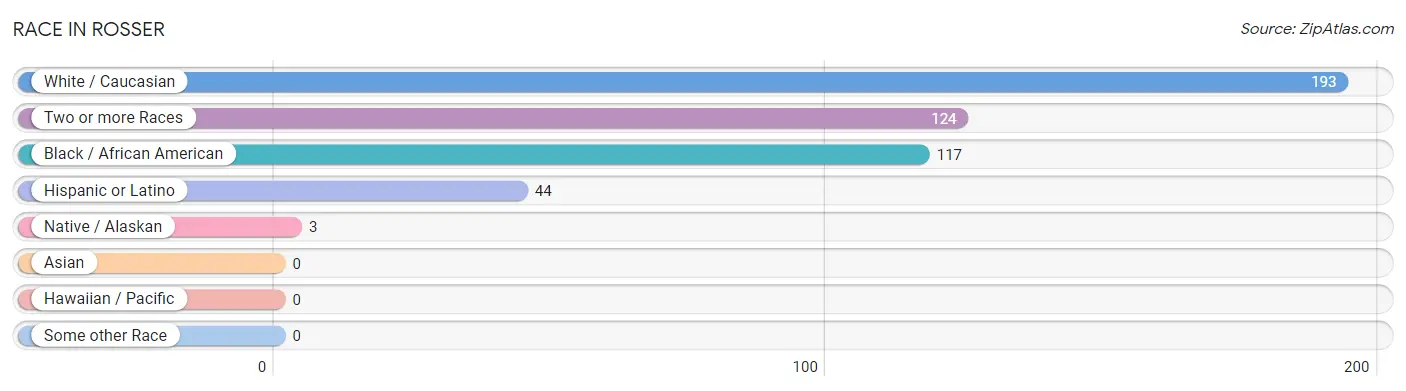
| Race | # Population | % Population |
| Asian | 0 | 0.0% |
| Black / African American | 117 | 26.8% |
| Hawaiian / Pacific | 0 | 0.0% |
| Hispanic or Latino | 44 | 10.1% |
| Native / Alaskan | 3 | 0.7% |
| White / Caucasian | 193 | 44.2% |
| Two or more Races | 124 | 28.4% |
| Some other Race | 0 | 0.0% |
| Total | 437 | 100.0% |
Ancestry in Rosser
The most populous ancestries reported in Rosser are English (32 | 7.3%), Irish (30 | 6.9%), Cherokee (21 | 4.8%), European (17 | 3.9%), and Mexican (12 | 2.8%), together accounting for 25.6% of all Rosser residents.
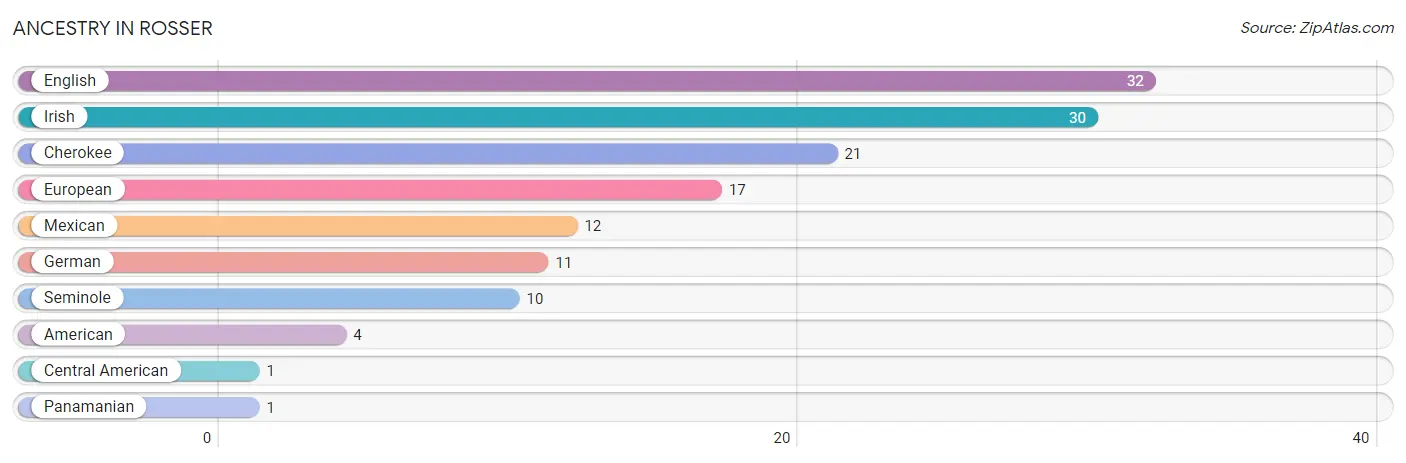
| Ancestry | # Population | % Population |
| American | 4 | 0.9% |
| Central American | 1 | 0.2% |
| Cherokee | 21 | 4.8% |
| English | 32 | 7.3% |
| European | 17 | 3.9% |
| German | 11 | 2.5% |
| Irish | 30 | 6.9% |
| Mexican | 12 | 2.8% |
| Panamanian | 1 | 0.2% |
| Seminole | 10 | 2.3% | View All 10 Rows |
Immigrants in Rosser
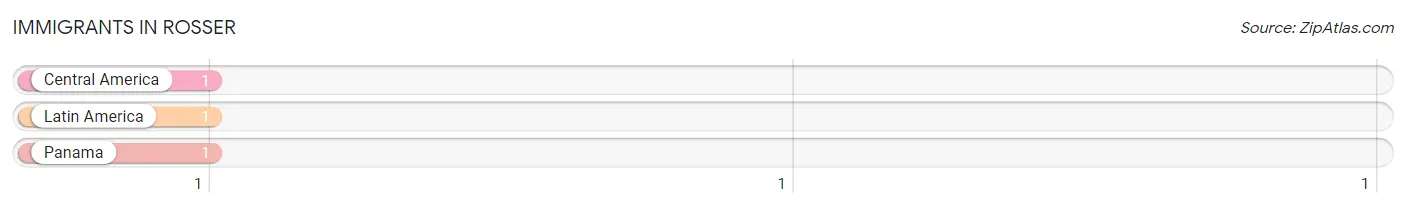
The most numerous immigrant groups reported in Rosser came from Central America (1 | 0.2%), Latin America (1 | 0.2%), and Panama (1 | 0.2%), together accounting for 0.7% of all Rosser residents.
| Immigration Origin | # Population | % Population |
| Central America | 1 | 0.2% |
| Latin America | 1 | 0.2% |
| Panama | 1 | 0.2% | View All 3 Rows |
Sex and Age in Rosser
Sex and Age in Rosser
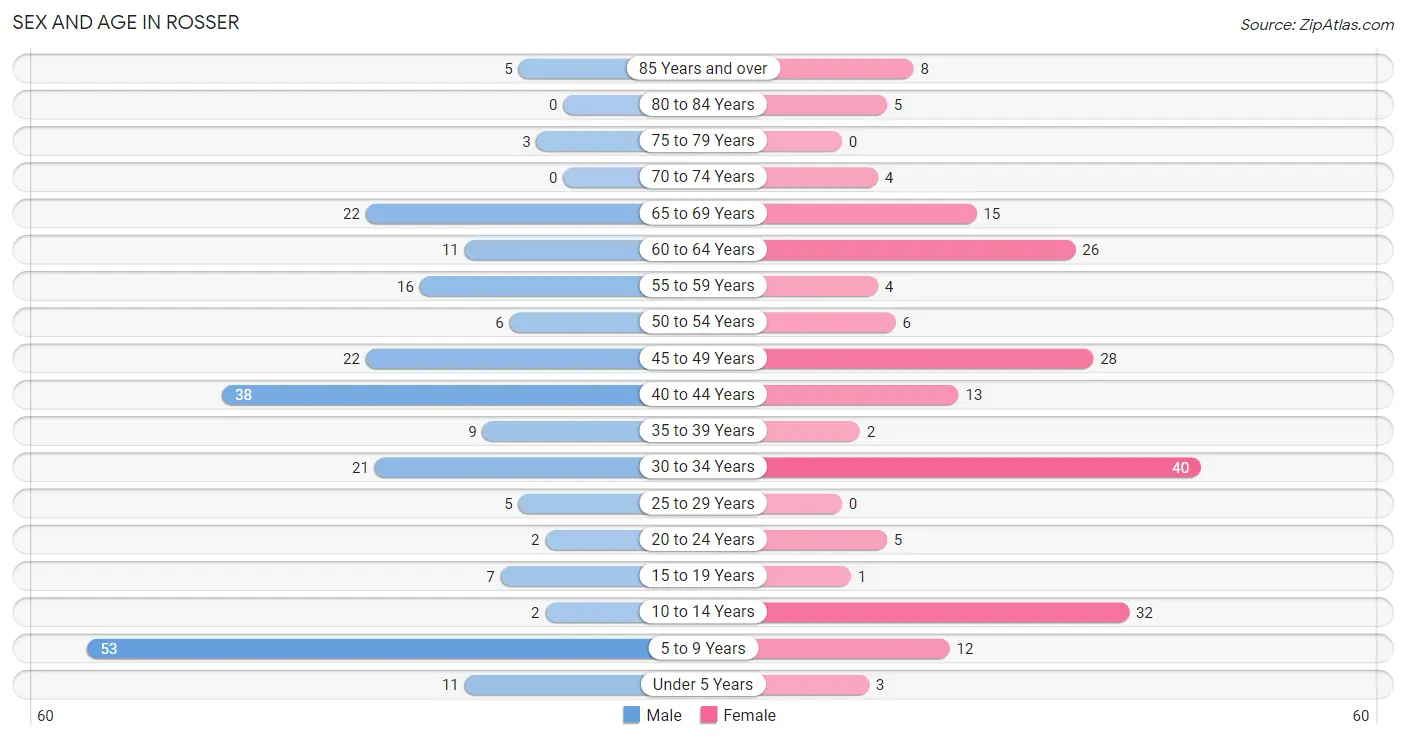
The most populous age groups in Rosser are 5 to 9 Years (53 | 22.8%) for men and 30 to 34 Years (40 | 19.6%) for women.
| Age Bracket | Male | Female |
| Under 5 Years | 11 (4.7%) | 3 (1.5%) |
| 5 to 9 Years | 53 (22.8%) | 12 (5.9%) |
| 10 to 14 Years | 2 (0.9%) | 32 (15.7%) |
| 15 to 19 Years | 7 (3.0%) | 1 (0.5%) |
| 20 to 24 Years | 2 (0.9%) | 5 (2.5%) |
| 25 to 29 Years | 5 (2.1%) | 0 (0.0%) |
| 30 to 34 Years | 21 (9.0%) | 40 (19.6%) |
| 35 to 39 Years | 9 (3.9%) | 2 (1.0%) |
| 40 to 44 Years | 38 (16.3%) | 13 (6.4%) |
| 45 to 49 Years | 22 (9.4%) | 28 (13.7%) |
| 50 to 54 Years | 6 (2.6%) | 6 (2.9%) |
| 55 to 59 Years | 16 (6.9%) | 4 (2.0%) |
| 60 to 64 Years | 11 (4.7%) | 26 (12.8%) |
| 65 to 69 Years | 22 (9.4%) | 15 (7.3%) |
| 70 to 74 Years | 0 (0.0%) | 4 (2.0%) |
| 75 to 79 Years | 3 (1.3%) | 0 (0.0%) |
| 80 to 84 Years | 0 (0.0%) | 5 (2.5%) |
| 85 Years and over | 5 (2.1%) | 8 (3.9%) |
| Total | 233 (100.0%) | 204 (100.0%) |
Families and Households in Rosser
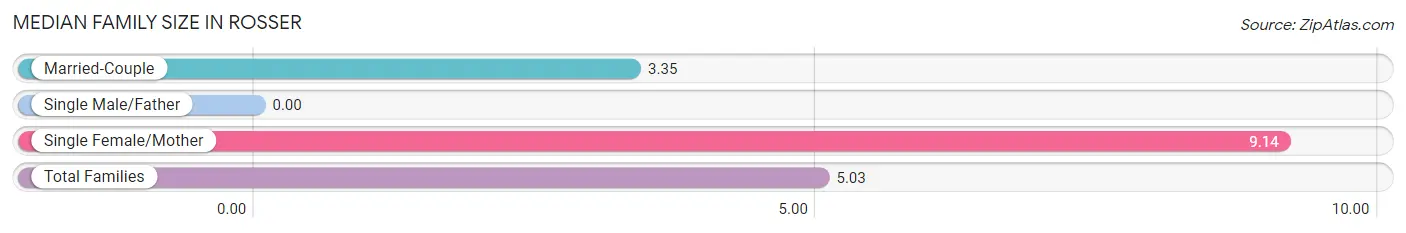
Median Family Size in Rosser
| Family Type | # Families | Family Size |
| Married-Couple | 54 (71.1%) | 3.35 |
| Single Male/Father | 0 (0.0%) | - |
| Single Female/Mother | 22 (28.9%) | 9.14 |
| Total Families | 76 (100.0%) | 5.03 |
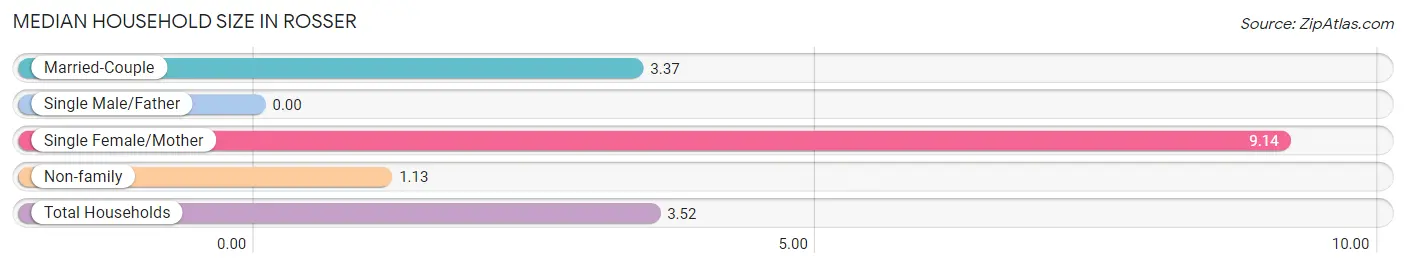
Median Household Size in Rosser
| Household Type | # Households | Household Size |
| Married-Couple | 54 (43.5%) | 3.37 |
| Single Male/Father | 0 (0.0%) | - |
| Single Female/Mother | 22 (17.7%) | 9.14 |
| Non-family | 48 (38.7%) | 1.13 |
| Total Households | 124 (100.0%) | 3.52 |
Household Size by Marriage Status in Rosser
Out of a total of 124 households in Rosser, 76 (61.3%) are family households, while 48 (38.7%) are nonfamily households. The most numerous type of family households are 2-person households, comprising 36, and the most common type of nonfamily households are 1-person households, comprising 41.
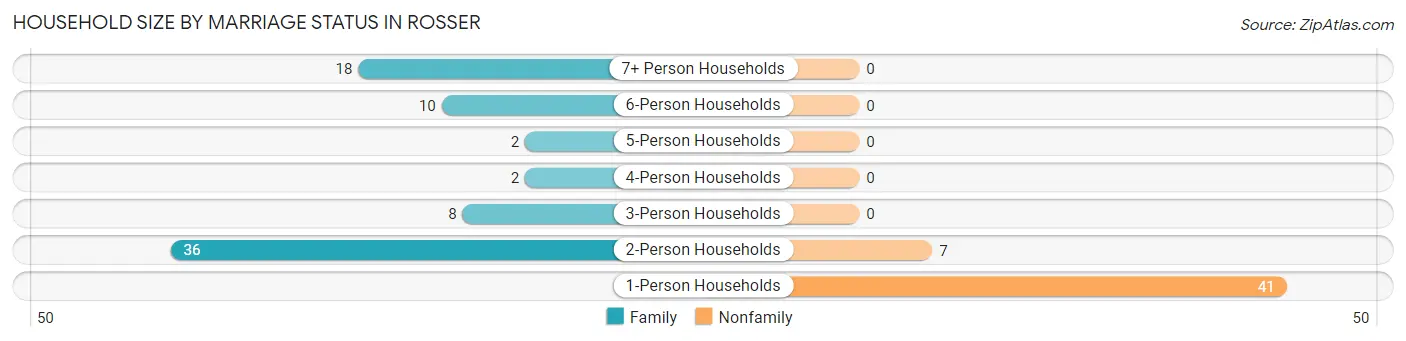
| Household Size | Family Households | Nonfamily Households |
| 1-Person Households | - | 41 (33.1%) |
| 2-Person Households | 36 (29.0%) | 7 (5.7%) |
| 3-Person Households | 8 (6.5%) | 0 (0.0%) |
| 4-Person Households | 2 (1.6%) | 0 (0.0%) |
| 5-Person Households | 2 (1.6%) | 0 (0.0%) |
| 6-Person Households | 10 (8.1%) | 0 (0.0%) |
| 7+ Person Households | 18 (14.5%) | 0 (0.0%) |
| Total | 76 (61.3%) | 48 (38.7%) |
Female Fertility in Rosser
Fertility by Age in Rosser
Average fertility rate in Rosser is 34.0 births per 1,000 women. Women in the age bracket of 20 to 34 years have the highest fertility rate with 67.0 births per 1,000 women. Women in the age bracket of 20 to 34 years acount for 100.0% of all women with births.
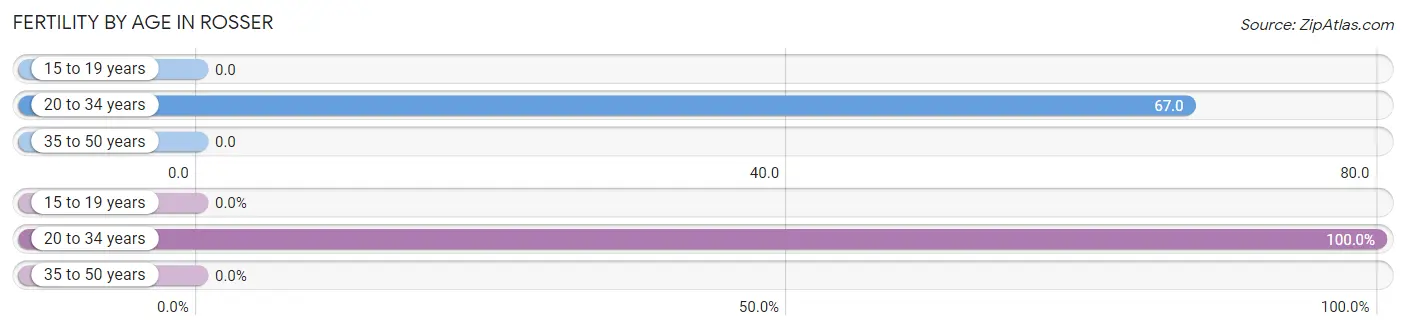
| Age Bracket | Women with Births | Births / 1,000 Women |
| 15 to 19 years | 0 (0.0%) | 0.0 |
| 20 to 34 years | 3 (100.0%) | 67.0 |
| 35 to 50 years | 0 (0.0%) | 0.0 |
| Total | 3 (100.0%) | 34.0 |
Fertility by Age by Marriage Status in Rosser
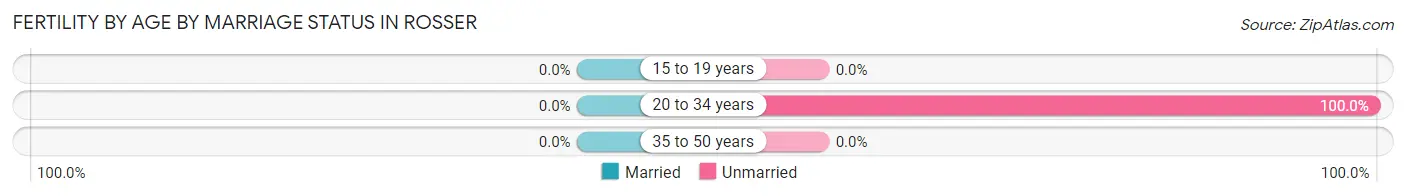
| Age Bracket | Married | Unmarried |
| 15 to 19 years | 0 (0.0%) | 0 (0.0%) |
| 20 to 34 years | 0 (0.0%) | 3 (100.0%) |
| 35 to 50 years | 0 (0.0%) | 0 (0.0%) |
| Total | 0 (0.0%) | 3 (100.0%) |
Fertility by Education in Rosser
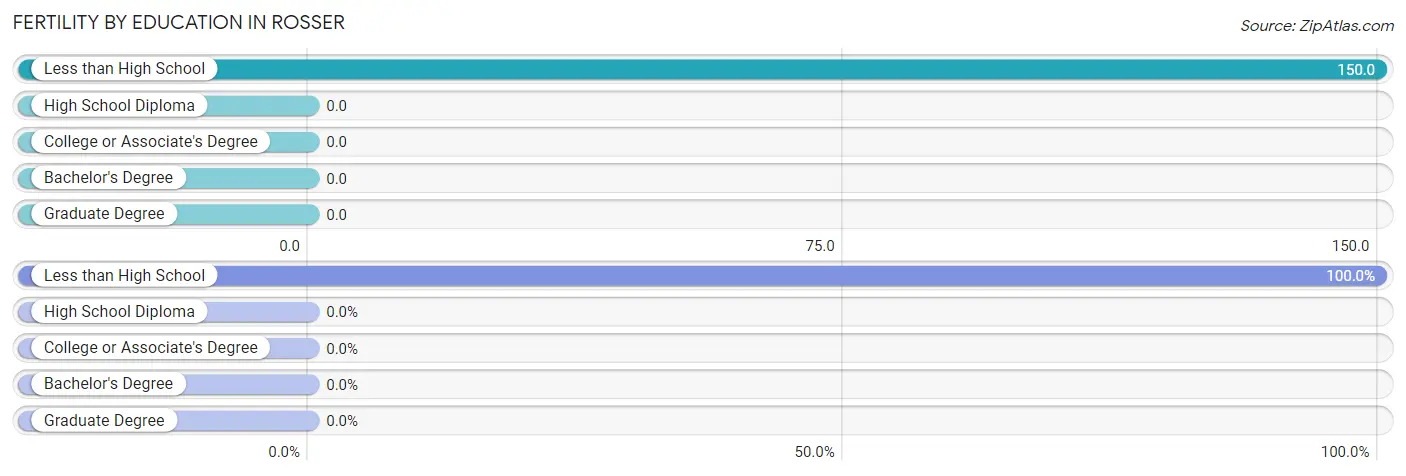
| Educational Attainment | Women with Births | Births / 1,000 Women |
| Less than High School | 3 (100.0%) | 150.0 |
| High School Diploma | 0 (0.0%) | 0.0 |
| College or Associate's Degree | 0 (0.0%) | 0.0 |
| Bachelor's Degree | 0 (0.0%) | 0.0 |
| Graduate Degree | 0 (0.0%) | 0.0 |
| Total | 3 (100.0%) | 34.0 |
Fertility by Education by Marriage Status in Rosser
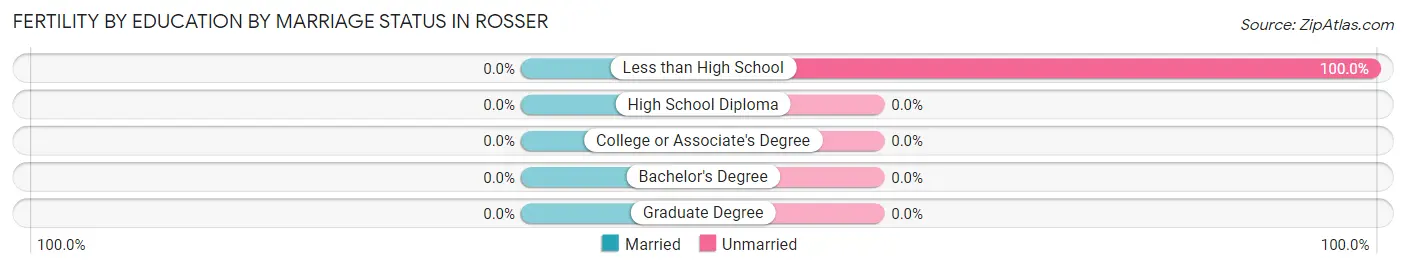
| Educational Attainment | Married | Unmarried |
| Less than High School | 0 (0.0%) | 3 (100.0%) |
| High School Diploma | 0 (0.0%) | 0 (0.0%) |
| College or Associate's Degree | 0 (0.0%) | 0 (0.0%) |
| Bachelor's Degree | 0 (0.0%) | 0 (0.0%) |
| Graduate Degree | 0 (0.0%) | 0 (0.0%) |
| Total | 0 (0.0%) | 3 (100.0%) |
Employment Characteristics in Rosser
Employment by Class of Employer in Rosser
Among the 195 employed individuals in Rosser, private company employees (162 | 83.1%), local government employees (17 | 8.7%), and self-employed (not incorporated) (10 | 5.1%) make up the most common classes of employment.
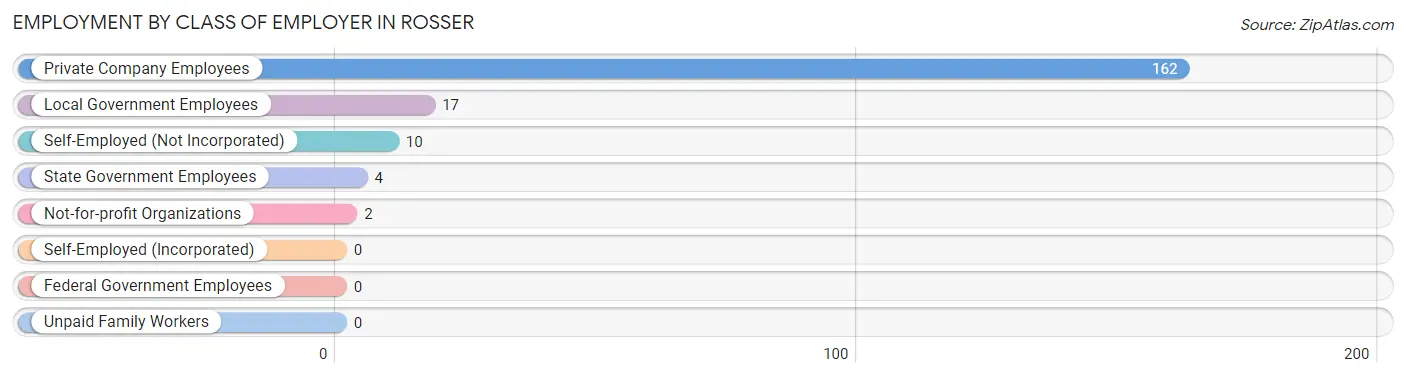
| Employer Class | # Employees | % Employees |
| Private Company Employees | 162 | 83.1% |
| Self-Employed (Incorporated) | 0 | 0.0% |
| Self-Employed (Not Incorporated) | 10 | 5.1% |
| Not-for-profit Organizations | 2 | 1.0% |
| Local Government Employees | 17 | 8.7% |
| State Government Employees | 4 | 2.1% |
| Federal Government Employees | 0 | 0.0% |
| Unpaid Family Workers | 0 | 0.0% |
| Total | 195 | 100.0% |
Employment Status by Age in Rosser
According to the labor force statistics for Rosser, out of the total population over 16 years of age (319), 65.2% or 208 individuals are in the labor force, with 5.8% or 12 of them unemployed. The age group with the highest labor force participation rate is 25 to 29 years, with 100.0% or 5 individuals in the labor force. Within the labor force, the 16 to 19 years age range has the highest percentage of unemployed individuals, with 100.0% or 2 of them being unemployed.
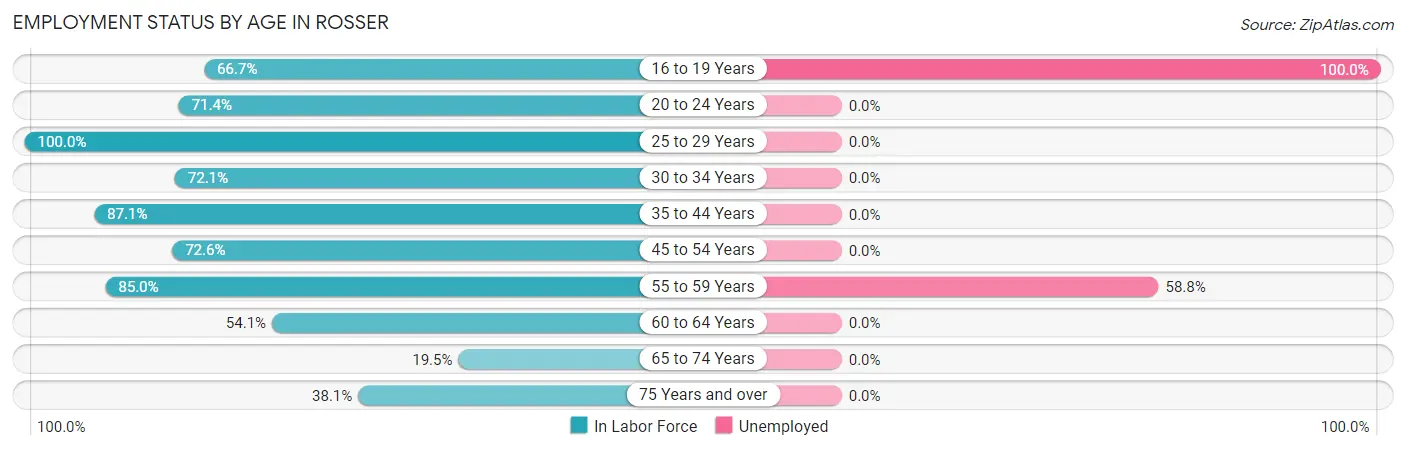
| Age Bracket | In Labor Force | Unemployed |
| 16 to 19 Years | 2 (66.7%) | 2 (100.0%) |
| 20 to 24 Years | 5 (71.4%) | 0 (0.0%) |
| 25 to 29 Years | 5 (100.0%) | 0 (0.0%) |
| 30 to 34 Years | 44 (72.1%) | 0 (0.0%) |
| 35 to 44 Years | 54 (87.1%) | 0 (0.0%) |
| 45 to 54 Years | 45 (72.6%) | 0 (0.0%) |
| 55 to 59 Years | 17 (85.0%) | 10 (58.8%) |
| 60 to 64 Years | 20 (54.1%) | 0 (0.0%) |
| 65 to 74 Years | 8 (19.5%) | 0 (0.0%) |
| 75 Years and over | 8 (38.1%) | 0 (0.0%) |
| Total | 208 (65.2%) | 12 (5.8%) |
Employment Status by Educational Attainment in Rosser
According to labor force statistics for Rosser, 74.9% of individuals (185) out of the total population between 25 and 64 years of age (247) are in the labor force, with 5.4% or 10 of them being unemployed. The group with the highest labor force participation rate are those with the educational attainment of bachelor's degree or higher, with 100.0% or 7 individuals in the labor force. Within the labor force, individuals with college / associate degree education have the highest percentage of unemployment, with 13.0% or 10 of them being unemployed.
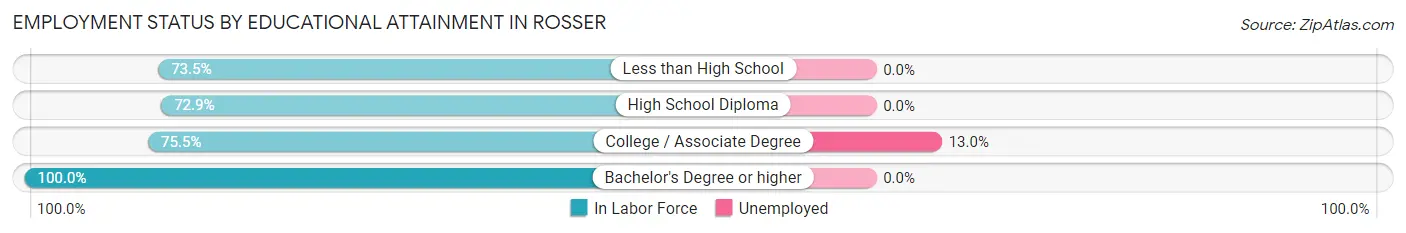
| Educational Attainment | In Labor Force | Unemployed |
| Less than High School | 50 (73.5%) | 0 (0.0%) |
| High School Diploma | 51 (72.9%) | 0 (0.0%) |
| College / Associate Degree | 77 (75.5%) | 13 (13.0%) |
| Bachelor's Degree or higher | 7 (100.0%) | 0 (0.0%) |
| Total | 185 (74.9%) | 13 (5.4%) |
Employment Occupations by Sex in Rosser
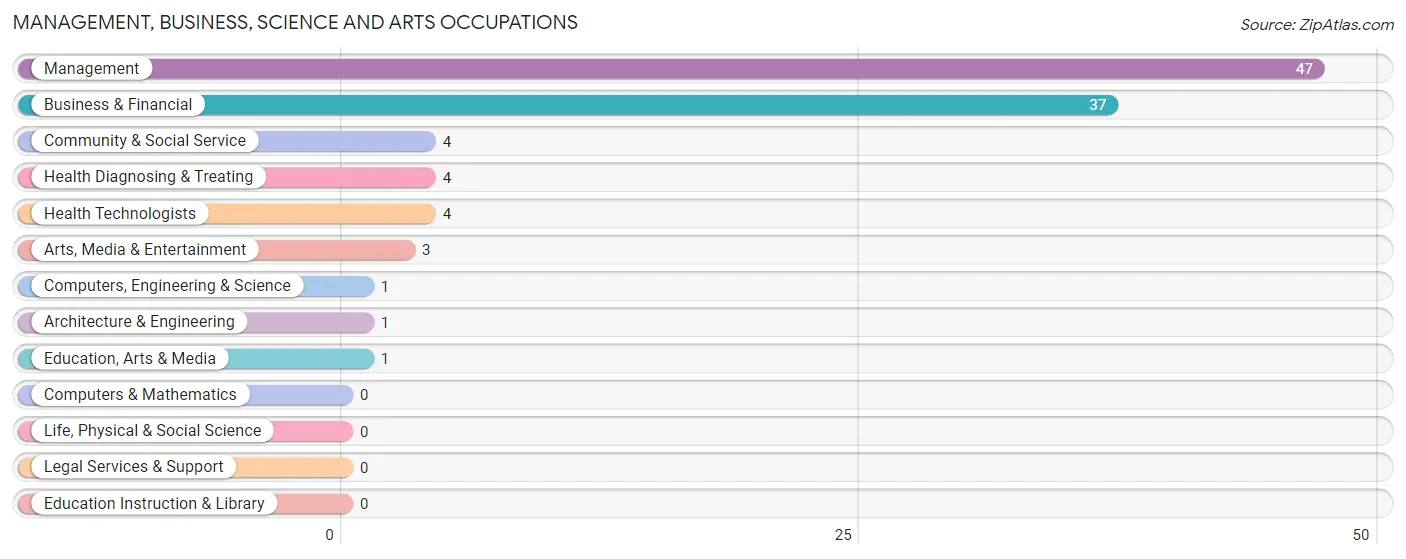
Management, Business, Science and Arts Occupations
The most common Management, Business, Science and Arts occupations in Rosser are Management (47 | 24.0%), Business & Financial (37 | 18.9%), Community & Social Service (4 | 2.0%), Health Diagnosing & Treating (4 | 2.0%), and Health Technologists (4 | 2.0%).
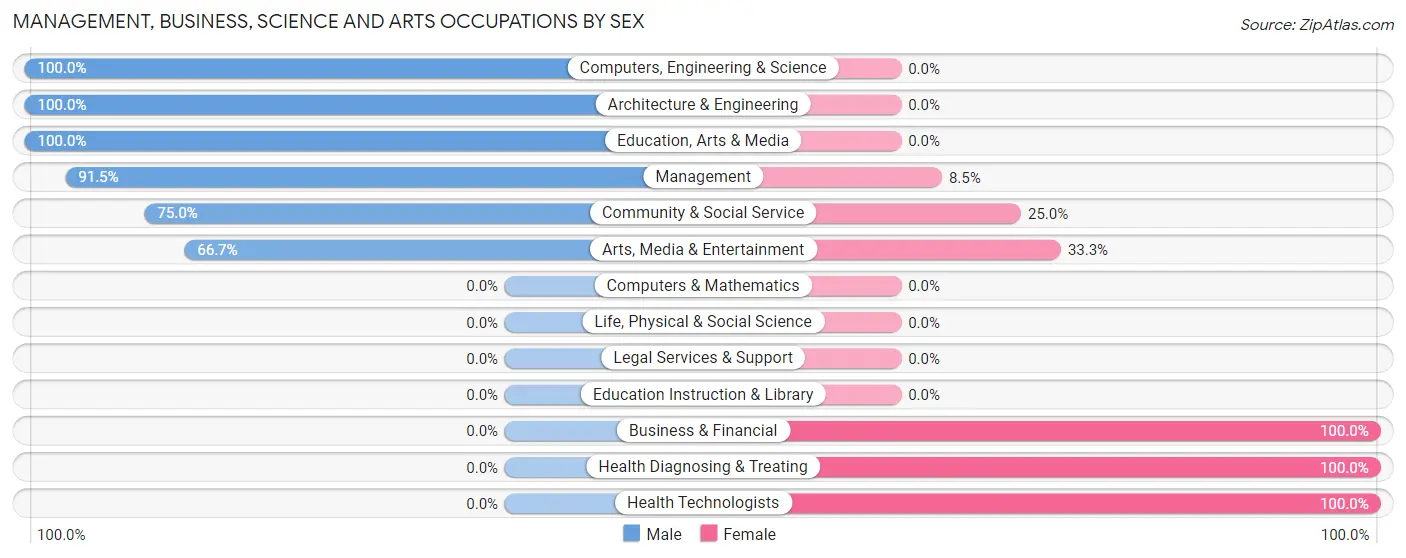
Management, Business, Science and Arts Occupations by Sex
Within the Management, Business, Science and Arts occupations in Rosser, the most male-oriented occupations are Computers, Engineering & Science (100.0%), Architecture & Engineering (100.0%), and Education, Arts & Media (100.0%), while the most female-oriented occupations are Business & Financial (100.0%), Health Diagnosing & Treating (100.0%), and Health Technologists (100.0%).
| Occupation | Male | Female |
| Management | 43 (91.5%) | 4 (8.5%) |
| Business & Financial | 0 (0.0%) | 37 (100.0%) |
| Computers, Engineering & Science | 1 (100.0%) | 0 (0.0%) |
| Computers & Mathematics | 0 (0.0%) | 0 (0.0%) |
| Architecture & Engineering | 1 (100.0%) | 0 (0.0%) |
| Life, Physical & Social Science | 0 (0.0%) | 0 (0.0%) |
| Community & Social Service | 3 (75.0%) | 1 (25.0%) |
| Education, Arts & Media | 1 (100.0%) | 0 (0.0%) |
| Legal Services & Support | 0 (0.0%) | 0 (0.0%) |
| Education Instruction & Library | 0 (0.0%) | 0 (0.0%) |
| Arts, Media & Entertainment | 2 (66.7%) | 1 (33.3%) |
| Health Diagnosing & Treating | 0 (0.0%) | 4 (100.0%) |
| Health Technologists | 0 (0.0%) | 4 (100.0%) |
| Total (Category) | 47 (50.5%) | 46 (49.5%) |
| Total (Overall) | 104 (53.1%) | 92 (46.9%) |
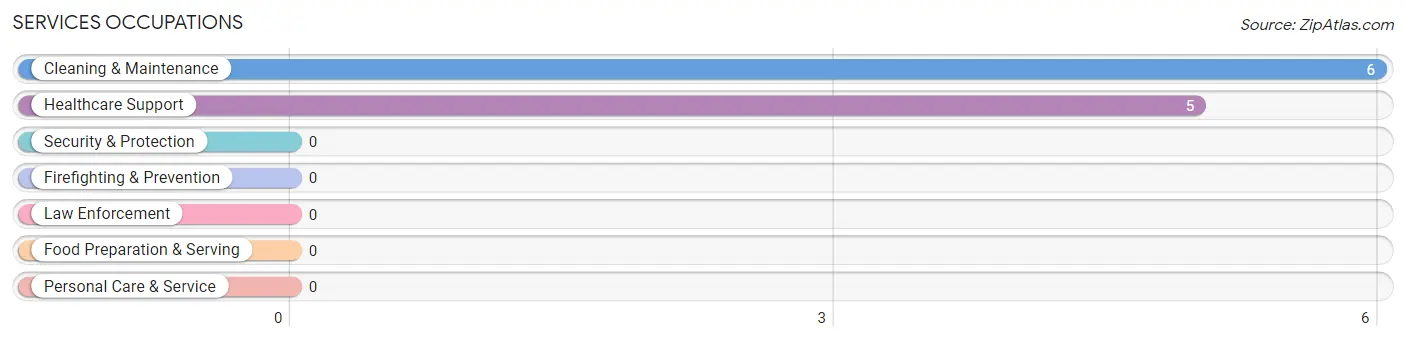
Services Occupations
The most common Services occupations in Rosser are Cleaning & Maintenance (6 | 3.1%), and Healthcare Support (5 | 2.5%).
Services Occupations by Sex
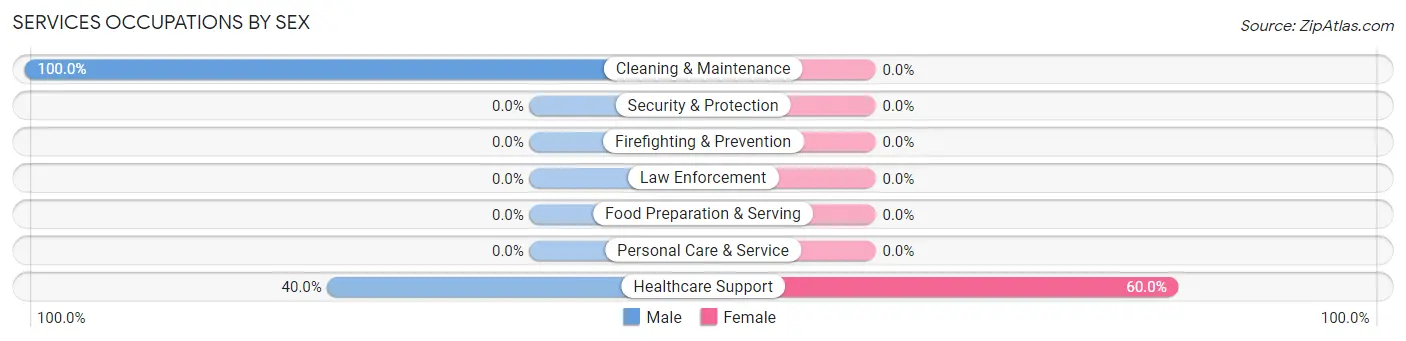
| Occupation | Male | Female |
| Healthcare Support | 2 (40.0%) | 3 (60.0%) |
| Security & Protection | 0 (0.0%) | 0 (0.0%) |
| Firefighting & Prevention | 0 (0.0%) | 0 (0.0%) |
| Law Enforcement | 0 (0.0%) | 0 (0.0%) |
| Food Preparation & Serving | 0 (0.0%) | 0 (0.0%) |
| Cleaning & Maintenance | 6 (100.0%) | 0 (0.0%) |
| Personal Care & Service | 0 (0.0%) | 0 (0.0%) |
| Total (Category) | 8 (72.7%) | 3 (27.3%) |
| Total (Overall) | 104 (53.1%) | 92 (46.9%) |
Sales and Office Occupations
The most common Sales and Office occupations in Rosser are Sales & Related (28 | 14.3%), and Office & Administration (14 | 7.1%).
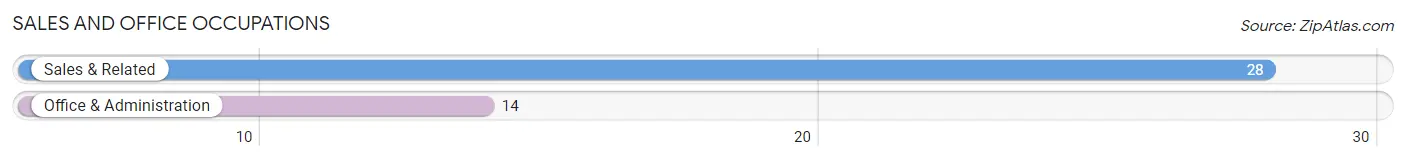
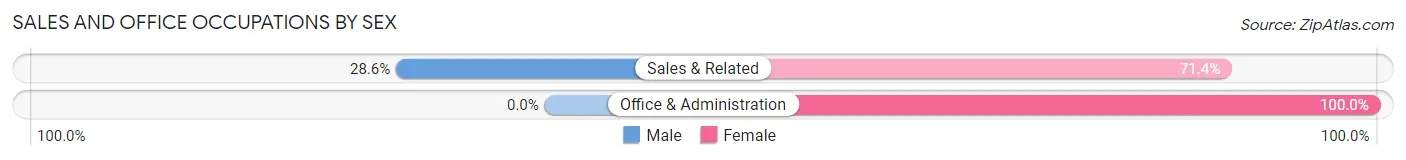
Sales and Office Occupations by Sex
| Occupation | Male | Female |
| Sales & Related | 8 (28.6%) | 20 (71.4%) |
| Office & Administration | 0 (0.0%) | 14 (100.0%) |
| Total (Category) | 8 (19.1%) | 34 (80.9%) |
| Total (Overall) | 104 (53.1%) | 92 (46.9%) |
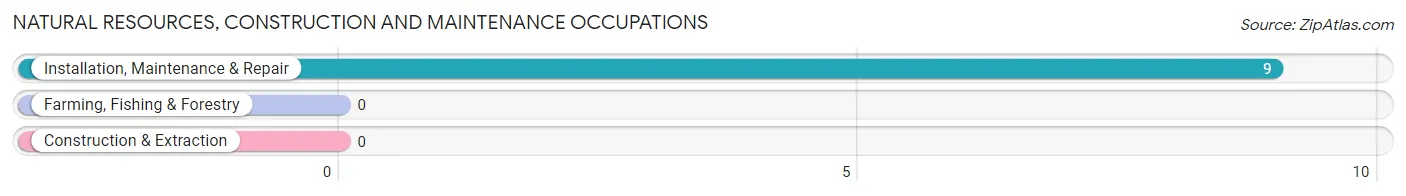
Natural Resources, Construction and Maintenance Occupations
The most common Natural Resources, Construction and Maintenance occupations in Rosser are , and Installation, Maintenance & Repair (9 | 4.6%).
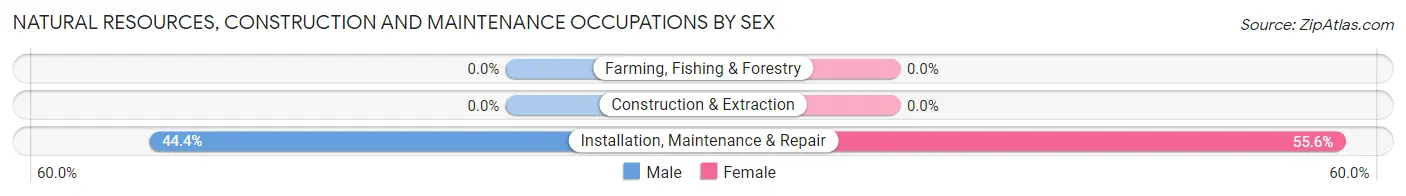
Natural Resources, Construction and Maintenance Occupations by Sex
| Occupation | Male | Female |
| Farming, Fishing & Forestry | 0 (0.0%) | 0 (0.0%) |
| Construction & Extraction | 0 (0.0%) | 0 (0.0%) |
| Installation, Maintenance & Repair | 4 (44.4%) | 5 (55.6%) |
| Total (Category) | 4 (44.4%) | 5 (55.6%) |
| Total (Overall) | 104 (53.1%) | 92 (46.9%) |
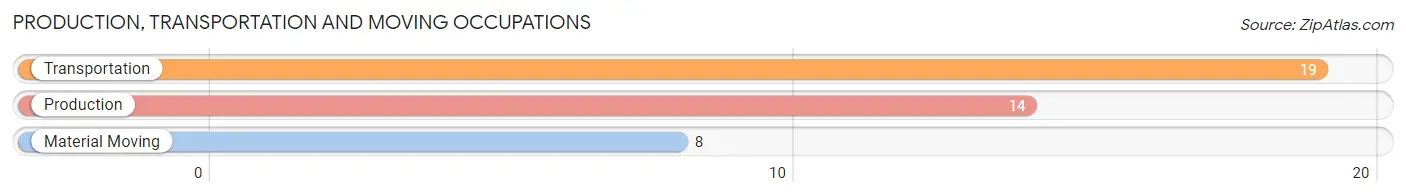
Production, Transportation and Moving Occupations
The most common Production, Transportation and Moving occupations in Rosser are Transportation (19 | 9.7%), Production (14 | 7.1%), and Material Moving (8 | 4.1%).
Production, Transportation and Moving Occupations by Sex
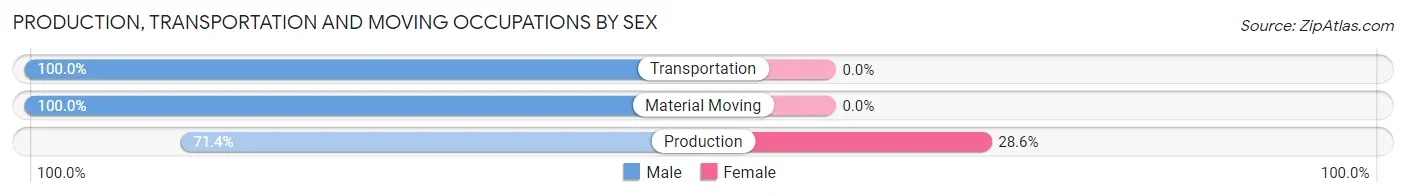
| Occupation | Male | Female |
| Production | 10 (71.4%) | 4 (28.6%) |
| Transportation | 19 (100.0%) | 0 (0.0%) |
| Material Moving | 8 (100.0%) | 0 (0.0%) |
| Total (Category) | 37 (90.2%) | 4 (9.8%) |
| Total (Overall) | 104 (53.1%) | 92 (46.9%) |
Employment Industries by Sex in Rosser
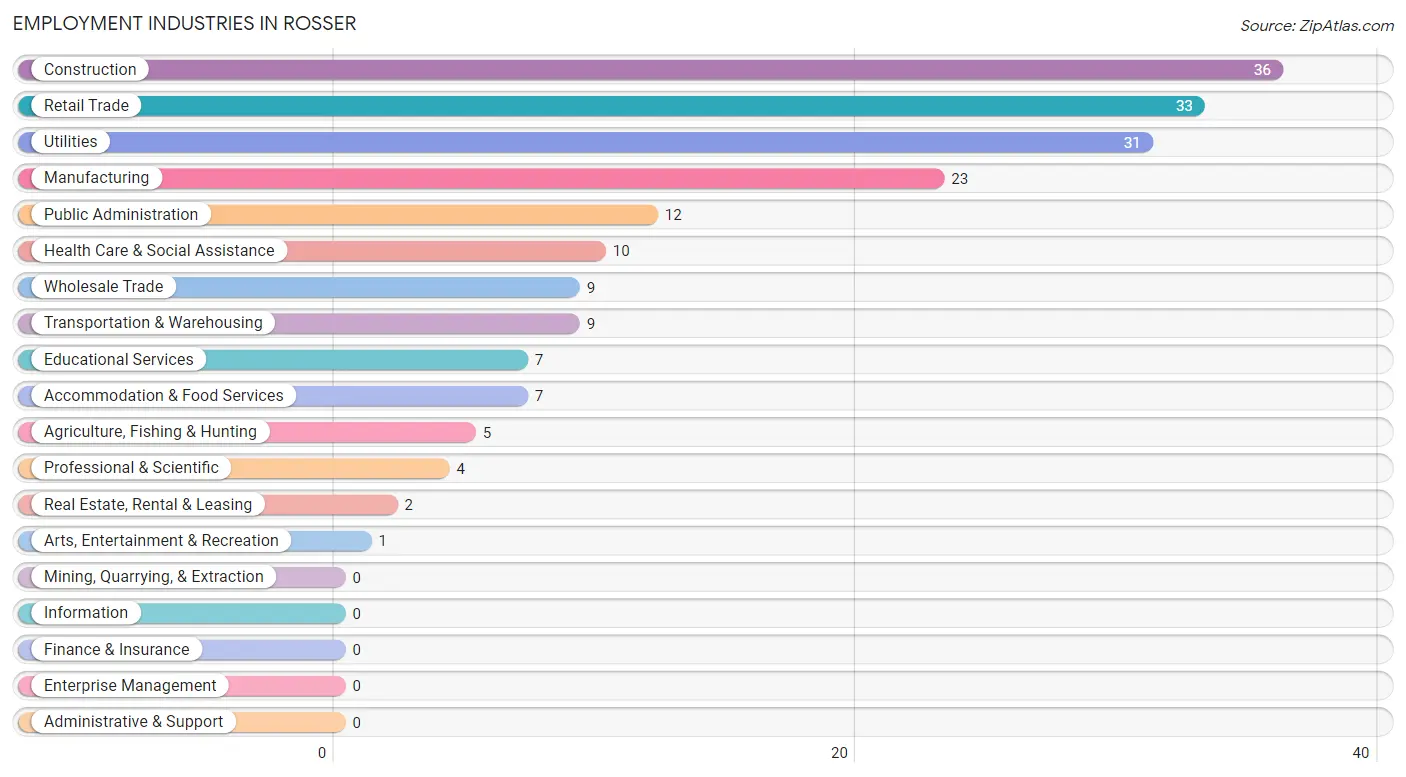
Employment Industries in Rosser
The major employment industries in Rosser include Construction (36 | 18.4%), Retail Trade (33 | 16.8%), Utilities (31 | 15.8%), Manufacturing (23 | 11.7%), and Public Administration (12 | 6.1%).
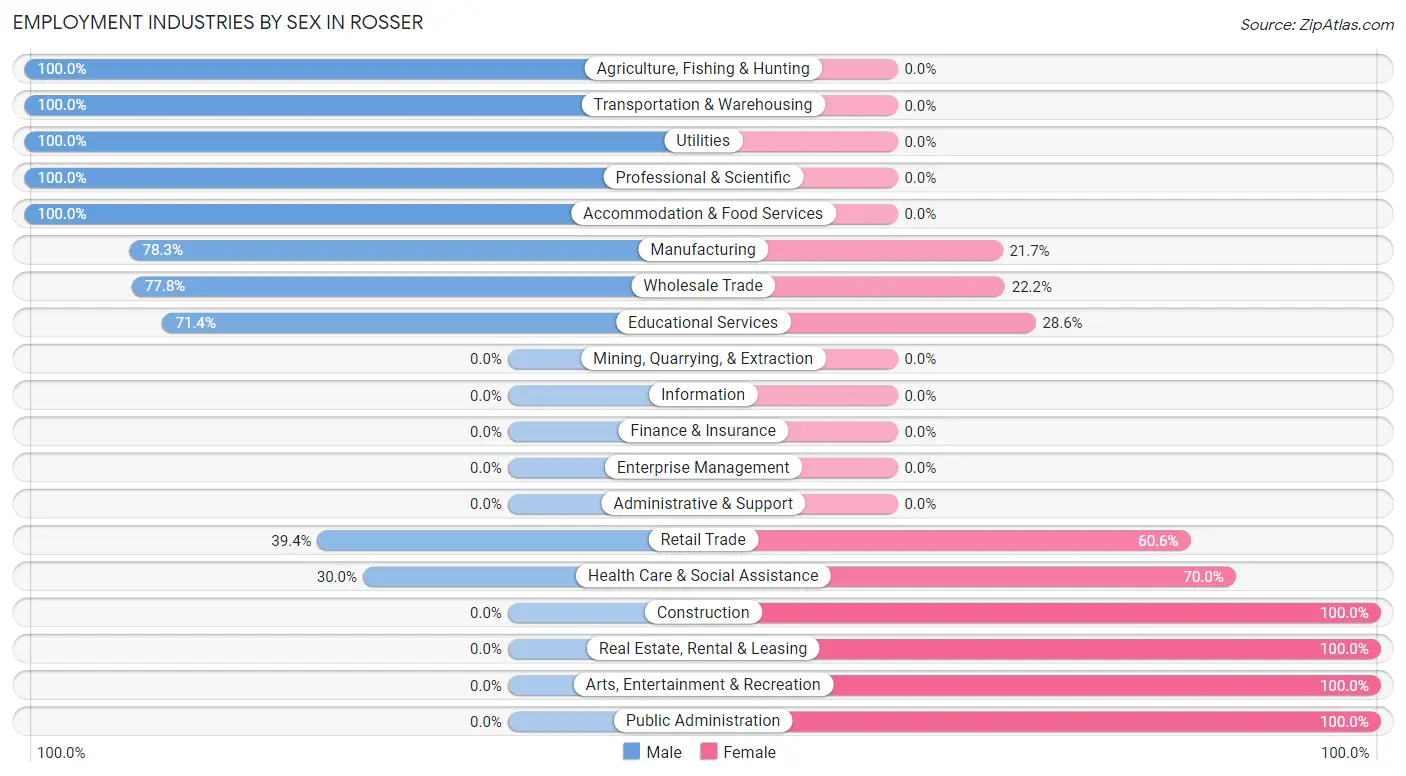
Employment Industries by Sex in Rosser
The Rosser industries that see more men than women are Agriculture, Fishing & Hunting (100.0%), Transportation & Warehousing (100.0%), and Utilities (100.0%), whereas the industries that tend to have a higher number of women are Construction (100.0%), Real Estate, Rental & Leasing (100.0%), and Arts, Entertainment & Recreation (100.0%).
| Industry | Male | Female |
| Agriculture, Fishing & Hunting | 5 (100.0%) | 0 (0.0%) |
| Mining, Quarrying, & Extraction | 0 (0.0%) | 0 (0.0%) |
| Construction | 0 (0.0%) | 36 (100.0%) |
| Manufacturing | 18 (78.3%) | 5 (21.7%) |
| Wholesale Trade | 7 (77.8%) | 2 (22.2%) |
| Retail Trade | 13 (39.4%) | 20 (60.6%) |
| Transportation & Warehousing | 9 (100.0%) | 0 (0.0%) |
| Utilities | 31 (100.0%) | 0 (0.0%) |
| Information | 0 (0.0%) | 0 (0.0%) |
| Finance & Insurance | 0 (0.0%) | 0 (0.0%) |
| Real Estate, Rental & Leasing | 0 (0.0%) | 2 (100.0%) |
| Professional & Scientific | 4 (100.0%) | 0 (0.0%) |
| Enterprise Management | 0 (0.0%) | 0 (0.0%) |
| Administrative & Support | 0 (0.0%) | 0 (0.0%) |
| Educational Services | 5 (71.4%) | 2 (28.6%) |
| Health Care & Social Assistance | 3 (30.0%) | 7 (70.0%) |
| Arts, Entertainment & Recreation | 0 (0.0%) | 1 (100.0%) |
| Accommodation & Food Services | 7 (100.0%) | 0 (0.0%) |
| Public Administration | 0 (0.0%) | 12 (100.0%) |
| Total | 104 (53.1%) | 92 (46.9%) |
Education in Rosser
School Enrollment in Rosser
The most common levels of schooling among the 136 students in Rosser are kindergarten (53 | 39.0%), college / undergraduate (36 | 26.5%), and middle school (32 | 23.5%).
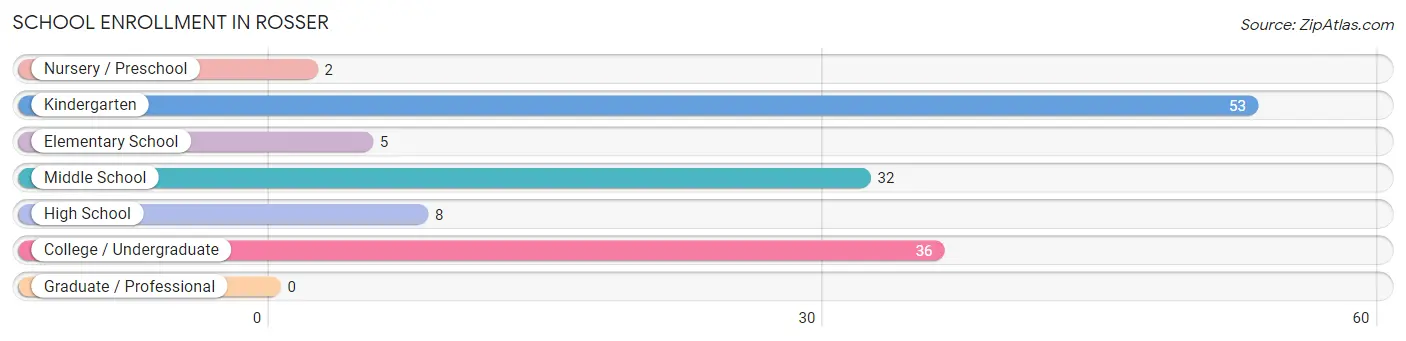
| School Level | # Students | % Students |
| Nursery / Preschool | 2 | 1.5% |
| Kindergarten | 53 | 39.0% |
| Elementary School | 5 | 3.7% |
| Middle School | 32 | 23.5% |
| High School | 8 | 5.9% |
| College / Undergraduate | 36 | 26.5% |
| Graduate / Professional | 0 | 0.0% |
| Total | 136 | 100.0% |
School Enrollment by Age by Funding Source in Rosser
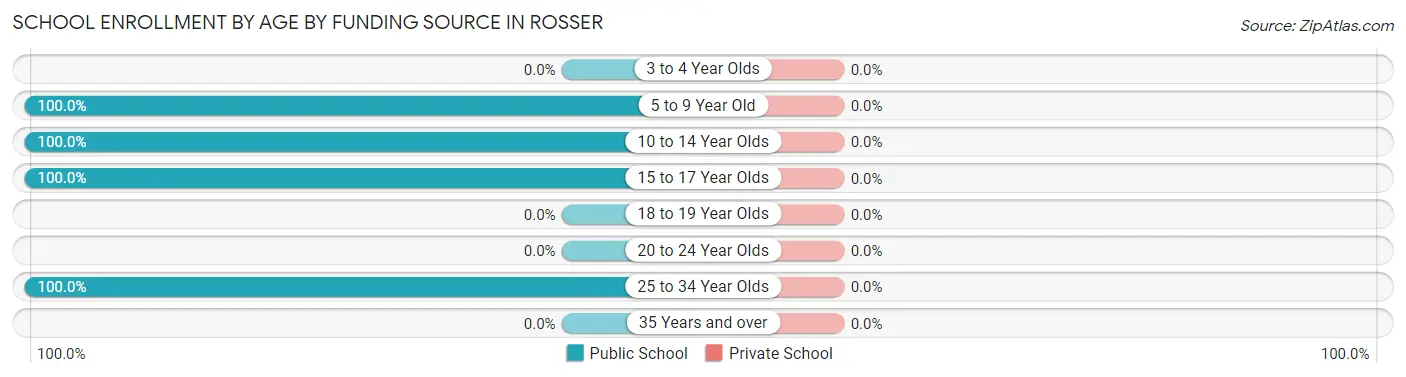
| Age Bracket | Public School | Private School |
| 3 to 4 Year Olds | 0 (0.0%) | 0 (0.0%) |
| 5 to 9 Year Old | 60 (100.0%) | 0 (0.0%) |
| 10 to 14 Year Olds | 34 (100.0%) | 0 (0.0%) |
| 15 to 17 Year Olds | 6 (100.0%) | 0 (0.0%) |
| 18 to 19 Year Olds | 0 (0.0%) | 0 (0.0%) |
| 20 to 24 Year Olds | 0 (0.0%) | 0 (0.0%) |
| 25 to 34 Year Olds | 36 (100.0%) | 0 (0.0%) |
| 35 Years and over | 0 (0.0%) | 0 (0.0%) |
| Total | 136 (100.0%) | 0 (0.0%) |
Educational Attainment by Field of Study in Rosser
Education (10 | 41.7%), business (7 | 29.2%), bio, nature & agricultural (5 | 20.8%), and science & technology (2 | 8.3%) are the most common fields of study among 24 individuals in Rosser who have obtained a bachelor's degree or higher.
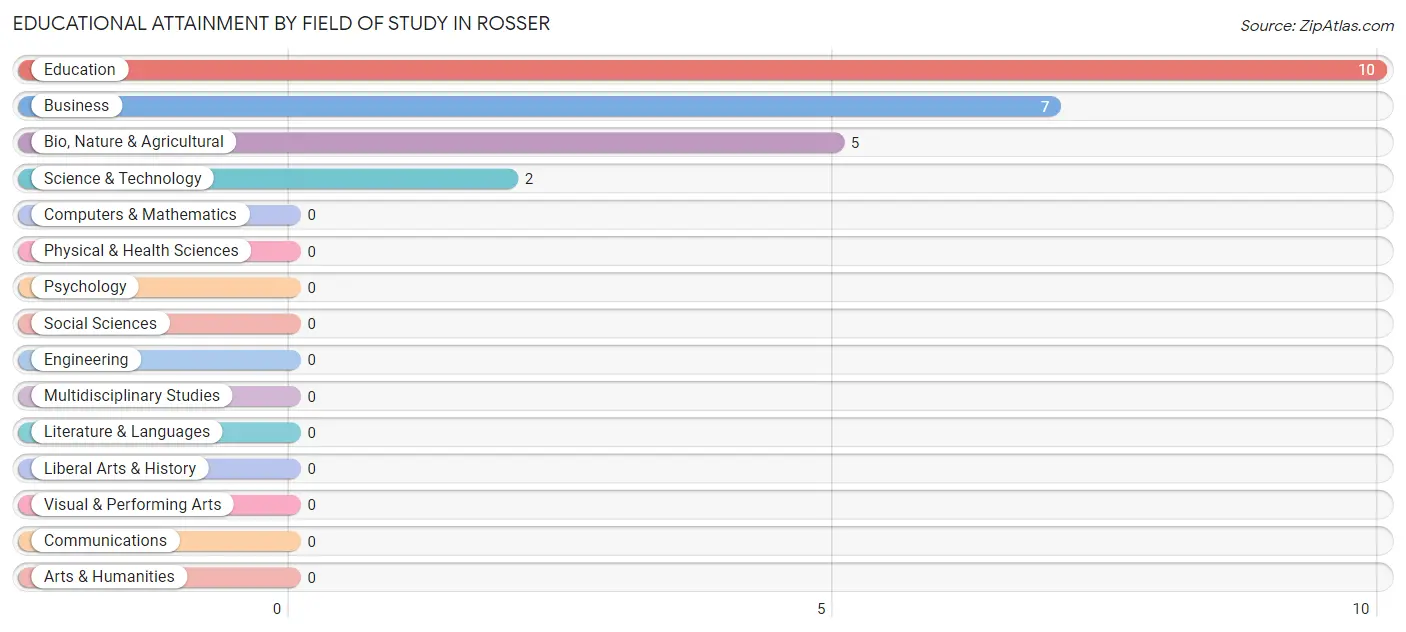
| Field of Study | # Graduates | % Graduates |
| Computers & Mathematics | 0 | 0.0% |
| Bio, Nature & Agricultural | 5 | 20.8% |
| Physical & Health Sciences | 0 | 0.0% |
| Psychology | 0 | 0.0% |
| Social Sciences | 0 | 0.0% |
| Engineering | 0 | 0.0% |
| Multidisciplinary Studies | 0 | 0.0% |
| Science & Technology | 2 | 8.3% |
| Business | 7 | 29.2% |
| Education | 10 | 41.7% |
| Literature & Languages | 0 | 0.0% |
| Liberal Arts & History | 0 | 0.0% |
| Visual & Performing Arts | 0 | 0.0% |
| Communications | 0 | 0.0% |
| Arts & Humanities | 0 | 0.0% |
| Total | 24 | 100.0% |
Transportation & Commute in Rosser
Vehicle Availability by Sex in Rosser
The most prevalent vehicle ownership categories in Rosser are males with 2 vehicles (54, accounting for 51.9%) and females with 2 vehicles (68, making up 59.3%).
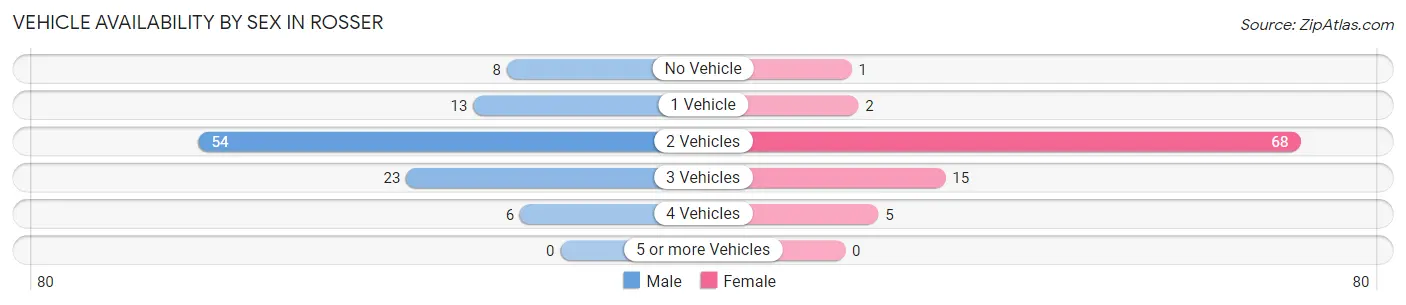
| Vehicles Available | Male | Female |
| No Vehicle | 8 (7.7%) | 1 (1.1%) |
| 1 Vehicle | 13 (12.5%) | 2 (2.2%) |
| 2 Vehicles | 54 (51.9%) | 68 (74.7%) |
| 3 Vehicles | 23 (22.1%) | 15 (16.5%) |
| 4 Vehicles | 6 (5.8%) | 5 (5.5%) |
| 5 or more Vehicles | 0 (0.0%) | 0 (0.0%) |
| Total | 104 (100.0%) | 91 (100.0%) |
Commute Time in Rosser
The most frequently occuring commute durations in Rosser are 35 to 39 minutes (61 commuters, 31.8%), 60 to 89 minutes (44 commuters, 22.9%), and 40 to 44 minutes (22 commuters, 11.5%).
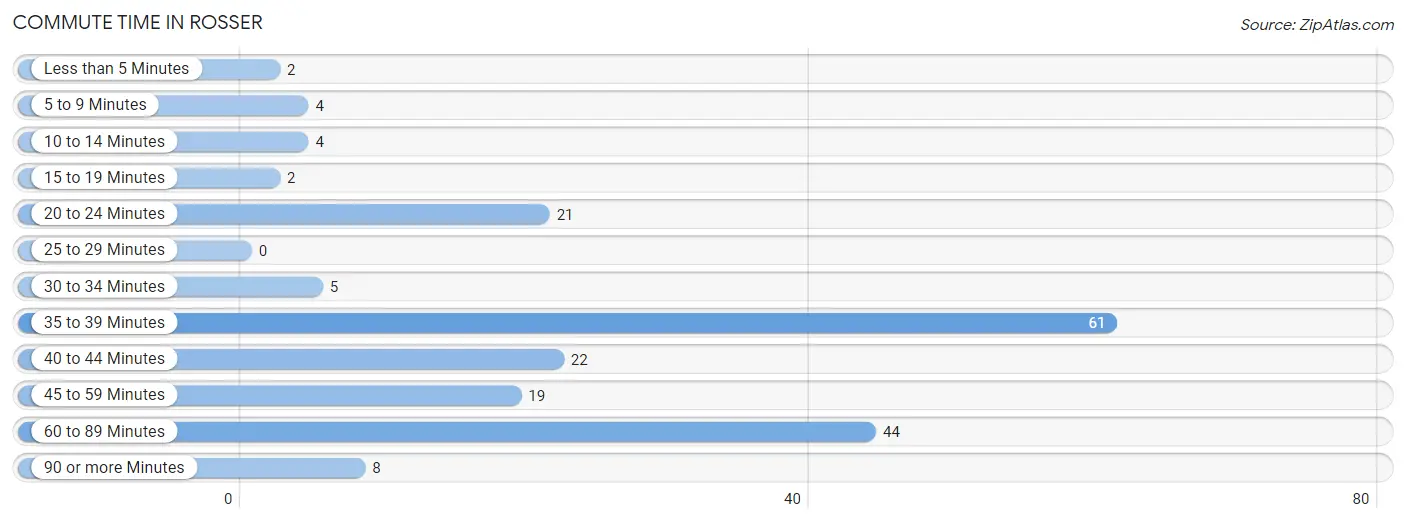
| Commute Time | # Commuters | % Commuters |
| Less than 5 Minutes | 2 | 1.0% |
| 5 to 9 Minutes | 4 | 2.1% |
| 10 to 14 Minutes | 4 | 2.1% |
| 15 to 19 Minutes | 2 | 1.0% |
| 20 to 24 Minutes | 21 | 10.9% |
| 25 to 29 Minutes | 0 | 0.0% |
| 30 to 34 Minutes | 5 | 2.6% |
| 35 to 39 Minutes | 61 | 31.8% |
| 40 to 44 Minutes | 22 | 11.5% |
| 45 to 59 Minutes | 19 | 9.9% |
| 60 to 89 Minutes | 44 | 22.9% |
| 90 or more Minutes | 8 | 4.2% |
Commute Time by Sex in Rosser
The most common commute times in Rosser are 60 to 89 minutes (34 commuters, 33.3%) for males and 35 to 39 minutes (53 commuters, 58.9%) for females.
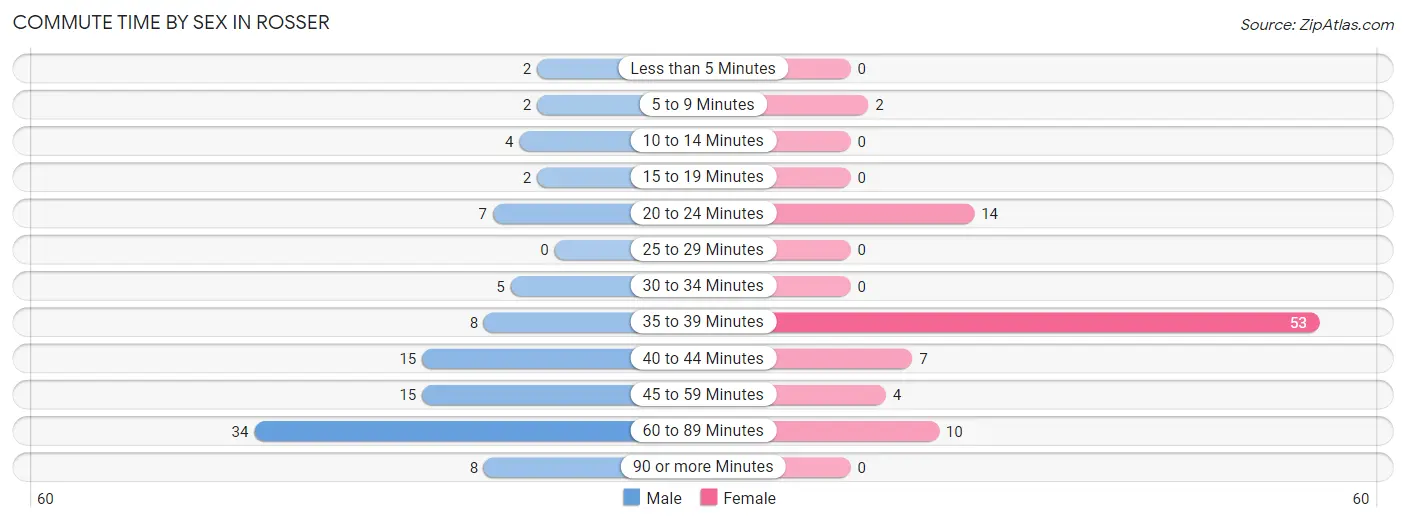
| Commute Time | Male | Female |
| Less than 5 Minutes | 2 (2.0%) | 0 (0.0%) |
| 5 to 9 Minutes | 2 (2.0%) | 2 (2.2%) |
| 10 to 14 Minutes | 4 (3.9%) | 0 (0.0%) |
| 15 to 19 Minutes | 2 (2.0%) | 0 (0.0%) |
| 20 to 24 Minutes | 7 (6.9%) | 14 (15.6%) |
| 25 to 29 Minutes | 0 (0.0%) | 0 (0.0%) |
| 30 to 34 Minutes | 5 (4.9%) | 0 (0.0%) |
| 35 to 39 Minutes | 8 (7.8%) | 53 (58.9%) |
| 40 to 44 Minutes | 15 (14.7%) | 7 (7.8%) |
| 45 to 59 Minutes | 15 (14.7%) | 4 (4.4%) |
| 60 to 89 Minutes | 34 (33.3%) | 10 (11.1%) |
| 90 or more Minutes | 8 (7.8%) | 0 (0.0%) |
Time of Departure to Work by Sex in Rosser
The most frequent times of departure to work in Rosser are 6:00 AM to 6:29 AM (36, 35.3%) for males and 8:00 AM to 8:29 AM (57, 63.3%) for females.
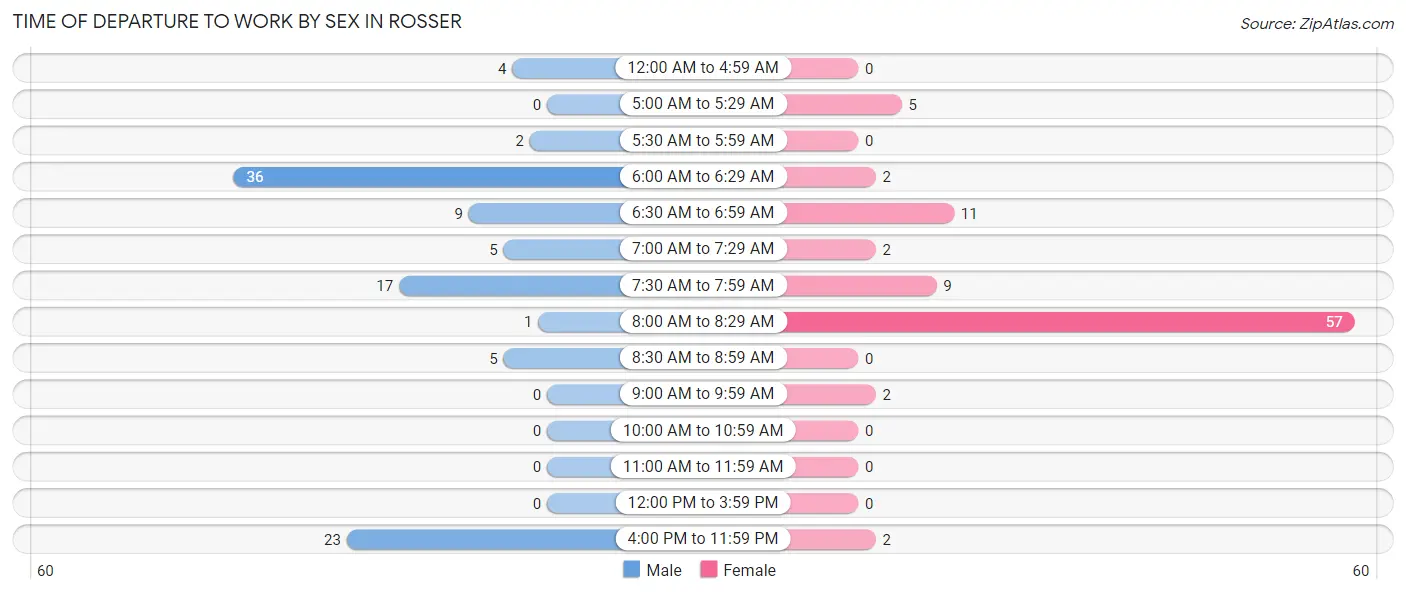
| Time of Departure | Male | Female |
| 12:00 AM to 4:59 AM | 4 (3.9%) | 0 (0.0%) |
| 5:00 AM to 5:29 AM | 0 (0.0%) | 5 (5.6%) |
| 5:30 AM to 5:59 AM | 2 (2.0%) | 0 (0.0%) |
| 6:00 AM to 6:29 AM | 36 (35.3%) | 2 (2.2%) |
| 6:30 AM to 6:59 AM | 9 (8.8%) | 11 (12.2%) |
| 7:00 AM to 7:29 AM | 5 (4.9%) | 2 (2.2%) |
| 7:30 AM to 7:59 AM | 17 (16.7%) | 9 (10.0%) |
| 8:00 AM to 8:29 AM | 1 (1.0%) | 57 (63.3%) |
| 8:30 AM to 8:59 AM | 5 (4.9%) | 0 (0.0%) |
| 9:00 AM to 9:59 AM | 0 (0.0%) | 2 (2.2%) |
| 10:00 AM to 10:59 AM | 0 (0.0%) | 0 (0.0%) |
| 11:00 AM to 11:59 AM | 0 (0.0%) | 0 (0.0%) |
| 12:00 PM to 3:59 PM | 0 (0.0%) | 0 (0.0%) |
| 4:00 PM to 11:59 PM | 23 (22.6%) | 2 (2.2%) |
| Total | 102 (100.0%) | 90 (100.0%) |
Housing Occupancy in Rosser
Occupancy by Ownership in Rosser
Of the total 124 dwellings in Rosser, owner-occupied units account for 90 (72.6%), while renter-occupied units make up 34 (27.4%).
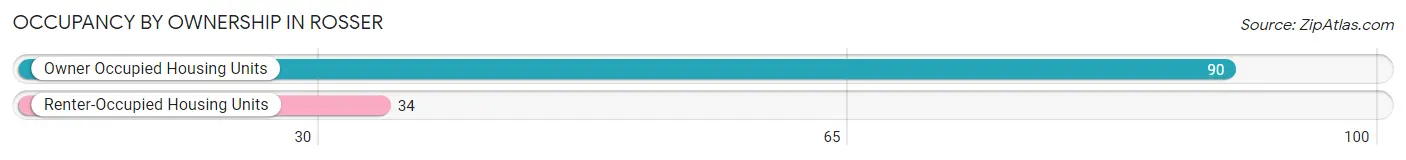
| Occupancy | # Housing Units | % Housing Units |
| Owner Occupied Housing Units | 90 | 72.6% |
| Renter-Occupied Housing Units | 34 | 27.4% |
| Total Occupied Housing Units | 124 | 100.0% |
Occupancy by Household Size in Rosser
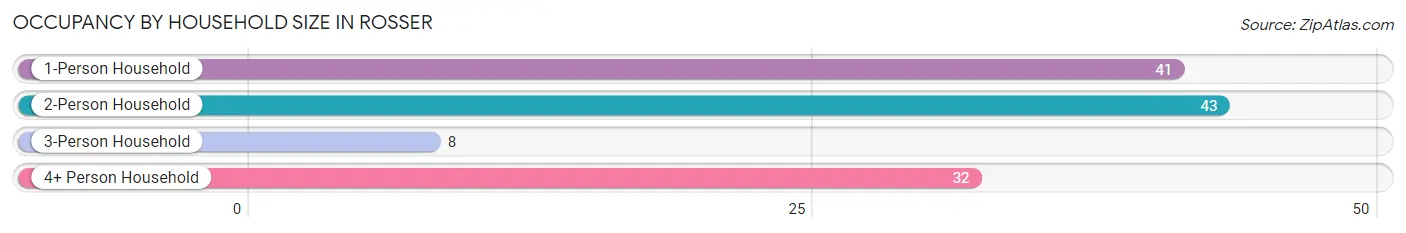
| Household Size | # Housing Units | % Housing Units |
| 1-Person Household | 41 | 33.1% |
| 2-Person Household | 43 | 34.7% |
| 3-Person Household | 8 | 6.5% |
| 4+ Person Household | 32 | 25.8% |
| Total Housing Units | 124 | 100.0% |
Occupancy by Ownership by Household Size in Rosser
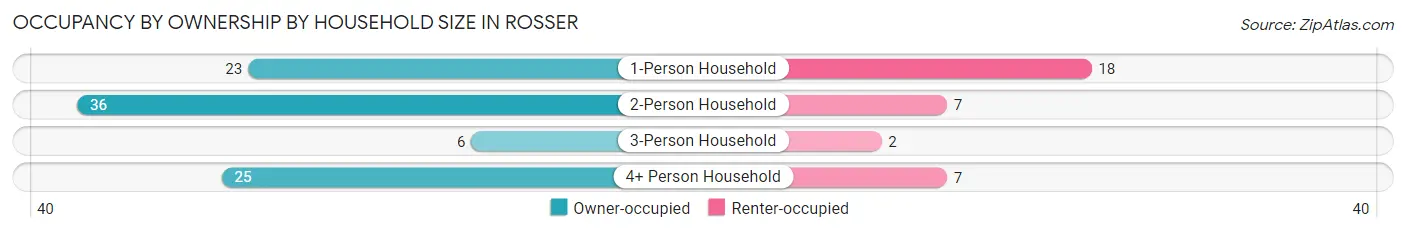
| Household Size | Owner-occupied | Renter-occupied |
| 1-Person Household | 23 (56.1%) | 18 (43.9%) |
| 2-Person Household | 36 (83.7%) | 7 (16.3%) |
| 3-Person Household | 6 (75.0%) | 2 (25.0%) |
| 4+ Person Household | 25 (78.1%) | 7 (21.9%) |
| Total Housing Units | 90 (72.6%) | 34 (27.4%) |
Occupancy by Educational Attainment in Rosser
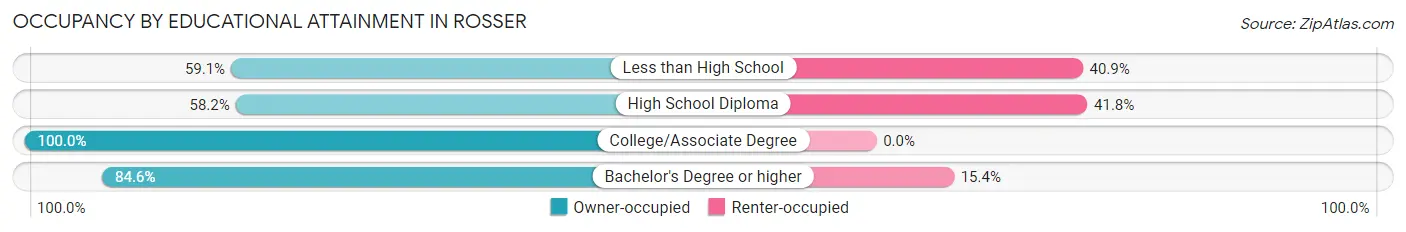
| Household Size | Owner-occupied | Renter-occupied |
| Less than High School | 13 (59.1%) | 9 (40.9%) |
| High School Diploma | 32 (58.2%) | 23 (41.8%) |
| College/Associate Degree | 34 (100.0%) | 0 (0.0%) |
| Bachelor's Degree or higher | 11 (84.6%) | 2 (15.4%) |
Occupancy by Age of Householder in Rosser
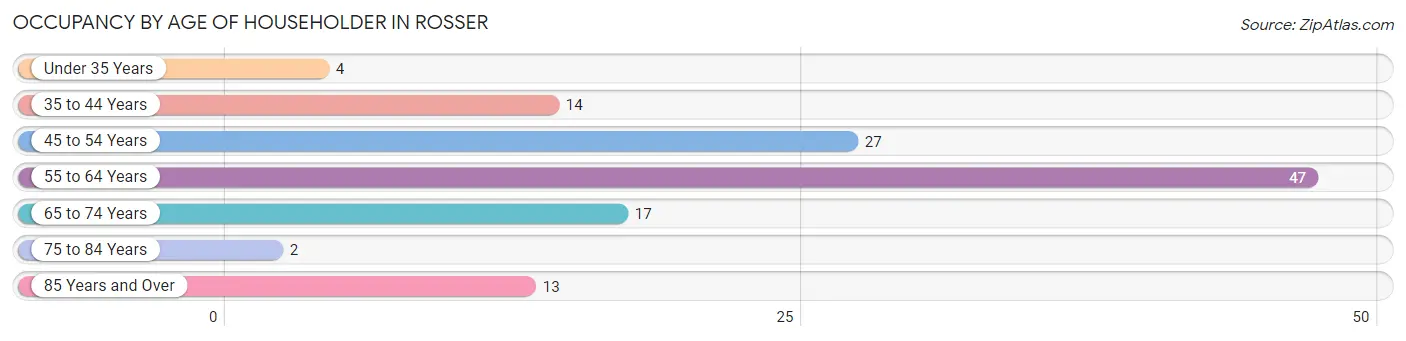
| Age Bracket | # Households | % Households |
| Under 35 Years | 4 | 3.2% |
| 35 to 44 Years | 14 | 11.3% |
| 45 to 54 Years | 27 | 21.8% |
| 55 to 64 Years | 47 | 37.9% |
| 65 to 74 Years | 17 | 13.7% |
| 75 to 84 Years | 2 | 1.6% |
| 85 Years and Over | 13 | 10.5% |
| Total | 124 | 100.0% |
Housing Finances in Rosser
Median Income by Occupancy in Rosser
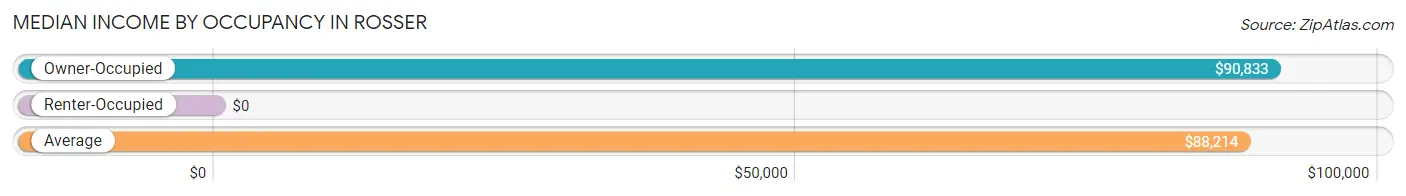
| Occupancy Type | # Households | Median Income |
| Owner-Occupied | 90 (72.6%) | $90,833 |
| Renter-Occupied | 34 (27.4%) | $0 |
| Average | 124 (100.0%) | $88,214 |
Occupancy by Householder Income Bracket in Rosser
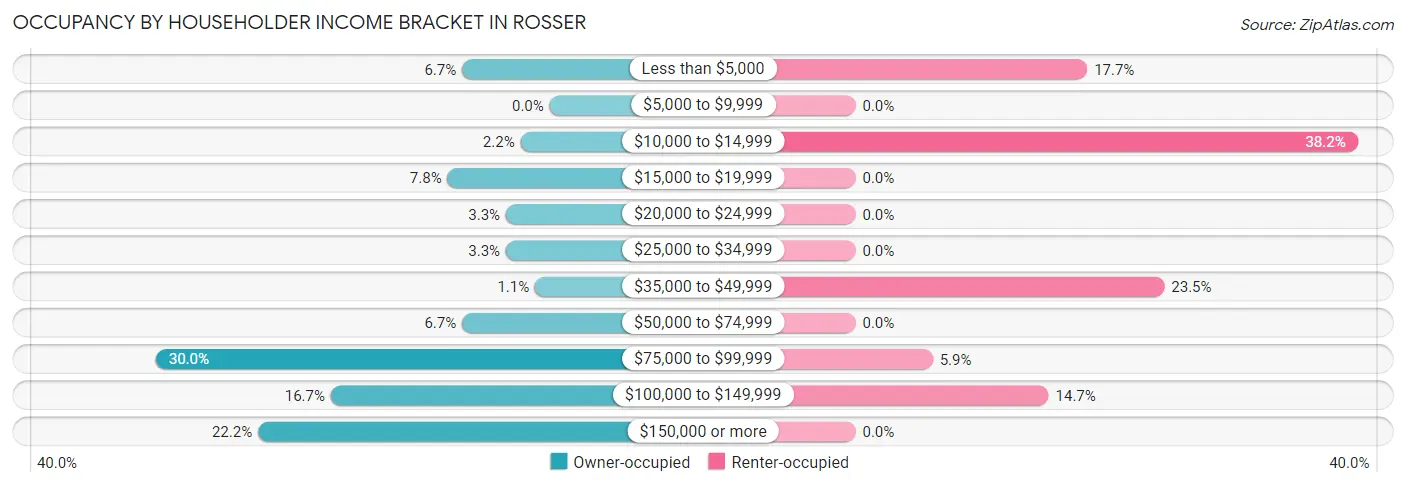
| Income Bracket | Owner-occupied | Renter-occupied |
| Less than $5,000 | 6 (6.7%) | 6 (17.6%) |
| $5,000 to $9,999 | 0 (0.0%) | 0 (0.0%) |
| $10,000 to $14,999 | 2 (2.2%) | 13 (38.2%) |
| $15,000 to $19,999 | 7 (7.8%) | 0 (0.0%) |
| $20,000 to $24,999 | 3 (3.3%) | 0 (0.0%) |
| $25,000 to $34,999 | 3 (3.3%) | 0 (0.0%) |
| $35,000 to $49,999 | 1 (1.1%) | 8 (23.5%) |
| $50,000 to $74,999 | 6 (6.7%) | 0 (0.0%) |
| $75,000 to $99,999 | 27 (30.0%) | 2 (5.9%) |
| $100,000 to $149,999 | 15 (16.7%) | 5 (14.7%) |
| $150,000 or more | 20 (22.2%) | 0 (0.0%) |
| Total | 90 (100.0%) | 34 (100.0%) |
Monthly Housing Cost Tiers in Rosser
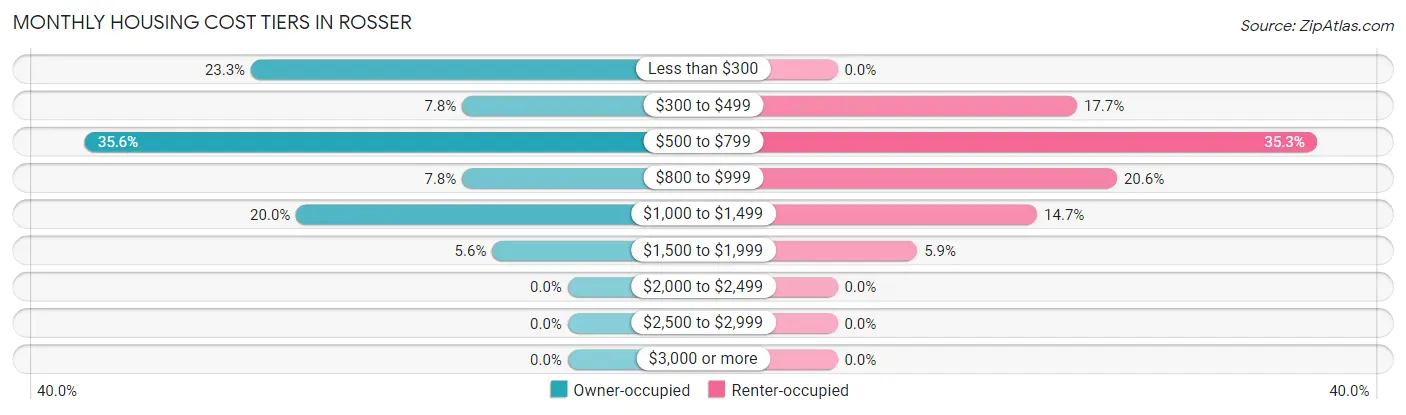
| Monthly Cost | Owner-occupied | Renter-occupied |
| Less than $300 | 21 (23.3%) | 0 (0.0%) |
| $300 to $499 | 7 (7.8%) | 6 (17.6%) |
| $500 to $799 | 32 (35.6%) | 12 (35.3%) |
| $800 to $999 | 7 (7.8%) | 7 (20.6%) |
| $1,000 to $1,499 | 18 (20.0%) | 5 (14.7%) |
| $1,500 to $1,999 | 5 (5.6%) | 2 (5.9%) |
| $2,000 to $2,499 | 0 (0.0%) | 0 (0.0%) |
| $2,500 to $2,999 | 0 (0.0%) | 0 (0.0%) |
| $3,000 or more | 0 (0.0%) | 0 (0.0%) |
| Total | 90 (100.0%) | 34 (100.0%) |
Physical Housing Characteristics in Rosser
Housing Structures in Rosser
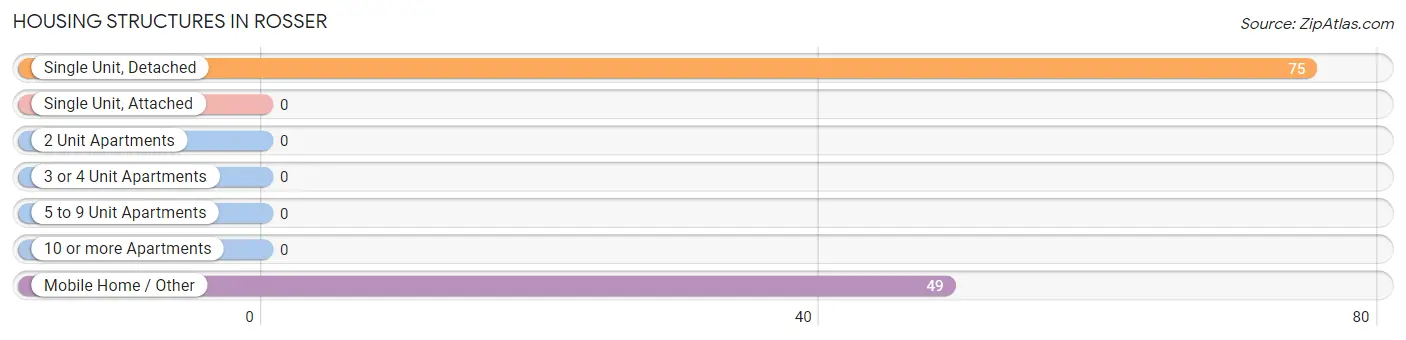
| Structure Type | # Housing Units | % Housing Units |
| Single Unit, Detached | 75 | 60.5% |
| Single Unit, Attached | 0 | 0.0% |
| 2 Unit Apartments | 0 | 0.0% |
| 3 or 4 Unit Apartments | 0 | 0.0% |
| 5 to 9 Unit Apartments | 0 | 0.0% |
| 10 or more Apartments | 0 | 0.0% |
| Mobile Home / Other | 49 | 39.5% |
| Total | 124 | 100.0% |
Housing Structures by Occupancy in Rosser
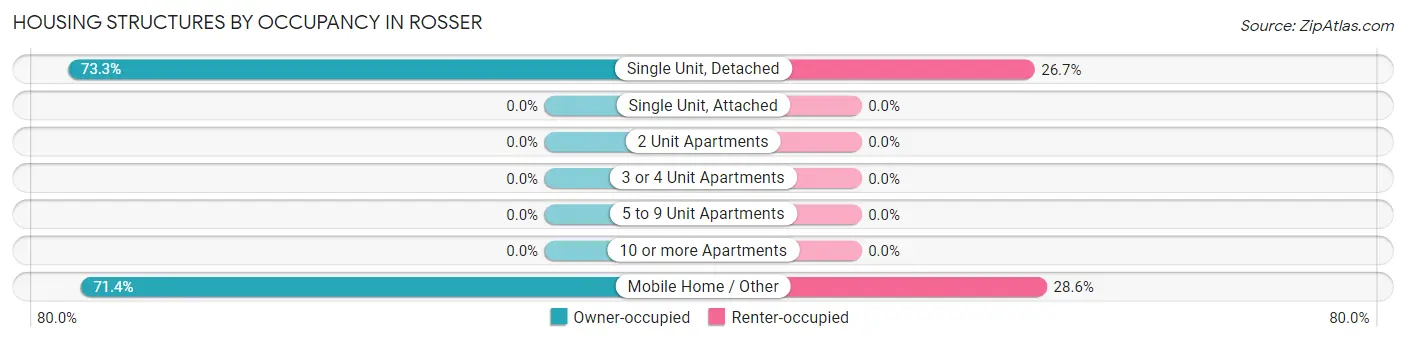
| Structure Type | Owner-occupied | Renter-occupied |
| Single Unit, Detached | 55 (73.3%) | 20 (26.7%) |
| Single Unit, Attached | 0 (0.0%) | 0 (0.0%) |
| 2 Unit Apartments | 0 (0.0%) | 0 (0.0%) |
| 3 or 4 Unit Apartments | 0 (0.0%) | 0 (0.0%) |
| 5 to 9 Unit Apartments | 0 (0.0%) | 0 (0.0%) |
| 10 or more Apartments | 0 (0.0%) | 0 (0.0%) |
| Mobile Home / Other | 35 (71.4%) | 14 (28.6%) |
| Total | 90 (72.6%) | 34 (27.4%) |
Housing Structures by Number of Rooms in Rosser
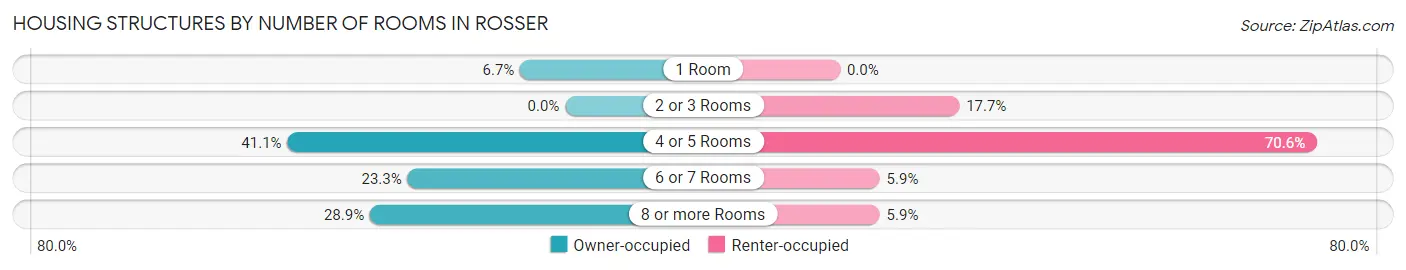
| Number of Rooms | Owner-occupied | Renter-occupied |
| 1 Room | 6 (6.7%) | 0 (0.0%) |
| 2 or 3 Rooms | 0 (0.0%) | 6 (17.6%) |
| 4 or 5 Rooms | 37 (41.1%) | 24 (70.6%) |
| 6 or 7 Rooms | 21 (23.3%) | 2 (5.9%) |
| 8 or more Rooms | 26 (28.9%) | 2 (5.9%) |
| Total | 90 (100.0%) | 34 (100.0%) |
Housing Structure by Heating Type in Rosser
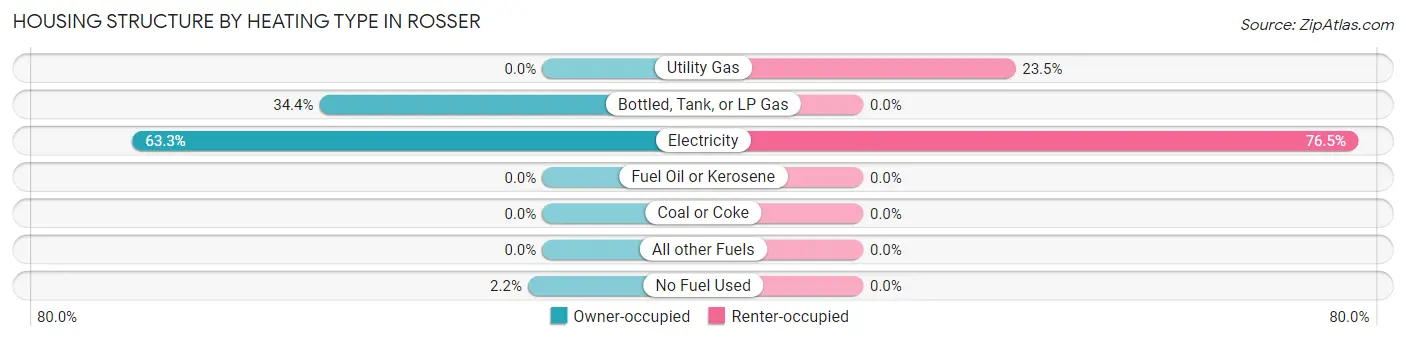
| Heating Type | Owner-occupied | Renter-occupied |
| Utility Gas | 0 (0.0%) | 8 (23.5%) |
| Bottled, Tank, or LP Gas | 31 (34.4%) | 0 (0.0%) |
| Electricity | 57 (63.3%) | 26 (76.5%) |
| Fuel Oil or Kerosene | 0 (0.0%) | 0 (0.0%) |
| Coal or Coke | 0 (0.0%) | 0 (0.0%) |
| All other Fuels | 0 (0.0%) | 0 (0.0%) |
| No Fuel Used | 2 (2.2%) | 0 (0.0%) |
| Total | 90 (100.0%) | 34 (100.0%) |
Household Vehicle Usage in Rosser
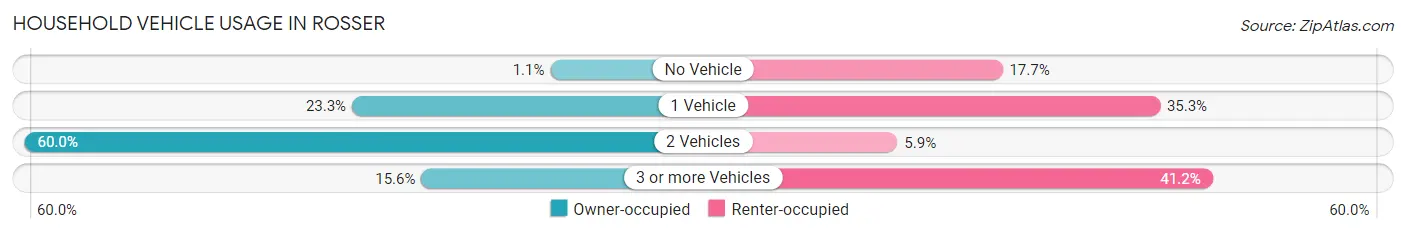
| Vehicles per Household | Owner-occupied | Renter-occupied |
| No Vehicle | 1 (1.1%) | 6 (17.6%) |
| 1 Vehicle | 21 (23.3%) | 12 (35.3%) |
| 2 Vehicles | 54 (60.0%) | 2 (5.9%) |
| 3 or more Vehicles | 14 (15.6%) | 14 (41.2%) |
| Total | 90 (100.0%) | 34 (100.0%) |
Real Estate & Mortgages in Rosser
Real Estate and Mortgage Overview in Rosser
| Characteristic | Without Mortgage | With Mortgage |
| Housing Units | 66 | 24 |
| Median Property Value | - | - |
| Median Household Income | $90,500 | $2 |
| Monthly Housing Costs | $525 | $0 |
| Real Estate Taxes | $1,110 | $0 |
Property Value by Mortgage Status in Rosser
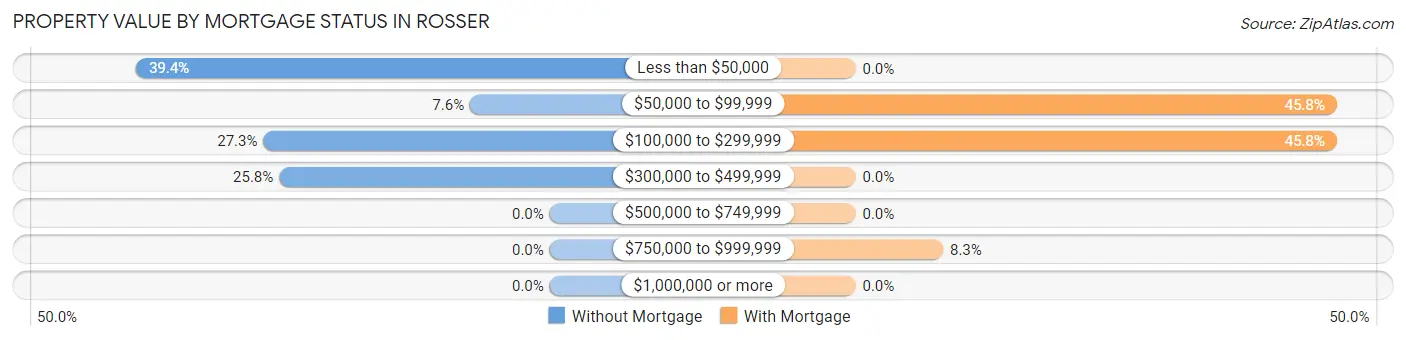
| Property Value | Without Mortgage | With Mortgage |
| Less than $50,000 | 26 (39.4%) | 0 (0.0%) |
| $50,000 to $99,999 | 5 (7.6%) | 11 (45.8%) |
| $100,000 to $299,999 | 18 (27.3%) | 11 (45.8%) |
| $300,000 to $499,999 | 17 (25.8%) | 0 (0.0%) |
| $500,000 to $749,999 | 0 (0.0%) | 0 (0.0%) |
| $750,000 to $999,999 | 0 (0.0%) | 2 (8.3%) |
| $1,000,000 or more | 0 (0.0%) | 0 (0.0%) |
| Total | 66 (100.0%) | 24 (100.0%) |
Household Income by Mortgage Status in Rosser
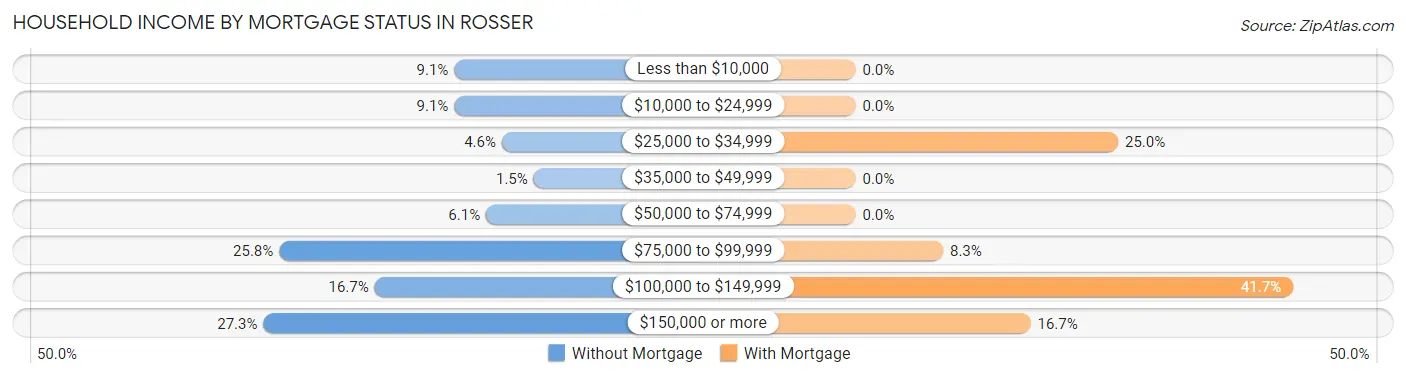
| Household Income | Without Mortgage | With Mortgage |
| Less than $10,000 | 6 (9.1%) | 0 (0.0%) |
| $10,000 to $24,999 | 6 (9.1%) | 0 (0.0%) |
| $25,000 to $34,999 | 3 (4.5%) | 6 (25.0%) |
| $35,000 to $49,999 | 1 (1.5%) | 0 (0.0%) |
| $50,000 to $74,999 | 4 (6.1%) | 0 (0.0%) |
| $75,000 to $99,999 | 17 (25.8%) | 2 (8.3%) |
| $100,000 to $149,999 | 11 (16.7%) | 10 (41.7%) |
| $150,000 or more | 18 (27.3%) | 4 (16.7%) |
| Total | 66 (100.0%) | 24 (100.0%) |
Property Value to Household Income Ratio in Rosser
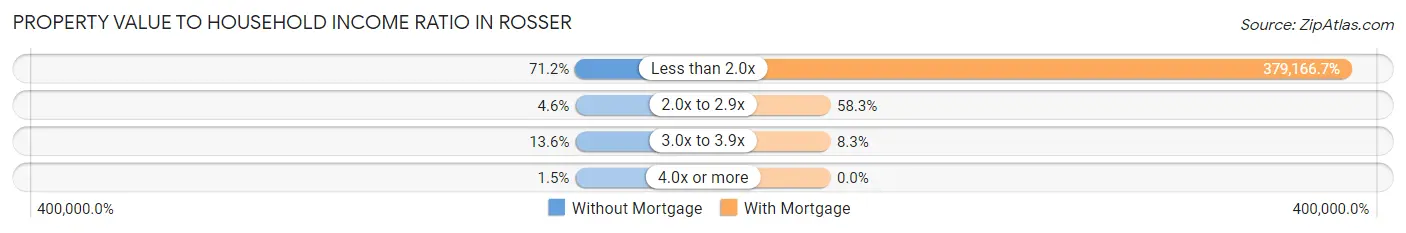
| Value-to-Income Ratio | Without Mortgage | With Mortgage |
| Less than 2.0x | 47 (71.2%) | 91,000 (379,166.7%) |
| 2.0x to 2.9x | 3 (4.5%) | 14 (58.3%) |
| 3.0x to 3.9x | 9 (13.6%) | 2 (8.3%) |
| 4.0x or more | 1 (1.5%) | 0 (0.0%) |
| Total | 66 (100.0%) | 24 (100.0%) |
Real Estate Taxes by Mortgage Status in Rosser
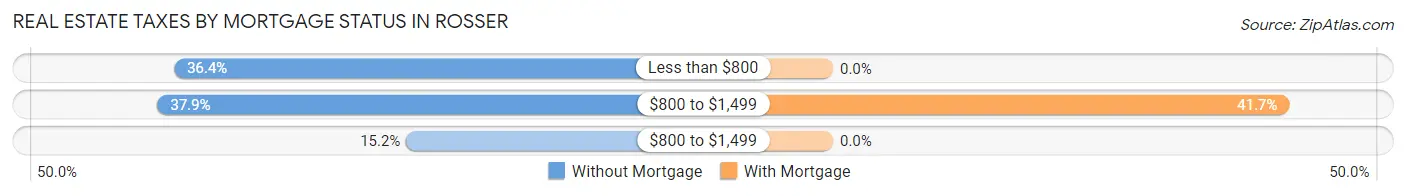
| Property Taxes | Without Mortgage | With Mortgage |
| Less than $800 | 24 (36.4%) | 0 (0.0%) |
| $800 to $1,499 | 25 (37.9%) | 10 (41.7%) |
| $800 to $1,499 | 10 (15.1%) | 0 (0.0%) |
| Total | 66 (100.0%) | 24 (100.0%) |
Health & Disability in Rosser
Health Insurance Coverage by Age in Rosser
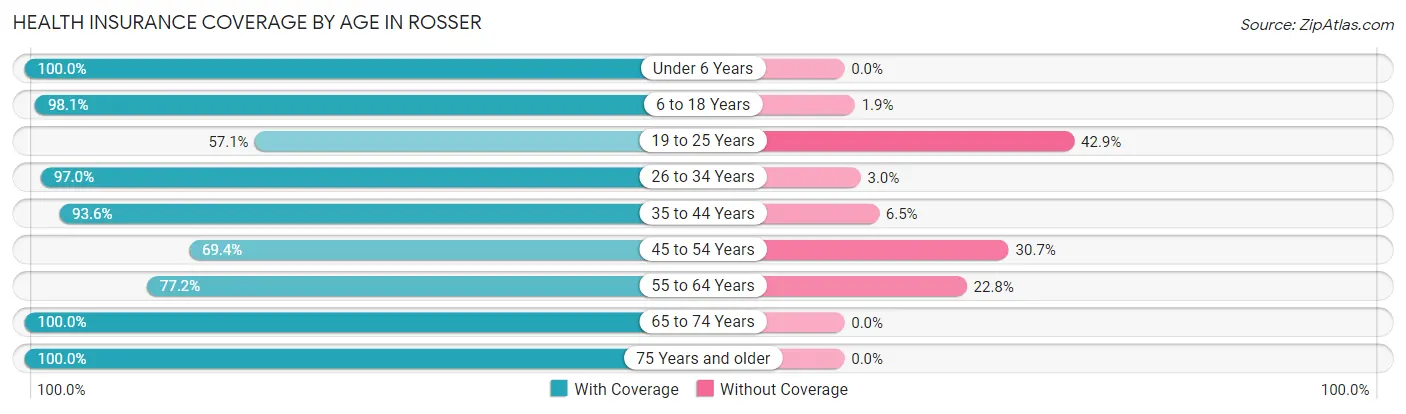
| Age Bracket | With Coverage | Without Coverage |
| Under 6 Years | 18 (100.0%) | 0 (0.0%) |
| 6 to 18 Years | 101 (98.1%) | 2 (1.9%) |
| 19 to 25 Years | 4 (57.1%) | 3 (42.9%) |
| 26 to 34 Years | 64 (97.0%) | 2 (3.0%) |
| 35 to 44 Years | 58 (93.5%) | 4 (6.5%) |
| 45 to 54 Years | 43 (69.4%) | 19 (30.6%) |
| 55 to 64 Years | 44 (77.2%) | 13 (22.8%) |
| 65 to 74 Years | 41 (100.0%) | 0 (0.0%) |
| 75 Years and older | 21 (100.0%) | 0 (0.0%) |
| Total | 394 (90.2%) | 43 (9.8%) |
Health Insurance Coverage by Citizenship Status in Rosser
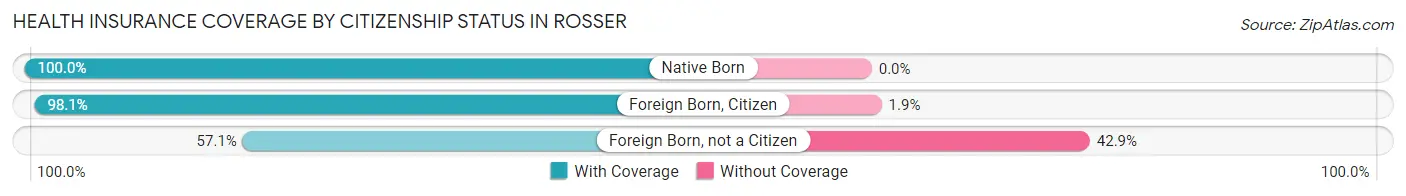
| Citizenship Status | With Coverage | Without Coverage |
| Native Born | 18 (100.0%) | 0 (0.0%) |
| Foreign Born, Citizen | 101 (98.1%) | 2 (1.9%) |
| Foreign Born, not a Citizen | 4 (57.1%) | 3 (42.9%) |
Health Insurance Coverage by Household Income in Rosser
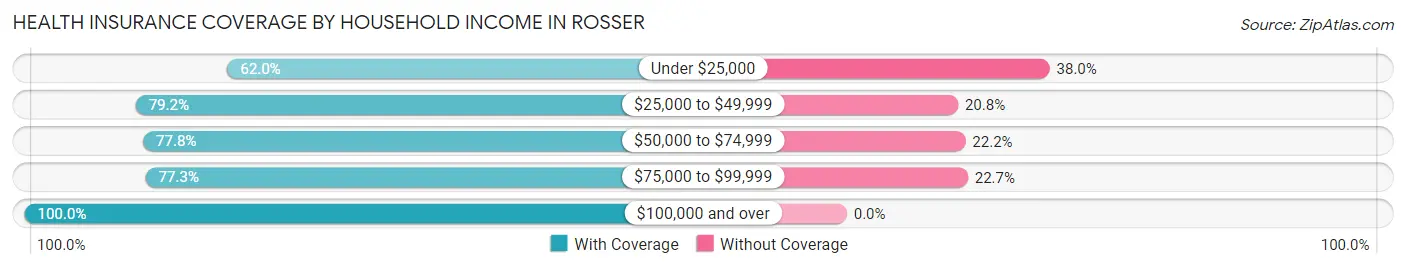
| Household Income | With Coverage | Without Coverage |
| Under $25,000 | 31 (62.0%) | 19 (38.0%) |
| $25,000 to $49,999 | 19 (79.2%) | 5 (20.8%) |
| $50,000 to $74,999 | 7 (77.8%) | 2 (22.2%) |
| $75,000 to $99,999 | 58 (77.3%) | 17 (22.7%) |
| $100,000 and over | 279 (100.0%) | 0 (0.0%) |
Public vs Private Health Insurance Coverage by Age in Rosser
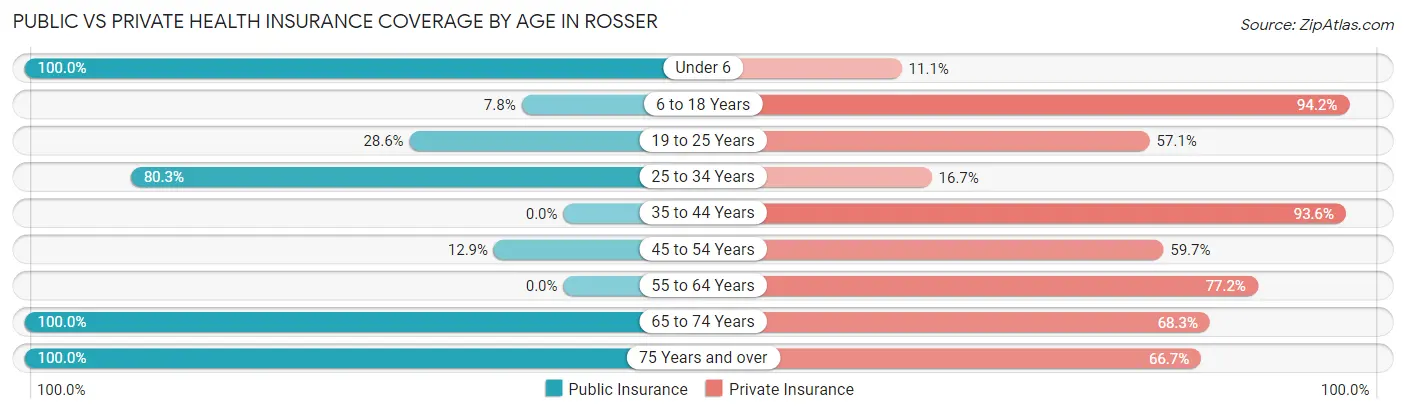
| Age Bracket | Public Insurance | Private Insurance |
| Under 6 | 18 (100.0%) | 2 (11.1%) |
| 6 to 18 Years | 8 (7.8%) | 97 (94.2%) |
| 19 to 25 Years | 2 (28.6%) | 4 (57.1%) |
| 25 to 34 Years | 53 (80.3%) | 11 (16.7%) |
| 35 to 44 Years | 0 (0.0%) | 58 (93.5%) |
| 45 to 54 Years | 8 (12.9%) | 37 (59.7%) |
| 55 to 64 Years | 0 (0.0%) | 44 (77.2%) |
| 65 to 74 Years | 41 (100.0%) | 28 (68.3%) |
| 75 Years and over | 21 (100.0%) | 14 (66.7%) |
| Total | 151 (34.5%) | 295 (67.5%) |
Disability Status by Sex by Age in Rosser
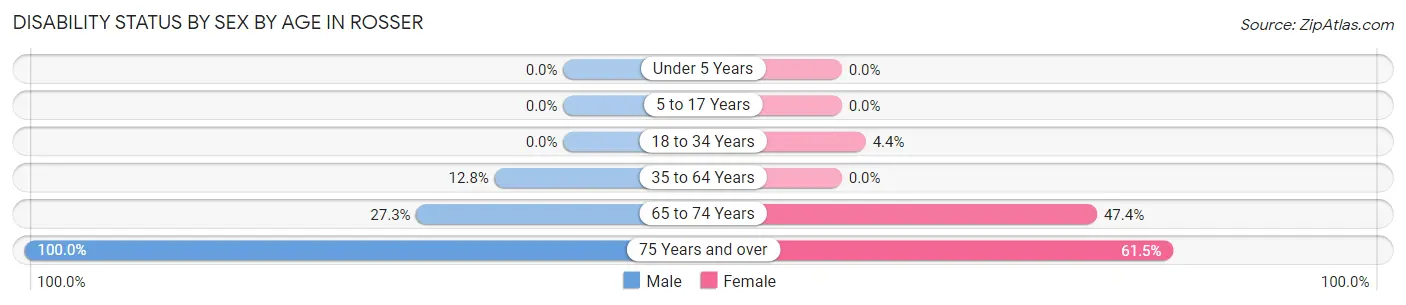
| Age Bracket | Male | Female |
| Under 5 Years | 0 (0.0%) | 0 (0.0%) |
| 5 to 17 Years | 0 (0.0%) | 0 (0.0%) |
| 18 to 34 Years | 0 (0.0%) | 2 (4.4%) |
| 35 to 64 Years | 13 (12.8%) | 0 (0.0%) |
| 65 to 74 Years | 6 (27.3%) | 9 (47.4%) |
| 75 Years and over | 8 (100.0%) | 8 (61.5%) |
Disability Class by Sex by Age in Rosser
Disability Class: Hearing Difficulty
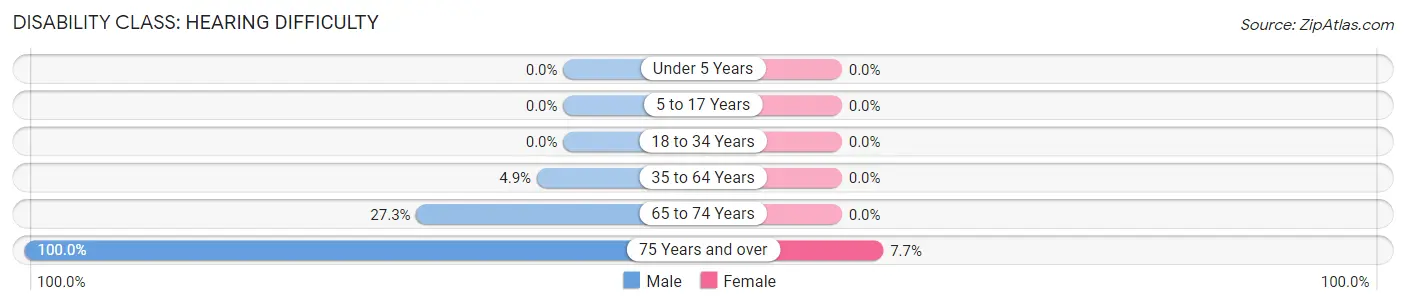
| Age Bracket | Male | Female |
| Under 5 Years | 0 (0.0%) | 0 (0.0%) |
| 5 to 17 Years | 0 (0.0%) | 0 (0.0%) |
| 18 to 34 Years | 0 (0.0%) | 0 (0.0%) |
| 35 to 64 Years | 5 (4.9%) | 0 (0.0%) |
| 65 to 74 Years | 6 (27.3%) | 0 (0.0%) |
| 75 Years and over | 8 (100.0%) | 1 (7.7%) |
Disability Class: Vision Difficulty
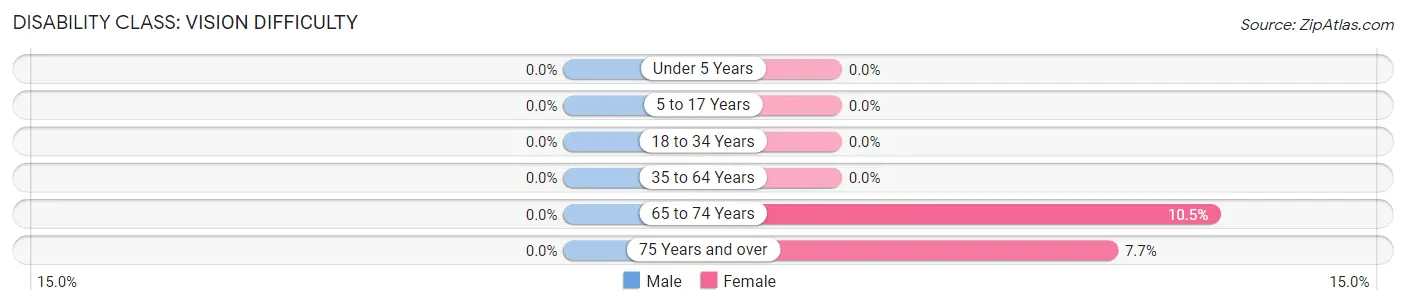
| Age Bracket | Male | Female |
| Under 5 Years | 0 (0.0%) | 0 (0.0%) |
| 5 to 17 Years | 0 (0.0%) | 0 (0.0%) |
| 18 to 34 Years | 0 (0.0%) | 0 (0.0%) |
| 35 to 64 Years | 0 (0.0%) | 0 (0.0%) |
| 65 to 74 Years | 0 (0.0%) | 2 (10.5%) |
| 75 Years and over | 0 (0.0%) | 1 (7.7%) |
Disability Class: Cognitive Difficulty
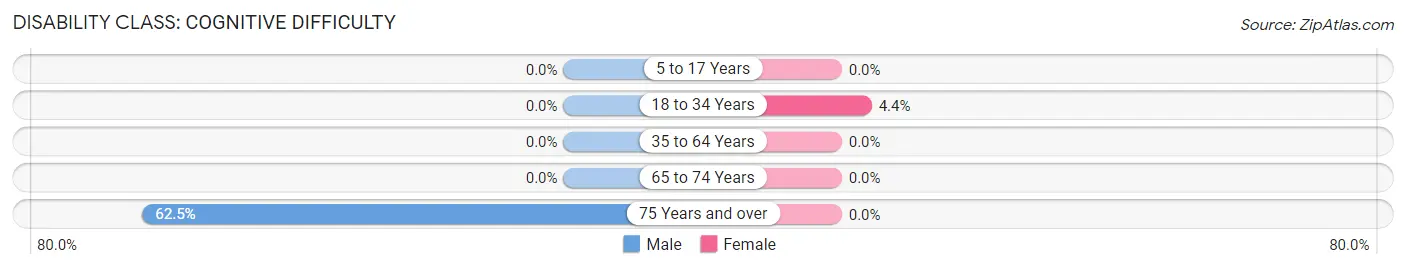
| Age Bracket | Male | Female |
| 5 to 17 Years | 0 (0.0%) | 0 (0.0%) |
| 18 to 34 Years | 0 (0.0%) | 2 (4.4%) |
| 35 to 64 Years | 0 (0.0%) | 0 (0.0%) |
| 65 to 74 Years | 0 (0.0%) | 0 (0.0%) |
| 75 Years and over | 5 (62.5%) | 0 (0.0%) |
Disability Class: Ambulatory Difficulty
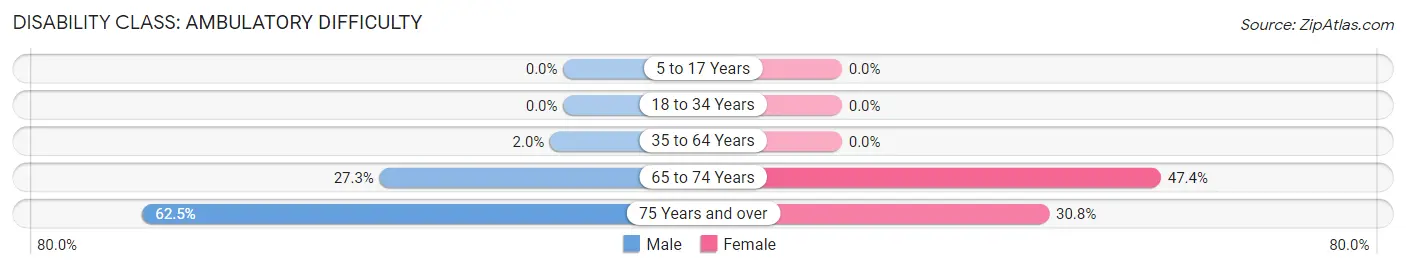
| Age Bracket | Male | Female |
| 5 to 17 Years | 0 (0.0%) | 0 (0.0%) |
| 18 to 34 Years | 0 (0.0%) | 0 (0.0%) |
| 35 to 64 Years | 2 (2.0%) | 0 (0.0%) |
| 65 to 74 Years | 6 (27.3%) | 9 (47.4%) |
| 75 Years and over | 5 (62.5%) | 4 (30.8%) |
Disability Class: Self-Care Difficulty
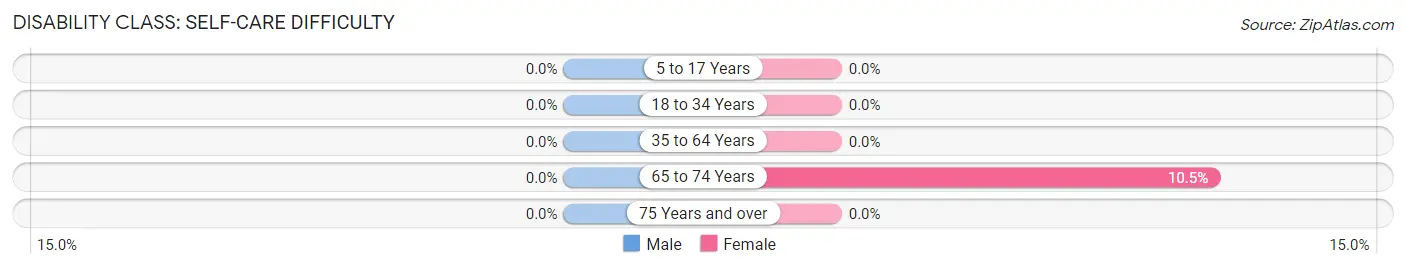
| Age Bracket | Male | Female |
| 5 to 17 Years | 0 (0.0%) | 0 (0.0%) |
| 18 to 34 Years | 0 (0.0%) | 0 (0.0%) |
| 35 to 64 Years | 0 (0.0%) | 0 (0.0%) |
| 65 to 74 Years | 0 (0.0%) | 2 (10.5%) |
| 75 Years and over | 0 (0.0%) | 0 (0.0%) |
Technology Access in Rosser
Computing Device Access in Rosser
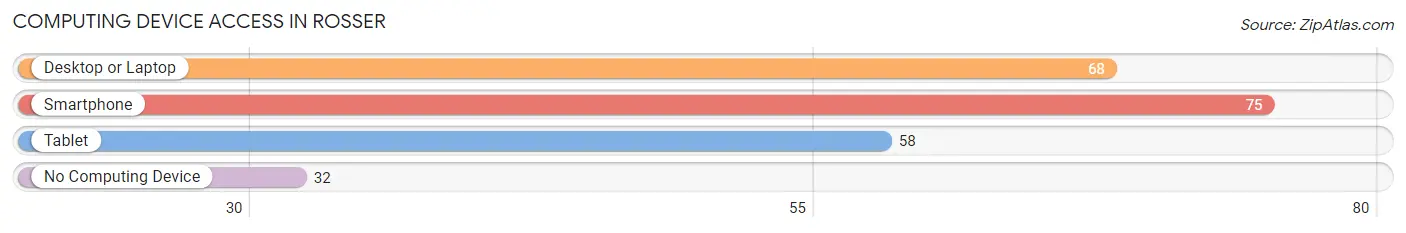
| Device Type | # Households | % Households |
| Desktop or Laptop | 68 | 54.8% |
| Smartphone | 75 | 60.5% |
| Tablet | 58 | 46.8% |
| No Computing Device | 32 | 25.8% |
| Total | 124 | 100.0% |
Internet Access in Rosser
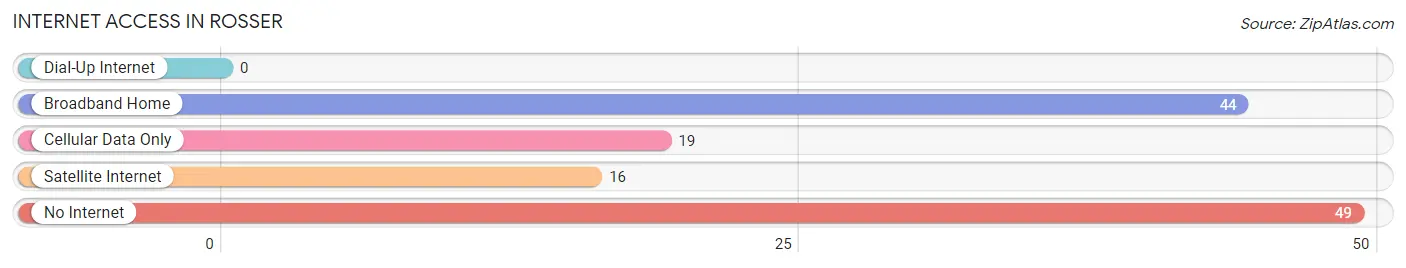
| Internet Type | # Households | % Households |
| Dial-Up Internet | 0 | 0.0% |
| Broadband Home | 44 | 35.5% |
| Cellular Data Only | 19 | 15.3% |
| Satellite Internet | 16 | 12.9% |
| No Internet | 49 | 39.5% |
| Total | 124 | 100.0% |
Rosser Summary
Rosser is a small town located in Kaufman County, Texas, United States. It is situated about 25 miles east of Dallas and is part of the Dallas-Fort Worth metropolitan area. The population of Rosser was estimated to be 545 in the year 2000.
Geography
Rosser is located at 32°41'45" North, 96°17'45" West (32.695833, -96.295833). It is situated at an elevation of 545 feet above sea level. The town is located in the Blackland Prairie region of Texas, which is characterized by flat terrain and fertile soil. The area is known for its rolling hills and lush vegetation.
The town is bordered by the cities of Forney to the north, Terrell to the east, and Kaufman to the south. The nearest major cities are Dallas and Fort Worth, which are both located about 25 miles away.
Climate
Rosser has a humid subtropical climate, with hot summers and mild winters. The average annual temperature is 68°F, with an average high of 91°F in the summer and an average low of 45°F in the winter. The average annual precipitation is 37 inches, with most of the rain falling in the spring and summer months.
Demographics
As of the 2000 census, there were 545 people, 197 households, and 149 families residing in Rosser. The population density was 545 people per square mile (210/km2). There were 211 housing units at an average density of 211 per square mile (81/km2). The racial makeup of the town was 79.3% White, 17.3% African American, 0.2% Native American, 0.2% Asian, 0.2% Pacific Islander, 1.3% from other races, and 1.5% from two or more races. Hispanic or Latino of any race were 3.3% of the population.
There were 197 households, out of which 33.5% had children under the age of 18 living with them, 57.9% were married couples living together, 11.7% had a female householder with no husband present, and 25.9% were non-families. 22.3% of all households were made up of individuals, and 9.1% had someone living alone who was 65 years of age or older. The average household size was 2.76 and the average family size was 3.20.
In the town, the population was spread out, with 28.2% under the age of 18, 8.2% from 18 to 24, 28.2% from 25 to 44, 22.2% from 45 to 64, and 13.2% who were 65 years of age or older. The median age was 36 years. For every 100 females, there were 97.3 males. For every 100 females age 18 and over, there were 94.3 males.
The median income for a household in the town was $37,500, and the median income for a family was $41,250. Males had a median income of $30,000 versus $21,250 for females. The per capita income for the town was $15,945. About 8.3% of families and 10.2% of the population were below the poverty line, including 11.3% of those under age 18 and 8.3% of those age 65 or over.
Economy
Rosser is a small, rural town with a primarily agricultural economy. The town is home to several farms and ranches, as well as a few small businesses. The town is also home to a few manufacturing plants, including a plastics plant and a metal fabrication plant.
The town is served by the Kaufman County School District, which operates two elementary schools, one middle school, and one high school. The town is also home to a branch of the Kaufman County Library.
Conclusion
Rosser is a small town located in Kaufman County, Texas, United States. It is situated about 25 miles east of Dallas and is part of the Dallas-Fort Worth metropolitan area. The population of Rosser was estimated to be 545 in the year 2000. The town is characterized by flat terrain and fertile soil, and is home to several farms and ranches, as well as a few small businesses. The town is served by the Kaufman County School District, and is home to a branch of the Kaufman County Library. Rosser has a humid subtropical climate, with hot summers and mild winters. The population is primarily White, with a small African American and Hispanic population. The town has a primarily agricultural economy, and the median income for a household in the town was $37,500 in 2000.
Common Questions
What is Per Capita Income in Rosser?
Per Capita income in Rosser is $29,163.
What is the Median Family Income in Rosser?
Median Family Income in Rosser is $103,750.
What is the Median Household income in Rosser?
Median Household Income in Rosser is $88,214.
What is Income or Wage Gap in Rosser?
Income or Wage Gap in Rosser is 19.8%.
Women in Rosser earn 80.2 cents for every dollar earned by a man.
What is Inequality or Gini Index in Rosser?
Inequality or Gini Index in Rosser is 0.43.
What is the Total Population of Rosser?
Total Population of Rosser is 437.
What is the Total Male Population of Rosser?
Total Male Population of Rosser is 233.
What is the Total Female Population of Rosser?
Total Female Population of Rosser is 204.
What is the Ratio of Males per 100 Females in Rosser?
There are 114.22 Males per 100 Females in Rosser.
What is the Ratio of Females per 100 Males in Rosser?
There are 87.55 Females per 100 Males in Rosser.
What is the Median Population Age in Rosser?
Median Population Age in Rosser is 40.3 Years.
What is the Average Family Size in Rosser
Average Family Size in Rosser is 5.0 People.
What is the Average Household Size in Rosser
Average Household Size in Rosser is 3.5 People.
How Large is the Labor Force in Rosser?
There are 208 People in the Labor Forcein in Rosser.
What is the Percentage of People in the Labor Force in Rosser?
65.2% of People are in the Labor Force in Rosser.
What is the Unemployment Rate in Rosser?
Unemployment Rate in Rosser is 5.8%.