Zip Codes with the Lowest Costs of Housing as Percentage of Income in Gilmer, TX
RELATED REPORTS & OPTIONS
Lowest Housing Costs / Income
Gilmer
Compare Zip Codes
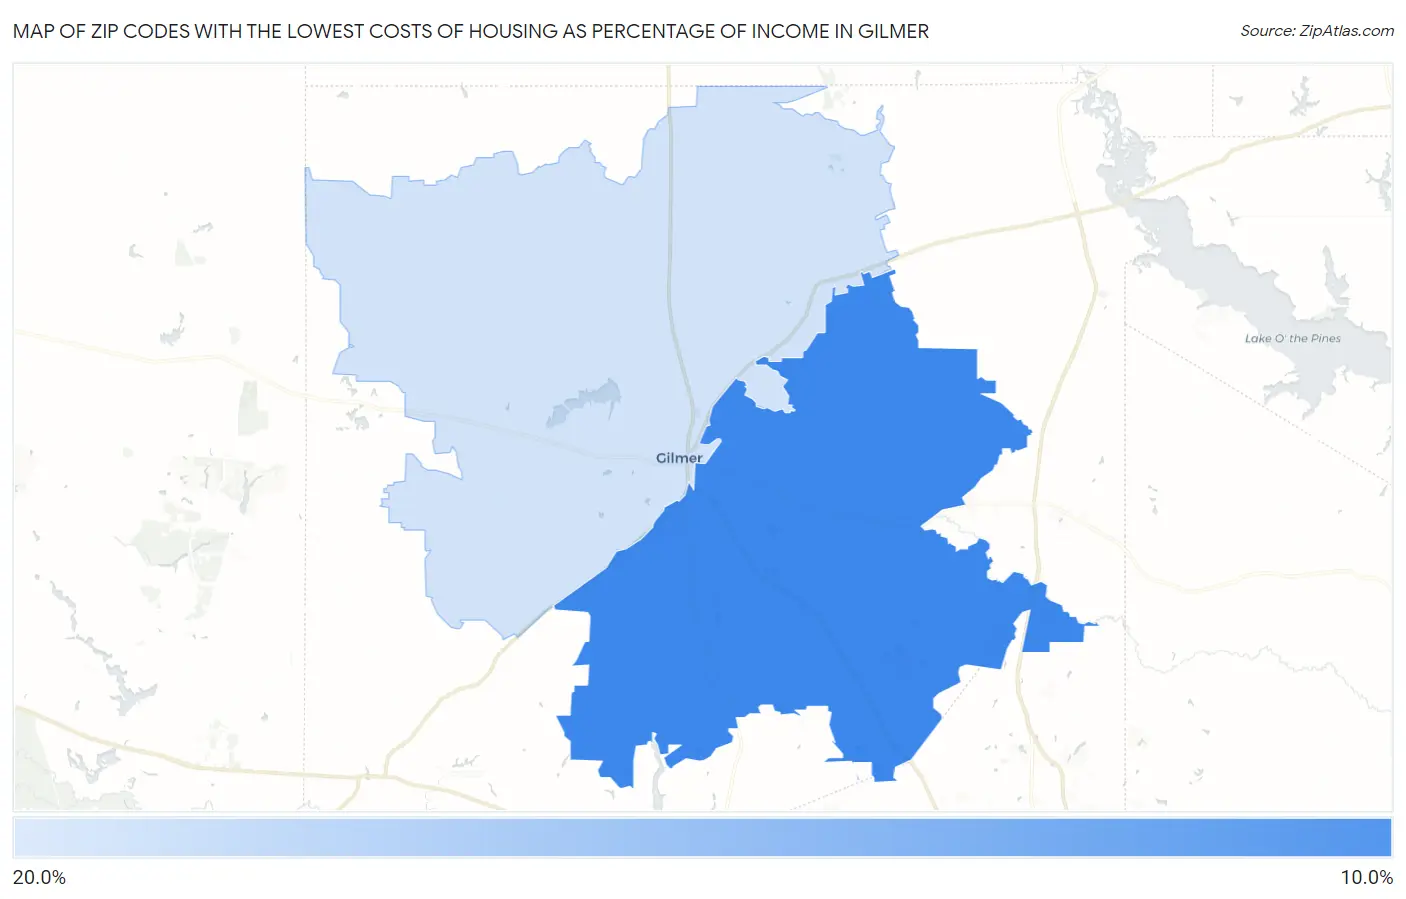
Map of Zip Codes with the Lowest Costs of Housing as Percentage of Income in Gilmer
18.2%
16.6%
Zip Codes with the Lowest Costs of Housing as Percentage of Income in Gilmer, TX
| Zip Code | Housing Costs / Income | vs State | vs National | |
| 1. | 75645 | 16.6% | 20.8%(-4.23)#709 | 20.4%(-3.82)#13,179 |
| 2. | 75644 | 18.2% | 20.8%(-2.54)#914 | 20.4%(-2.13)#17,554 |
1
Common Questions
What are the Top Zip Codes with the Lowest Costs of Housing as Percentage of Income in Gilmer, TX?
Top Zip Codes with the Lowest Costs of Housing as Percentage of Income in Gilmer, TX are:
What zip code has the Lowest Costs of Housing as Percentage of Income in Gilmer, TX?
75645 has the Lowest Costs of Housing as Percentage of Income in Gilmer, TX with 16.6%.
What is the Average Housing Costs as Percentage of Income in Gilmer, TX?
Average Housing Costs as Percentage of Income in Gilmer is 23.7%.
What is the Average Housing Costs as Percentage of Income in Texas?
Average Housing Costs as Percentage of Income in Texas is 20.8%.
What is the Average Housing Costs as Percentage of Income in the United States?
Average Housing Costs as Percentage of Income in the United States is 20.4%.