Mesquite, NM Map & Demographics
Mesquite Map
Mesquite Overview
$30,771
PER CAPITA INCOME
$65,816
AVG HOUSEHOLD INCOME
0.13
INEQUALITY / GINI INDEX
597
TOTAL POPULATION
278
MALE POPULATION
319
FEMALE POPULATION
87.15
MALES / 100 FEMALES
114.75
FEMALES / 100 MALES
63.1
MEDIAN AGE
5.2
AVG FAMILY SIZE
1.9
AVG HOUSEHOLD SIZE
523
LABOR FORCE [ PEOPLE ]
89.9%
PERCENT IN LABOR FORCE
Mesquite Zip Codes
Mesquite Area Codes
Income in Mesquite
Income Overview in Mesquite
| Characteristic | Number | Measure |
| Per Capita Income | 597 | $30,771 |
| Median Family Income | 5 | $0 |
| Mean Family Income | 5 | $0 |
| Median Household Income | 309 | $65,816 |
| Mean Household Income | 309 | $56,595 |
| Income Deficit | 5 | $0 |
| Wage / Income Gap (%) | 597 | 0.00% |
| Wage / Income Gap ($) | 597 | 100.00¢ per $1 |
| Gini / Inequality Index | 597 | 0.13 |
Earnings by Sex in Mesquite
| Sex | Number | Average Earnings |
| Male | 273 (52.2%) | $0 |
| Female | 250 (47.8%) | $0 |
| Total | 523 (100.0%) | $0 |
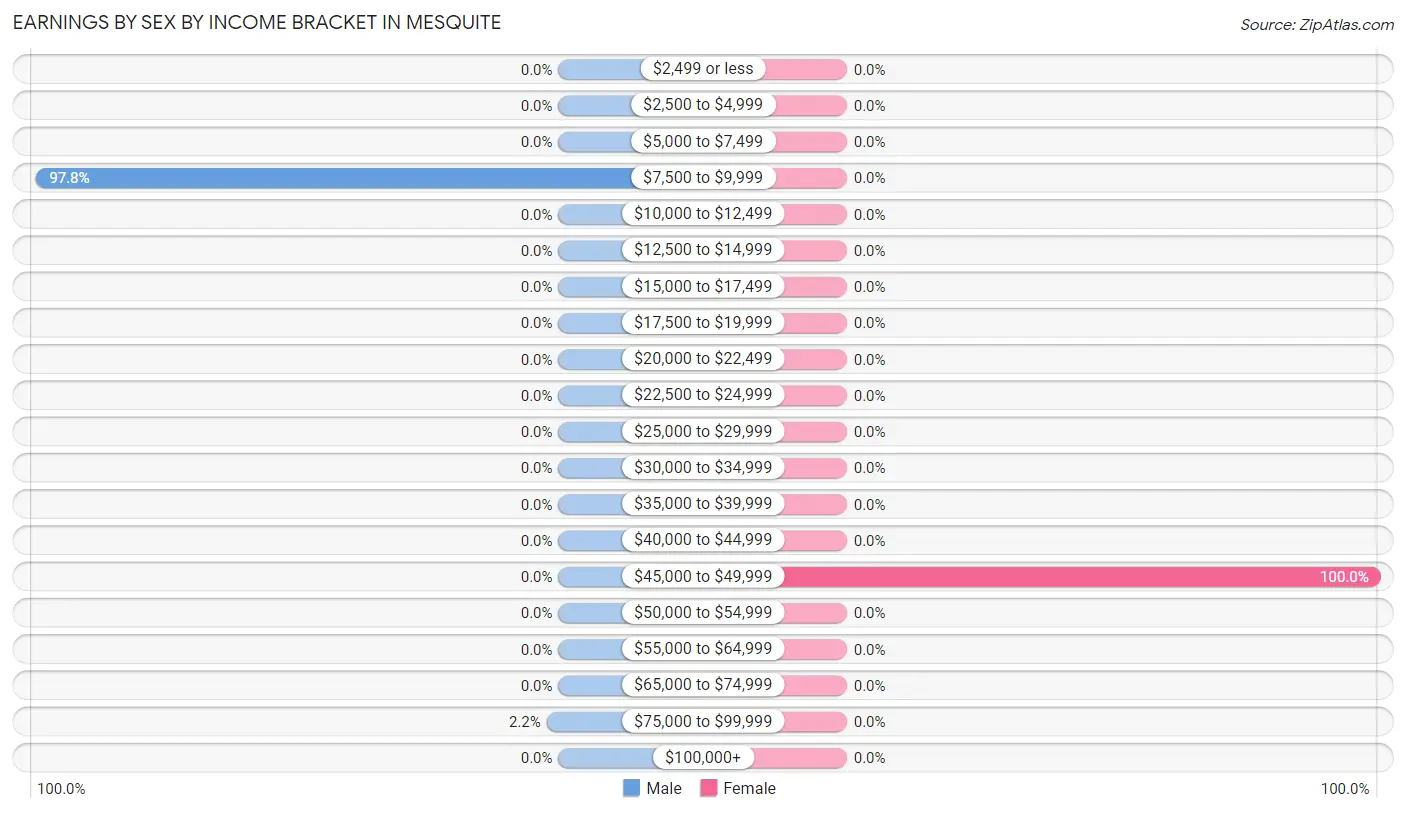
Earnings by Sex by Income Bracket in Mesquite
The most common earnings brackets in Mesquite are $7,500 to $9,999 for men (267 | 97.8%) and $45,000 to $49,999 for women (250 | 100.0%).
| Income | Male | Female |
| $2,499 or less | 0 (0.0%) | 0 (0.0%) |
| $2,500 to $4,999 | 0 (0.0%) | 0 (0.0%) |
| $5,000 to $7,499 | 0 (0.0%) | 0 (0.0%) |
| $7,500 to $9,999 | 267 (97.8%) | 0 (0.0%) |
| $10,000 to $12,499 | 0 (0.0%) | 0 (0.0%) |
| $12,500 to $14,999 | 0 (0.0%) | 0 (0.0%) |
| $15,000 to $17,499 | 0 (0.0%) | 0 (0.0%) |
| $17,500 to $19,999 | 0 (0.0%) | 0 (0.0%) |
| $20,000 to $22,499 | 0 (0.0%) | 0 (0.0%) |
| $22,500 to $24,999 | 0 (0.0%) | 0 (0.0%) |
| $25,000 to $29,999 | 0 (0.0%) | 0 (0.0%) |
| $30,000 to $34,999 | 0 (0.0%) | 0 (0.0%) |
| $35,000 to $39,999 | 0 (0.0%) | 0 (0.0%) |
| $40,000 to $44,999 | 0 (0.0%) | 0 (0.0%) |
| $45,000 to $49,999 | 0 (0.0%) | 250 (100.0%) |
| $50,000 to $54,999 | 0 (0.0%) | 0 (0.0%) |
| $55,000 to $64,999 | 0 (0.0%) | 0 (0.0%) |
| $65,000 to $74,999 | 0 (0.0%) | 0 (0.0%) |
| $75,000 to $99,999 | 6 (2.2%) | 0 (0.0%) |
| $100,000+ | 0 (0.0%) | 0 (0.0%) |
| Total | 273 (100.0%) | 250 (100.0%) |
Earnings by Sex by Educational Attainment in Mesquite
| Educational Attainment | Male Income | Female Income |
| Less than High School | - | - |
| High School Diploma | - | - |
| College or Associate's Degree | - | - |
| Bachelor's Degree | - | - |
| Graduate Degree | - | - |
| Total | - | - |
Family Income in Mesquite
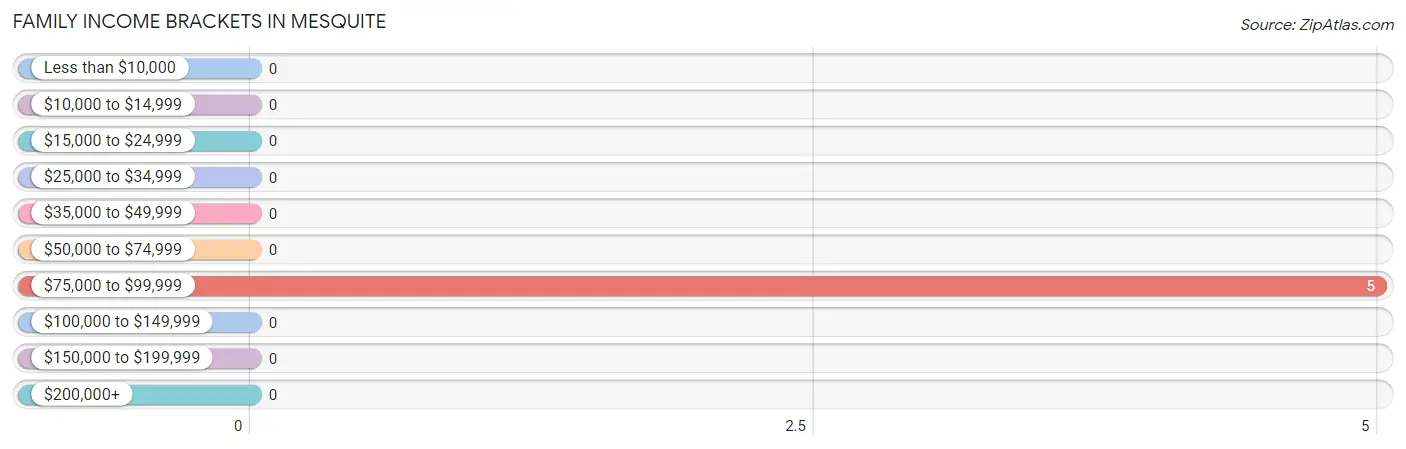
Family Income Brackets in Mesquite
According to the Mesquite family income data, there are 5 families falling into the $75,000 to $99,999 income range, which is the most common income bracket and makes up 100.0% of all families.
| Income Bracket | # Families | % Families |
| Less than $10,000 | 0 | 0.0% |
| $10,000 to $14,999 | 0 | 0.0% |
| $15,000 to $24,999 | 0 | 0.0% |
| $25,000 to $34,999 | 0 | 0.0% |
| $35,000 to $49,999 | 0 | 0.0% |
| $50,000 to $74,999 | 0 | 0.0% |
| $75,000 to $99,999 | 5 | 100.0% |
| $100,000 to $149,999 | 0 | 0.0% |
| $150,000 to $199,999 | 0 | 0.0% |
| $200,000+ | 0 | 0.0% |
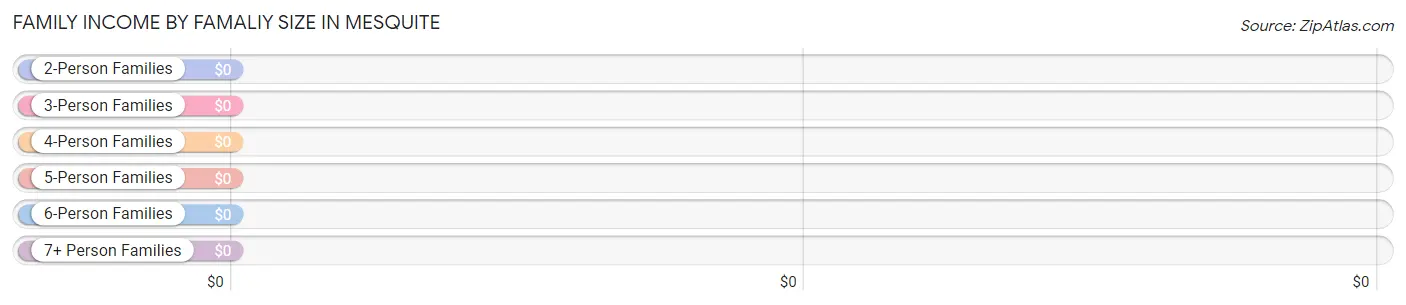
Family Income by Famaliy Size in Mesquite
| Income Bracket | # Families | Median Income |
| 2-Person Families | 0 (0.0%) | $0 |
| 3-Person Families | 0 (0.0%) | $0 |
| 4-Person Families | 0 (0.0%) | $0 |
| 5-Person Families | 5 (100.0%) | $0 |
| 6-Person Families | 0 (0.0%) | $0 |
| 7+ Person Families | 0 (0.0%) | $0 |
| Total | 5 (100.0%) | $0 |
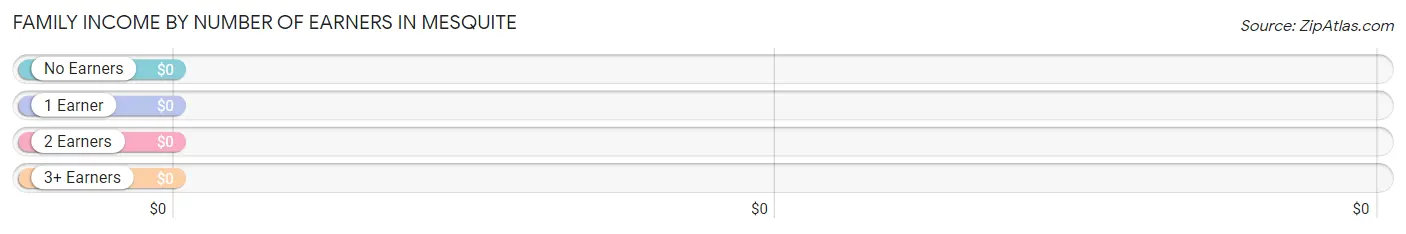
Family Income by Number of Earners in Mesquite
| Number of Earners | # Families | Median Income |
| No Earners | 0 (0.0%) | $0 |
| 1 Earner | 5 (100.0%) | $0 |
| 2 Earners | 0 (0.0%) | $0 |
| 3+ Earners | 0 (0.0%) | $0 |
| Total | 5 (100.0%) | $0 |
Household Income in Mesquite
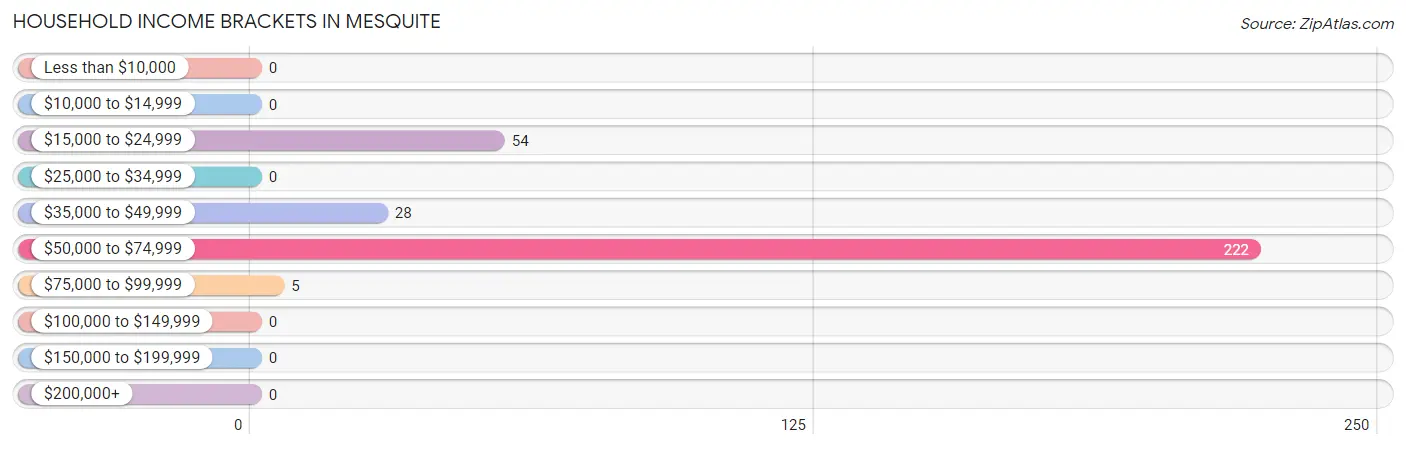
Household Income Brackets in Mesquite
With 222 households falling in the category, the $50,000 to $74,999 income range is the most frequent in Mesquite, accounting for 71.8% of all households.
| Income Bracket | # Households | % Households |
| Less than $10,000 | 0 | 0.0% |
| $10,000 to $14,999 | 0 | 0.0% |
| $15,000 to $24,999 | 54 | 17.5% |
| $25,000 to $34,999 | 0 | 0.0% |
| $35,000 to $49,999 | 28 | 9.1% |
| $50,000 to $74,999 | 222 | 71.8% |
| $75,000 to $99,999 | 5 | 1.6% |
| $100,000 to $149,999 | 0 | 0.0% |
| $150,000 to $199,999 | 0 | 0.0% |
| $200,000+ | 0 | 0.0% |
Household Income by Householder Age in Mesquite
| Income Bracket | # Households | Median Income |
| 15 to 24 Years | 0 (0.0%) | $0 |
| 25 to 44 Years | 5 (1.6%) | $0 |
| 45 to 64 Years | 250 (80.9%) | $0 |
| 65+ Years | 54 (17.5%) | $0 |
| Total | 309 (100.0%) | $65,816 |
Poverty in Mesquite
Income Below Poverty by Sex and Age in Mesquite
| Age Bracket | Male | Female |
| Under 5 Years | 0 (0.0%) | 0 (0.0%) |
| 5 Years | 0 (0.0%) | 0 (0.0%) |
| 6 to 11 Years | 0 (0.0%) | 0 (0.0%) |
| 12 to 14 Years | 0 (0.0%) | 0 (0.0%) |
| 15 Years | 0 (0.0%) | 0 (0.0%) |
| 16 and 17 Years | 0 (0.0%) | 0 (0.0%) |
| 18 to 24 Years | 0 (0.0%) | 0 (0.0%) |
| 25 to 34 Years | 0 (0.0%) | 0 (0.0%) |
| 35 to 44 Years | 0 (0.0%) | 0 (0.0%) |
| 45 to 54 Years | 0 (0.0%) | 0 (0.0%) |
| 55 to 64 Years | 0 (0.0%) | 0 (0.0%) |
| 65 to 74 Years | 0 (0.0%) | 0 (0.0%) |
| 75 Years and over | 0 (0.0%) | 0 (0.0%) |
| Total | 0 (0.0%) | 0 (0.0%) |
Income Above Poverty by Sex and Age in Mesquite
According to the poverty statistics in Mesquite, males aged under 5 years and females aged 6 to 11 years are the age groups that are most secure financially, with 100.0% of males and 100.0% of females in these age groups living above the poverty line.
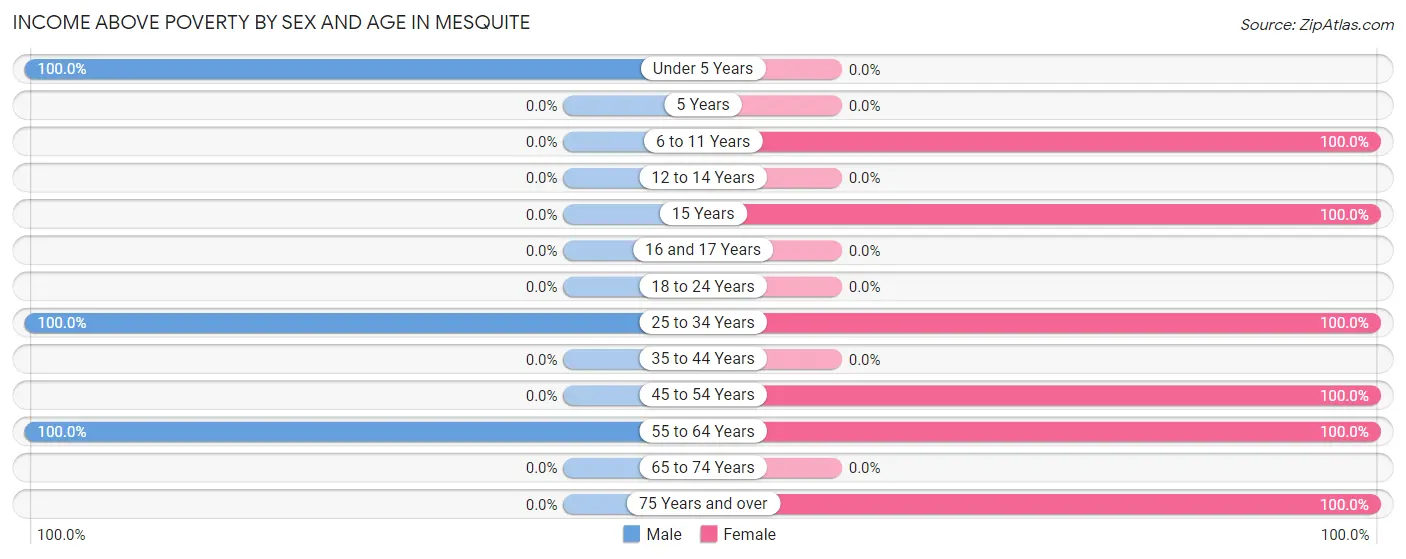
| Age Bracket | Male | Female |
| Under 5 Years | 5 (100.0%) | 0 (0.0%) |
| 5 Years | 0 (0.0%) | 0 (0.0%) |
| 6 to 11 Years | 0 (0.0%) | 5 (100.0%) |
| 12 to 14 Years | 0 (0.0%) | 0 (0.0%) |
| 15 Years | 0 (0.0%) | 5 (100.0%) |
| 16 and 17 Years | 0 (0.0%) | 0 (0.0%) |
| 18 to 24 Years | 0 (0.0%) | 0 (0.0%) |
| 25 to 34 Years | 6 (100.0%) | 5 (100.0%) |
| 35 to 44 Years | 0 (0.0%) | 0 (0.0%) |
| 45 to 54 Years | 0 (0.0%) | 222 (100.0%) |
| 55 to 64 Years | 267 (100.0%) | 28 (100.0%) |
| 65 to 74 Years | 0 (0.0%) | 0 (0.0%) |
| 75 Years and over | 0 (0.0%) | 54 (100.0%) |
| Total | 278 (100.0%) | 319 (100.0%) |
Income Below Poverty Among Married-Couple Families in Mesquite
| Children | Above Poverty | Below Poverty |
| No Children | 0 (0.0%) | 0 (0.0%) |
| 1 or 2 Children | 0 (0.0%) | 0 (0.0%) |
| 3 or 4 Children | 5 (100.0%) | 0 (0.0%) |
| 5 or more Children | 0 (0.0%) | 0 (0.0%) |
| Total | 5 (100.0%) | 0 (0.0%) |
Income Below Poverty Among Single-Parent Households in Mesquite
| Children | Single Father | Single Mother |
| No Children | 0 (0.0%) | 0 (0.0%) |
| 1 or 2 Children | 0 (0.0%) | 0 (0.0%) |
| 3 or 4 Children | 0 (0.0%) | 0 (0.0%) |
| 5 or more Children | 0 (0.0%) | 0 (0.0%) |
| Total | 0 (0.0%) | 0 (0.0%) |
Income Below Poverty Among Married-Couple vs Single-Parent Households in Mesquite
| Children | Married-Couple Families | Single-Parent Households |
| No Children | 0 (0.0%) | 0 (0.0%) |
| 1 or 2 Children | 0 (0.0%) | 0 (0.0%) |
| 3 or 4 Children | 0 (0.0%) | 0 (0.0%) |
| 5 or more Children | 0 (0.0%) | 0 (0.0%) |
| Total | 0 (0.0%) | 0 (0.0%) |
Race in Mesquite
The most populous races in Mesquite are Hispanic or Latino (597 | 100.0%), Two or more Races (515 | 86.3%), and Some other Race (54 | 9.0%).
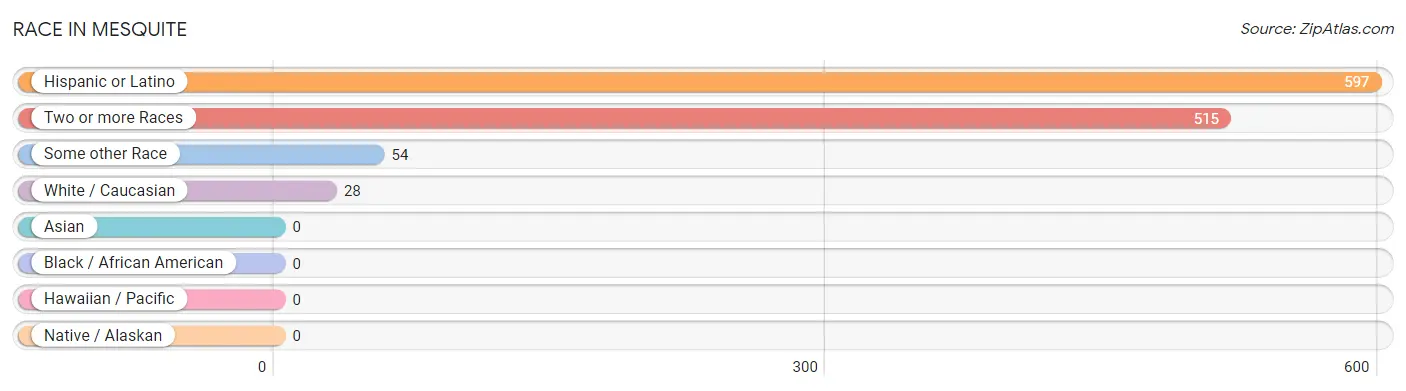
| Race | # Population | % Population |
| Asian | 0 | 0.0% |
| Black / African American | 0 | 0.0% |
| Hawaiian / Pacific | 0 | 0.0% |
| Hispanic or Latino | 597 | 100.0% |
| Native / Alaskan | 0 | 0.0% |
| White / Caucasian | 28 | 4.7% |
| Two or more Races | 515 | 86.3% |
| Some other Race | 54 | 9.0% |
| Total | 597 | 100.0% |
Ancestry in Mesquite
The most populous ancestries reported in Mesquite are , and Mexican (597 | 100.0%), together accounting for 100.0% of all Mesquite residents.

| Ancestry | # Population | % Population |
| Mexican | 597 | 100.0% | View All 1 Rows |
Immigrants in Mesquite
The most numerous immigrant groups reported in Mesquite came from Central America (278 | 46.6%), Latin America (278 | 46.6%), and Mexico (278 | 46.6%), together accounting for 139.7% of all Mesquite residents.
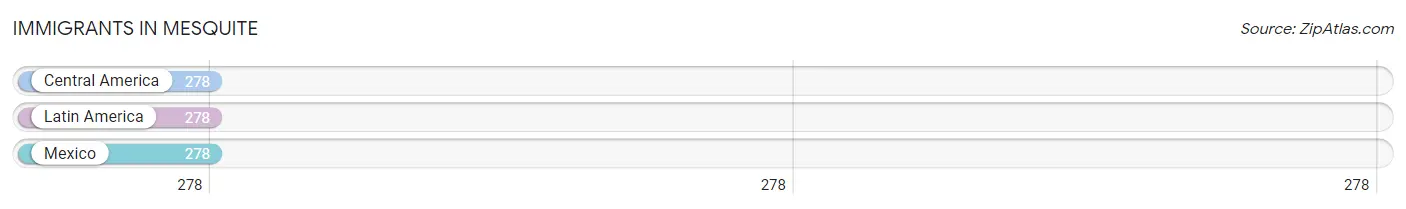
| Immigration Origin | # Population | % Population |
| Central America | 278 | 46.6% |
| Latin America | 278 | 46.6% |
| Mexico | 278 | 46.6% | View All 3 Rows |
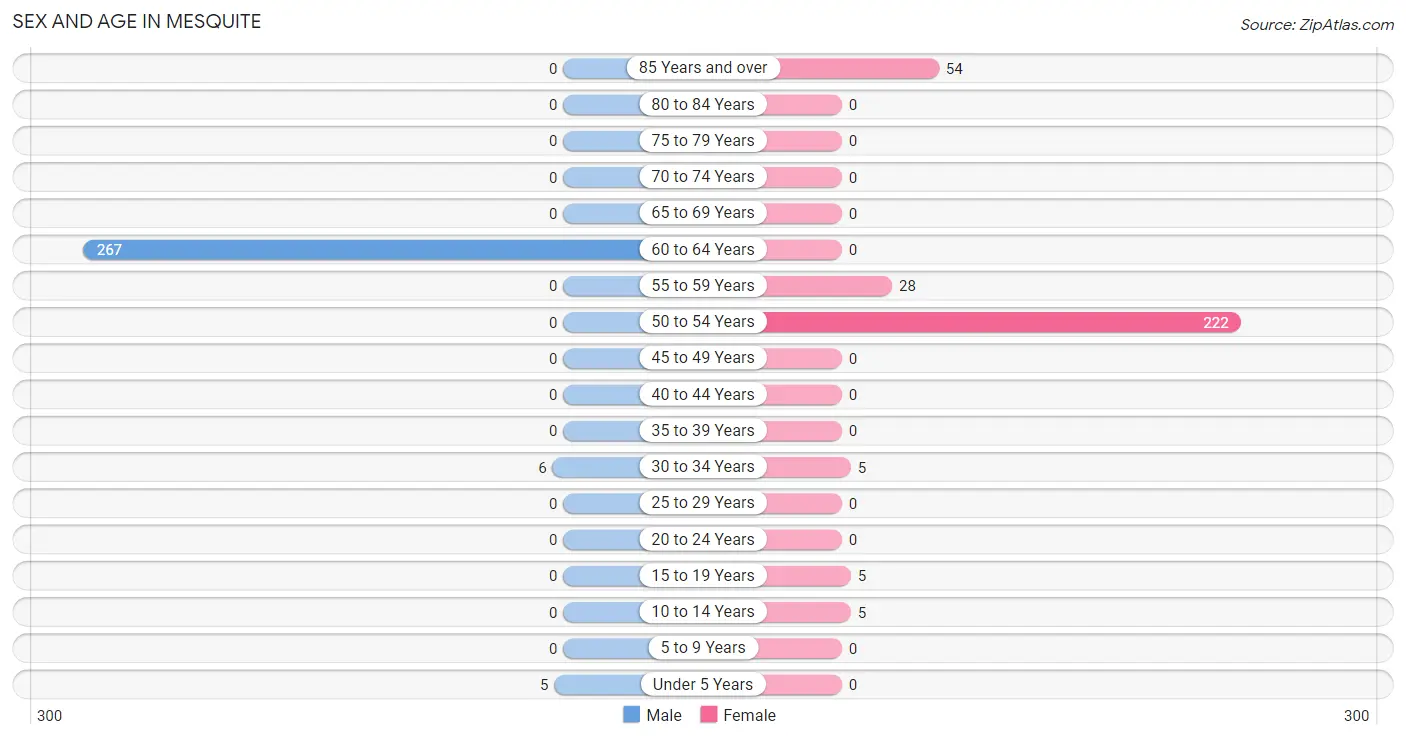
Sex and Age in Mesquite
Sex and Age in Mesquite
The most populous age groups in Mesquite are 60 to 64 Years (267 | 96.0%) for men and 50 to 54 Years (222 | 69.6%) for women.
| Age Bracket | Male | Female |
| Under 5 Years | 5 (1.8%) | 0 (0.0%) |
| 5 to 9 Years | 0 (0.0%) | 0 (0.0%) |
| 10 to 14 Years | 0 (0.0%) | 5 (1.6%) |
| 15 to 19 Years | 0 (0.0%) | 5 (1.6%) |
| 20 to 24 Years | 0 (0.0%) | 0 (0.0%) |
| 25 to 29 Years | 0 (0.0%) | 0 (0.0%) |
| 30 to 34 Years | 6 (2.2%) | 5 (1.6%) |
| 35 to 39 Years | 0 (0.0%) | 0 (0.0%) |
| 40 to 44 Years | 0 (0.0%) | 0 (0.0%) |
| 45 to 49 Years | 0 (0.0%) | 0 (0.0%) |
| 50 to 54 Years | 0 (0.0%) | 222 (69.6%) |
| 55 to 59 Years | 0 (0.0%) | 28 (8.8%) |
| 60 to 64 Years | 267 (96.0%) | 0 (0.0%) |
| 65 to 69 Years | 0 (0.0%) | 0 (0.0%) |
| 70 to 74 Years | 0 (0.0%) | 0 (0.0%) |
| 75 to 79 Years | 0 (0.0%) | 0 (0.0%) |
| 80 to 84 Years | 0 (0.0%) | 0 (0.0%) |
| 85 Years and over | 0 (0.0%) | 54 (16.9%) |
| Total | 278 (100.0%) | 319 (100.0%) |
Families and Households in Mesquite
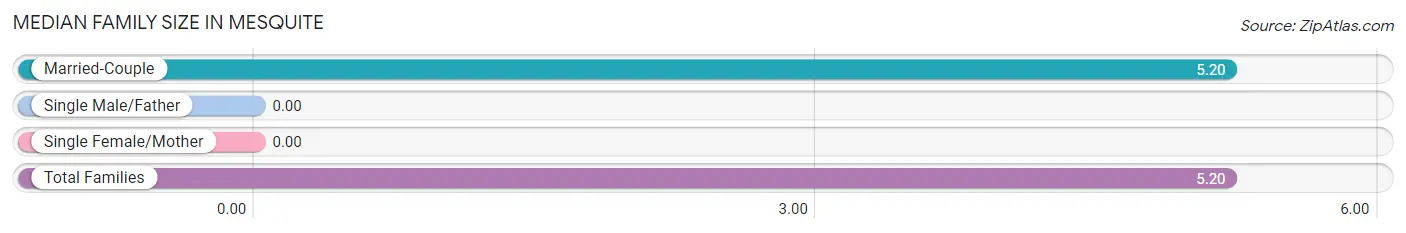
Median Family Size in Mesquite
| Family Type | # Families | Family Size |
| Married-Couple | 5 (100.0%) | 5.20 |
| Single Male/Father | 0 (0.0%) | - |
| Single Female/Mother | 0 (0.0%) | - |
| Total Families | 5 (100.0%) | 5.20 |
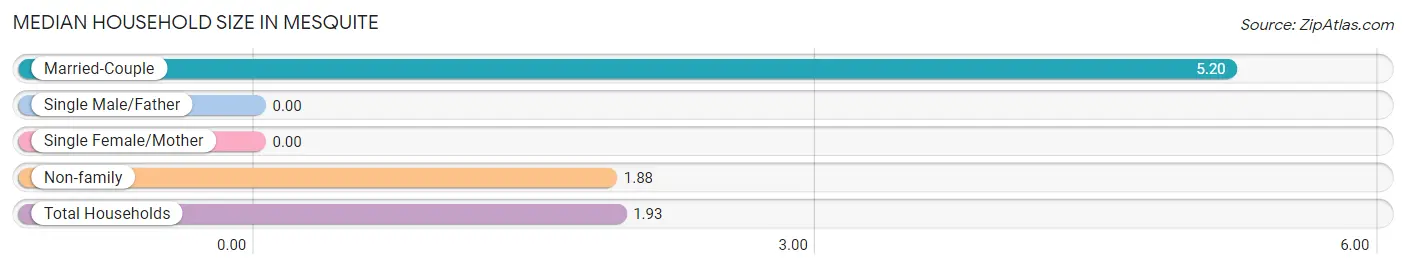
Median Household Size in Mesquite
| Household Type | # Households | Household Size |
| Married-Couple | 5 (1.6%) | 5.20 |
| Single Male/Father | 0 (0.0%) | - |
| Single Female/Mother | 0 (0.0%) | - |
| Non-family | 304 (98.4%) | 1.88 |
| Total Households | 309 (100.0%) | 1.93 |
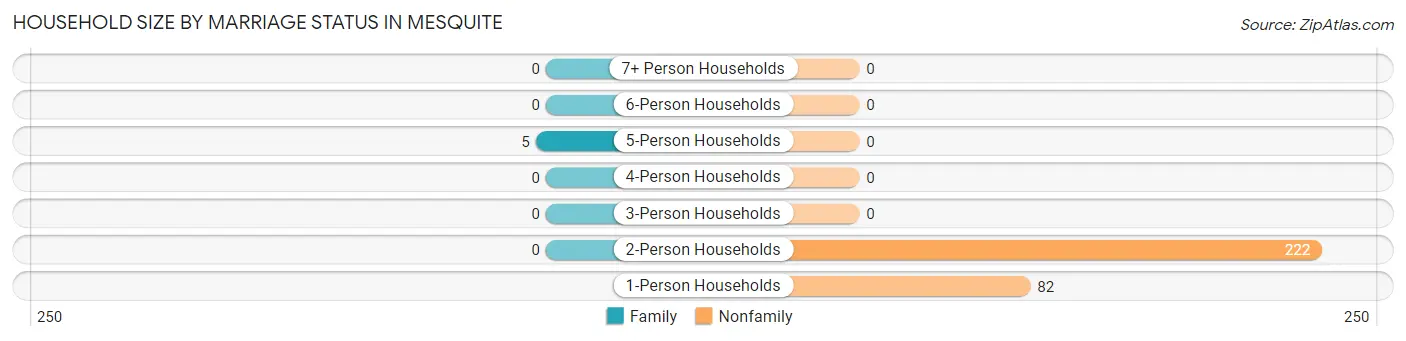
Household Size by Marriage Status in Mesquite
Out of a total of 309 households in Mesquite, 5 (1.6%) are family households, while 304 (98.4%) are nonfamily households. The most numerous type of family households are 5-person households, comprising 5, and the most common type of nonfamily households are 2-person households, comprising 222.
| Household Size | Family Households | Nonfamily Households |
| 1-Person Households | - | 82 (26.5%) |
| 2-Person Households | 0 (0.0%) | 222 (71.8%) |
| 3-Person Households | 0 (0.0%) | 0 (0.0%) |
| 4-Person Households | 0 (0.0%) | 0 (0.0%) |
| 5-Person Households | 5 (1.6%) | 0 (0.0%) |
| 6-Person Households | 0 (0.0%) | 0 (0.0%) |
| 7+ Person Households | 0 (0.0%) | 0 (0.0%) |
| Total | 5 (1.6%) | 304 (98.4%) |
Female Fertility in Mesquite
Fertility by Age in Mesquite
| Age Bracket | Women with Births | Births / 1,000 Women |
| 15 to 19 years | 0 (0.0%) | 0.0 |
| 20 to 34 years | 0 (0.0%) | 0.0 |
| 35 to 50 years | 0 (0.0%) | 0.0 |
| Total | 0 (0.0%) | 0.0 |
Fertility by Age by Marriage Status in Mesquite
| Age Bracket | Married | Unmarried |
| 15 to 19 years | 0 (0.0%) | 0 (0.0%) |
| 20 to 34 years | 0 (0.0%) | 0 (0.0%) |
| 35 to 50 years | 0 (0.0%) | 0 (0.0%) |
| Total | 0 (0.0%) | 0 (0.0%) |
Fertility by Education in Mesquite
| Educational Attainment | Women with Births | Births / 1,000 Women |
| Less than High School | 0 (0.0%) | 0.0 |
| High School Diploma | 0 (0.0%) | 0.0 |
| College or Associate's Degree | 0 (0.0%) | 0.0 |
| Bachelor's Degree | 0 (0.0%) | 0.0 |
| Graduate Degree | 0 (0.0%) | 0.0 |
| Total | 0 (0.0%) | 0.0 |
Fertility by Education by Marriage Status in Mesquite
| Educational Attainment | Married | Unmarried |
| Less than High School | 0 (0.0%) | 0 (0.0%) |
| High School Diploma | 0 (0.0%) | 0 (0.0%) |
| College or Associate's Degree | 0 (0.0%) | 0 (0.0%) |
| Bachelor's Degree | 0 (0.0%) | 0 (0.0%) |
| Graduate Degree | 0 (0.0%) | 0 (0.0%) |
| Total | 0 (0.0%) | 0 (0.0%) |
Employment Characteristics in Mesquite
Employment by Class of Employer in Mesquite
Among the 495 employed individuals in Mesquite, , and private company employees (495 | 100.0%) make up the most common classes of employment.
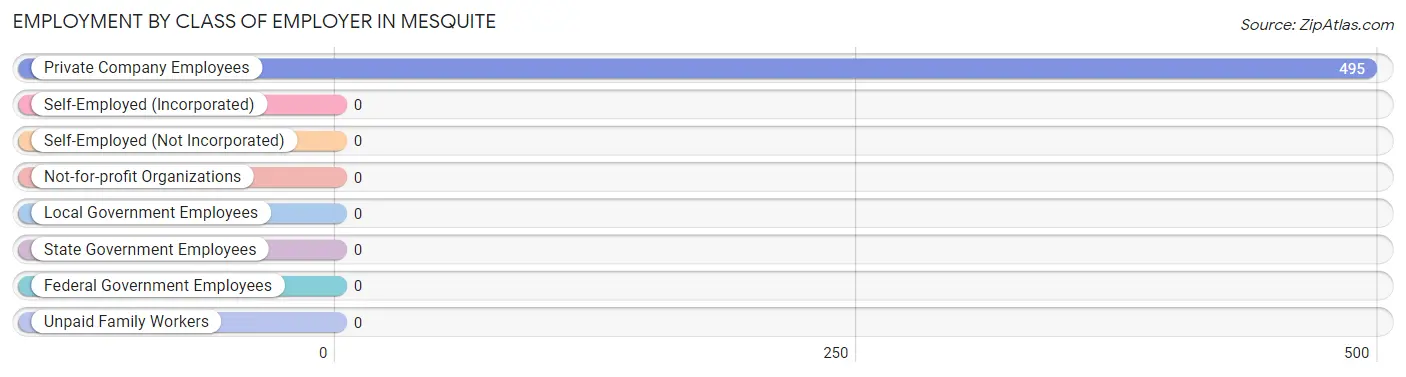
| Employer Class | # Employees | % Employees |
| Private Company Employees | 495 | 100.0% |
| Self-Employed (Incorporated) | 0 | 0.0% |
| Self-Employed (Not Incorporated) | 0 | 0.0% |
| Not-for-profit Organizations | 0 | 0.0% |
| Local Government Employees | 0 | 0.0% |
| State Government Employees | 0 | 0.0% |
| Federal Government Employees | 0 | 0.0% |
| Unpaid Family Workers | 0 | 0.0% |
| Total | 495 | 100.0% |
Employment Status by Age in Mesquite
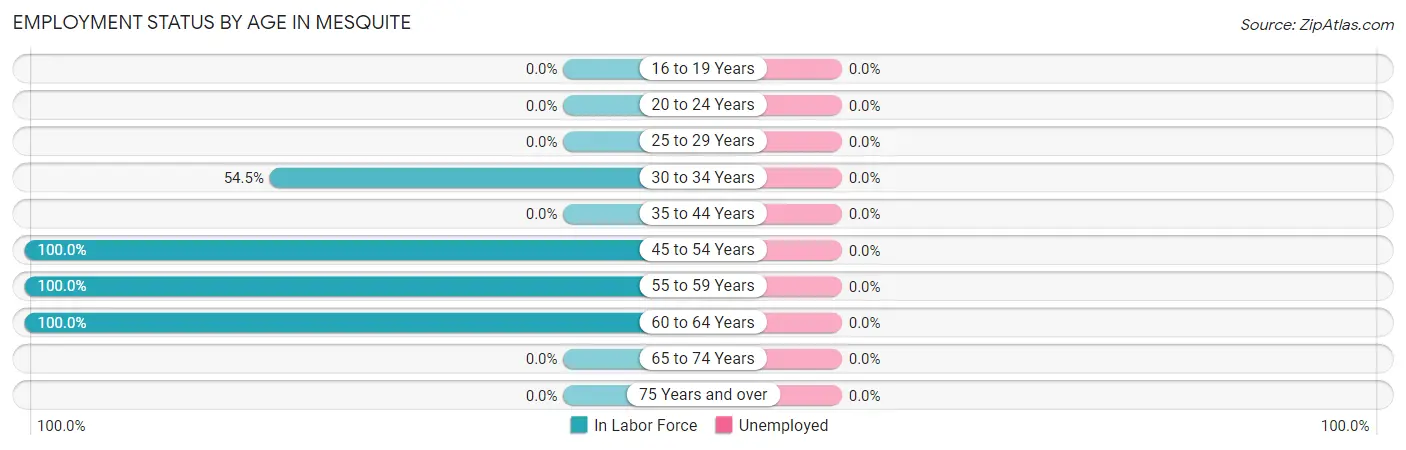
| Age Bracket | In Labor Force | Unemployed |
| 16 to 19 Years | 0 (0.0%) | 0 (0.0%) |
| 20 to 24 Years | 0 (0.0%) | 0 (0.0%) |
| 25 to 29 Years | 0 (0.0%) | 0 (0.0%) |
| 30 to 34 Years | 6 (54.5%) | 0 (0.0%) |
| 35 to 44 Years | 0 (0.0%) | 0 (0.0%) |
| 45 to 54 Years | 222 (100.0%) | 0 (0.0%) |
| 55 to 59 Years | 28 (100.0%) | 0 (0.0%) |
| 60 to 64 Years | 267 (100.0%) | 0 (0.0%) |
| 65 to 74 Years | 0 (0.0%) | 0 (0.0%) |
| 75 Years and over | 0 (0.0%) | 0 (0.0%) |
| Total | 523 (89.9%) | 0 (0.0%) |
Employment Status by Educational Attainment in Mesquite
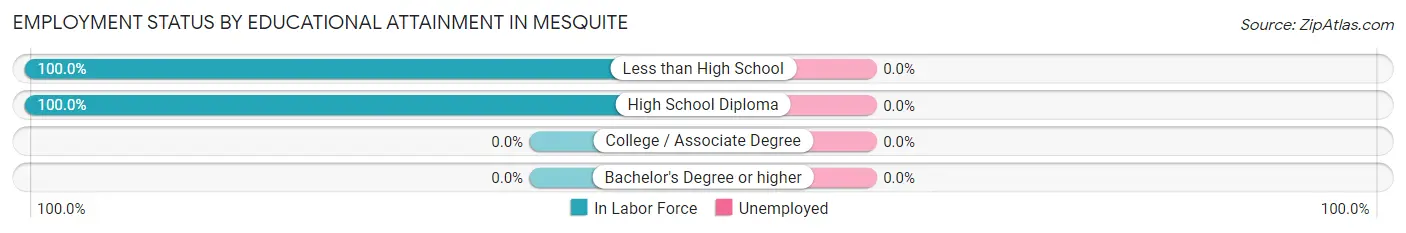
| Educational Attainment | In Labor Force | Unemployed |
| Less than High School | 273 (100.0%) | 0 (0.0%) |
| High School Diploma | 250 (100.0%) | 0 (0.0%) |
| College / Associate Degree | 0 (0.0%) | 0 (0.0%) |
| Bachelor's Degree or higher | 0 (0.0%) | 0 (0.0%) |
| Total | 523 (99.1%) | 0 (0.0%) |
Employment Occupations by Sex in Mesquite
Management, Business, Science and Arts Occupations
The most common Management, Business, Science and Arts occupations in Mesquite are , and Management (6 | 1.1%).
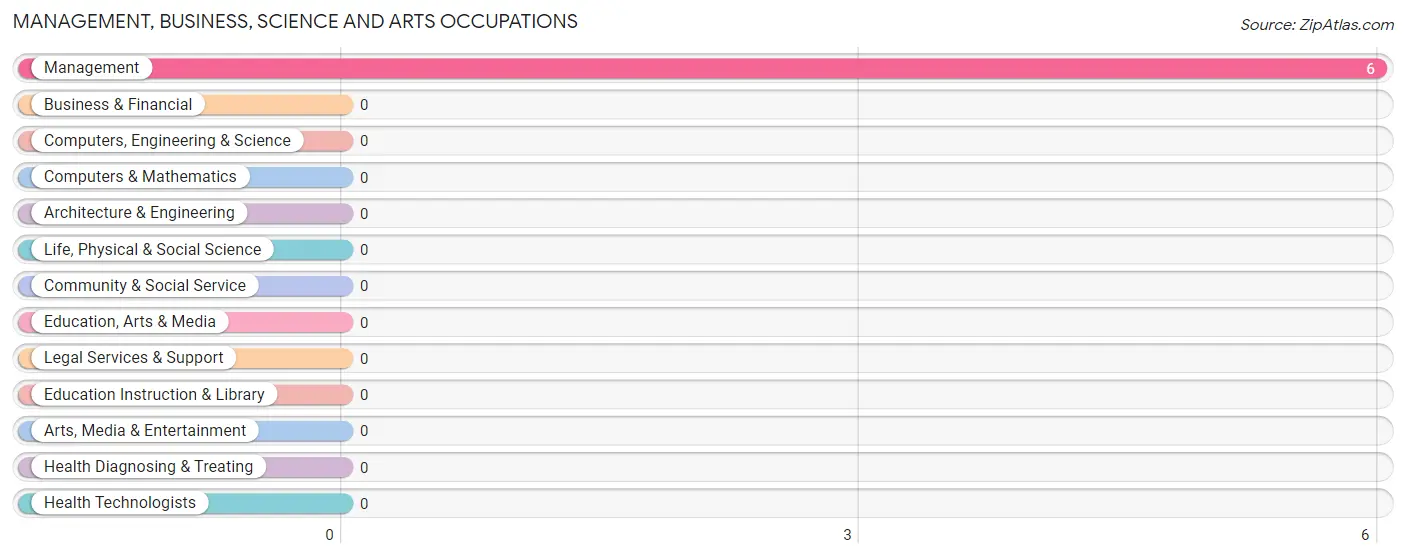
Management, Business, Science and Arts Occupations by Sex
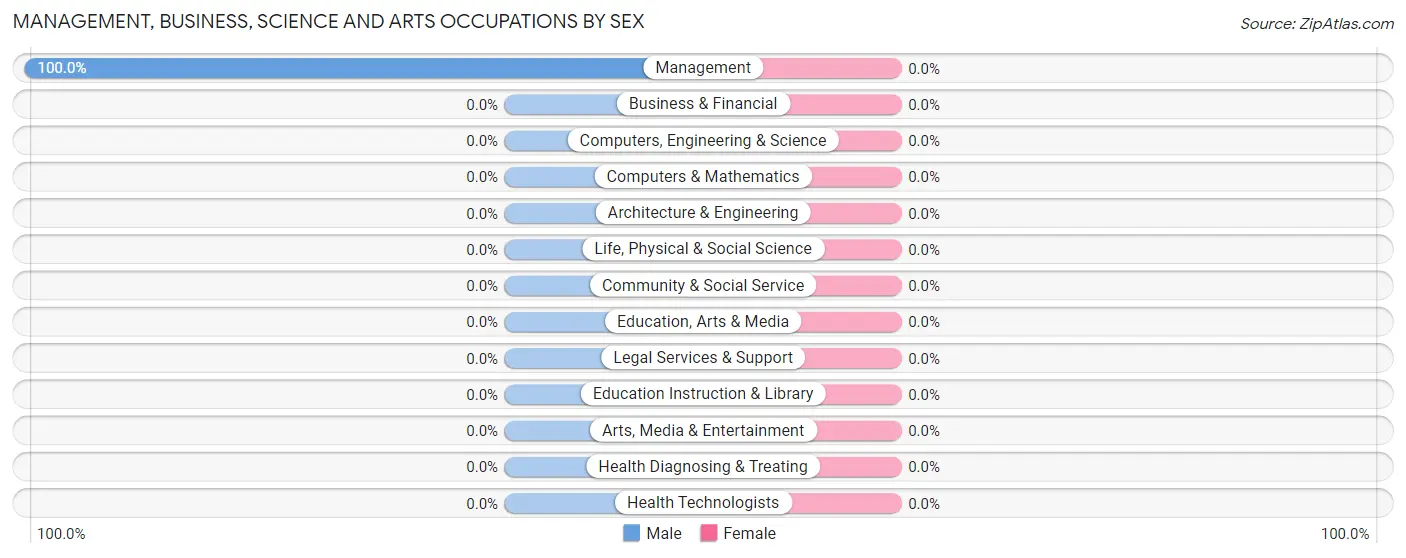
| Occupation | Male | Female |
| Management | 6 (100.0%) | 0 (0.0%) |
| Business & Financial | 0 (0.0%) | 0 (0.0%) |
| Computers, Engineering & Science | 0 (0.0%) | 0 (0.0%) |
| Computers & Mathematics | 0 (0.0%) | 0 (0.0%) |
| Architecture & Engineering | 0 (0.0%) | 0 (0.0%) |
| Life, Physical & Social Science | 0 (0.0%) | 0 (0.0%) |
| Community & Social Service | 0 (0.0%) | 0 (0.0%) |
| Education, Arts & Media | 0 (0.0%) | 0 (0.0%) |
| Legal Services & Support | 0 (0.0%) | 0 (0.0%) |
| Education Instruction & Library | 0 (0.0%) | 0 (0.0%) |
| Arts, Media & Entertainment | 0 (0.0%) | 0 (0.0%) |
| Health Diagnosing & Treating | 0 (0.0%) | 0 (0.0%) |
| Health Technologists | 0 (0.0%) | 0 (0.0%) |
| Total (Category) | 6 (100.0%) | 0 (0.0%) |
| Total (Overall) | 273 (52.2%) | 250 (47.8%) |
Services Occupations
Services Occupations by Sex
| Occupation | Male | Female |
| Healthcare Support | 0 (0.0%) | 0 (0.0%) |
| Security & Protection | 0 (0.0%) | 0 (0.0%) |
| Firefighting & Prevention | 0 (0.0%) | 0 (0.0%) |
| Law Enforcement | 0 (0.0%) | 0 (0.0%) |
| Food Preparation & Serving | 0 (0.0%) | 0 (0.0%) |
| Cleaning & Maintenance | 0 (0.0%) | 0 (0.0%) |
| Personal Care & Service | 0 (0.0%) | 0 (0.0%) |
| Total (Category) | 0 (0.0%) | 0 (0.0%) |
| Total (Overall) | 273 (52.2%) | 250 (47.8%) |
Sales and Office Occupations
The most common Sales and Office occupations in Mesquite are , and Office & Administration (250 | 47.8%).
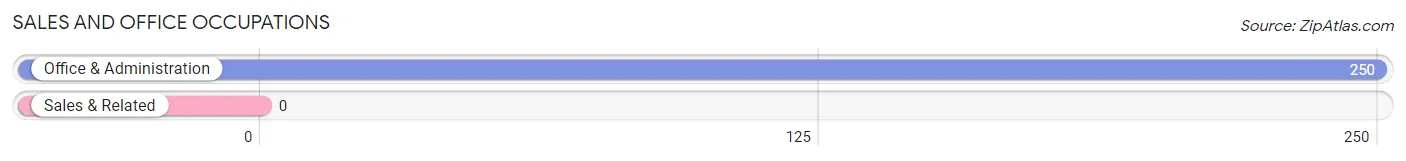
Sales and Office Occupations by Sex
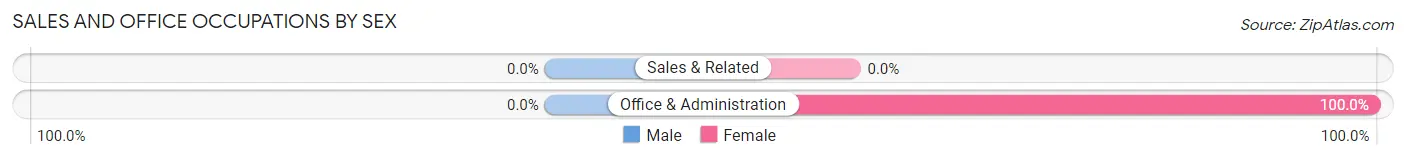
| Occupation | Male | Female |
| Sales & Related | 0 (0.0%) | 0 (0.0%) |
| Office & Administration | 0 (0.0%) | 250 (100.0%) |
| Total (Category) | 0 (0.0%) | 250 (100.0%) |
| Total (Overall) | 273 (52.2%) | 250 (47.8%) |
Natural Resources, Construction and Maintenance Occupations
The most common Natural Resources, Construction and Maintenance occupations in Mesquite are , and Farming, Fishing & Forestry (267 | 51.0%).
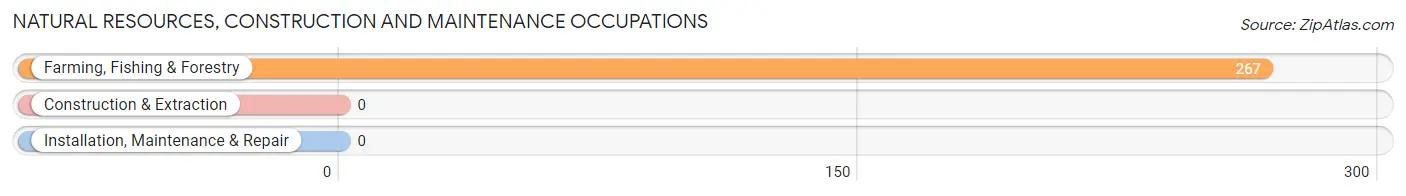
Natural Resources, Construction and Maintenance Occupations by Sex
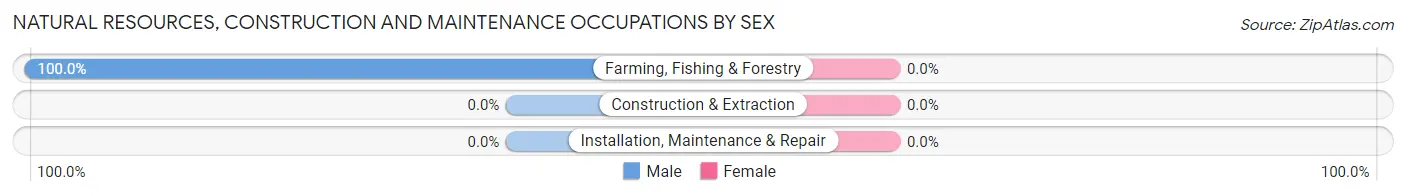
| Occupation | Male | Female |
| Farming, Fishing & Forestry | 267 (100.0%) | 0 (0.0%) |
| Construction & Extraction | 0 (0.0%) | 0 (0.0%) |
| Installation, Maintenance & Repair | 0 (0.0%) | 0 (0.0%) |
| Total (Category) | 267 (100.0%) | 0 (0.0%) |
| Total (Overall) | 273 (52.2%) | 250 (47.8%) |
Production, Transportation and Moving Occupations
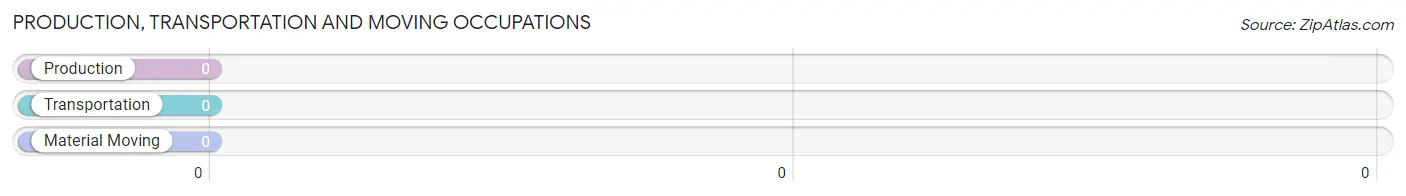
Production, Transportation and Moving Occupations by Sex
| Occupation | Male | Female |
| Production | 0 (0.0%) | 0 (0.0%) |
| Transportation | 0 (0.0%) | 0 (0.0%) |
| Material Moving | 0 (0.0%) | 0 (0.0%) |
| Total (Category) | 0 (0.0%) | 0 (0.0%) |
| Total (Overall) | 273 (52.2%) | 250 (47.8%) |
Employment Industries by Sex in Mesquite
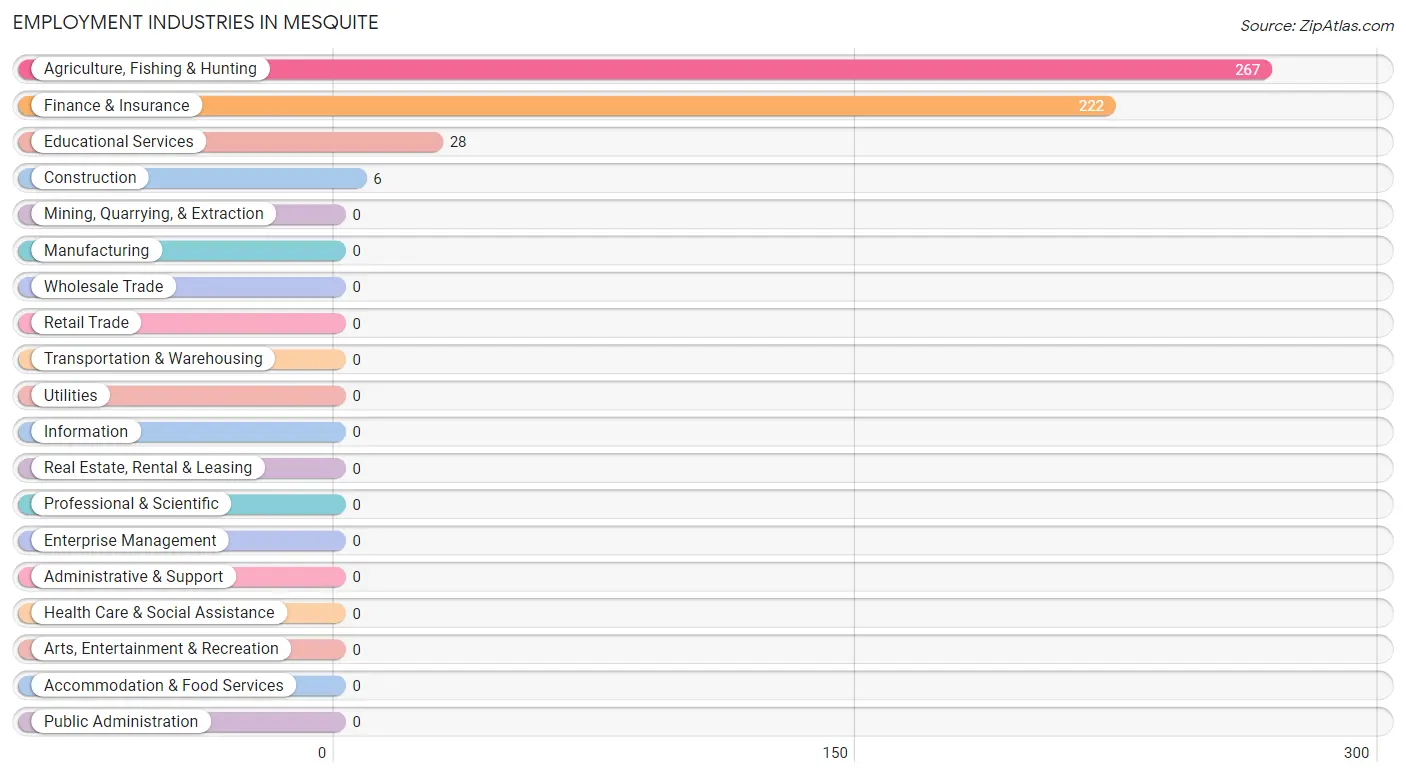
Employment Industries in Mesquite
The major employment industries in Mesquite include Agriculture, Fishing & Hunting (267 | 51.0%), Finance & Insurance (222 | 42.4%), Educational Services (28 | 5.3%), and Construction (6 | 1.1%).
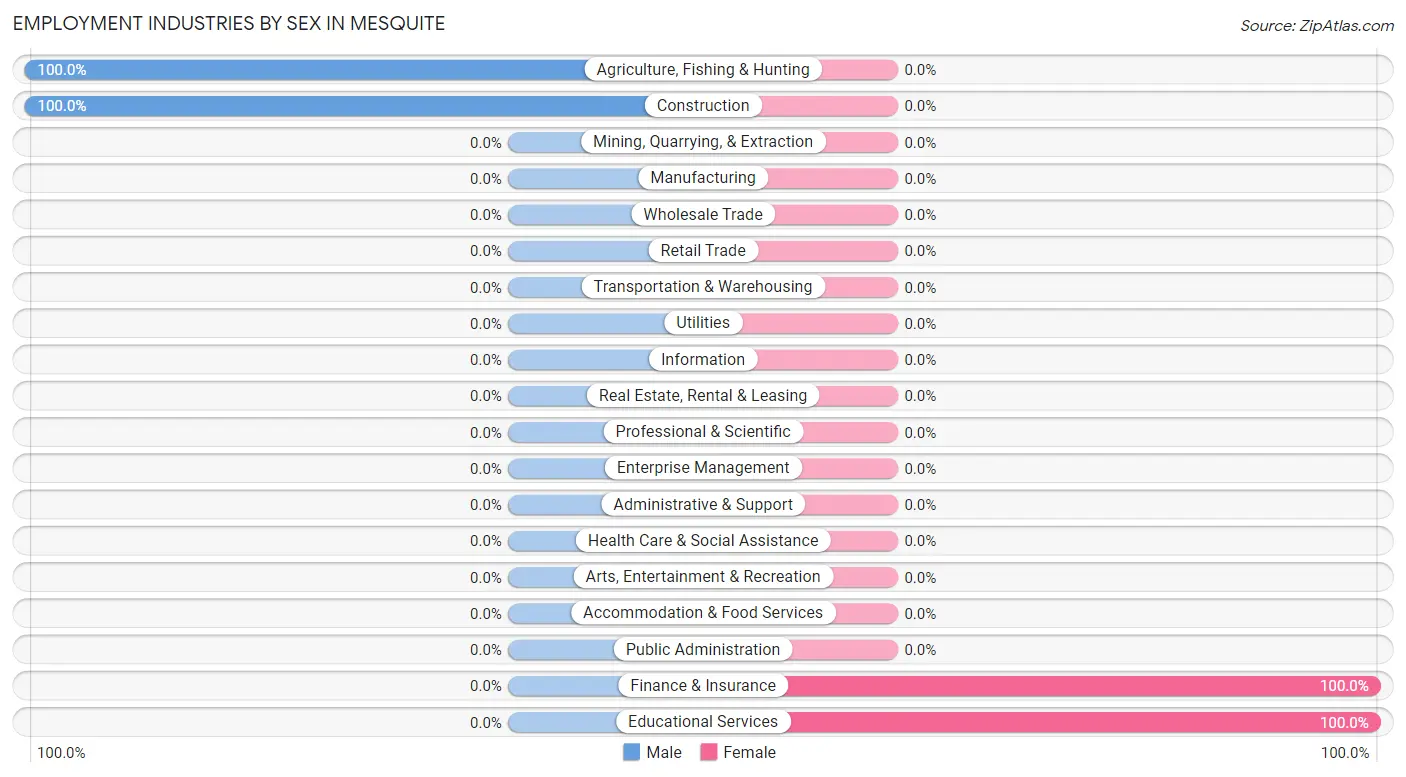
Employment Industries by Sex in Mesquite
The Mesquite industries that see more men than women are Agriculture, Fishing & Hunting (100.0%), and Construction (100.0%), whereas the industries that tend to have a higher number of women are Finance & Insurance (100.0%), and Educational Services (100.0%).
| Industry | Male | Female |
| Agriculture, Fishing & Hunting | 267 (100.0%) | 0 (0.0%) |
| Mining, Quarrying, & Extraction | 0 (0.0%) | 0 (0.0%) |
| Construction | 6 (100.0%) | 0 (0.0%) |
| Manufacturing | 0 (0.0%) | 0 (0.0%) |
| Wholesale Trade | 0 (0.0%) | 0 (0.0%) |
| Retail Trade | 0 (0.0%) | 0 (0.0%) |
| Transportation & Warehousing | 0 (0.0%) | 0 (0.0%) |
| Utilities | 0 (0.0%) | 0 (0.0%) |
| Information | 0 (0.0%) | 0 (0.0%) |
| Finance & Insurance | 0 (0.0%) | 222 (100.0%) |
| Real Estate, Rental & Leasing | 0 (0.0%) | 0 (0.0%) |
| Professional & Scientific | 0 (0.0%) | 0 (0.0%) |
| Enterprise Management | 0 (0.0%) | 0 (0.0%) |
| Administrative & Support | 0 (0.0%) | 0 (0.0%) |
| Educational Services | 0 (0.0%) | 28 (100.0%) |
| Health Care & Social Assistance | 0 (0.0%) | 0 (0.0%) |
| Arts, Entertainment & Recreation | 0 (0.0%) | 0 (0.0%) |
| Accommodation & Food Services | 0 (0.0%) | 0 (0.0%) |
| Public Administration | 0 (0.0%) | 0 (0.0%) |
| Total | 273 (52.2%) | 250 (47.8%) |
Education in Mesquite
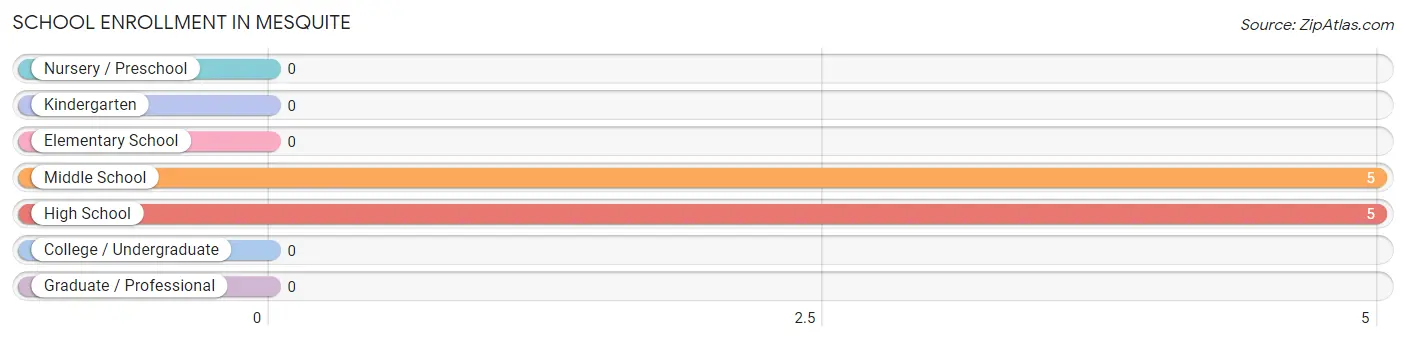
School Enrollment in Mesquite
The most common levels of schooling among the 10 students in Mesquite are middle school (5 | 50.0%), and high school (5 | 50.0%).
| School Level | # Students | % Students |
| Nursery / Preschool | 0 | 0.0% |
| Kindergarten | 0 | 0.0% |
| Elementary School | 0 | 0.0% |
| Middle School | 5 | 50.0% |
| High School | 5 | 50.0% |
| College / Undergraduate | 0 | 0.0% |
| Graduate / Professional | 0 | 0.0% |
| Total | 10 | 100.0% |
School Enrollment by Age by Funding Source in Mesquite
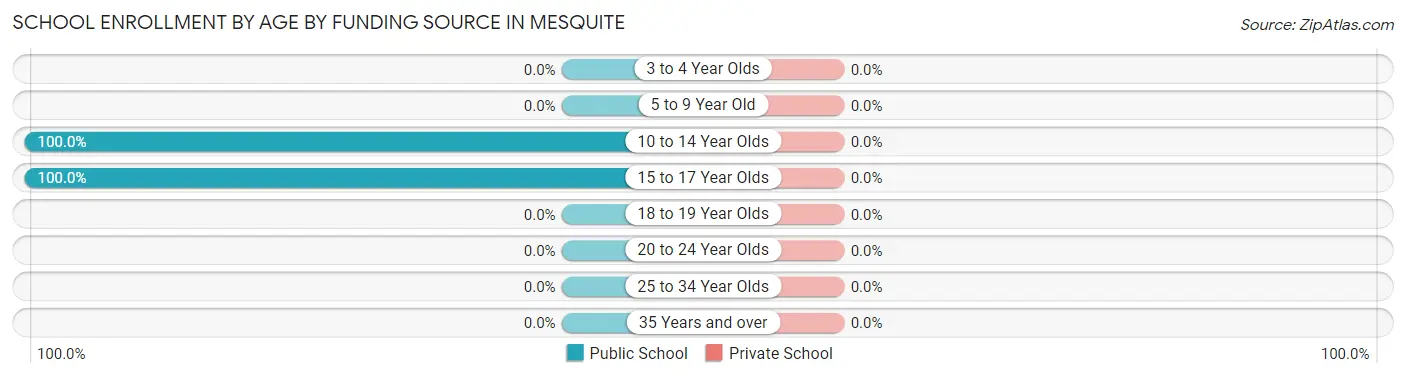
| Age Bracket | Public School | Private School |
| 3 to 4 Year Olds | 0 (0.0%) | 0 (0.0%) |
| 5 to 9 Year Old | 0 (0.0%) | 0 (0.0%) |
| 10 to 14 Year Olds | 5 (100.0%) | 0 (0.0%) |
| 15 to 17 Year Olds | 5 (100.0%) | 0 (0.0%) |
| 18 to 19 Year Olds | 0 (0.0%) | 0 (0.0%) |
| 20 to 24 Year Olds | 0 (0.0%) | 0 (0.0%) |
| 25 to 34 Year Olds | 0 (0.0%) | 0 (0.0%) |
| 35 Years and over | 0 (0.0%) | 0 (0.0%) |
| Total | 10 (100.0%) | 0 (0.0%) |
Educational Attainment by Field of Study in Mesquite
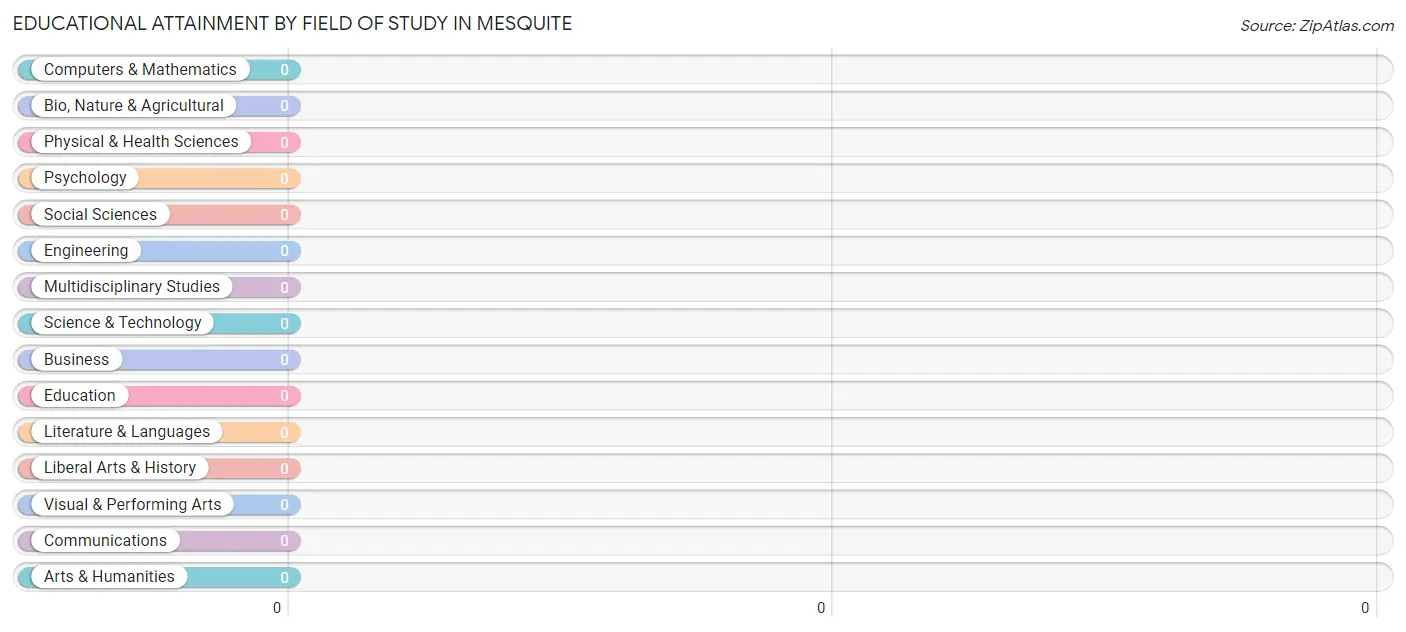
| Field of Study | # Graduates | % Graduates |
| Computers & Mathematics | 0 | 0.0% |
| Bio, Nature & Agricultural | 0 | 0.0% |
| Physical & Health Sciences | 0 | 0.0% |
| Psychology | 0 | 0.0% |
| Social Sciences | 0 | 0.0% |
| Engineering | 0 | 0.0% |
| Multidisciplinary Studies | 0 | 0.0% |
| Science & Technology | 0 | 0.0% |
| Business | 0 | 0.0% |
| Education | 0 | 0.0% |
| Literature & Languages | 0 | 0.0% |
| Liberal Arts & History | 0 | 0.0% |
| Visual & Performing Arts | 0 | 0.0% |
| Communications | 0 | 0.0% |
| Arts & Humanities | 0 | 0.0% |
| Total | 0 | 0.0% |
Transportation & Commute in Mesquite
Vehicle Availability by Sex in Mesquite
The most prevalent vehicle ownership categories in Mesquite are males with 2 vehicles (267, accounting for 97.8%) and females with 2 vehicles (222, making up 120.3%).
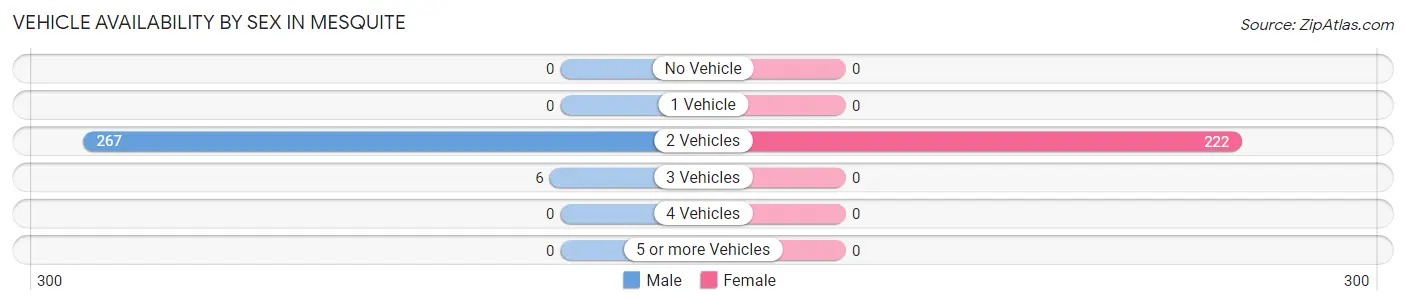
| Vehicles Available | Male | Female |
| No Vehicle | 0 (0.0%) | 0 (0.0%) |
| 1 Vehicle | 0 (0.0%) | 0 (0.0%) |
| 2 Vehicles | 267 (97.8%) | 222 (100.0%) |
| 3 Vehicles | 6 (2.2%) | 0 (0.0%) |
| 4 Vehicles | 0 (0.0%) | 0 (0.0%) |
| 5 or more Vehicles | 0 (0.0%) | 0 (0.0%) |
| Total | 273 (100.0%) | 222 (100.0%) |
Commute Time in Mesquite
The most frequently occuring commute durations in Mesquite are 20 to 24 minutes (489 commuters, 98.8%), 15 to 19 minutes (6 commuters, 1.2%), and less than 5 minutes (0 commuters, 0.0%).
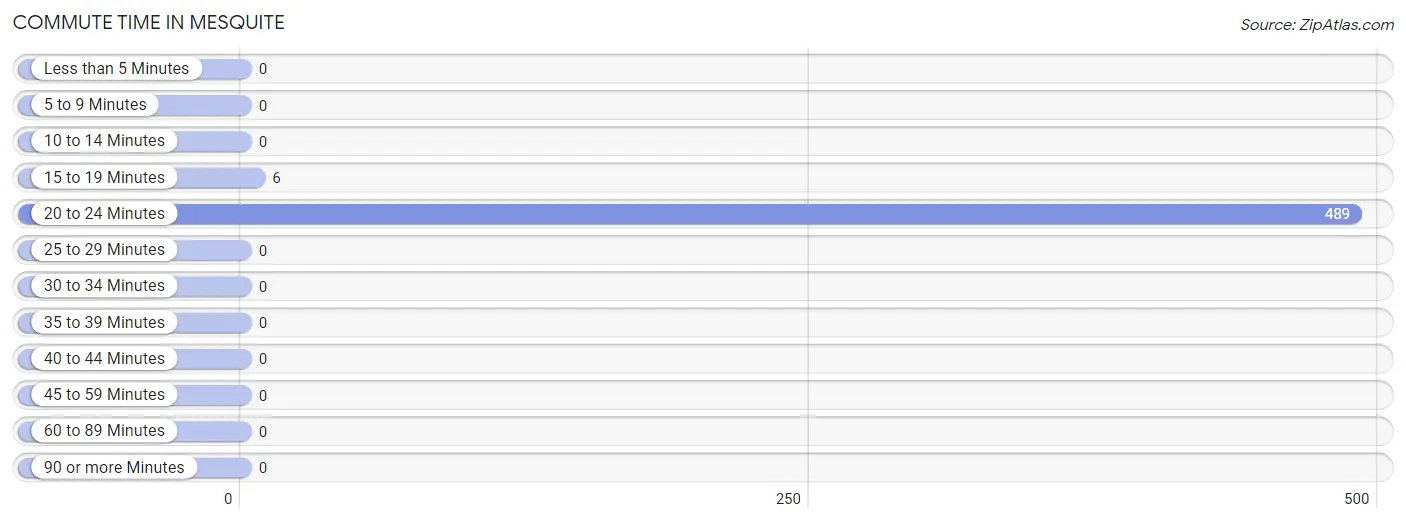
| Commute Time | # Commuters | % Commuters |
| Less than 5 Minutes | 0 | 0.0% |
| 5 to 9 Minutes | 0 | 0.0% |
| 10 to 14 Minutes | 0 | 0.0% |
| 15 to 19 Minutes | 6 | 1.2% |
| 20 to 24 Minutes | 489 | 98.8% |
| 25 to 29 Minutes | 0 | 0.0% |
| 30 to 34 Minutes | 0 | 0.0% |
| 35 to 39 Minutes | 0 | 0.0% |
| 40 to 44 Minutes | 0 | 0.0% |
| 45 to 59 Minutes | 0 | 0.0% |
| 60 to 89 Minutes | 0 | 0.0% |
| 90 or more Minutes | 0 | 0.0% |
Commute Time by Sex in Mesquite
The most common commute times in Mesquite are 20 to 24 minutes (267 commuters, 97.8%) for males and 20 to 24 minutes (222 commuters, 100.0%) for females.
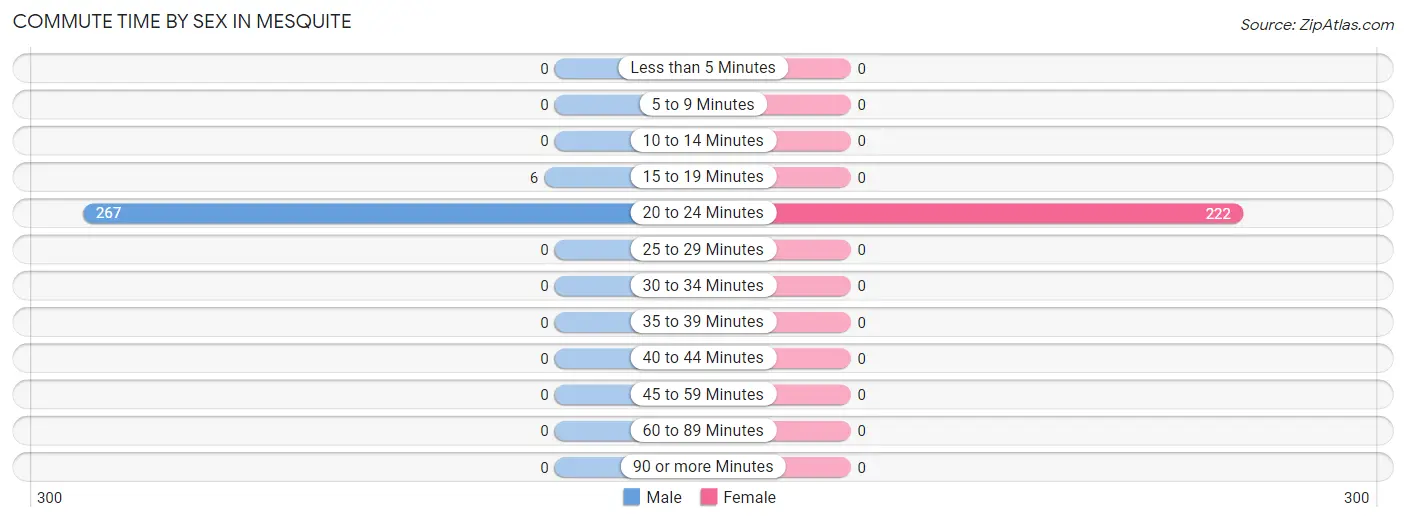
| Commute Time | Male | Female |
| Less than 5 Minutes | 0 (0.0%) | 0 (0.0%) |
| 5 to 9 Minutes | 0 (0.0%) | 0 (0.0%) |
| 10 to 14 Minutes | 0 (0.0%) | 0 (0.0%) |
| 15 to 19 Minutes | 6 (2.2%) | 0 (0.0%) |
| 20 to 24 Minutes | 267 (97.8%) | 222 (100.0%) |
| 25 to 29 Minutes | 0 (0.0%) | 0 (0.0%) |
| 30 to 34 Minutes | 0 (0.0%) | 0 (0.0%) |
| 35 to 39 Minutes | 0 (0.0%) | 0 (0.0%) |
| 40 to 44 Minutes | 0 (0.0%) | 0 (0.0%) |
| 45 to 59 Minutes | 0 (0.0%) | 0 (0.0%) |
| 60 to 89 Minutes | 0 (0.0%) | 0 (0.0%) |
| 90 or more Minutes | 0 (0.0%) | 0 (0.0%) |
Time of Departure to Work by Sex in Mesquite
The most frequent times of departure to work in Mesquite are 4:00 PM to 11:59 PM (267, 97.8%) for males and 7:30 AM to 7:59 AM (222, 100.0%) for females.
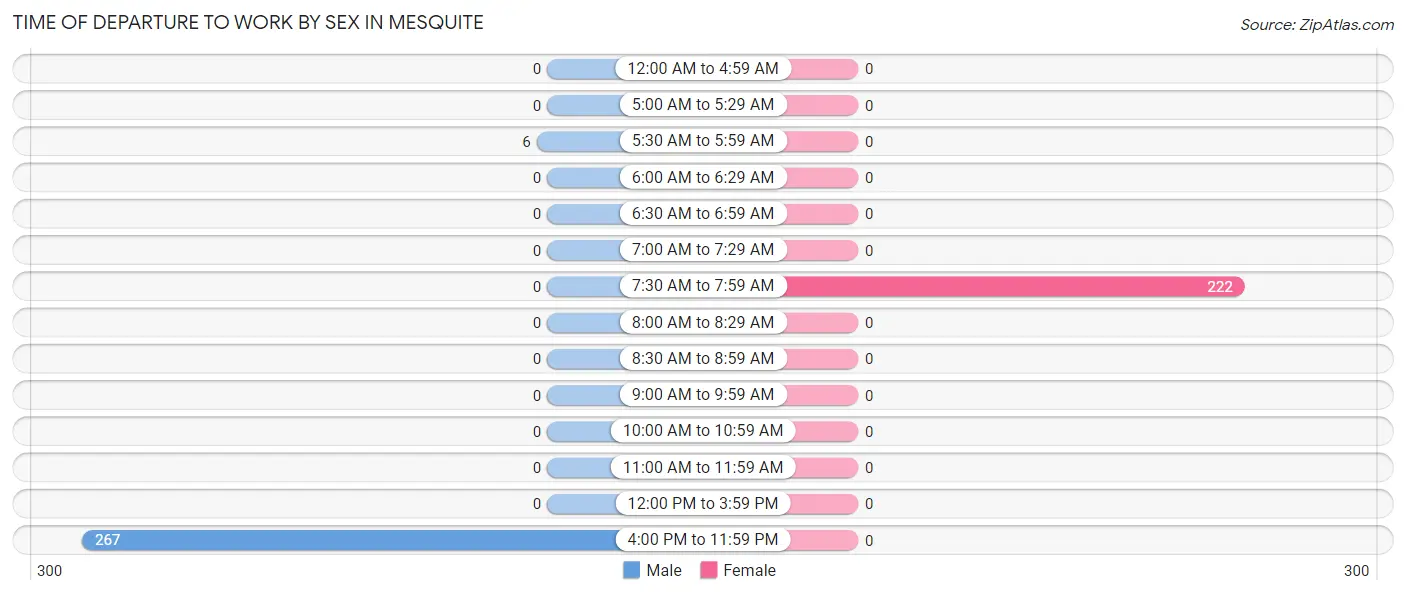
| Time of Departure | Male | Female |
| 12:00 AM to 4:59 AM | 0 (0.0%) | 0 (0.0%) |
| 5:00 AM to 5:29 AM | 0 (0.0%) | 0 (0.0%) |
| 5:30 AM to 5:59 AM | 6 (2.2%) | 0 (0.0%) |
| 6:00 AM to 6:29 AM | 0 (0.0%) | 0 (0.0%) |
| 6:30 AM to 6:59 AM | 0 (0.0%) | 0 (0.0%) |
| 7:00 AM to 7:29 AM | 0 (0.0%) | 0 (0.0%) |
| 7:30 AM to 7:59 AM | 0 (0.0%) | 222 (100.0%) |
| 8:00 AM to 8:29 AM | 0 (0.0%) | 0 (0.0%) |
| 8:30 AM to 8:59 AM | 0 (0.0%) | 0 (0.0%) |
| 9:00 AM to 9:59 AM | 0 (0.0%) | 0 (0.0%) |
| 10:00 AM to 10:59 AM | 0 (0.0%) | 0 (0.0%) |
| 11:00 AM to 11:59 AM | 0 (0.0%) | 0 (0.0%) |
| 12:00 PM to 3:59 PM | 0 (0.0%) | 0 (0.0%) |
| 4:00 PM to 11:59 PM | 267 (97.8%) | 0 (0.0%) |
| Total | 273 (100.0%) | 222 (100.0%) |
Housing Occupancy in Mesquite
Occupancy by Ownership in Mesquite
Of the total 309 dwellings in Mesquite, owner-occupied units account for 309 (100.0%), while renter-occupied units make up 0 (0.0%).
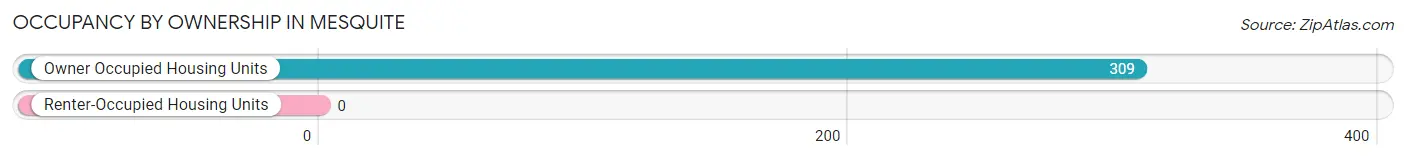
| Occupancy | # Housing Units | % Housing Units |
| Owner Occupied Housing Units | 309 | 100.0% |
| Renter-Occupied Housing Units | 0 | 0.0% |
| Total Occupied Housing Units | 309 | 100.0% |
Occupancy by Household Size in Mesquite
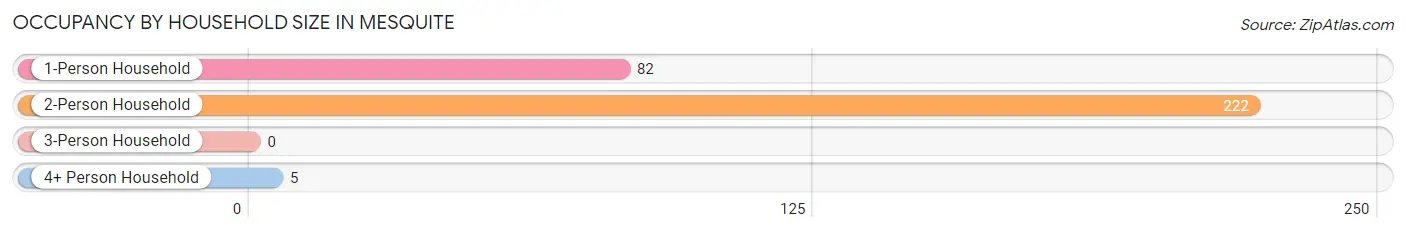
| Household Size | # Housing Units | % Housing Units |
| 1-Person Household | 82 | 26.5% |
| 2-Person Household | 222 | 71.8% |
| 3-Person Household | 0 | 0.0% |
| 4+ Person Household | 5 | 1.6% |
| Total Housing Units | 309 | 100.0% |
Occupancy by Ownership by Household Size in Mesquite
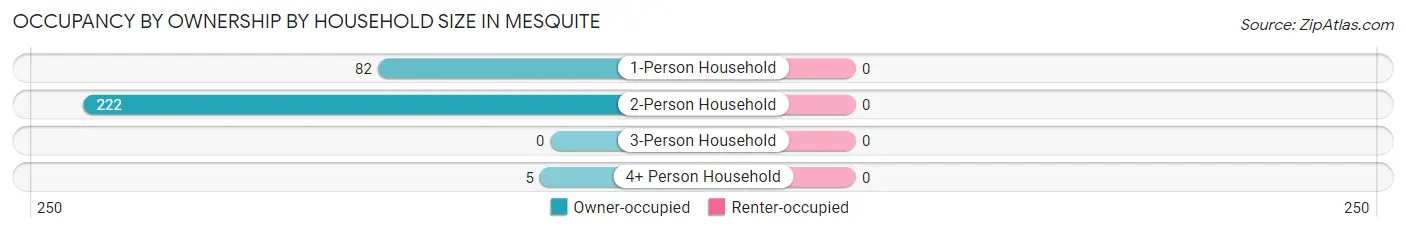
| Household Size | Owner-occupied | Renter-occupied |
| 1-Person Household | 82 (100.0%) | 0 (0.0%) |
| 2-Person Household | 222 (100.0%) | 0 (0.0%) |
| 3-Person Household | 0 (0.0%) | 0 (0.0%) |
| 4+ Person Household | 5 (100.0%) | 0 (0.0%) |
| Total Housing Units | 309 (100.0%) | 0 (0.0%) |
Occupancy by Educational Attainment in Mesquite
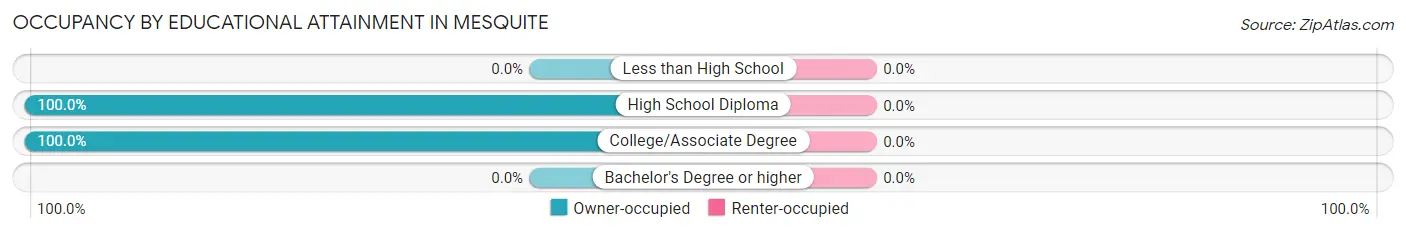
| Household Size | Owner-occupied | Renter-occupied |
| Less than High School | 0 (0.0%) | 0 (0.0%) |
| High School Diploma | 304 (100.0%) | 0 (0.0%) |
| College/Associate Degree | 5 (100.0%) | 0 (0.0%) |
| Bachelor's Degree or higher | 0 (0.0%) | 0 (0.0%) |
Occupancy by Age of Householder in Mesquite
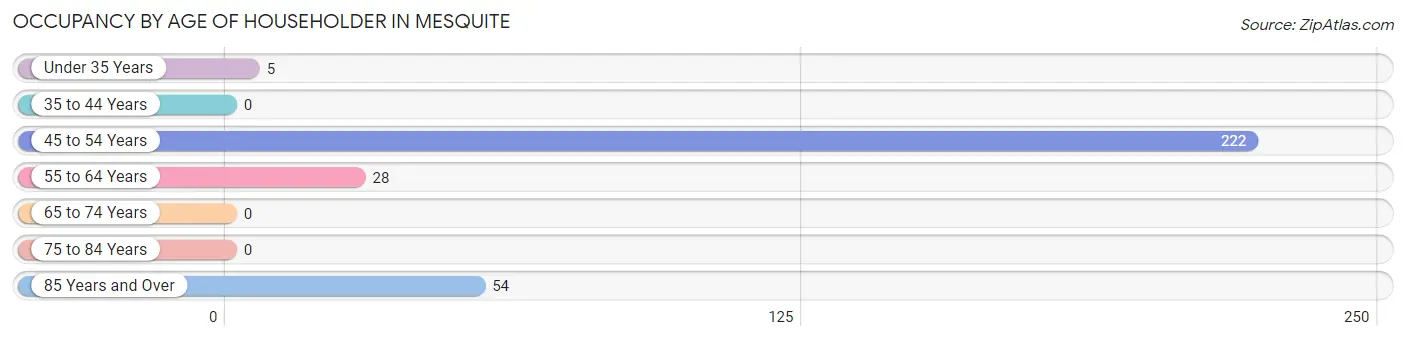
| Age Bracket | # Households | % Households |
| Under 35 Years | 5 | 1.6% |
| 35 to 44 Years | 0 | 0.0% |
| 45 to 54 Years | 222 | 71.8% |
| 55 to 64 Years | 28 | 9.1% |
| 65 to 74 Years | 0 | 0.0% |
| 75 to 84 Years | 0 | 0.0% |
| 85 Years and Over | 54 | 17.5% |
| Total | 309 | 100.0% |
Housing Finances in Mesquite
Median Income by Occupancy in Mesquite
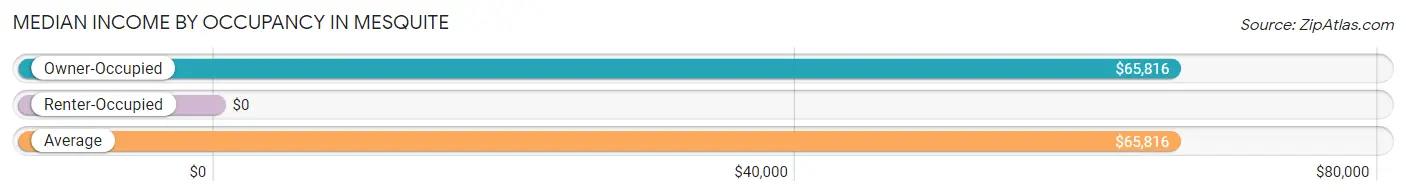
| Occupancy Type | # Households | Median Income |
| Owner-Occupied | 309 (100.0%) | $65,816 |
| Renter-Occupied | 0 (0.0%) | $0 |
| Average | 309 (100.0%) | $65,816 |
Occupancy by Householder Income Bracket in Mesquite
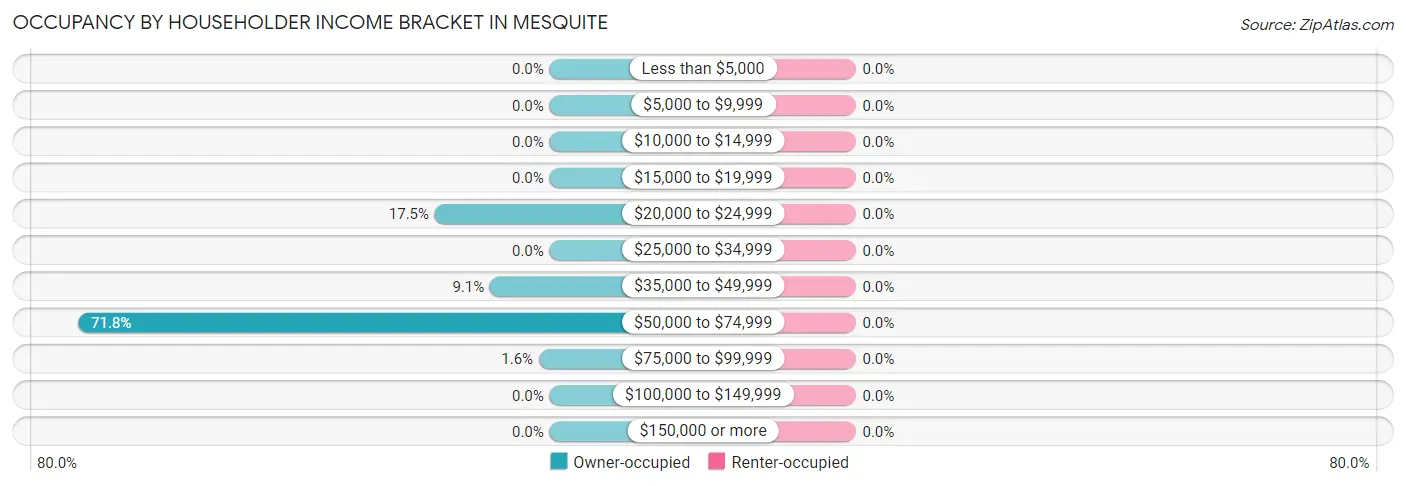
| Income Bracket | Owner-occupied | Renter-occupied |
| Less than $5,000 | 0 (0.0%) | 0 (0.0%) |
| $5,000 to $9,999 | 0 (0.0%) | 0 (0.0%) |
| $10,000 to $14,999 | 0 (0.0%) | 0 (0.0%) |
| $15,000 to $19,999 | 0 (0.0%) | 0 (0.0%) |
| $20,000 to $24,999 | 54 (17.5%) | 0 (0.0%) |
| $25,000 to $34,999 | 0 (0.0%) | 0 (0.0%) |
| $35,000 to $49,999 | 28 (9.1%) | 0 (0.0%) |
| $50,000 to $74,999 | 222 (71.8%) | 0 (0.0%) |
| $75,000 to $99,999 | 5 (1.6%) | 0 (0.0%) |
| $100,000 to $149,999 | 0 (0.0%) | 0 (0.0%) |
| $150,000 or more | 0 (0.0%) | 0 (0.0%) |
| Total | 309 (100.0%) | 0 (0.0%) |
Monthly Housing Cost Tiers in Mesquite
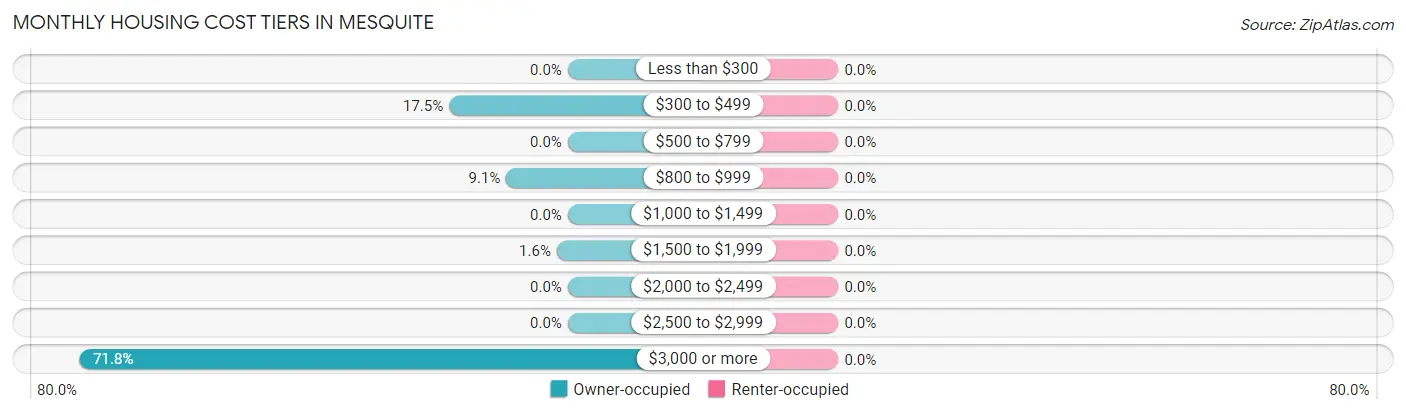
| Monthly Cost | Owner-occupied | Renter-occupied |
| Less than $300 | 0 (0.0%) | 0 (0.0%) |
| $300 to $499 | 54 (17.5%) | 0 (0.0%) |
| $500 to $799 | 0 (0.0%) | 0 (0.0%) |
| $800 to $999 | 28 (9.1%) | 0 (0.0%) |
| $1,000 to $1,499 | 0 (0.0%) | 0 (0.0%) |
| $1,500 to $1,999 | 5 (1.6%) | 0 (0.0%) |
| $2,000 to $2,499 | 0 (0.0%) | 0 (0.0%) |
| $2,500 to $2,999 | 0 (0.0%) | 0 (0.0%) |
| $3,000 or more | 222 (71.8%) | 0 (0.0%) |
| Total | 309 (100.0%) | 0 (0.0%) |
Physical Housing Characteristics in Mesquite
Housing Structures in Mesquite
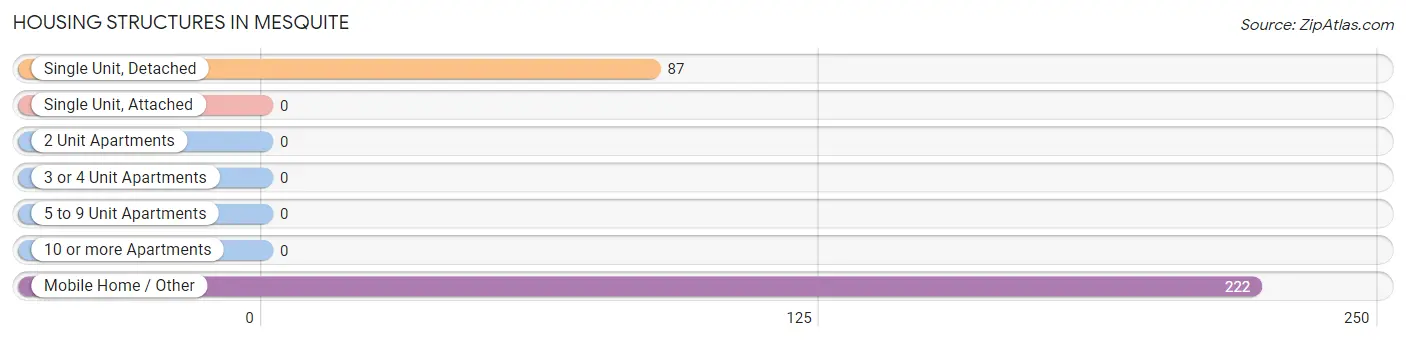
| Structure Type | # Housing Units | % Housing Units |
| Single Unit, Detached | 87 | 28.2% |
| Single Unit, Attached | 0 | 0.0% |
| 2 Unit Apartments | 0 | 0.0% |
| 3 or 4 Unit Apartments | 0 | 0.0% |
| 5 to 9 Unit Apartments | 0 | 0.0% |
| 10 or more Apartments | 0 | 0.0% |
| Mobile Home / Other | 222 | 71.8% |
| Total | 309 | 100.0% |
Housing Structures by Occupancy in Mesquite
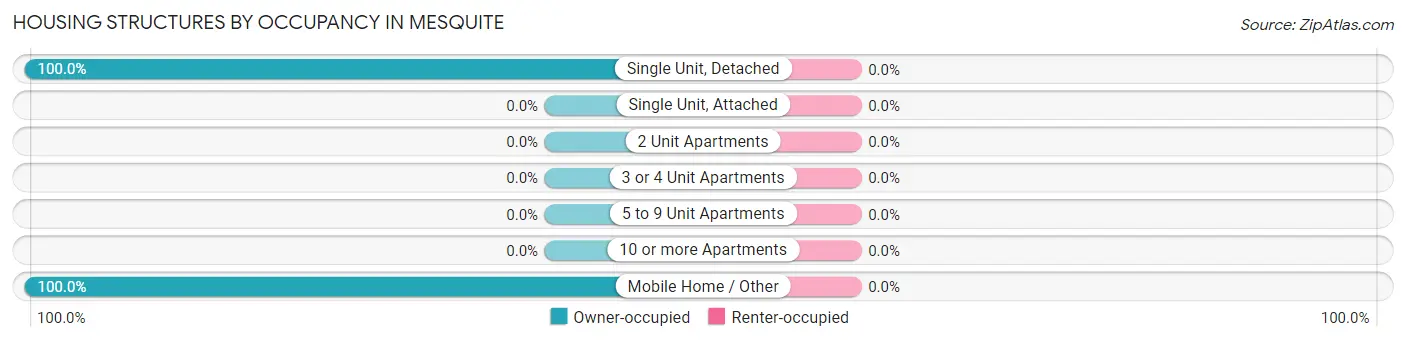
| Structure Type | Owner-occupied | Renter-occupied |
| Single Unit, Detached | 87 (100.0%) | 0 (0.0%) |
| Single Unit, Attached | 0 (0.0%) | 0 (0.0%) |
| 2 Unit Apartments | 0 (0.0%) | 0 (0.0%) |
| 3 or 4 Unit Apartments | 0 (0.0%) | 0 (0.0%) |
| 5 to 9 Unit Apartments | 0 (0.0%) | 0 (0.0%) |
| 10 or more Apartments | 0 (0.0%) | 0 (0.0%) |
| Mobile Home / Other | 222 (100.0%) | 0 (0.0%) |
| Total | 309 (100.0%) | 0 (0.0%) |
Housing Structures by Number of Rooms in Mesquite
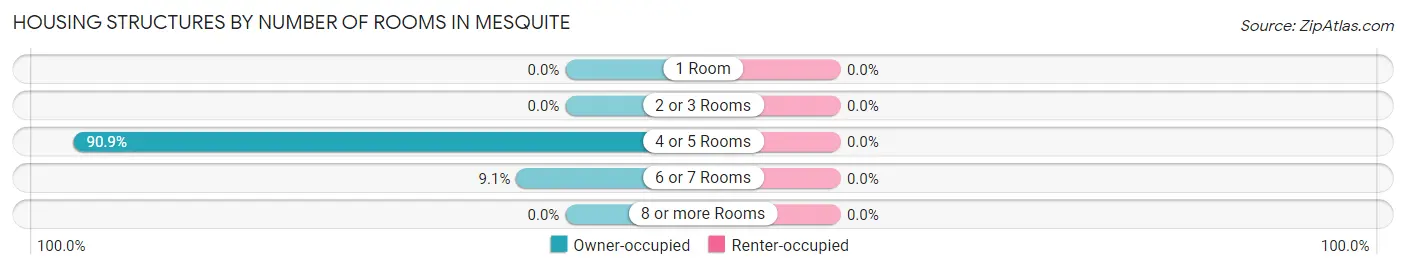
| Number of Rooms | Owner-occupied | Renter-occupied |
| 1 Room | 0 (0.0%) | 0 (0.0%) |
| 2 or 3 Rooms | 0 (0.0%) | 0 (0.0%) |
| 4 or 5 Rooms | 281 (90.9%) | 0 (0.0%) |
| 6 or 7 Rooms | 28 (9.1%) | 0 (0.0%) |
| 8 or more Rooms | 0 (0.0%) | 0 (0.0%) |
| Total | 309 (100.0%) | 0 (0.0%) |
Housing Structure by Heating Type in Mesquite
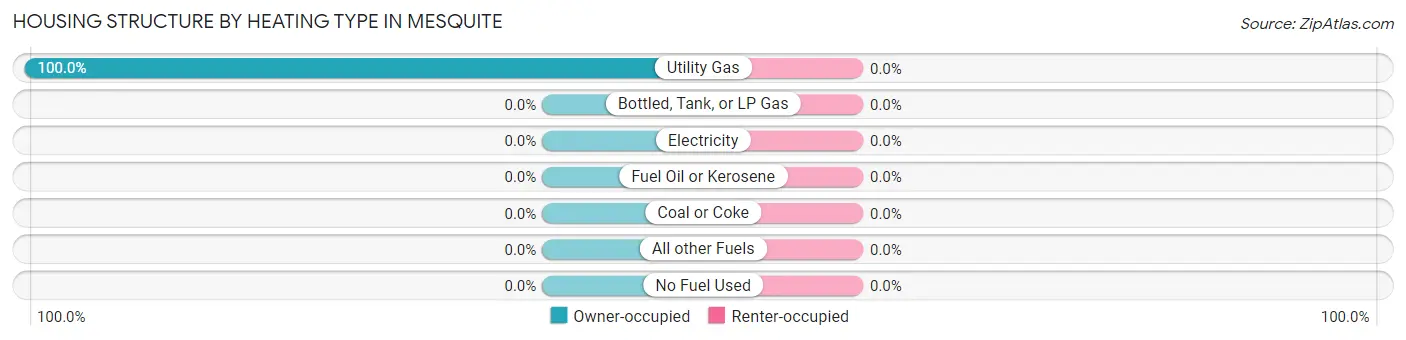
| Heating Type | Owner-occupied | Renter-occupied |
| Utility Gas | 309 (100.0%) | 0 (0.0%) |
| Bottled, Tank, or LP Gas | 0 (0.0%) | 0 (0.0%) |
| Electricity | 0 (0.0%) | 0 (0.0%) |
| Fuel Oil or Kerosene | 0 (0.0%) | 0 (0.0%) |
| Coal or Coke | 0 (0.0%) | 0 (0.0%) |
| All other Fuels | 0 (0.0%) | 0 (0.0%) |
| No Fuel Used | 0 (0.0%) | 0 (0.0%) |
| Total | 309 (100.0%) | 0 (0.0%) |
Household Vehicle Usage in Mesquite
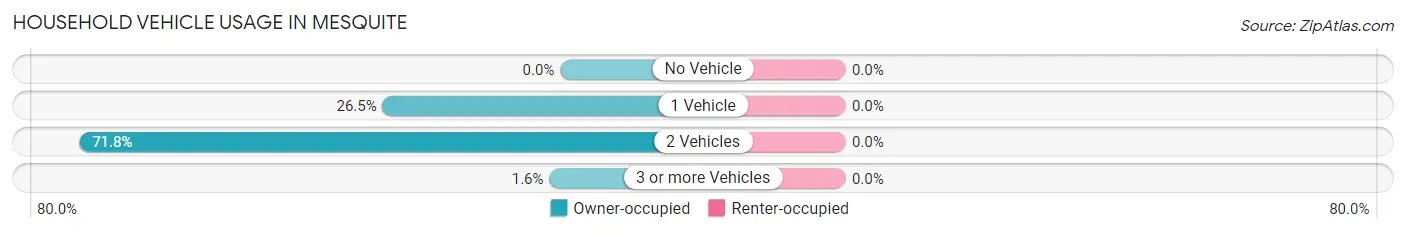
| Vehicles per Household | Owner-occupied | Renter-occupied |
| No Vehicle | 0 (0.0%) | 0 (0.0%) |
| 1 Vehicle | 82 (26.5%) | 0 (0.0%) |
| 2 Vehicles | 222 (71.8%) | 0 (0.0%) |
| 3 or more Vehicles | 5 (1.6%) | 0 (0.0%) |
| Total | 309 (100.0%) | 0 (0.0%) |
Real Estate & Mortgages in Mesquite
Real Estate and Mortgage Overview in Mesquite
| Characteristic | Without Mortgage | With Mortgage |
| Housing Units | 54 | 255 |
| Median Property Value | - | - |
| Median Household Income | - | - |
| Monthly Housing Costs | - | - |
| Real Estate Taxes | - | - |
Property Value by Mortgage Status in Mesquite
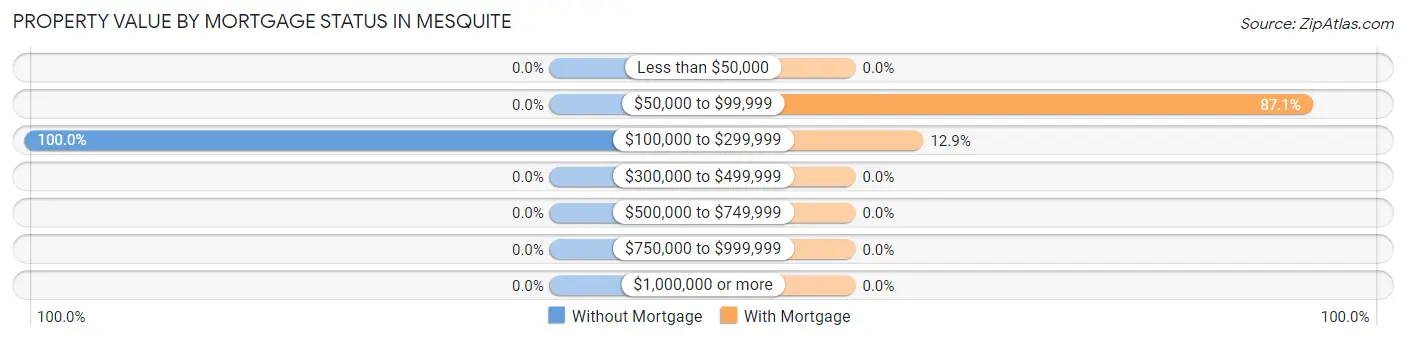
| Property Value | Without Mortgage | With Mortgage |
| Less than $50,000 | 0 (0.0%) | 0 (0.0%) |
| $50,000 to $99,999 | 0 (0.0%) | 222 (87.1%) |
| $100,000 to $299,999 | 54 (100.0%) | 33 (12.9%) |
| $300,000 to $499,999 | 0 (0.0%) | 0 (0.0%) |
| $500,000 to $749,999 | 0 (0.0%) | 0 (0.0%) |
| $750,000 to $999,999 | 0 (0.0%) | 0 (0.0%) |
| $1,000,000 or more | 0 (0.0%) | 0 (0.0%) |
| Total | 54 (100.0%) | 255 (100.0%) |
Household Income by Mortgage Status in Mesquite
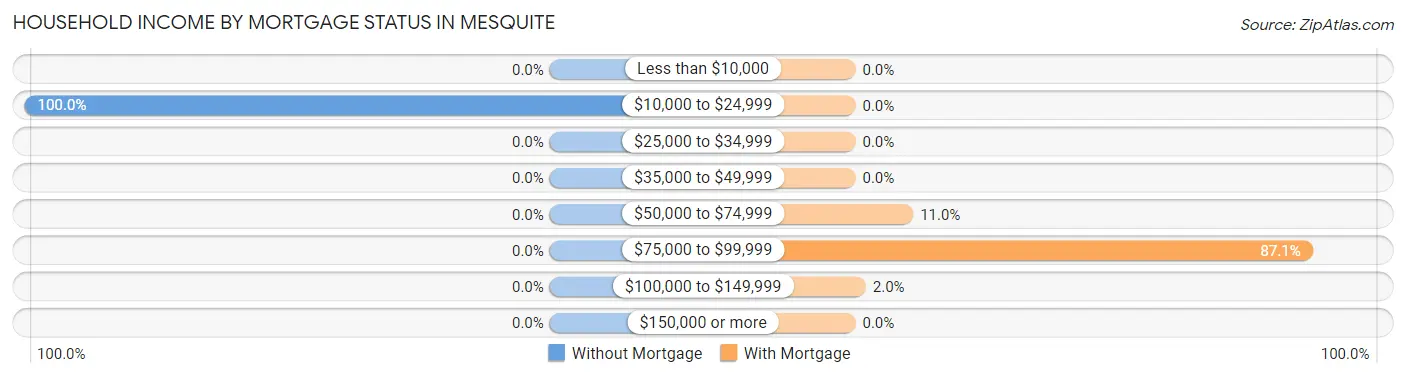
| Household Income | Without Mortgage | With Mortgage |
| Less than $10,000 | 0 (0.0%) | 0 (0.0%) |
| $10,000 to $24,999 | 54 (100.0%) | 0 (0.0%) |
| $25,000 to $34,999 | 0 (0.0%) | 0 (0.0%) |
| $35,000 to $49,999 | 0 (0.0%) | 0 (0.0%) |
| $50,000 to $74,999 | 0 (0.0%) | 28 (11.0%) |
| $75,000 to $99,999 | 0 (0.0%) | 222 (87.1%) |
| $100,000 to $149,999 | 0 (0.0%) | 5 (2.0%) |
| $150,000 or more | 0 (0.0%) | 0 (0.0%) |
| Total | 54 (100.0%) | 255 (100.0%) |
Property Value to Household Income Ratio in Mesquite
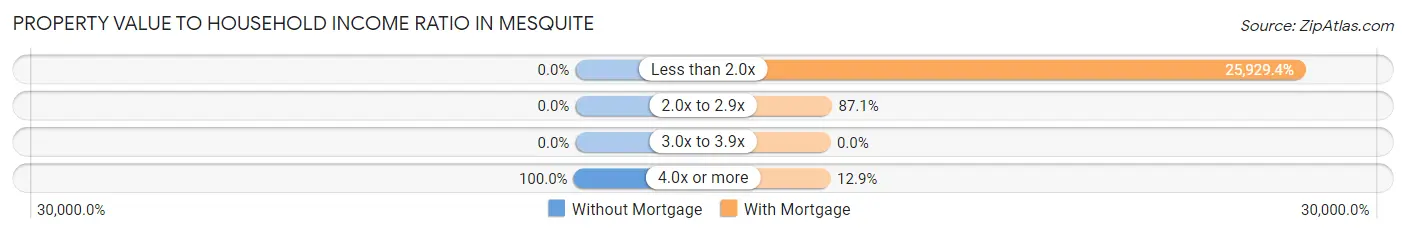
| Value-to-Income Ratio | Without Mortgage | With Mortgage |
| Less than 2.0x | 0 (0.0%) | 66,120 (25,929.4%) |
| 2.0x to 2.9x | 0 (0.0%) | 222 (87.1%) |
| 3.0x to 3.9x | 0 (0.0%) | 0 (0.0%) |
| 4.0x or more | 54 (100.0%) | 33 (12.9%) |
| Total | 54 (100.0%) | 255 (100.0%) |
Real Estate Taxes by Mortgage Status in Mesquite
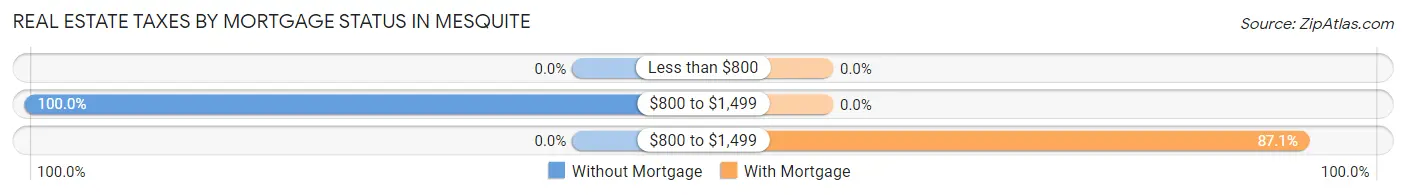
| Property Taxes | Without Mortgage | With Mortgage |
| Less than $800 | 0 (0.0%) | 0 (0.0%) |
| $800 to $1,499 | 54 (100.0%) | 0 (0.0%) |
| $800 to $1,499 | 0 (0.0%) | 222 (87.1%) |
| Total | 54 (100.0%) | 255 (100.0%) |
Health & Disability in Mesquite
Health Insurance Coverage by Age in Mesquite
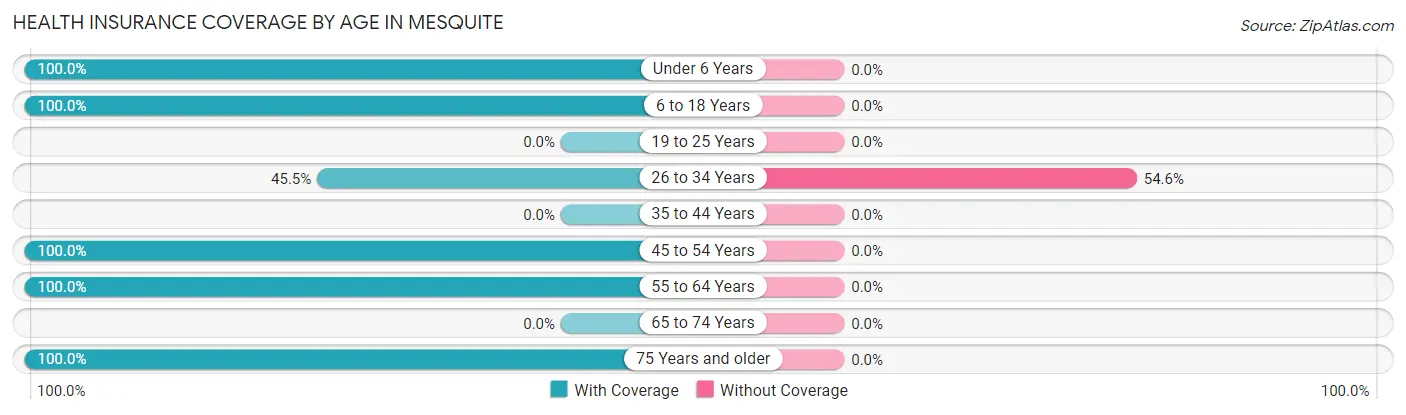
| Age Bracket | With Coverage | Without Coverage |
| Under 6 Years | 5 (100.0%) | 0 (0.0%) |
| 6 to 18 Years | 10 (100.0%) | 0 (0.0%) |
| 19 to 25 Years | 0 (0.0%) | 0 (0.0%) |
| 26 to 34 Years | 5 (45.5%) | 6 (54.5%) |
| 35 to 44 Years | 0 (0.0%) | 0 (0.0%) |
| 45 to 54 Years | 222 (100.0%) | 0 (0.0%) |
| 55 to 64 Years | 295 (100.0%) | 0 (0.0%) |
| 65 to 74 Years | 0 (0.0%) | 0 (0.0%) |
| 75 Years and older | 54 (100.0%) | 0 (0.0%) |
| Total | 591 (99.0%) | 6 (1.0%) |
Health Insurance Coverage by Citizenship Status in Mesquite
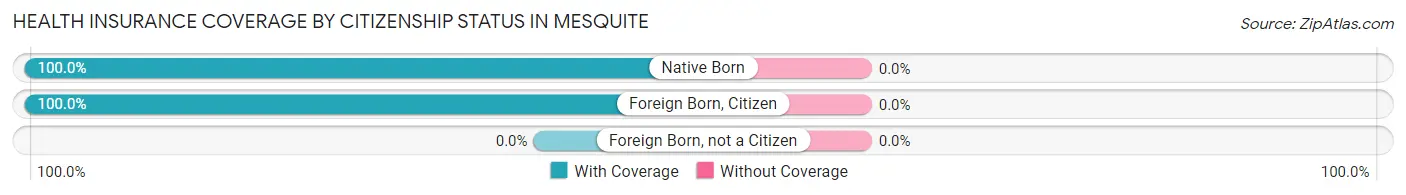
| Citizenship Status | With Coverage | Without Coverage |
| Native Born | 5 (100.0%) | 0 (0.0%) |
| Foreign Born, Citizen | 10 (100.0%) | 0 (0.0%) |
| Foreign Born, not a Citizen | 0 (0.0%) | 0 (0.0%) |
Health Insurance Coverage by Household Income in Mesquite
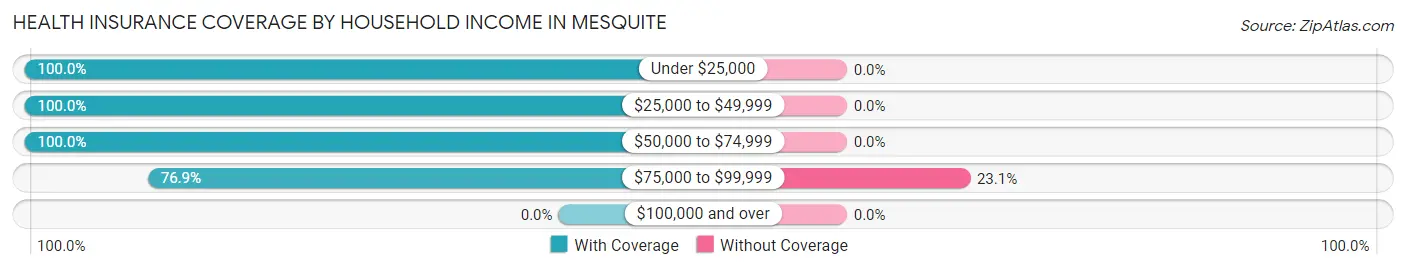
| Household Income | With Coverage | Without Coverage |
| Under $25,000 | 54 (100.0%) | 0 (0.0%) |
| $25,000 to $49,999 | 28 (100.0%) | 0 (0.0%) |
| $50,000 to $74,999 | 489 (100.0%) | 0 (0.0%) |
| $75,000 to $99,999 | 20 (76.9%) | 6 (23.1%) |
| $100,000 and over | 0 (0.0%) | 0 (0.0%) |
Public vs Private Health Insurance Coverage by Age in Mesquite
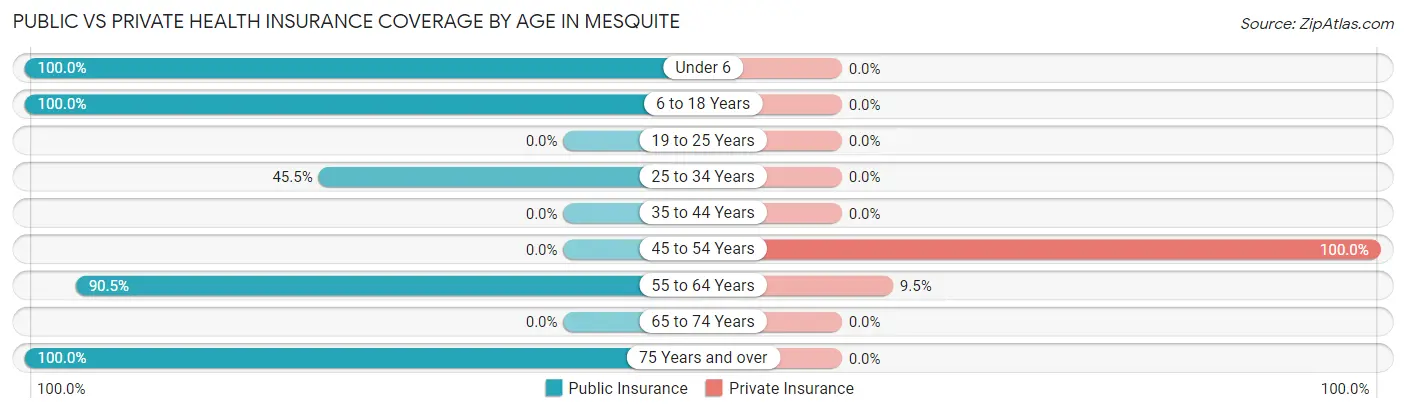
| Age Bracket | Public Insurance | Private Insurance |
| Under 6 | 5 (100.0%) | 0 (0.0%) |
| 6 to 18 Years | 10 (100.0%) | 0 (0.0%) |
| 19 to 25 Years | 0 (0.0%) | 0 (0.0%) |
| 25 to 34 Years | 5 (45.5%) | 0 (0.0%) |
| 35 to 44 Years | 0 (0.0%) | 0 (0.0%) |
| 45 to 54 Years | 0 (0.0%) | 222 (100.0%) |
| 55 to 64 Years | 267 (90.5%) | 28 (9.5%) |
| 65 to 74 Years | 0 (0.0%) | 0 (0.0%) |
| 75 Years and over | 54 (100.0%) | 0 (0.0%) |
| Total | 341 (57.1%) | 250 (41.9%) |
Disability Status by Sex by Age in Mesquite
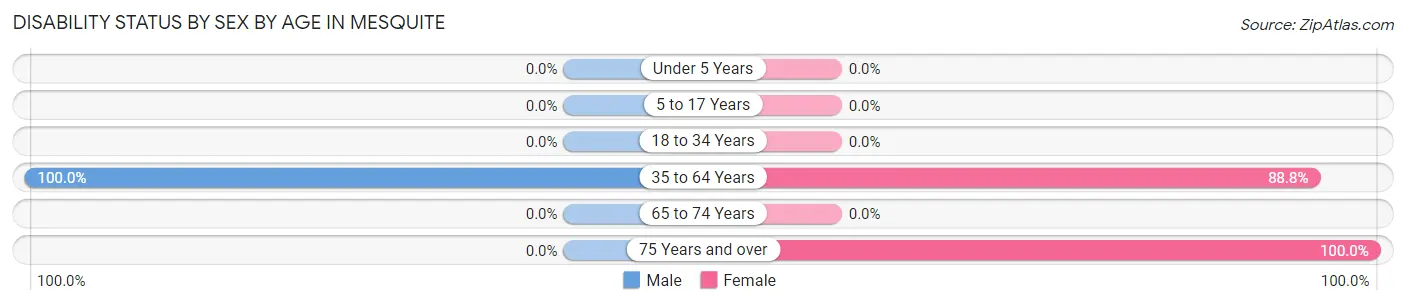
| Age Bracket | Male | Female |
| Under 5 Years | 0 (0.0%) | 0 (0.0%) |
| 5 to 17 Years | 0 (0.0%) | 0 (0.0%) |
| 18 to 34 Years | 0 (0.0%) | 0 (0.0%) |
| 35 to 64 Years | 267 (100.0%) | 222 (88.8%) |
| 65 to 74 Years | 0 (0.0%) | 0 (0.0%) |
| 75 Years and over | 0 (0.0%) | 54 (100.0%) |
Disability Class by Sex by Age in Mesquite
Disability Class: Hearing Difficulty
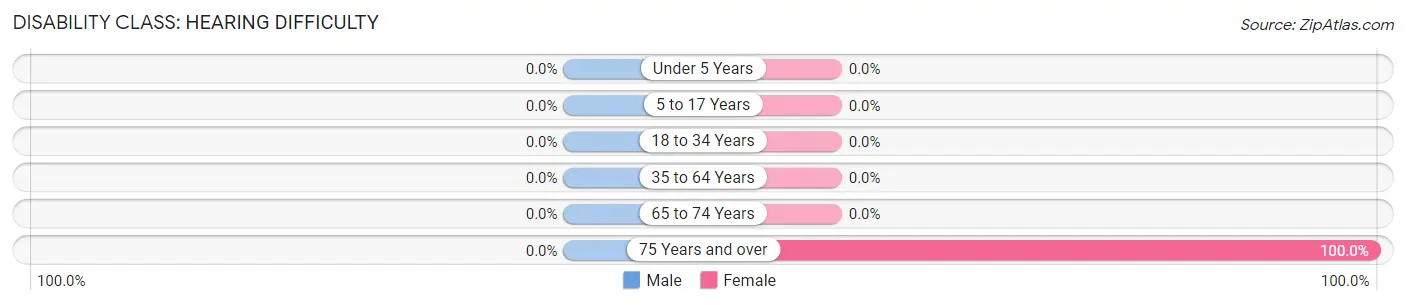
| Age Bracket | Male | Female |
| Under 5 Years | 0 (0.0%) | 0 (0.0%) |
| 5 to 17 Years | 0 (0.0%) | 0 (0.0%) |
| 18 to 34 Years | 0 (0.0%) | 0 (0.0%) |
| 35 to 64 Years | 0 (0.0%) | 0 (0.0%) |
| 65 to 74 Years | 0 (0.0%) | 0 (0.0%) |
| 75 Years and over | 0 (0.0%) | 54 (100.0%) |
Disability Class: Vision Difficulty
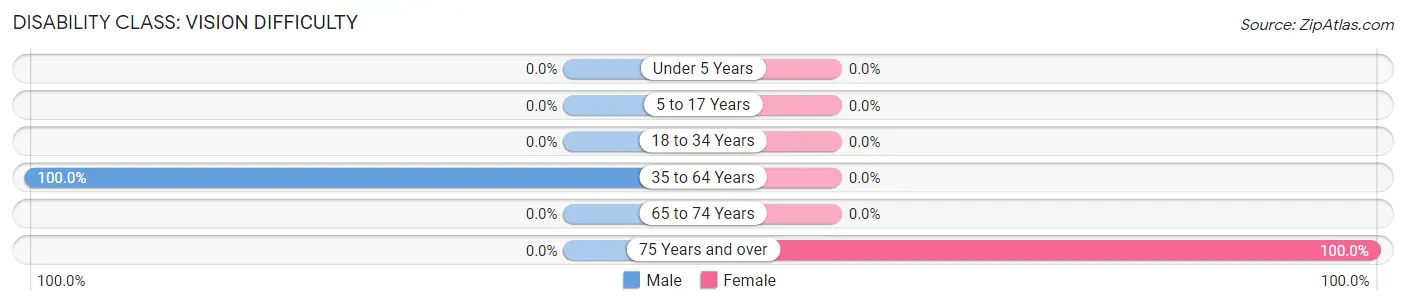
| Age Bracket | Male | Female |
| Under 5 Years | 0 (0.0%) | 0 (0.0%) |
| 5 to 17 Years | 0 (0.0%) | 0 (0.0%) |
| 18 to 34 Years | 0 (0.0%) | 0 (0.0%) |
| 35 to 64 Years | 267 (100.0%) | 0 (0.0%) |
| 65 to 74 Years | 0 (0.0%) | 0 (0.0%) |
| 75 Years and over | 0 (0.0%) | 54 (100.0%) |
Disability Class: Cognitive Difficulty
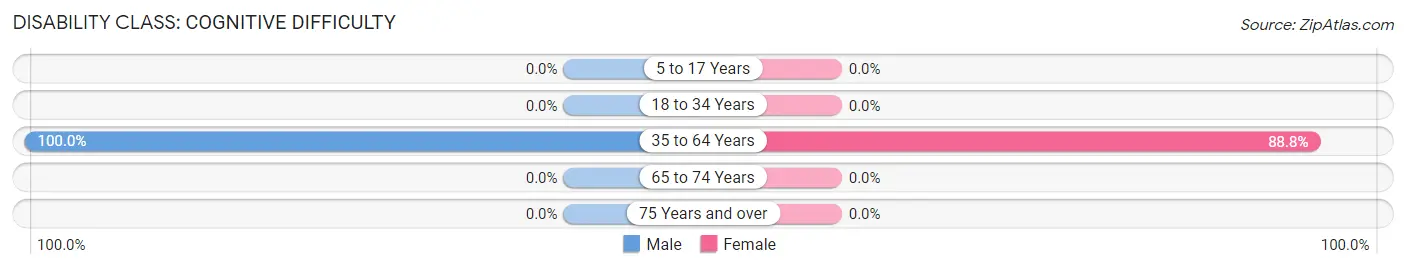
| Age Bracket | Male | Female |
| 5 to 17 Years | 0 (0.0%) | 0 (0.0%) |
| 18 to 34 Years | 0 (0.0%) | 0 (0.0%) |
| 35 to 64 Years | 267 (100.0%) | 222 (88.8%) |
| 65 to 74 Years | 0 (0.0%) | 0 (0.0%) |
| 75 Years and over | 0 (0.0%) | 0 (0.0%) |
Disability Class: Ambulatory Difficulty
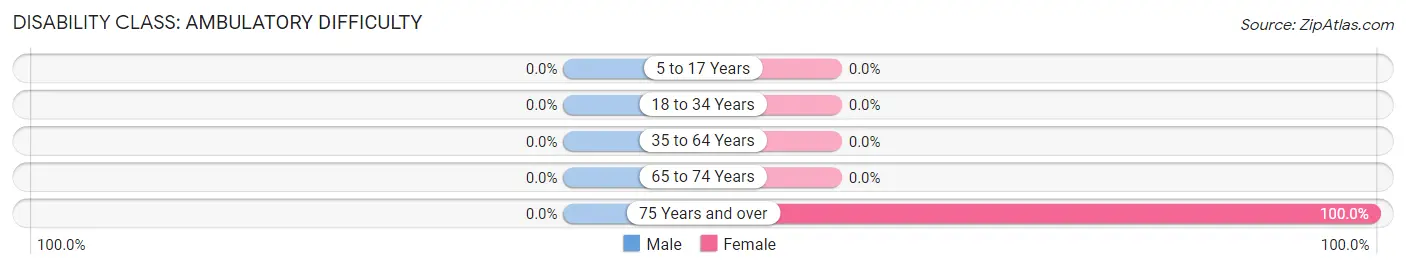
| Age Bracket | Male | Female |
| 5 to 17 Years | 0 (0.0%) | 0 (0.0%) |
| 18 to 34 Years | 0 (0.0%) | 0 (0.0%) |
| 35 to 64 Years | 0 (0.0%) | 0 (0.0%) |
| 65 to 74 Years | 0 (0.0%) | 0 (0.0%) |
| 75 Years and over | 0 (0.0%) | 54 (100.0%) |
Disability Class: Self-Care Difficulty
| Age Bracket | Male | Female |
| 5 to 17 Years | 0 (0.0%) | 0 (0.0%) |
| 18 to 34 Years | 0 (0.0%) | 0 (0.0%) |
| 35 to 64 Years | 0 (0.0%) | 0 (0.0%) |
| 65 to 74 Years | 0 (0.0%) | 0 (0.0%) |
| 75 Years and over | 0 (0.0%) | 0 (0.0%) |
Technology Access in Mesquite
Computing Device Access in Mesquite
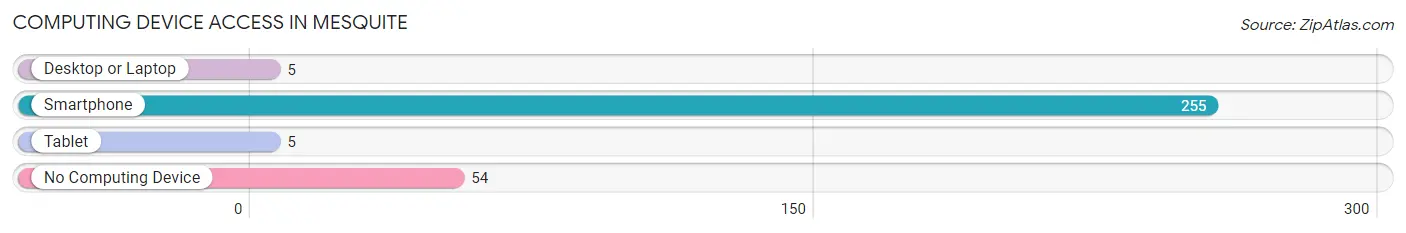
| Device Type | # Households | % Households |
| Desktop or Laptop | 5 | 1.6% |
| Smartphone | 255 | 82.5% |
| Tablet | 5 | 1.6% |
| No Computing Device | 54 | 17.5% |
| Total | 309 | 100.0% |
Internet Access in Mesquite
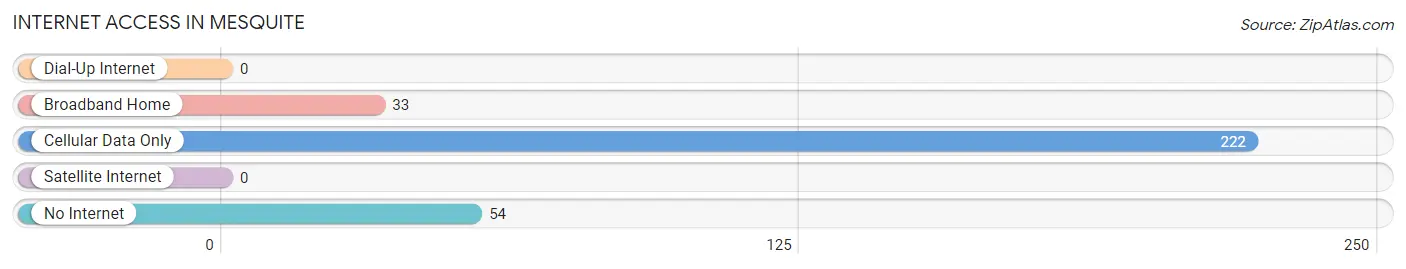
| Internet Type | # Households | % Households |
| Dial-Up Internet | 0 | 0.0% |
| Broadband Home | 33 | 10.7% |
| Cellular Data Only | 222 | 71.8% |
| Satellite Internet | 0 | 0.0% |
| No Internet | 54 | 17.5% |
| Total | 309 | 100.0% |
Mesquite Summary
Mesquite is a small city located in the southeastern corner of New Mexico, near the Texas border. It is the county seat of Dona Ana County and is part of the Las Cruces Metropolitan Statistical Area. The city has a population of approximately 14,000 people and is known for its rich history, diverse geography, and vibrant economy.
History
Mesquite was founded in 1881 by a group of settlers from Texas. The city was named after the mesquite trees that grew in the area. The settlers were attracted to the area due to its fertile soil and abundant water supply. The city quickly grew and by the early 1900s, it had become a major agricultural center. The city was also home to several businesses, including a flour mill, a brickyard, and a lumberyard.
In the early 20th century, Mesquite experienced a period of growth and prosperity. The city was home to several schools, churches, and businesses. It also had a thriving agricultural industry, with cotton, alfalfa, and pecans being the main crops.
Geography
Mesquite is located in the southeastern corner of New Mexico, near the Texas border. The city is situated in the Chihuahuan Desert, which is characterized by hot, dry summers and mild winters. The city is surrounded by several mountain ranges, including the Organ Mountains to the east and the San Andres Mountains to the west. The Rio Grande River runs through the city, providing a source of irrigation for the area’s agricultural industry.
Economy
Mesquite’s economy is largely based on agriculture. The city is home to several large farms, which produce cotton, alfalfa, pecans, and other crops. The city is also home to several businesses, including a flour mill, a brickyard, and a lumberyard. In addition, the city is home to several manufacturing companies, which produce a variety of products, including furniture, clothing, and electronics.
Demographics
As of the 2010 census, Mesquite had a population of 14,000 people. The city is predominantly Hispanic, with approximately 70% of the population identifying as such. The city also has a large Native American population, with approximately 10% of the population identifying as such. The median household income in Mesquite is $35,000, and the median home value is $90,000.
Mesquite is a small city with a rich history, diverse geography, and vibrant economy. The city is home to a diverse population and is known for its agricultural industry. The city is also home to several businesses, which provide employment opportunities for its residents.
Common Questions
What is Per Capita Income in Mesquite?
Per Capita income in Mesquite is $30,771.
What is the Median Household income in Mesquite?
Median Household Income in Mesquite is $65,816.
What is Inequality or Gini Index in Mesquite?
Inequality or Gini Index in Mesquite is 0.13.
What is the Total Population of Mesquite?
Total Population of Mesquite is 597.
What is the Total Male Population of Mesquite?
Total Male Population of Mesquite is 278.
What is the Total Female Population of Mesquite?
Total Female Population of Mesquite is 319.
What is the Ratio of Males per 100 Females in Mesquite?
There are 87.15 Males per 100 Females in Mesquite.
What is the Ratio of Females per 100 Males in Mesquite?
There are 114.75 Females per 100 Males in Mesquite.
What is the Median Population Age in Mesquite?
Median Population Age in Mesquite is 63.1 Years.
What is the Average Family Size in Mesquite
Average Family Size in Mesquite is 5.2 People.
What is the Average Household Size in Mesquite
Average Household Size in Mesquite is 1.9 People.
How Large is the Labor Force in Mesquite?
There are 523 People in the Labor Forcein in Mesquite.
What is the Percentage of People in the Labor Force in Mesquite?
89.9% of People are in the Labor Force in Mesquite.