Earnings by Sex by Educational Attainment in San Luis
Educational Attainment
Male Income
Female Income
Less than High School
-
-
High School Diploma
-
-
College or Associate's Degree
-
-
Bachelor's Degree
-
-
Graduate Degree
-
-
Total
-
-
Family Income in San Luis
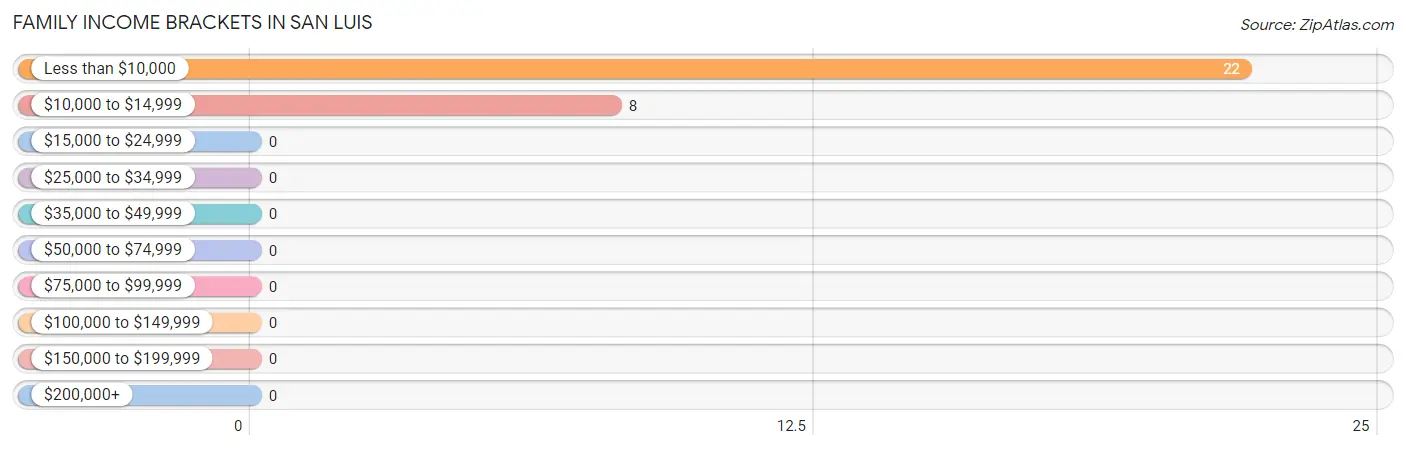
Family Income Brackets in San Luis
According to the San Luis family income data, there are 22 families falling into the less than $10,000 income range, which is the most common income bracket and makes up 73.3% of all families.
Income Bracket
# Families
% Families
Less than $10,000
22
73.3%
$10,000 to $14,999
8
26.7%
$15,000 to $24,999
0
0.0%
$25,000 to $34,999
0
0.0%
$35,000 to $49,999
0
0.0%
$50,000 to $74,999
0
0.0%
$75,000 to $99,999
0
0.0%
$100,000 to $149,999
0
0.0%
$150,000 to $199,999
0
0.0%
$200,000+
0
0.0%
Family Income by Famaliy Size in San Luis
Income Bracket
# Families
Median Income
2-Person Families
0 (0.0%)
$0
3-Person Families
30 (100.0%)
$0
4-Person Families
0 (0.0%)
$0
5-Person Families
0 (0.0%)
$0
6-Person Families
0 (0.0%)
$0
7+ Person Families
0 (0.0%)
$0
Total
30 (100.0%)
$0
Family Income by Number of Earners in San Luis
Number of Earners
# Families
Median Income
No Earners
30 (100.0%)
$0
1 Earner
0 (0.0%)
$0
2 Earners
0 (0.0%)
$0
3+ Earners
0 (0.0%)
$0
Total
30 (100.0%)
$0
Household Income in San Luis
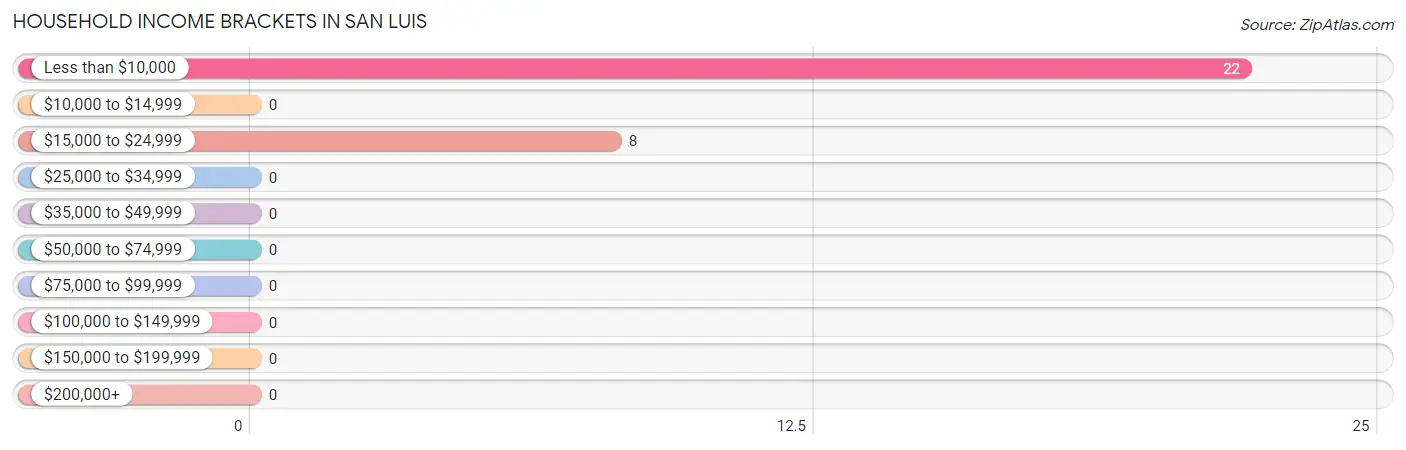
Household Income Brackets in San Luis
With 22 households falling in the category, the less than $10,000 income range is the most frequent in San Luis, accounting for 73.3% of all households.
Income Bracket
# Households
% Households
Less than $10,000
22
73.3%
$10,000 to $14,999
0
0.0%
$15,000 to $24,999
8
26.7%
$25,000 to $34,999
0
0.0%
$35,000 to $49,999
0
0.0%
$50,000 to $74,999
0
0.0%
$75,000 to $99,999
0
0.0%
$100,000 to $149,999
0
0.0%
$150,000 to $199,999
0
0.0%
$200,000+
0
0.0%
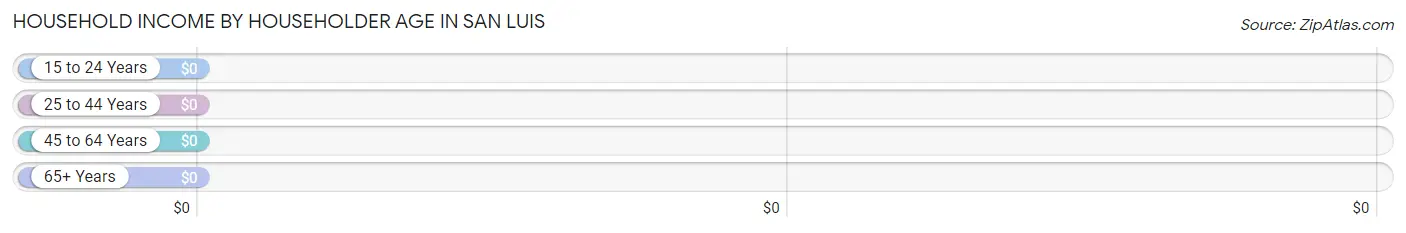
Household Income by Householder Age in San Luis
Income Bracket
# Households
Median Income
15 to 24 Years
0 (0.0%)
$0
25 to 44 Years
8 (26.7%)
$0
45 to 64 Years
22 (73.3%)
$0
65+ Years
0 (0.0%)
$0
Total
30 (100.0%)
$0
Poverty in San Luis
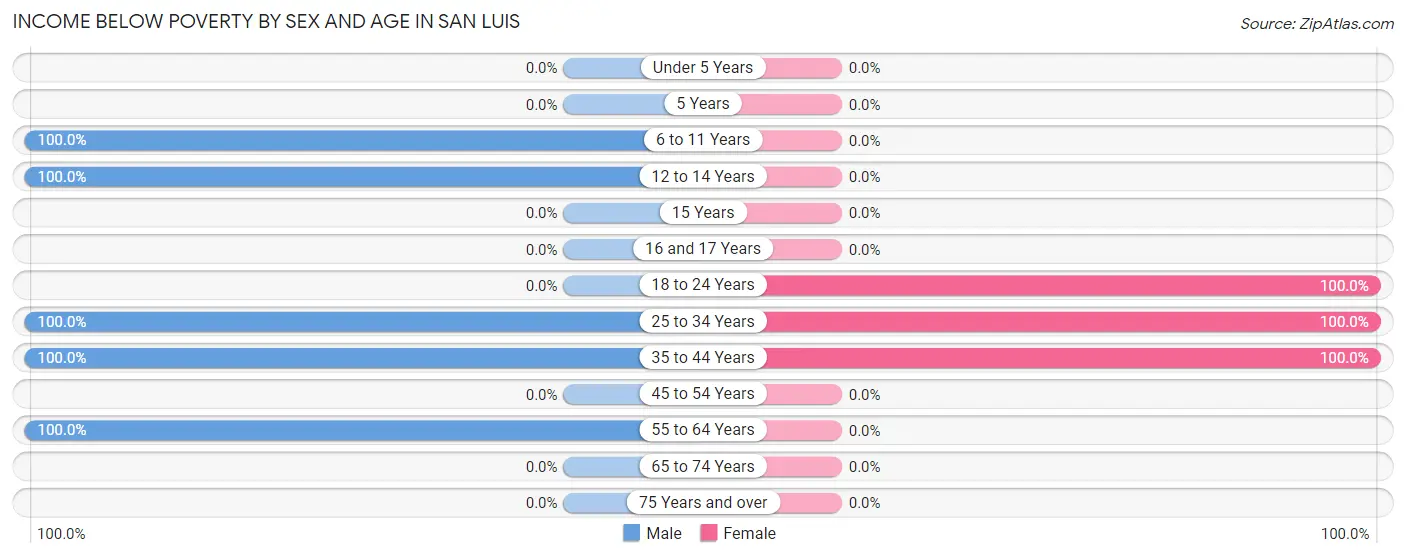
Income Below Poverty by Sex and Age in San Luis
With 100.0% poverty level for males and 100.0% for females among the residents of San Luis, 6 to 11 year old males and 18 to 24 year old females are the most vulnerable to poverty, with 18 males (100.0%) and 14 females (100.0%) in their respective age groups living below the poverty level.
Age Bracket
Male
Female
Under 5 Years
0 (0.0%)
0 (0.0%)
5 Years
0 (0.0%)
0 (0.0%)
6 to 11 Years
18 (100.0%)
0 (0.0%)
12 to 14 Years
8 (100.0%)
0 (0.0%)
15 Years
0 (0.0%)
0 (0.0%)
16 and 17 Years
0 (0.0%)
0 (0.0%)
18 to 24 Years
0 (0.0%)
14 (100.0%)
25 to 34 Years
30 (100.0%)
31 (100.0%)
35 to 44 Years
8 (100.0%)
7 (100.0%)
45 to 54 Years
0 (0.0%)
0 (0.0%)
55 to 64 Years
22 (100.0%)
0 (0.0%)
65 to 74 Years
0 (0.0%)
0 (0.0%)
75 Years and over
0 (0.0%)
0 (0.0%)
Total
86 (100.0%)
52 (100.0%)
Income Above Poverty by Sex and Age in San Luis
Age Bracket
Male
Female
Under 5 Years
0 (0.0%)
0 (0.0%)
5 Years
0 (0.0%)
0 (0.0%)
6 to 11 Years
0 (0.0%)
0 (0.0%)
12 to 14 Years
0 (0.0%)
0 (0.0%)
15 Years
0 (0.0%)
0 (0.0%)
16 and 17 Years
0 (0.0%)
0 (0.0%)
18 to 24 Years
0 (0.0%)
0 (0.0%)
25 to 34 Years
0 (0.0%)
0 (0.0%)
35 to 44 Years
0 (0.0%)
0 (0.0%)
45 to 54 Years
0 (0.0%)
0 (0.0%)
55 to 64 Years
0 (0.0%)
0 (0.0%)
65 to 74 Years
0 (0.0%)
0 (0.0%)
75 Years and over
0 (0.0%)
0 (0.0%)
Total
0 (0.0%)
0 (0.0%)
Income Below Poverty Among Married-Couple Families in San Luis
Children
Above Poverty
Below Poverty
No Children
0 (0.0%)
0 (0.0%)
1 or 2 Children
0 (0.0%)
0 (0.0%)
3 or 4 Children
0 (0.0%)
0 (0.0%)
5 or more Children
0 (0.0%)
0 (0.0%)
Total
0 (0.0%)
0 (0.0%)
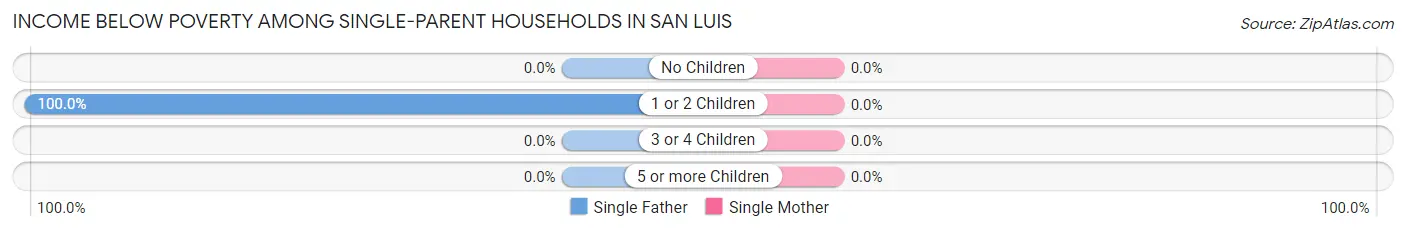
Income Below Poverty Among Single-Parent Households in San Luis
Children
Single Father
Single Mother
No Children
0 (0.0%)
0 (0.0%)
1 or 2 Children
30 (100.0%)
0 (0.0%)
3 or 4 Children
0 (0.0%)
0 (0.0%)
5 or more Children
0 (0.0%)
0 (0.0%)
Total
30 (100.0%)
0 (0.0%)
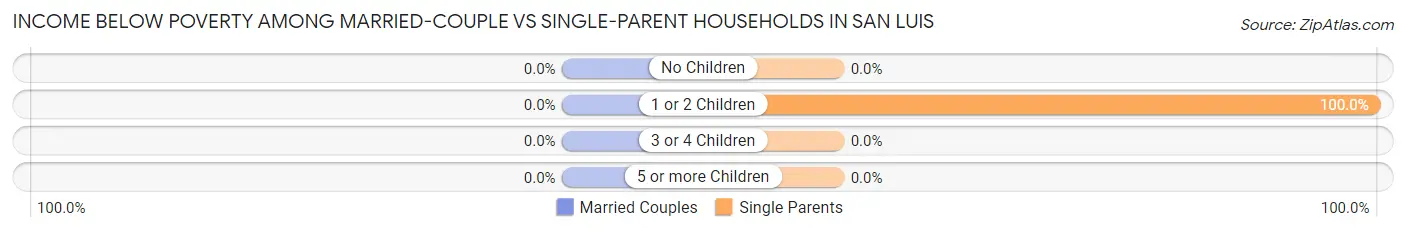
Income Below Poverty Among Married-Couple vs Single-Parent Households in San Luis
Children
Married-Couple Families
Single-Parent Households
No Children
0 (0.0%)
0 (0.0%)
1 or 2 Children
0 (0.0%)
30 (100.0%)
3 or 4 Children
0 (0.0%)
0 (0.0%)
5 or more Children
0 (0.0%)
0 (0.0%)
Total
0 (0.0%)
30 (100.0%)
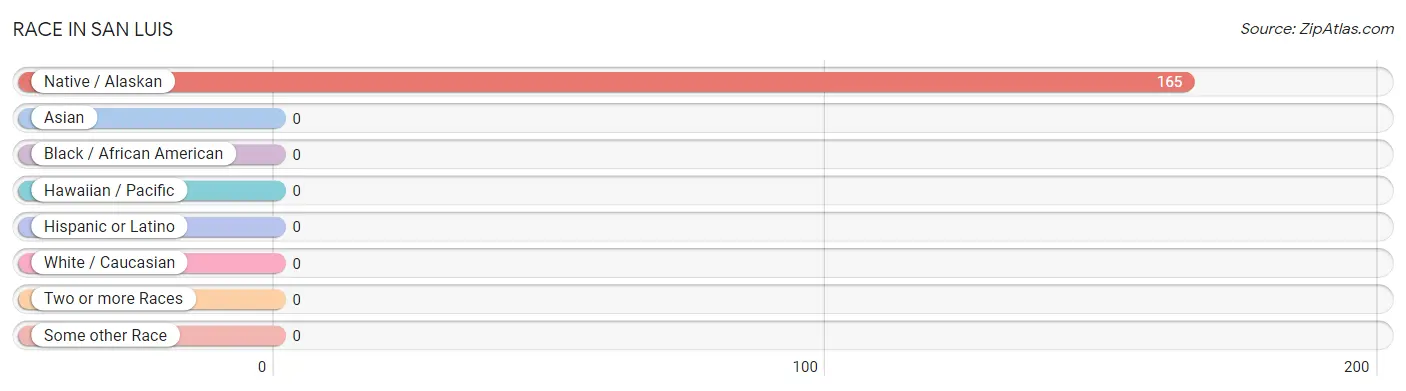
Race in San Luis
The most populous races in San Luis are , and Native / Alaskan (165 | 100.0%).
Race
# Population
% Population
Asian
0
0.0%
Black / African American
0
0.0%
Hawaiian / Pacific
0
0.0%
Hispanic or Latino
0
0.0%
Native / Alaskan
165
100.0%
White / Caucasian
0
0.0%
Two or more Races
0
0.0%
Some other Race
0
0.0%
Total
165
100.0%
Ancestry in San Luis
The most populous ancestries reported in San Luis are , and Pueblo (165 | 100.0%), together accounting for 100.0% of all San Luis residents.
Ancestry
# Population
% Population
Pueblo
165
100.0%
View All 1 Rows
Immigrants in San Luis
Immigration Origin
# Population
% Population
View All 0 Rows
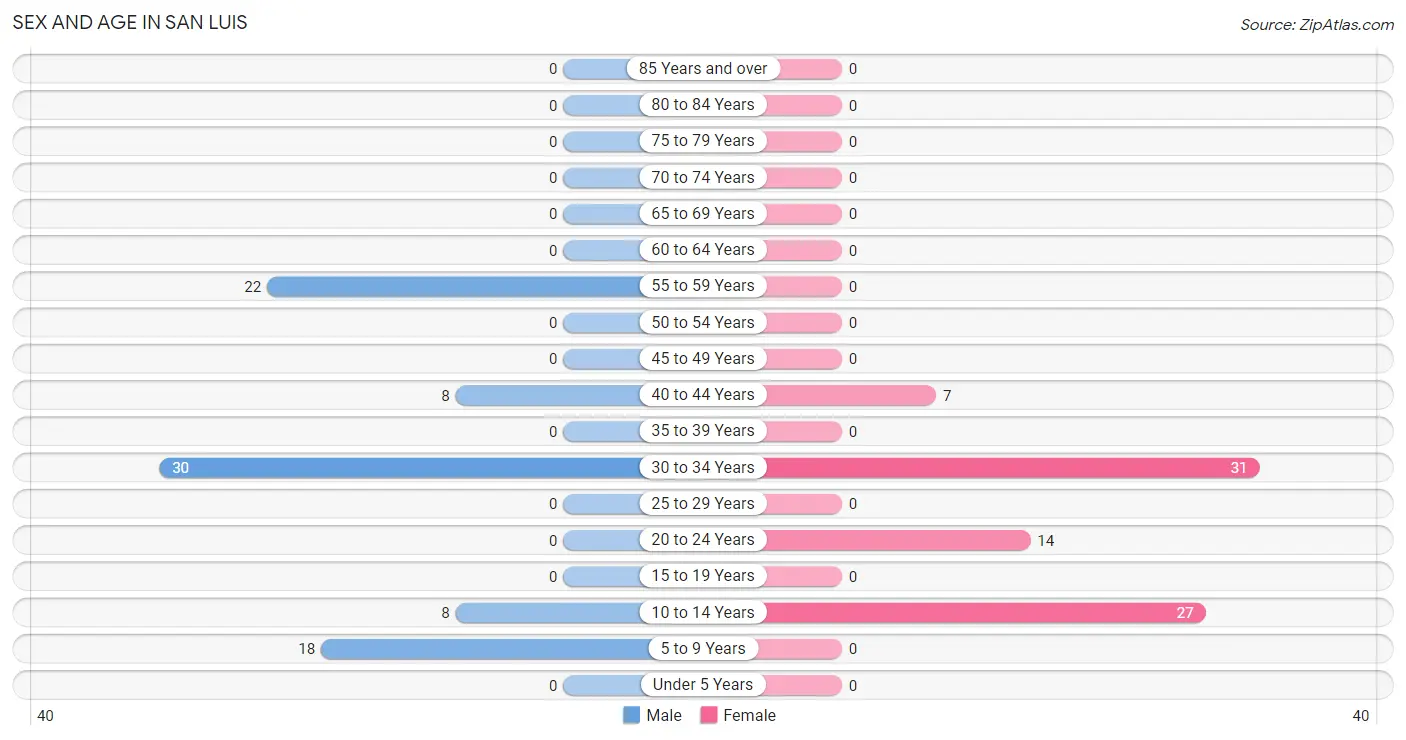
Sex and Age in San Luis
Sex and Age in San Luis
The most populous age groups in San Luis are 30 to 34 Years (30 | 34.9%) for men and 30 to 34 Years (31 | 39.2%) for women.
Age Bracket
Male
Female
Under 5 Years
0 (0.0%)
0 (0.0%)
5 to 9 Years
18 (20.9%)
0 (0.0%)
10 to 14 Years
8 (9.3%)
27 (34.2%)
15 to 19 Years
0 (0.0%)
0 (0.0%)
20 to 24 Years
0 (0.0%)
14 (17.7%)
25 to 29 Years
0 (0.0%)
0 (0.0%)
30 to 34 Years
30 (34.9%)
31 (39.2%)
35 to 39 Years
0 (0.0%)
0 (0.0%)
40 to 44 Years
8 (9.3%)
7 (8.9%)
45 to 49 Years
0 (0.0%)
0 (0.0%)
50 to 54 Years
0 (0.0%)
0 (0.0%)
55 to 59 Years
22 (25.6%)
0 (0.0%)
60 to 64 Years
0 (0.0%)
0 (0.0%)
65 to 69 Years
0 (0.0%)
0 (0.0%)
70 to 74 Years
0 (0.0%)
0 (0.0%)
75 to 79 Years
0 (0.0%)
0 (0.0%)
80 to 84 Years
0 (0.0%)
0 (0.0%)
85 Years and over
0 (0.0%)
0 (0.0%)
Total
86 (100.0%)
79 (100.0%)
Families and Households in San Luis
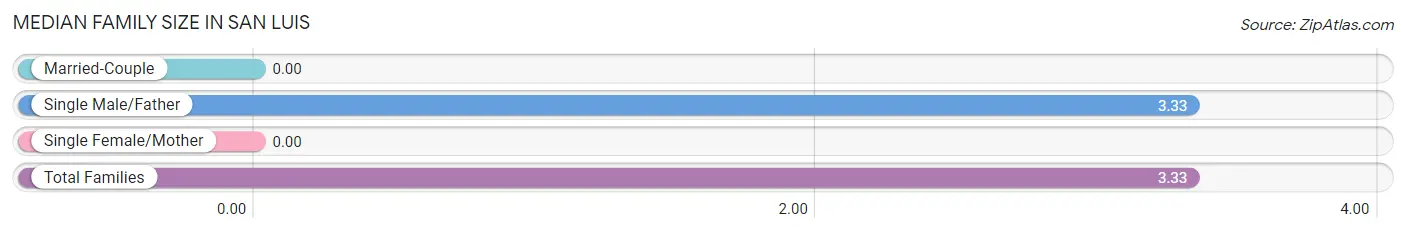
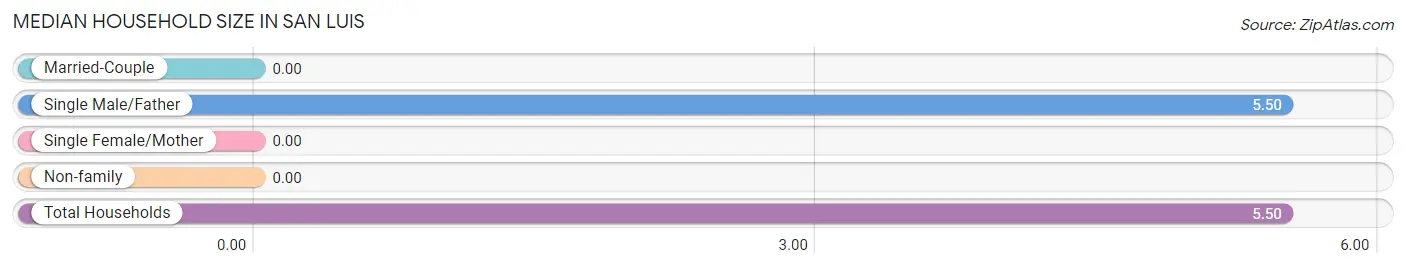
Median Family Size in San Luis
Family Type
# Families
Family Size
Married-Couple
0 (0.0%)
-
Single Male/Father
30 (100.0%)
3.33
Single Female/Mother
0 (0.0%)
-
Total Families
30 (100.0%)
3.33
Median Household Size in San Luis
Household Type
# Households
Household Size
Married-Couple
0 (0.0%)
-
Single Male/Father
30 (100.0%)
5.50
Single Female/Mother
0 (0.0%)
-
Non-family
0 (0.0%)
-
Total Households
30 (100.0%)
5.50
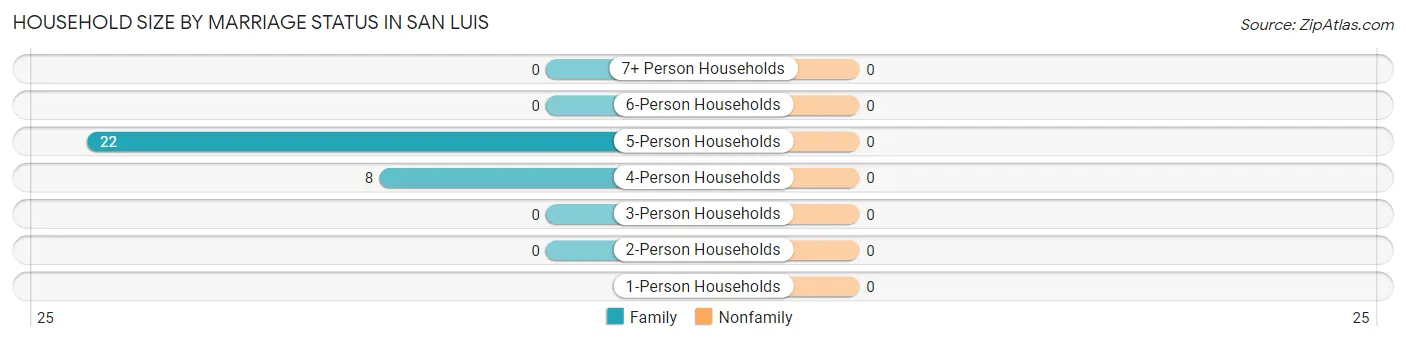
Household Size by Marriage Status in San Luis
Household Size
Family Households
Nonfamily Households
1-Person Households
-
0 (0.0%)
2-Person Households
0 (0.0%)
0 (0.0%)
3-Person Households
0 (0.0%)
0 (0.0%)
4-Person Households
8 (26.7%)
0 (0.0%)
5-Person Households
22 (73.3%)
0 (0.0%)
6-Person Households
0 (0.0%)
0 (0.0%)
7+ Person Households
0 (0.0%)
0 (0.0%)
Total
30 (100.0%)
0 (0.0%)
Female Fertility in San Luis
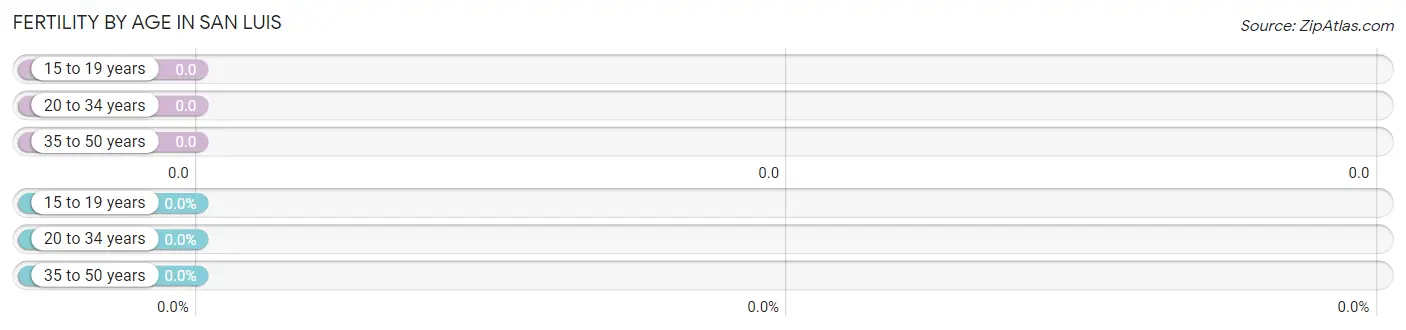
Fertility by Age in San Luis
Age Bracket
Women with Births
Births / 1,000 Women
15 to 19 years
0 (0.0%)
0.0
20 to 34 years
0 (0.0%)
0.0
35 to 50 years
0 (0.0%)
0.0
Total
0 (0.0%)
0.0
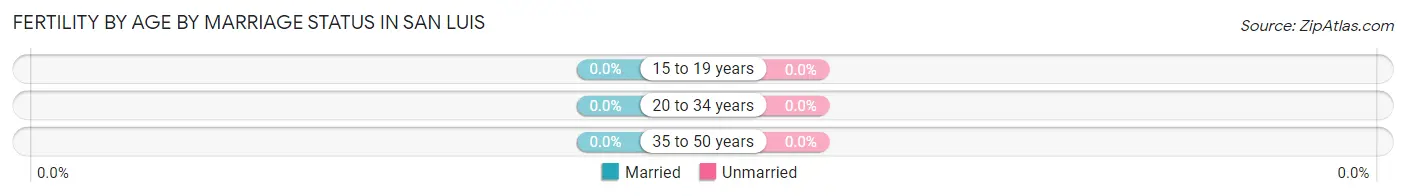
Fertility by Age by Marriage Status in San Luis
Age Bracket
Married
Unmarried
15 to 19 years
0 (0.0%)
0 (0.0%)
20 to 34 years
0 (0.0%)
0 (0.0%)
35 to 50 years
0 (0.0%)
0 (0.0%)
Total
0 (0.0%)
0 (0.0%)
Fertility by Education in San Luis
Educational Attainment
Women with Births
Births / 1,000 Women
Less than High School
0 (0.0%)
0.0
High School Diploma
0 (0.0%)
0.0
College or Associate's Degree
0 (0.0%)
0.0
Bachelor's Degree
0 (0.0%)
0.0
Graduate Degree
0 (0.0%)
0.0
Total
0 (0.0%)
0.0
Fertility by Education by Marriage Status in San Luis
Educational Attainment
Married
Unmarried
Less than High School
0 (0.0%)
0 (0.0%)
High School Diploma
0 (0.0%)
0 (0.0%)
College or Associate's Degree
0 (0.0%)
0 (0.0%)
Bachelor's Degree
0 (0.0%)
0 (0.0%)
Graduate Degree
0 (0.0%)
0 (0.0%)
Total
0 (0.0%)
0 (0.0%)
Employment Characteristics in San Luis
Employment by Class of Employer in San Luis
Employer Class
# Employees
% Employees
Private Company Employees
0
0.0%
Self-Employed (Incorporated)
0
0.0%
Self-Employed (Not Incorporated)
0
0.0%
Not-for-profit Organizations
0
0.0%
Local Government Employees
0
0.0%
State Government Employees
0
0.0%
Federal Government Employees
0
0.0%
Unpaid Family Workers
0
0.0%
Total
0
0.0%
Employment Status by Age in San Luis
Age Bracket
In Labor Force
Unemployed
16 to 19 Years
0 (0.0%)
0 (0.0%)
20 to 24 Years
0 (0.0%)
0 (0.0%)
25 to 29 Years
0 (0.0%)
0 (0.0%)
30 to 34 Years
0 (0.0%)
0 (0.0%)
35 to 44 Years
0 (0.0%)
0 (0.0%)
45 to 54 Years
0 (0.0%)
0 (0.0%)
55 to 59 Years
0 (0.0%)
0 (0.0%)
60 to 64 Years
0 (0.0%)
0 (0.0%)
65 to 74 Years
0 (0.0%)
0 (0.0%)
75 Years and over
0 (0.0%)
0 (0.0%)
Total
0 (0.0%)
0 (0.0%)
Employment Status by Educational Attainment in San Luis
Educational Attainment
In Labor Force
Unemployed
Less than High School
0 (0.0%)
0 (0.0%)
High School Diploma
0 (0.0%)
0 (0.0%)
College / Associate Degree
0 (0.0%)
0 (0.0%)
Bachelor's Degree or higher
0 (0.0%)
0 (0.0%)
Total
0 (0.0%)
0 (0.0%)
Employment Occupations by Sex in San Luis
Management, Business, Science and Arts Occupations
Management, Business, Science and Arts Occupations by Sex
Occupation
Male
Female
Management
0 (0.0%)
0 (0.0%)
Business & Financial
0 (0.0%)
0 (0.0%)
Computers, Engineering & Science
0 (0.0%)
0 (0.0%)
Computers & Mathematics
0 (0.0%)
0 (0.0%)
Architecture & Engineering
0 (0.0%)
0 (0.0%)
Life, Physical & Social Science
0 (0.0%)
0 (0.0%)
Community & Social Service
0 (0.0%)
0 (0.0%)
Education, Arts & Media
0 (0.0%)
0 (0.0%)
Legal Services & Support
0 (0.0%)
0 (0.0%)
Education Instruction & Library
0 (0.0%)
0 (0.0%)
Arts, Media & Entertainment
0 (0.0%)
0 (0.0%)
Health Diagnosing & Treating
0 (0.0%)
0 (0.0%)
Health Technologists
0 (0.0%)
0 (0.0%)
Total (Category)
0 (0.0%)
0 (0.0%)
Total (Overall)
0 (0.0%)
0 (0.0%)
Services Occupations
Services Occupations by Sex
Occupation
Male
Female
Healthcare Support
0 (0.0%)
0 (0.0%)
Security & Protection
0 (0.0%)
0 (0.0%)
Firefighting & Prevention
0 (0.0%)
0 (0.0%)
Law Enforcement
0 (0.0%)
0 (0.0%)
Food Preparation & Serving
0 (0.0%)
0 (0.0%)
Cleaning & Maintenance
0 (0.0%)
0 (0.0%)
Personal Care & Service
0 (0.0%)
0 (0.0%)
Total (Category)
0 (0.0%)
0 (0.0%)
Total (Overall)
0 (0.0%)
0 (0.0%)
Sales and Office Occupations
Sales and Office Occupations by Sex
Occupation
Male
Female
Sales & Related
0 (0.0%)
0 (0.0%)
Office & Administration
0 (0.0%)
0 (0.0%)
Total (Category)
0 (0.0%)
0 (0.0%)
Total (Overall)
0 (0.0%)
0 (0.0%)
Natural Resources, Construction and Maintenance Occupations
Natural Resources, Construction and Maintenance Occupations by Sex
Occupation
Male
Female
Farming, Fishing & Forestry
0 (0.0%)
0 (0.0%)
Construction & Extraction
0 (0.0%)
0 (0.0%)
Installation, Maintenance & Repair
0 (0.0%)
0 (0.0%)
Total (Category)
0 (0.0%)
0 (0.0%)
Total (Overall)
0 (0.0%)
0 (0.0%)
Production, Transportation and Moving Occupations
Production, Transportation and Moving Occupations by Sex
Occupation
Male
Female
Production
0 (0.0%)
0 (0.0%)
Transportation
0 (0.0%)
0 (0.0%)
Material Moving
0 (0.0%)
0 (0.0%)
Total (Category)
0 (0.0%)
0 (0.0%)
Total (Overall)
0 (0.0%)
0 (0.0%)
Employment Industries by Sex in San Luis
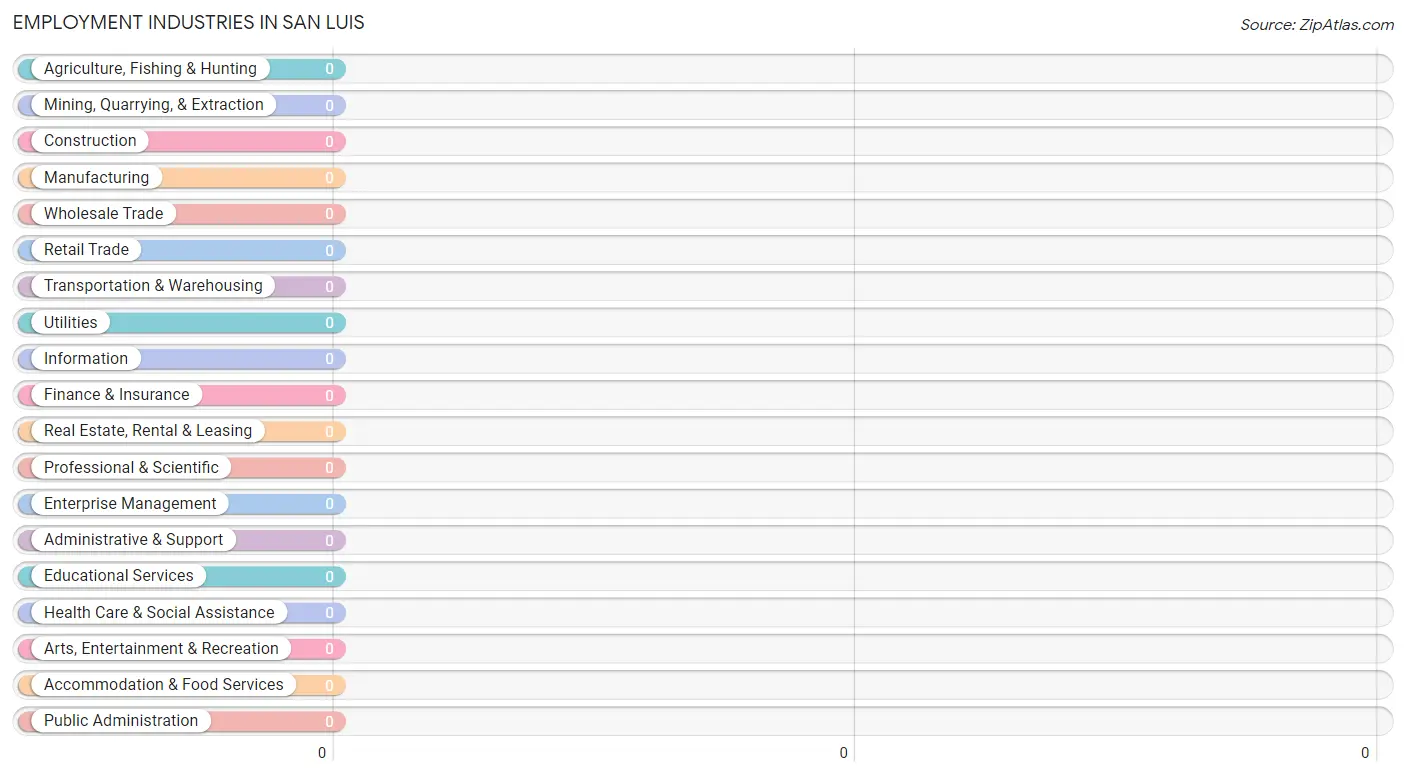
Employment Industries in San Luis
Employment Industries by Sex in San Luis
Industry
Male
Female
Agriculture, Fishing & Hunting
0 (0.0%)
0 (0.0%)
Mining, Quarrying, & Extraction
0 (0.0%)
0 (0.0%)
Construction
0 (0.0%)
0 (0.0%)
Manufacturing
0 (0.0%)
0 (0.0%)
Wholesale Trade
0 (0.0%)
0 (0.0%)
Retail Trade
0 (0.0%)
0 (0.0%)
Transportation & Warehousing
0 (0.0%)
0 (0.0%)
Utilities
0 (0.0%)
0 (0.0%)
Information
0 (0.0%)
0 (0.0%)
Finance & Insurance
0 (0.0%)
0 (0.0%)
Real Estate, Rental & Leasing
0 (0.0%)
0 (0.0%)
Professional & Scientific
0 (0.0%)
0 (0.0%)
Enterprise Management
0 (0.0%)
0 (0.0%)
Administrative & Support
0 (0.0%)
0 (0.0%)
Educational Services
0 (0.0%)
0 (0.0%)
Health Care & Social Assistance
0 (0.0%)
0 (0.0%)
Arts, Entertainment & Recreation
0 (0.0%)
0 (0.0%)
Accommodation & Food Services
0 (0.0%)
0 (0.0%)
Public Administration
0 (0.0%)
0 (0.0%)
Total
0 (0.0%)
0 (0.0%)
Education in San Luis
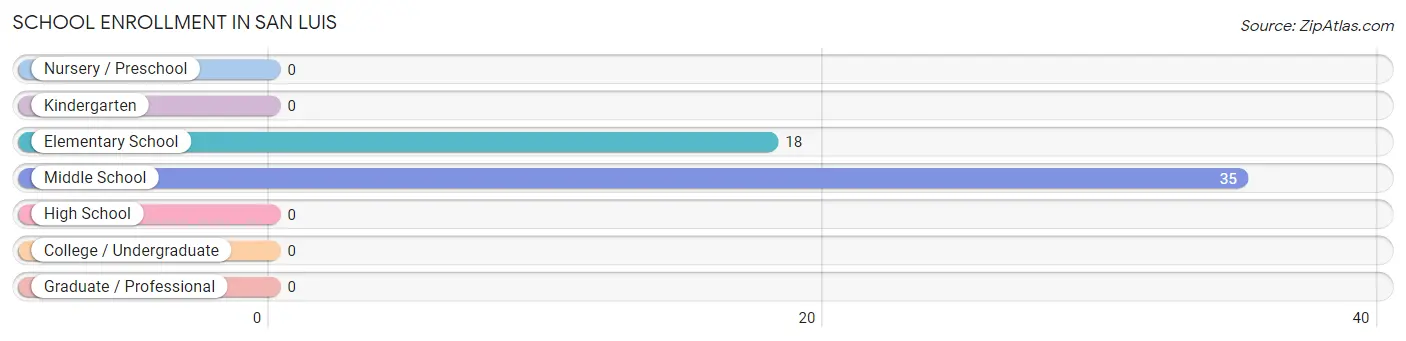
School Enrollment in San Luis
The most common levels of schooling among the 53 students in San Luis are middle school (35 | 66.0%), and elementary school (18 | 34.0%).
School Level
# Students
% Students
Nursery / Preschool
0
0.0%
Kindergarten
0
0.0%
Elementary School
18
34.0%
Middle School
35
66.0%
High School
0
0.0%
College / Undergraduate
0
0.0%
Graduate / Professional
0
0.0%
Total
53
100.0%
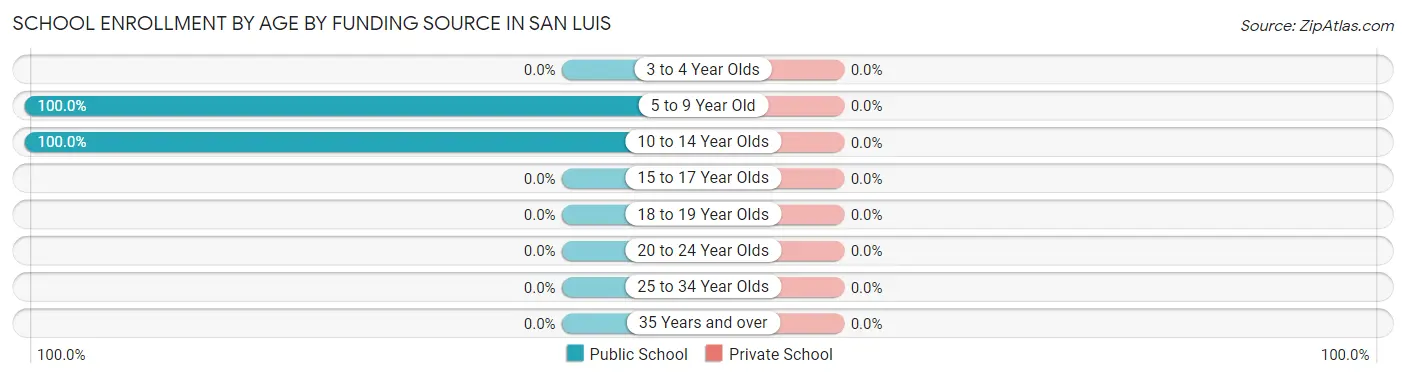
School Enrollment by Age by Funding Source in San Luis
Age Bracket
Public School
Private School
3 to 4 Year Olds
0 (0.0%)
0 (0.0%)
5 to 9 Year Old
18 (100.0%)
0 (0.0%)
10 to 14 Year Olds
35 (100.0%)
0 (0.0%)
15 to 17 Year Olds
0 (0.0%)
0 (0.0%)
18 to 19 Year Olds
0 (0.0%)
0 (0.0%)
20 to 24 Year Olds
0 (0.0%)
0 (0.0%)
25 to 34 Year Olds
0 (0.0%)
0 (0.0%)
35 Years and over
0 (0.0%)
0 (0.0%)
Total
53 (100.0%)
0 (0.0%)
Educational Attainment by Field of Study in San Luis
Field of Study
# Graduates
% Graduates
Computers & Mathematics
0
0.0%
Bio, Nature & Agricultural
0
0.0%
Physical & Health Sciences
0
0.0%
Psychology
0
0.0%
Social Sciences
0
0.0%
Engineering
0
0.0%
Multidisciplinary Studies
0
0.0%
Science & Technology
0
0.0%
Business
0
0.0%
Education
0
0.0%
Literature & Languages
0
0.0%
Liberal Arts & History
0
0.0%
Visual & Performing Arts
0
0.0%
Communications
0
0.0%
Arts & Humanities
0
0.0%
Total
0
0.0%
Transportation & Commute in San Luis
Vehicle Availability by Sex in San Luis
Vehicles Available
Male
Female
No Vehicle
0 (0.0%)
0 (0.0%)
1 Vehicle
0 (0.0%)
0 (0.0%)
2 Vehicles
0 (0.0%)
0 (0.0%)
3 Vehicles
0 (0.0%)
0 (0.0%)
4 Vehicles
0 (0.0%)
0 (0.0%)
5 or more Vehicles
0 (0.0%)
0 (0.0%)
Total
0 (0.0%)
0 (0.0%)
Commute Time in San Luis
Commute Time
# Commuters
% Commuters
Less than 5 Minutes
0
0.0%
5 to 9 Minutes
0
0.0%
10 to 14 Minutes
0
0.0%
15 to 19 Minutes
0
0.0%
20 to 24 Minutes
0
0.0%
25 to 29 Minutes
0
0.0%
30 to 34 Minutes
0
0.0%
35 to 39 Minutes
0
0.0%
40 to 44 Minutes
0
0.0%
45 to 59 Minutes
0
0.0%
60 to 89 Minutes
0
0.0%
90 or more Minutes
0
0.0%
Commute Time by Sex in San Luis
Commute Time
Male
Female
Less than 5 Minutes
0 (0.0%)
0 (0.0%)
5 to 9 Minutes
0 (0.0%)
0 (0.0%)
10 to 14 Minutes
0 (0.0%)
0 (0.0%)
15 to 19 Minutes
0 (0.0%)
0 (0.0%)
20 to 24 Minutes
0 (0.0%)
0 (0.0%)
25 to 29 Minutes
0 (0.0%)
0 (0.0%)
30 to 34 Minutes
0 (0.0%)
0 (0.0%)
35 to 39 Minutes
0 (0.0%)
0 (0.0%)
40 to 44 Minutes
0 (0.0%)
0 (0.0%)
45 to 59 Minutes
0 (0.0%)
0 (0.0%)
60 to 89 Minutes
0 (0.0%)
0 (0.0%)
90 or more Minutes
0 (0.0%)
0 (0.0%)
Time of Departure to Work by Sex in San Luis
Time of Departure
Male
Female
12:00 AM to 4:59 AM
0 (0.0%)
0 (0.0%)
5:00 AM to 5:29 AM
0 (0.0%)
0 (0.0%)
5:30 AM to 5:59 AM
0 (0.0%)
0 (0.0%)
6:00 AM to 6:29 AM
0 (0.0%)
0 (0.0%)
6:30 AM to 6:59 AM
0 (0.0%)
0 (0.0%)
7:00 AM to 7:29 AM
0 (0.0%)
0 (0.0%)
7:30 AM to 7:59 AM
0 (0.0%)
0 (0.0%)
8:00 AM to 8:29 AM
0 (0.0%)
0 (0.0%)
8:30 AM to 8:59 AM
0 (0.0%)
0 (0.0%)
9:00 AM to 9:59 AM
0 (0.0%)
0 (0.0%)
10:00 AM to 10:59 AM
0 (0.0%)
0 (0.0%)
11:00 AM to 11:59 AM
0 (0.0%)
0 (0.0%)
12:00 PM to 3:59 PM
0 (0.0%)
0 (0.0%)
4:00 PM to 11:59 PM
0 (0.0%)
0 (0.0%)
Total
0 (0.0%)
0 (0.0%)
Housing Occupancy in San Luis
Occupancy by Ownership in San Luis
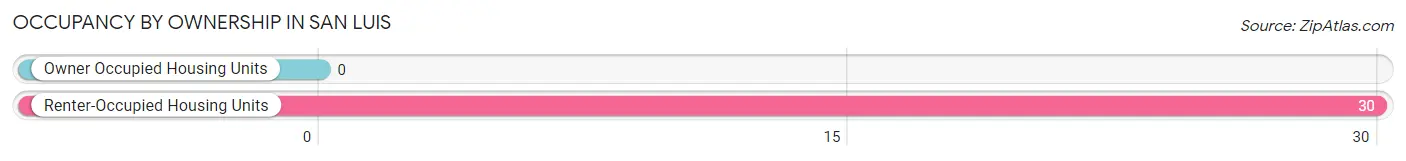
Of the total 30 dwellings in San Luis, owner-occupied units account for 0 (0.0%), while renter-occupied units make up 30 (100.0%).
Occupancy
# Housing Units
% Housing Units
Owner Occupied Housing Units
0
0.0%
Renter-Occupied Housing Units
30
100.0%
Total Occupied Housing Units
30
100.0%
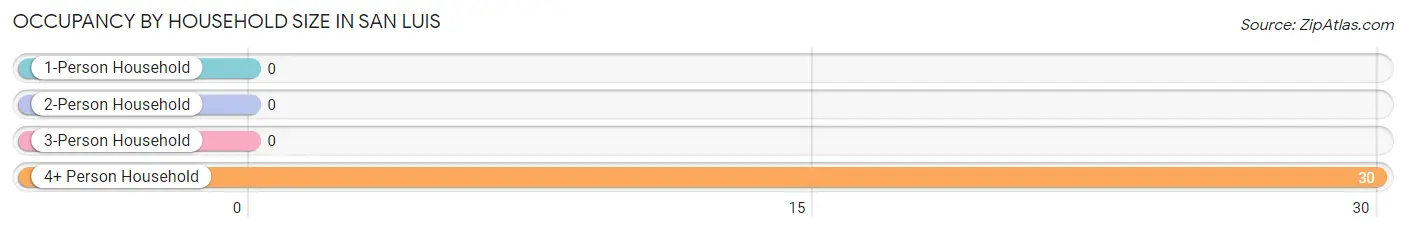
Occupancy by Household Size in San Luis
Household Size
# Housing Units
% Housing Units
1-Person Household
0
0.0%
2-Person Household
0
0.0%
3-Person Household
0
0.0%
4+ Person Household
30
100.0%
Total Housing Units
30
100.0%
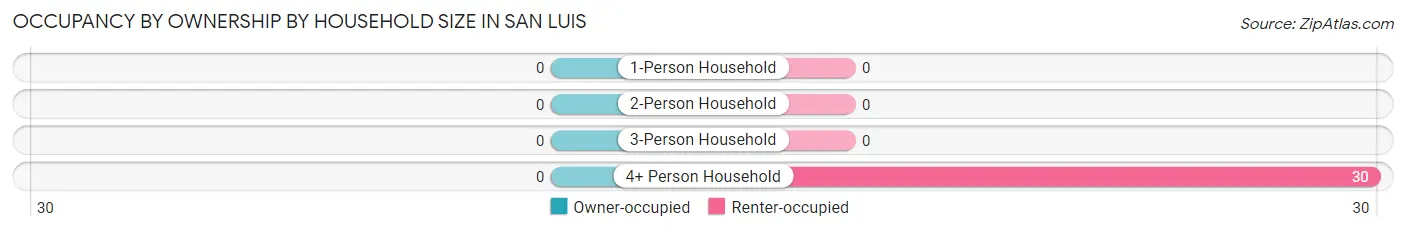
Occupancy by Ownership by Household Size in San Luis
Household Size
Owner-occupied
Renter-occupied
1-Person Household
0 (0.0%)
0 (0.0%)
2-Person Household
0 (0.0%)
0 (0.0%)
3-Person Household
0 (0.0%)
0 (0.0%)
4+ Person Household
0 (0.0%)
30 (100.0%)
Total Housing Units
0 (0.0%)
30 (100.0%)
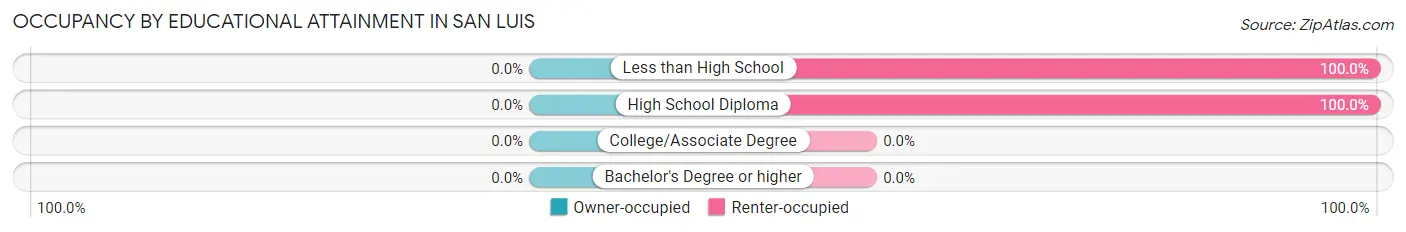
Occupancy by Educational Attainment in San Luis
Household Size
Owner-occupied
Renter-occupied
Less than High School
0 (0.0%)
22 (100.0%)
High School Diploma
0 (0.0%)
8 (100.0%)
College/Associate Degree
0 (0.0%)
0 (0.0%)
Bachelor's Degree or higher
0 (0.0%)
0 (0.0%)
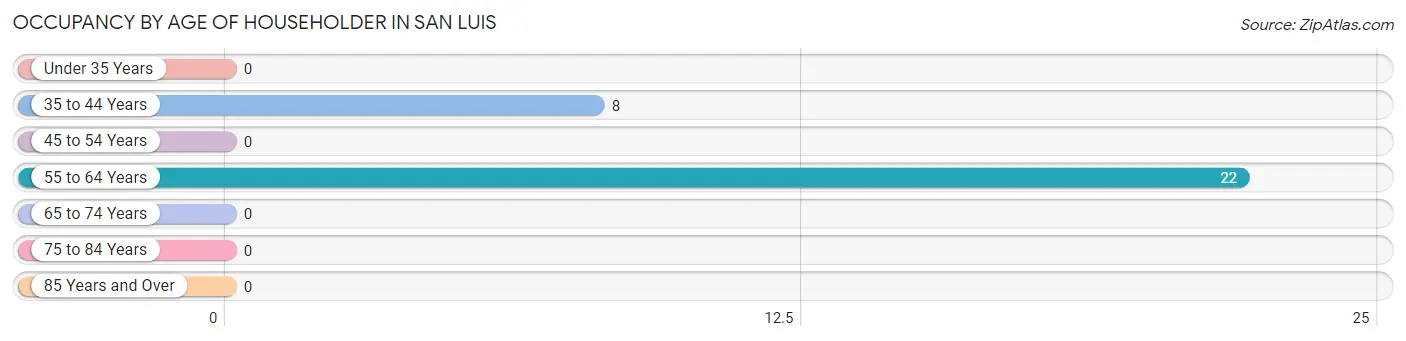
Occupancy by Age of Householder in San Luis
Age Bracket
# Households
% Households
Under 35 Years
0
0.0%
35 to 44 Years
8
26.7%
45 to 54 Years
0
0.0%
55 to 64 Years
22
73.3%
65 to 74 Years
0
0.0%
75 to 84 Years
0
0.0%
85 Years and Over
0
0.0%
Total
30
100.0%
Housing Finances in San Luis
Median Income by Occupancy in San Luis
Occupancy Type
# Households
Median Income
Owner-Occupied
0 (0.0%)
$0
Renter-Occupied
30 (100.0%)
$0
Average
30 (100.0%)
$0
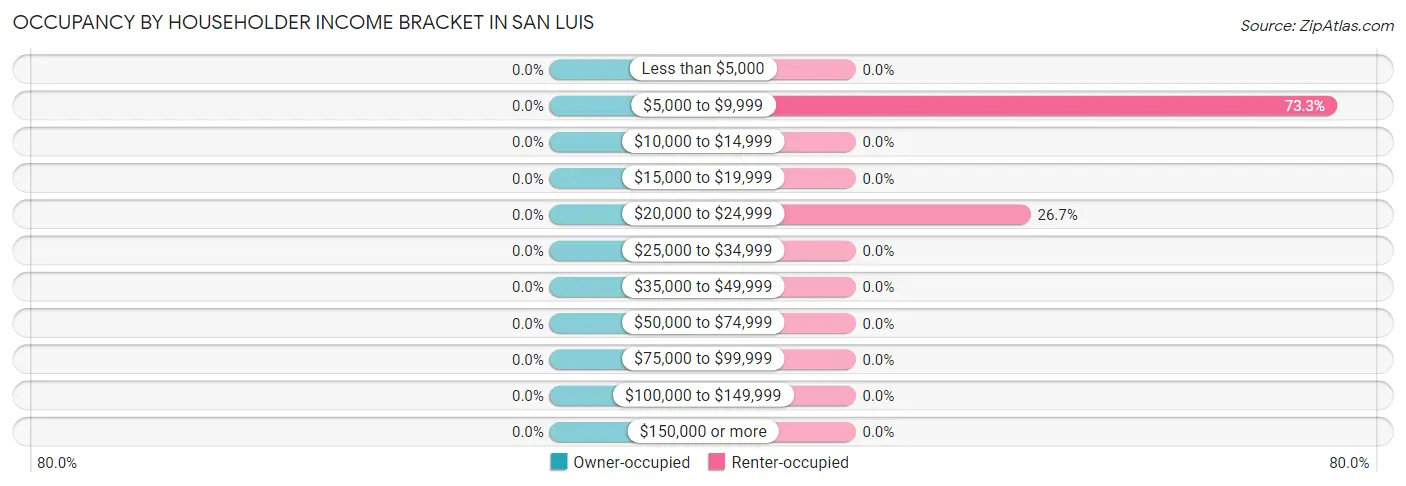
Occupancy by Householder Income Bracket in San Luis
Income Bracket
Owner-occupied
Renter-occupied
Less than $5,000
0 (0.0%)
0 (0.0%)
$5,000 to $9,999
0 (0.0%)
22 (73.3%)
$10,000 to $14,999
0 (0.0%)
0 (0.0%)
$15,000 to $19,999
0 (0.0%)
0 (0.0%)
$20,000 to $24,999
0 (0.0%)
8 (26.7%)
$25,000 to $34,999
0 (0.0%)
0 (0.0%)
$35,000 to $49,999
0 (0.0%)
0 (0.0%)
$50,000 to $74,999
0 (0.0%)
0 (0.0%)
$75,000 to $99,999
0 (0.0%)
0 (0.0%)
$100,000 to $149,999
0 (0.0%)
0 (0.0%)
$150,000 or more
0 (0.0%)
0 (0.0%)
Total
0 (0.0%)
30 (100.0%)
Monthly Housing Cost Tiers in San Luis
Monthly Cost
Owner-occupied
Renter-occupied
Less than $300
0 (0.0%)
0 (0.0%)
$300 to $499
0 (0.0%)
0 (0.0%)
$500 to $799
0 (0.0%)
0 (0.0%)
$800 to $999
0 (0.0%)
0 (0.0%)
$1,000 to $1,499
0 (0.0%)
0 (0.0%)
$1,500 to $1,999
0 (0.0%)
0 (0.0%)
$2,000 to $2,499
0 (0.0%)
0 (0.0%)
$2,500 to $2,999
0 (0.0%)
0 (0.0%)
$3,000 or more
0 (0.0%)
0 (0.0%)
Total
0 (0.0%)
30 (100.0%)
Physical Housing Characteristics in San Luis
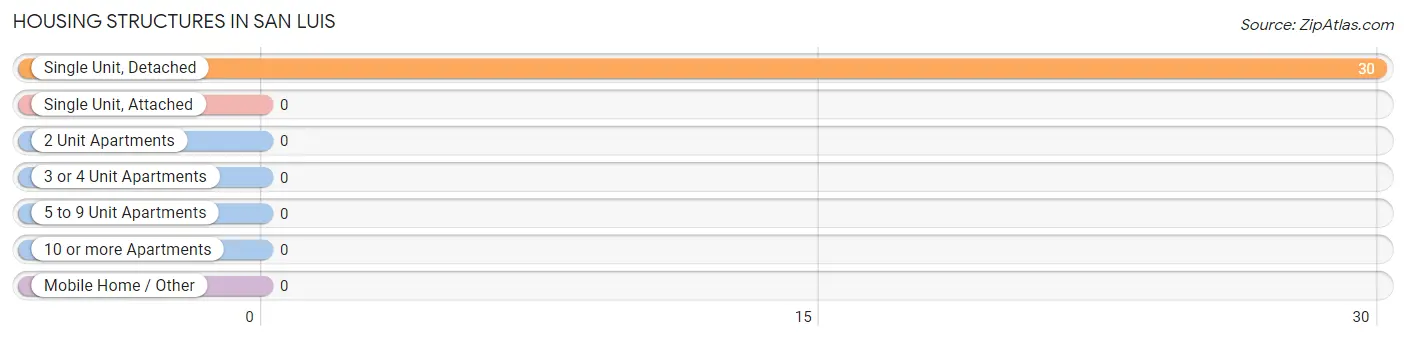
Housing Structures in San Luis
Structure Type
# Housing Units
% Housing Units
Single Unit, Detached
30
100.0%
Single Unit, Attached
0
0.0%
2 Unit Apartments
0
0.0%
3 or 4 Unit Apartments
0
0.0%
5 to 9 Unit Apartments
0
0.0%
10 or more Apartments
0
0.0%
Mobile Home / Other
0
0.0%
Total
30
100.0%
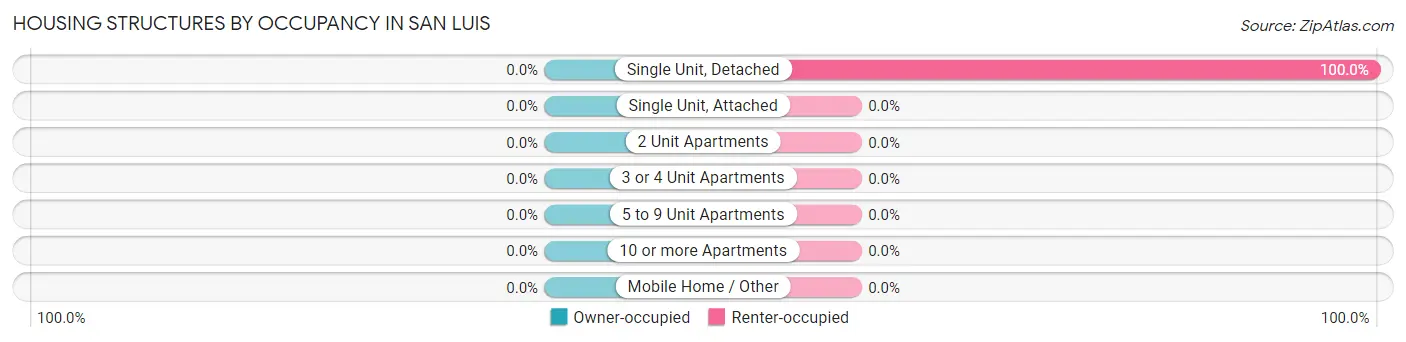
Housing Structures by Occupancy in San Luis
Structure Type
Owner-occupied
Renter-occupied
Single Unit, Detached
0 (0.0%)
30 (100.0%)
Single Unit, Attached
0 (0.0%)
0 (0.0%)
2 Unit Apartments
0 (0.0%)
0 (0.0%)
3 or 4 Unit Apartments
0 (0.0%)
0 (0.0%)
5 to 9 Unit Apartments
0 (0.0%)
0 (0.0%)
10 or more Apartments
0 (0.0%)
0 (0.0%)
Mobile Home / Other
0 (0.0%)
0 (0.0%)
Total
0 (0.0%)
30 (100.0%)
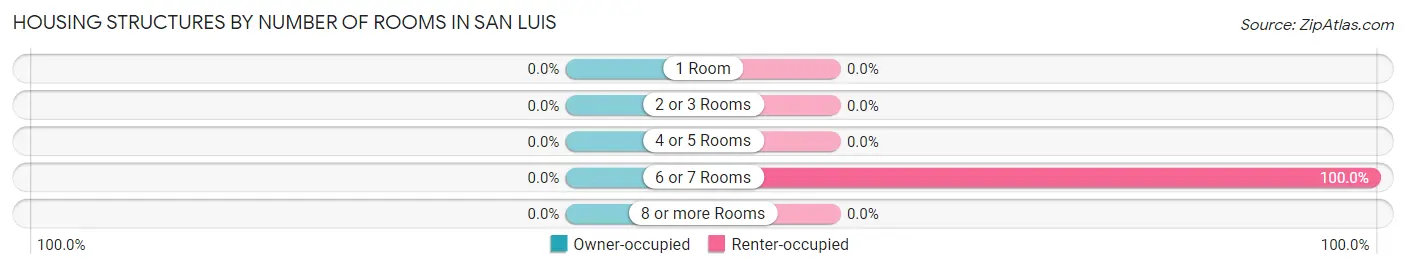
Housing Structures by Number of Rooms in San Luis
Number of Rooms
Owner-occupied
Renter-occupied
1 Room
0 (0.0%)
0 (0.0%)
2 or 3 Rooms
0 (0.0%)
0 (0.0%)
4 or 5 Rooms
0 (0.0%)
0 (0.0%)
6 or 7 Rooms
0 (0.0%)
30 (100.0%)
8 or more Rooms
0 (0.0%)
0 (0.0%)
Total
0 (0.0%)
30 (100.0%)
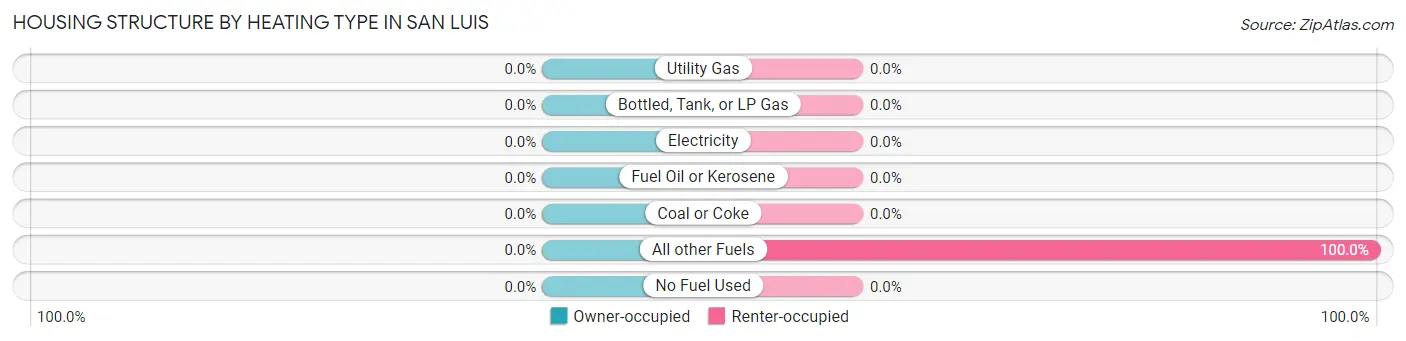
Housing Structure by Heating Type in San Luis
Heating Type
Owner-occupied
Renter-occupied
Utility Gas
0 (0.0%)
0 (0.0%)
Bottled, Tank, or LP Gas
0 (0.0%)
0 (0.0%)
Electricity
0 (0.0%)
0 (0.0%)
Fuel Oil or Kerosene
0 (0.0%)
0 (0.0%)
Coal or Coke
0 (0.0%)
0 (0.0%)
All other Fuels
0 (0.0%)
30 (100.0%)
No Fuel Used
0 (0.0%)
0 (0.0%)
Total
0 (0.0%)
30 (100.0%)
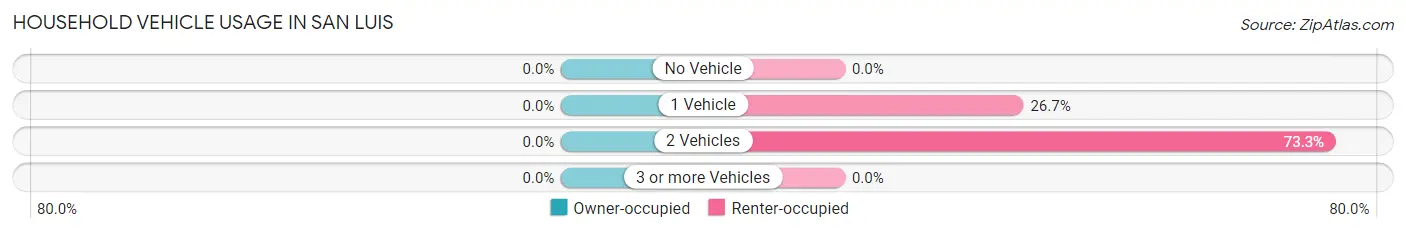
Household Vehicle Usage in San Luis
Vehicles per Household
Owner-occupied
Renter-occupied
No Vehicle
0 (0.0%)
0 (0.0%)
1 Vehicle
0 (0.0%)
8 (26.7%)
2 Vehicles
0 (0.0%)
22 (73.3%)
3 or more Vehicles
0 (0.0%)
0 (0.0%)
Total
0 (0.0%)
30 (100.0%)
Real Estate & Mortgages in San Luis
Real Estate and Mortgage Overview in San Luis
Characteristic
Without Mortgage
With Mortgage
Housing Units
0
0
Median Property Value
-
-
Median Household Income
-
-
Monthly Housing Costs
-
-
Real Estate Taxes
-
-
Property Value by Mortgage Status in San Luis
Property Value
Without Mortgage
With Mortgage
Less than $50,000
0 (0.0%)
0 (0.0%)
$50,000 to $99,999
0 (0.0%)
0 (0.0%)
$100,000 to $299,999
0 (0.0%)
0 (0.0%)
$300,000 to $499,999
0 (0.0%)
0 (0.0%)
$500,000 to $749,999
0 (0.0%)
0 (0.0%)
$750,000 to $999,999
0 (0.0%)
0 (0.0%)
$1,000,000 or more
0 (0.0%)
0 (0.0%)
Total
0 (0.0%)
0 (0.0%)
Household Income by Mortgage Status in San Luis
Household Income
Without Mortgage
With Mortgage
Less than $10,000
0 (0.0%)
0 (0.0%)
$10,000 to $24,999
0 (0.0%)
0 (0.0%)
$25,000 to $34,999
0 (0.0%)
0 (0.0%)
$35,000 to $49,999
0 (0.0%)
0 (0.0%)
$50,000 to $74,999
0 (0.0%)
0 (0.0%)
$75,000 to $99,999
0 (0.0%)
0 (0.0%)
$100,000 to $149,999
0 (0.0%)
0 (0.0%)
$150,000 or more
0 (0.0%)
0 (0.0%)
Total
0 (0.0%)
0 (0.0%)
Property Value to Household Income Ratio in San Luis
Value-to-Income Ratio
Without Mortgage
With Mortgage
Less than 2.0x
0 (0.0%)
0 (0.0%)
2.0x to 2.9x
0 (0.0%)
0 (0.0%)
3.0x to 3.9x
0 (0.0%)
0 (0.0%)
4.0x or more
0 (0.0%)
0 (0.0%)
Total
0 (0.0%)
0 (0.0%)
Real Estate Taxes by Mortgage Status in San Luis
Property Taxes
Without Mortgage
With Mortgage
Less than $800
0 (0.0%)
0 (0.0%)
$800 to $1,499
0 (0.0%)
0 (0.0%)
$800 to $1,499
0 (0.0%)
0 (0.0%)
Total
0 (0.0%)
0 (0.0%)
Health & Disability in San Luis
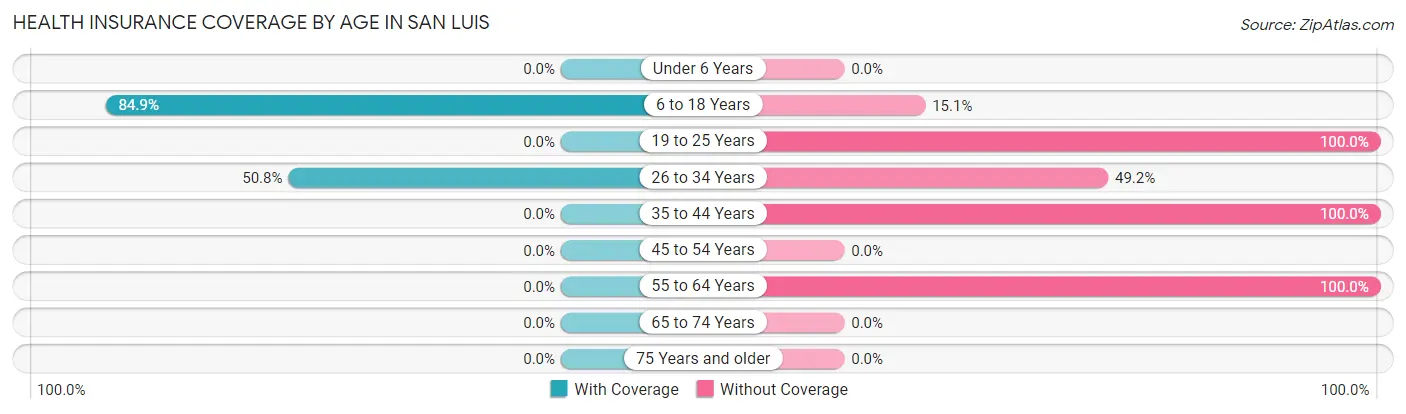
Health Insurance Coverage by Age in San Luis
Age Bracket
With Coverage
Without Coverage
Under 6 Years
0 (0.0%)
0 (0.0%)
6 to 18 Years
45 (84.9%)
8 (15.1%)
19 to 25 Years
0 (0.0%)
14 (100.0%)
26 to 34 Years
31 (50.8%)
30 (49.2%)
35 to 44 Years
0 (0.0%)
15 (100.0%)
45 to 54 Years
0 (0.0%)
0 (0.0%)
55 to 64 Years
0 (0.0%)
22 (100.0%)
65 to 74 Years
0 (0.0%)
0 (0.0%)
75 Years and older
0 (0.0%)
0 (0.0%)
Total
76 (46.1%)
89 (53.9%)
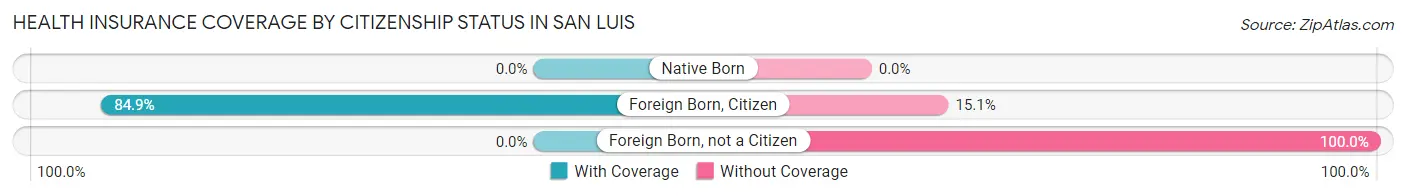
Health Insurance Coverage by Citizenship Status in San Luis
Citizenship Status
With Coverage
Without Coverage
Native Born
0 (0.0%)
0 (0.0%)
Foreign Born, Citizen
45 (84.9%)
8 (15.1%)
Foreign Born, not a Citizen
0 (0.0%)
14 (100.0%)
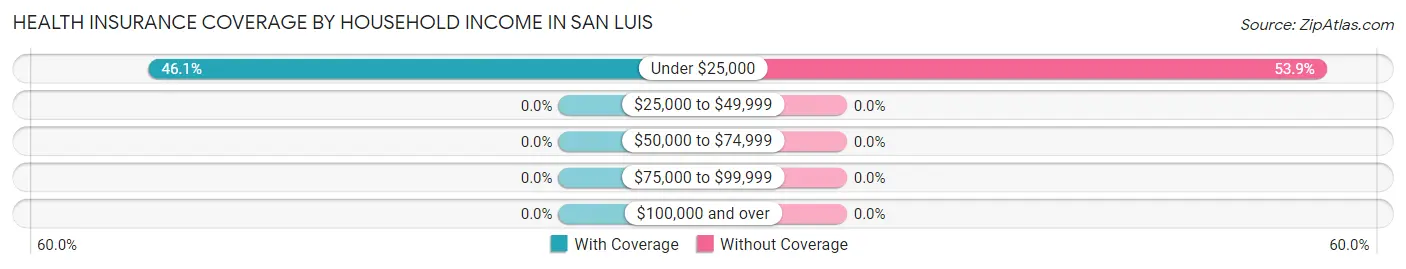
Health Insurance Coverage by Household Income in San Luis
Household Income
With Coverage
Without Coverage
Under $25,000
76 (46.1%)
89 (53.9%)
$25,000 to $49,999
0 (0.0%)
0 (0.0%)
$50,000 to $74,999
0 (0.0%)
0 (0.0%)
$75,000 to $99,999
0 (0.0%)
0 (0.0%)
$100,000 and over
0 (0.0%)
0 (0.0%)
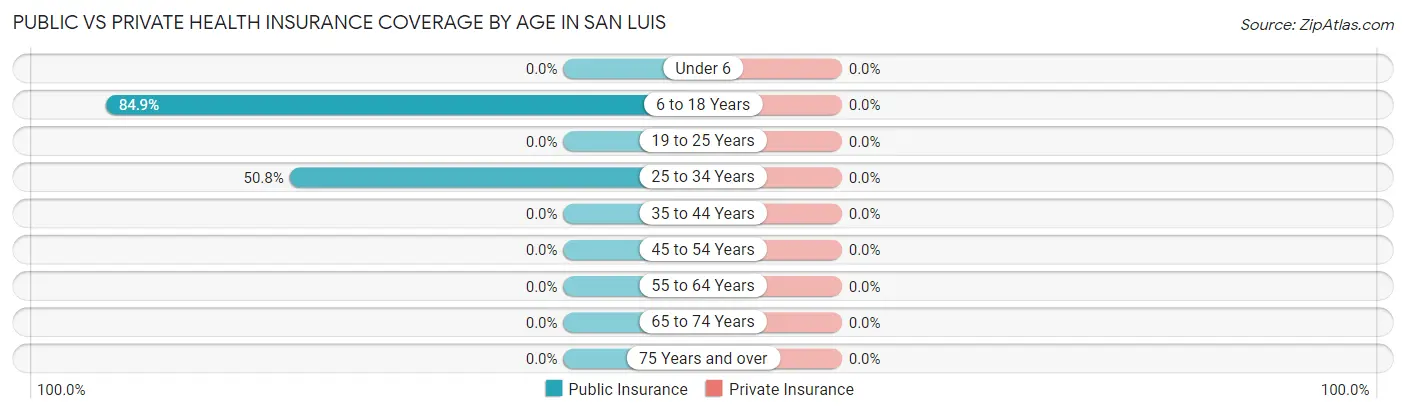
Public vs Private Health Insurance Coverage by Age in San Luis
Age Bracket
Public Insurance
Private Insurance
Under 6
0 (0.0%)
0 (0.0%)
6 to 18 Years
45 (84.9%)
0 (0.0%)
19 to 25 Years
0 (0.0%)
0 (0.0%)
25 to 34 Years
31 (50.8%)
0 (0.0%)
35 to 44 Years
0 (0.0%)
0 (0.0%)
45 to 54 Years
0 (0.0%)
0 (0.0%)
55 to 64 Years
0 (0.0%)
0 (0.0%)
65 to 74 Years
0 (0.0%)
0 (0.0%)
75 Years and over
0 (0.0%)
0 (0.0%)
Total
76 (46.1%)
0 (0.0%)
Disability Status by Sex by Age in San Luis
Age Bracket
Male
Female
Under 5 Years
0 (0.0%)
0 (0.0%)
5 to 17 Years
0 (0.0%)
0 (0.0%)
18 to 34 Years
0 (0.0%)
0 (0.0%)
35 to 64 Years
0 (0.0%)
0 (0.0%)
65 to 74 Years
0 (0.0%)
0 (0.0%)
75 Years and over
0 (0.0%)
0 (0.0%)
Disability Class by Sex by Age in San Luis
Disability Class: Hearing Difficulty
Age Bracket
Male
Female
Under 5 Years
0 (0.0%)
0 (0.0%)
5 to 17 Years
0 (0.0%)
0 (0.0%)
18 to 34 Years
0 (0.0%)
0 (0.0%)
35 to 64 Years
0 (0.0%)
0 (0.0%)
65 to 74 Years
0 (0.0%)
0 (0.0%)
75 Years and over
0 (0.0%)
0 (0.0%)
Disability Class: Vision Difficulty
Age Bracket
Male
Female
Under 5 Years
0 (0.0%)
0 (0.0%)
5 to 17 Years
0 (0.0%)
0 (0.0%)
18 to 34 Years
0 (0.0%)
0 (0.0%)
35 to 64 Years
0 (0.0%)
0 (0.0%)
65 to 74 Years
0 (0.0%)
0 (0.0%)
75 Years and over
0 (0.0%)
0 (0.0%)
Disability Class: Cognitive Difficulty
Age Bracket
Male
Female
5 to 17 Years
0 (0.0%)
0 (0.0%)
18 to 34 Years
0 (0.0%)
0 (0.0%)
35 to 64 Years
0 (0.0%)
0 (0.0%)
65 to 74 Years
0 (0.0%)
0 (0.0%)
75 Years and over
0 (0.0%)
0 (0.0%)
Disability Class: Ambulatory Difficulty
Age Bracket
Male
Female
5 to 17 Years
0 (0.0%)
0 (0.0%)
18 to 34 Years
0 (0.0%)
0 (0.0%)
35 to 64 Years
0 (0.0%)
0 (0.0%)
65 to 74 Years
0 (0.0%)
0 (0.0%)
75 Years and over
0 (0.0%)
0 (0.0%)
Disability Class: Self-Care Difficulty
Age Bracket
Male
Female
5 to 17 Years
0 (0.0%)
0 (0.0%)
18 to 34 Years
0 (0.0%)
0 (0.0%)
35 to 64 Years
0 (0.0%)
0 (0.0%)
65 to 74 Years
0 (0.0%)
0 (0.0%)
75 Years and over
0 (0.0%)
0 (0.0%)
Technology Access in San Luis
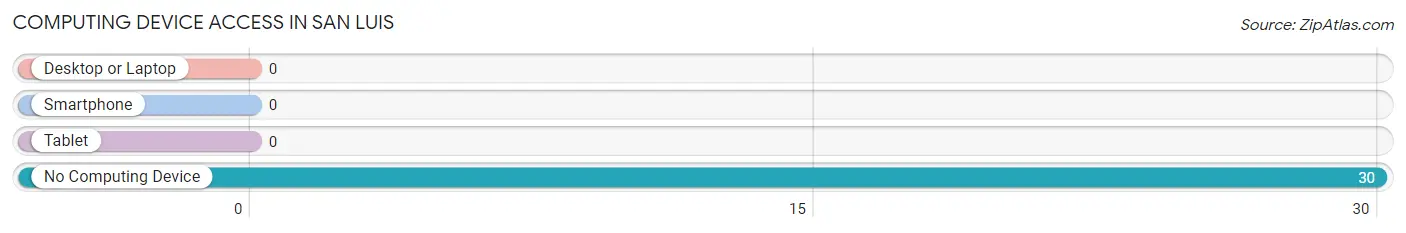
Computing Device Access in San Luis
Device Type
# Households
% Households
Desktop or Laptop
0
0.0%
Smartphone
0
0.0%
Tablet
0
0.0%
No Computing Device
30
100.0%
Total
30
100.0%
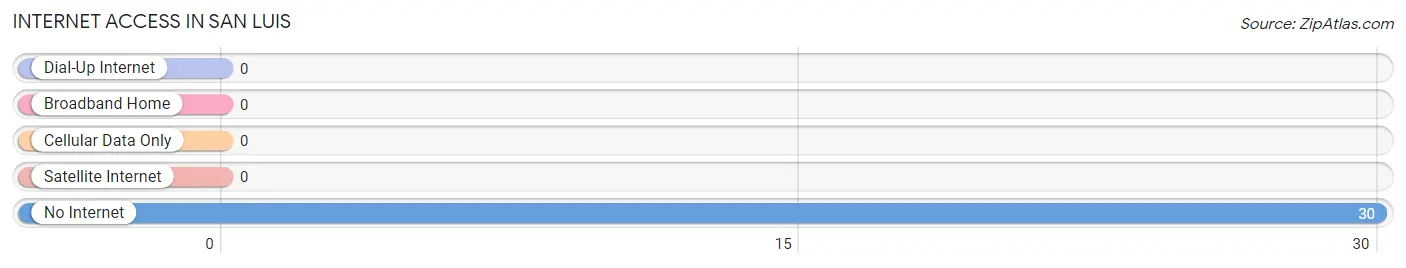
Internet Access in San Luis
Internet Type
# Households
% Households
Dial-Up Internet
0
0.0%
Broadband Home
0
0.0%
Cellular Data Only
0
0.0%
Satellite Internet
0
0.0%
No Internet
30
100.0%
Total
30
100.0%
San Luis Summary
San Luis is a small town located in the northern part of New Mexico, in the United States. It is situated in the San Luis Valley, which is a large, flat valley surrounded by the Sangre de Cristo Mountains. The town is located about 30 miles south of the Colorado border and is the county seat of Costilla County. As of the 2010 census, the population of San Luis was 1,566.
History
San Luis was founded in 1851 by Spanish settlers who were part of the Tierra Amarilla Land Grant. The town was originally called San Luis de la Culebra, but was later shortened to San Luis. The town was officially incorporated in 1876.
San Luis has a long history of ranching and farming. The town was an important stop on the Santa Fe Trail, and the area was home to many Native American tribes, including the Apache, Ute, and Comanche.
Geography
San Luis is located in the San Luis Valley, which is a large, flat valley surrounded by the Sangre de Cristo Mountains. The valley is about 8,000 feet above sea level and is the largest alpine valley in the United States. The valley is home to many lakes, including the San Luis Lakes, which are a popular destination for fishing and camping.
The town of San Luis is located about 30 miles south of the Colorado border and is the county seat of Costilla County. The town is situated at the intersection of U.S. Route 285 and State Highway 159.
Economy
The economy of San Luis is largely based on agriculture and ranching. The town is home to several large farms and ranches, and the area is known for its production of potatoes, alfalfa, and hay.
The town is also home to several small businesses, including restaurants, shops, and hotels. Tourism is also an important part of the local economy, as the area is a popular destination for outdoor activities such as fishing, camping, and hiking.
Demographics
As of the 2010 census, the population of San Luis was 1,566. The racial makeup of the town was 75.3% White, 0.7% African American, 1.2% Native American, 0.2% Asian, 0.1% Pacific Islander, 19.7% from other races, and 2.9% from two or more races. Hispanic or Latino of any race were 57.2% of the population.
The median household income in San Luis was $25,938, and the median family income was $30,938. The per capita income for the town was $13,845. About 22.2% of the population was below the poverty line.
Common Questions
What is Per Capita Income in San Luis?
Per Capita income in San Luis is $2,322.
What is Inequality or Gini Index in San Luis?
Inequality or Gini Index in San Luis is 0.26.
What is the Total Population of San Luis?
Total Population of San Luis is 165.
What is the Total Male Population of San Luis?
Total Male Population of San Luis is 86.
What is the Total Female Population of San Luis?
Total Female Population of San Luis is 79.
What is the Ratio of Males per 100 Females in San Luis?
There are 108.86 Males per 100 Females in San Luis.
What is the Ratio of Females per 100 Males in San Luis?
There are 91.86 Females per 100 Males in San Luis.
What is the Median Population Age in San Luis?
Median Population Age in San Luis is 30.5 Years.
What is the Average Family Size in San Luis
Average Family Size in San Luis is 3.3 People.
What is the Average Household Size in San Luis
Average Household Size in San Luis is 5.5 People.
Report Title
Report Link
HTML Copy & Paste Link
Social Media
Copy and paste the folowing code into any webpage where you would like this interactive chart to display