La Jara, NM Map & Demographics
La Jara Map
La Jara Overview
$16,521
PER CAPITA INCOME
0.50
INEQUALITY / GINI INDEX
361
TOTAL POPULATION
227
MALE POPULATION
134
FEMALE POPULATION
169.40
MALES / 100 FEMALES
59.03
FEMALES / 100 MALES
32.6
MEDIAN AGE
2.7
AVG FAMILY SIZE
2.1
AVG HOUSEHOLD SIZE
74
LABOR FORCE [ PEOPLE ]
26.2%
PERCENT IN LABOR FORCE
12.2%
UNEMPLOYMENT RATE
La Jara Zip Codes
La Jara Area Codes
Income in La Jara
Income Overview in La Jara
| Characteristic | Number | Measure |
| Per Capita Income | 361 | $16,521 |
| Median Family Income | 104 | $0 |
| Mean Family Income | 104 | $46,734 |
| Median Household Income | 168 | $0 |
| Mean Household Income | 168 | $39,277 |
| Income Deficit | 104 | $0 |
| Wage / Income Gap (%) | 361 | 0.00% |
| Wage / Income Gap ($) | 361 | 100.00¢ per $1 |
| Gini / Inequality Index | 361 | 0.50 |
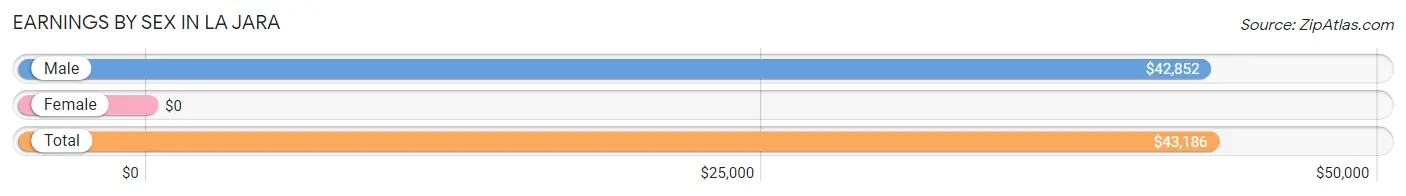
Earnings by Sex in La Jara
| Sex | Number | Average Earnings |
| Male | 55 (74.3%) | $42,852 |
| Female | 19 (25.7%) | $0 |
| Total | 74 (100.0%) | $43,186 |
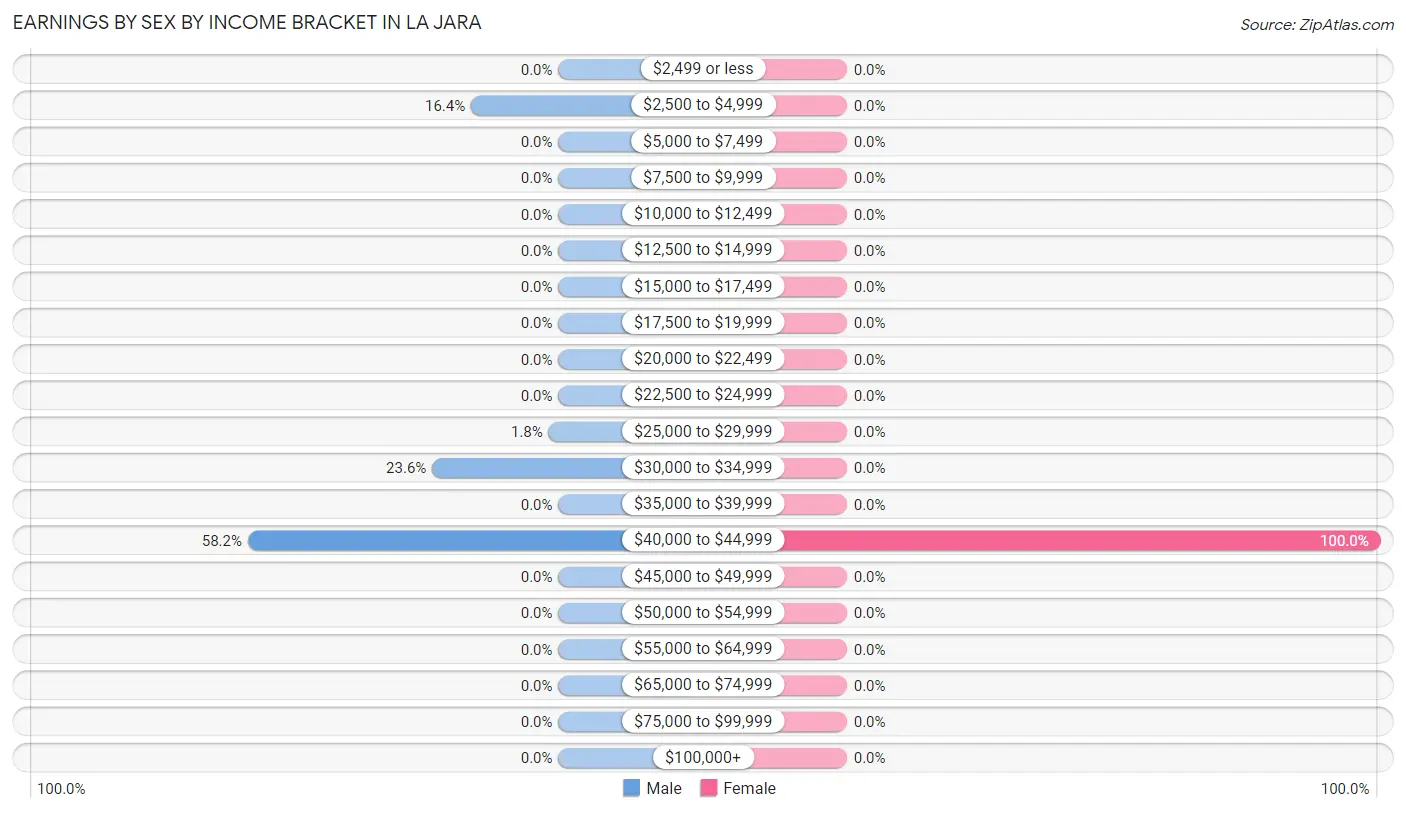
Earnings by Sex by Income Bracket in La Jara
The most common earnings brackets in La Jara are $40,000 to $44,999 for men (32 | 58.2%) and $40,000 to $44,999 for women (19 | 100.0%).
| Income | Male | Female |
| $2,499 or less | 0 (0.0%) | 0 (0.0%) |
| $2,500 to $4,999 | 9 (16.4%) | 0 (0.0%) |
| $5,000 to $7,499 | 0 (0.0%) | 0 (0.0%) |
| $7,500 to $9,999 | 0 (0.0%) | 0 (0.0%) |
| $10,000 to $12,499 | 0 (0.0%) | 0 (0.0%) |
| $12,500 to $14,999 | 0 (0.0%) | 0 (0.0%) |
| $15,000 to $17,499 | 0 (0.0%) | 0 (0.0%) |
| $17,500 to $19,999 | 0 (0.0%) | 0 (0.0%) |
| $20,000 to $22,499 | 0 (0.0%) | 0 (0.0%) |
| $22,500 to $24,999 | 0 (0.0%) | 0 (0.0%) |
| $25,000 to $29,999 | 1 (1.8%) | 0 (0.0%) |
| $30,000 to $34,999 | 13 (23.6%) | 0 (0.0%) |
| $35,000 to $39,999 | 0 (0.0%) | 0 (0.0%) |
| $40,000 to $44,999 | 32 (58.2%) | 19 (100.0%) |
| $45,000 to $49,999 | 0 (0.0%) | 0 (0.0%) |
| $50,000 to $54,999 | 0 (0.0%) | 0 (0.0%) |
| $55,000 to $64,999 | 0 (0.0%) | 0 (0.0%) |
| $65,000 to $74,999 | 0 (0.0%) | 0 (0.0%) |
| $75,000 to $99,999 | 0 (0.0%) | 0 (0.0%) |
| $100,000+ | 0 (0.0%) | 0 (0.0%) |
| Total | 55 (100.0%) | 19 (100.0%) |
Earnings by Sex by Educational Attainment in La Jara
| Educational Attainment | Male Income | Female Income |
| Less than High School | - | - |
| High School Diploma | - | - |
| College or Associate's Degree | - | - |
| Bachelor's Degree | - | - |
| Graduate Degree | - | - |
| Total | $43,359 | $0 |
Family Income in La Jara
Family Income Brackets in La Jara
According to the La Jara family income data, there are 43 families falling into the $75,000 to $99,999 income range, which is the most common income bracket and makes up 41.3% of all families.
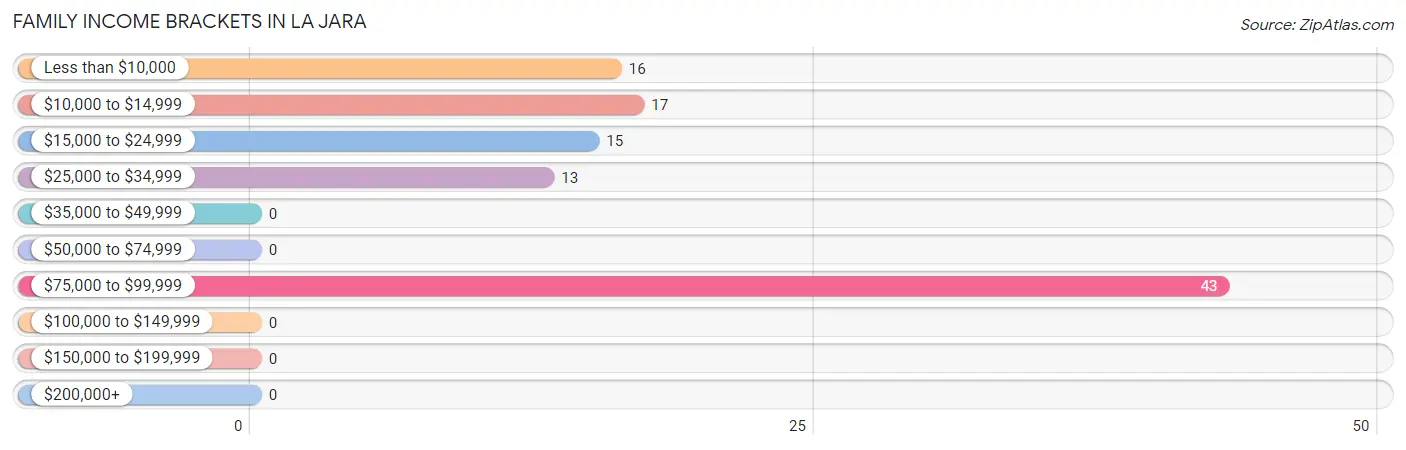
| Income Bracket | # Families | % Families |
| Less than $10,000 | 16 | 15.4% |
| $10,000 to $14,999 | 17 | 16.3% |
| $15,000 to $24,999 | 15 | 14.4% |
| $25,000 to $34,999 | 13 | 12.5% |
| $35,000 to $49,999 | 0 | 0.0% |
| $50,000 to $74,999 | 0 | 0.0% |
| $75,000 to $99,999 | 43 | 41.3% |
| $100,000 to $149,999 | 0 | 0.0% |
| $150,000 to $199,999 | 0 | 0.0% |
| $200,000+ | 0 | 0.0% |
Family Income by Famaliy Size in La Jara
| Income Bracket | # Families | Median Income |
| 2-Person Families | 43 (41.3%) | $0 |
| 3-Person Families | 16 (15.4%) | $0 |
| 4-Person Families | 45 (43.3%) | $0 |
| 5-Person Families | 0 (0.0%) | $0 |
| 6-Person Families | 0 (0.0%) | $0 |
| 7+ Person Families | 0 (0.0%) | $0 |
| Total | 104 (100.0%) | $0 |
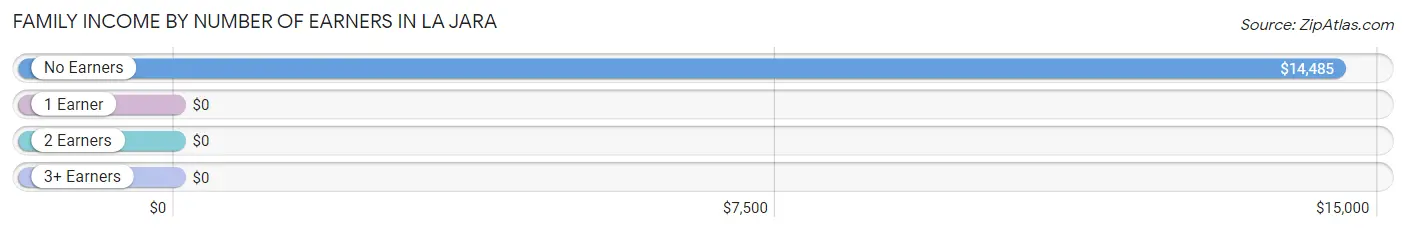
Family Income by Number of Earners in La Jara
| Number of Earners | # Families | Median Income |
| No Earners | 59 (56.7%) | $14,485 |
| 1 Earner | 13 (12.5%) | $0 |
| 2 Earners | 32 (30.8%) | $0 |
| 3+ Earners | 0 (0.0%) | $0 |
| Total | 104 (100.0%) | $0 |
Household Income in La Jara
Household Income Brackets in La Jara
With 58 households falling in the category, the $75,000 to $99,999 income range is the most frequent in La Jara, accounting for 34.5% of all households.
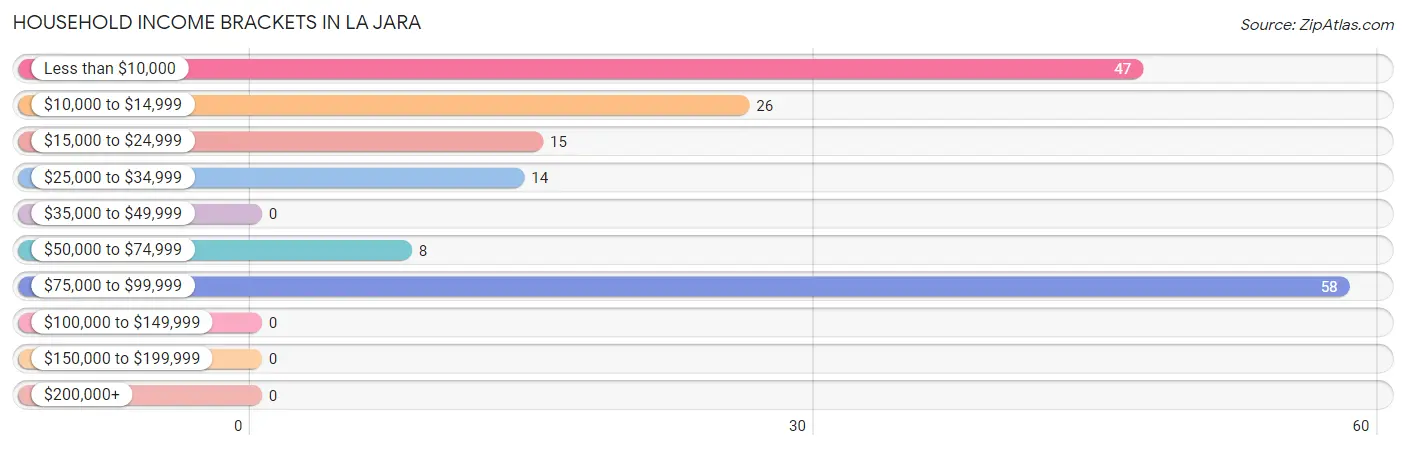
| Income Bracket | # Households | % Households |
| Less than $10,000 | 47 | 28.0% |
| $10,000 to $14,999 | 26 | 15.5% |
| $15,000 to $24,999 | 15 | 8.9% |
| $25,000 to $34,999 | 14 | 8.3% |
| $35,000 to $49,999 | 0 | 0.0% |
| $50,000 to $74,999 | 8 | 4.8% |
| $75,000 to $99,999 | 58 | 34.5% |
| $100,000 to $149,999 | 0 | 0.0% |
| $150,000 to $199,999 | 0 | 0.0% |
| $200,000+ | 0 | 0.0% |
Household Income by Householder Age in La Jara
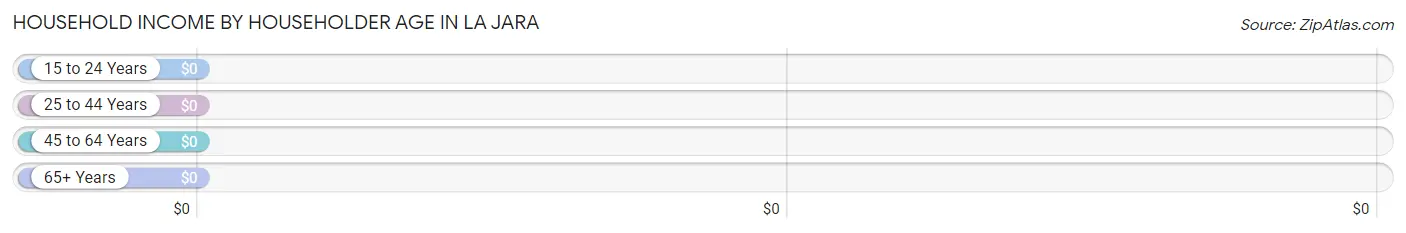
| Income Bracket | # Households | Median Income |
| 15 to 24 Years | 13 (7.7%) | $0 |
| 25 to 44 Years | 79 (47.0%) | $0 |
| 45 to 64 Years | 10 (5.9%) | $0 |
| 65+ Years | 66 (39.3%) | $0 |
| Total | 168 (100.0%) | $0 |
Poverty in La Jara
Income Below Poverty by Sex and Age in La Jara
With 43.6% poverty level for males and 24.6% for females among the residents of La Jara, 6 to 11 year old males and 25 to 34 year old females are the most vulnerable to poverty, with 16 males (100.0%) and 16 females (100.0%) in their respective age groups living below the poverty level.
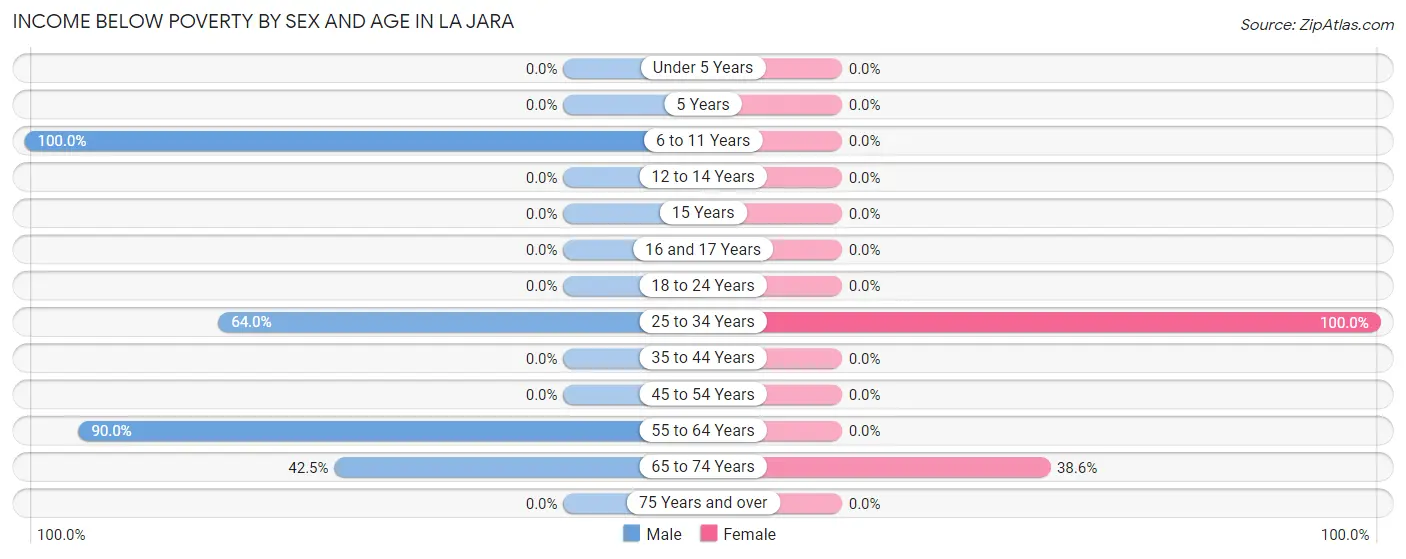
| Age Bracket | Male | Female |
| Under 5 Years | 0 (0.0%) | 0 (0.0%) |
| 5 Years | 0 (0.0%) | 0 (0.0%) |
| 6 to 11 Years | 16 (100.0%) | 0 (0.0%) |
| 12 to 14 Years | 0 (0.0%) | 0 (0.0%) |
| 15 Years | 0 (0.0%) | 0 (0.0%) |
| 16 and 17 Years | 0 (0.0%) | 0 (0.0%) |
| 18 to 24 Years | 0 (0.0%) | 0 (0.0%) |
| 25 to 34 Years | 57 (64.0%) | 16 (100.0%) |
| 35 to 44 Years | 0 (0.0%) | 0 (0.0%) |
| 45 to 54 Years | 0 (0.0%) | 0 (0.0%) |
| 55 to 64 Years | 9 (90.0%) | 0 (0.0%) |
| 65 to 74 Years | 17 (42.5%) | 17 (38.6%) |
| 75 Years and over | 0 (0.0%) | 0 (0.0%) |
| Total | 99 (43.6%) | 33 (24.6%) |
Income Above Poverty by Sex and Age in La Jara
According to the poverty statistics in La Jara, males aged under 5 years and females aged under 5 years are the age groups that are most secure financially, with 100.0% of males and 100.0% of females in these age groups living above the poverty line.
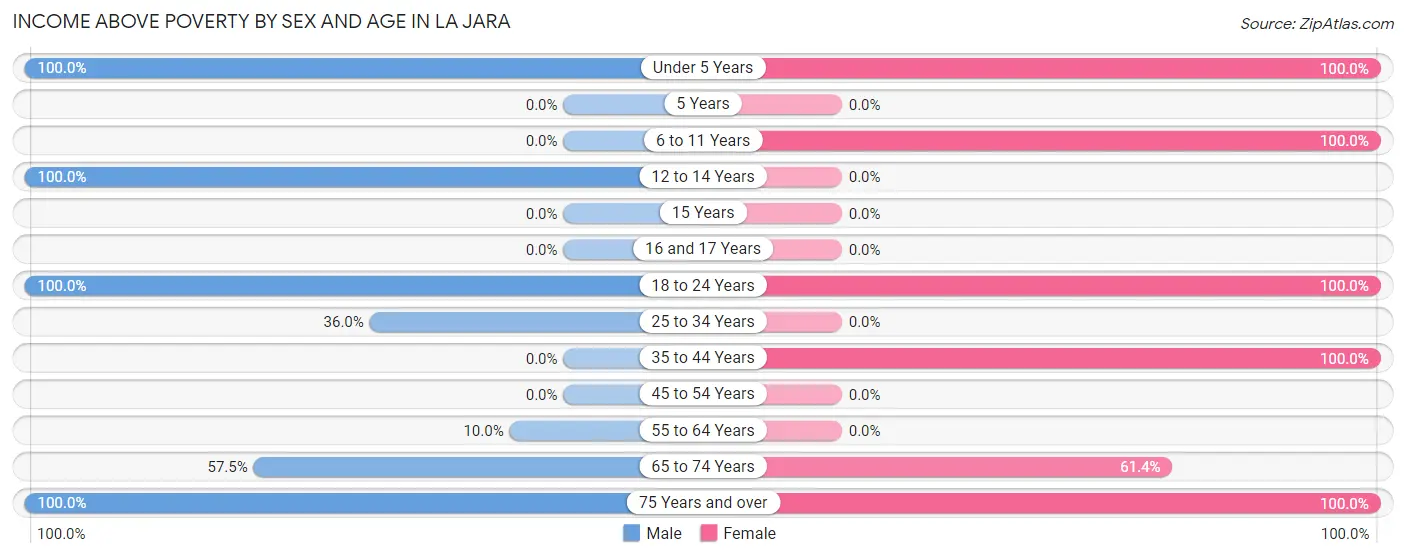
| Age Bracket | Male | Female |
| Under 5 Years | 13 (100.0%) | 12 (100.0%) |
| 5 Years | 0 (0.0%) | 0 (0.0%) |
| 6 to 11 Years | 0 (0.0%) | 18 (100.0%) |
| 12 to 14 Years | 20 (100.0%) | 0 (0.0%) |
| 15 Years | 0 (0.0%) | 0 (0.0%) |
| 16 and 17 Years | 0 (0.0%) | 0 (0.0%) |
| 18 to 24 Years | 13 (100.0%) | 13 (100.0%) |
| 25 to 34 Years | 32 (36.0%) | 0 (0.0%) |
| 35 to 44 Years | 0 (0.0%) | 19 (100.0%) |
| 45 to 54 Years | 0 (0.0%) | 0 (0.0%) |
| 55 to 64 Years | 1 (10.0%) | 0 (0.0%) |
| 65 to 74 Years | 23 (57.5%) | 27 (61.4%) |
| 75 Years and over | 26 (100.0%) | 12 (100.0%) |
| Total | 128 (56.4%) | 101 (75.4%) |
Income Below Poverty Among Married-Couple Families in La Jara
The poverty statistics for married-couple families in La Jara show that 31.7% or 33 of the total 104 families live below the poverty line. Families with no children have the highest poverty rate of 39.5%, comprising of 17 families. On the other hand, families with 1 or 2 children have the lowest poverty rate of 26.2%, which includes 16 families.
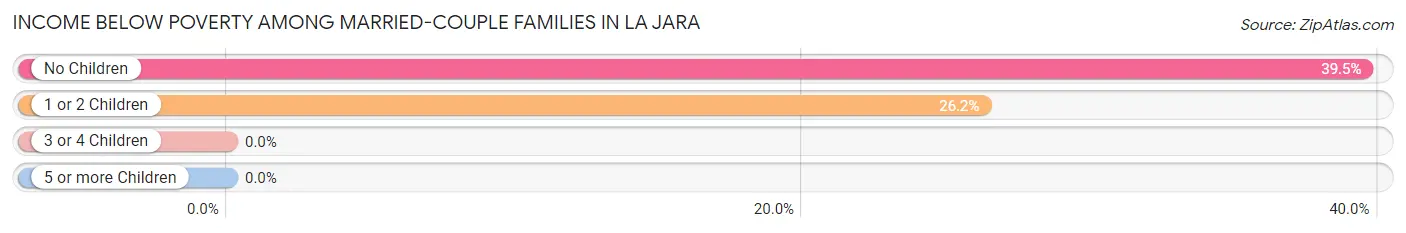
| Children | Above Poverty | Below Poverty |
| No Children | 26 (60.5%) | 17 (39.5%) |
| 1 or 2 Children | 45 (73.8%) | 16 (26.2%) |
| 3 or 4 Children | 0 (0.0%) | 0 (0.0%) |
| 5 or more Children | 0 (0.0%) | 0 (0.0%) |
| Total | 71 (68.3%) | 33 (31.7%) |
Income Below Poverty Among Single-Parent Households in La Jara
| Children | Single Father | Single Mother |
| No Children | 0 (0.0%) | 0 (0.0%) |
| 1 or 2 Children | 0 (0.0%) | 0 (0.0%) |
| 3 or 4 Children | 0 (0.0%) | 0 (0.0%) |
| 5 or more Children | 0 (0.0%) | 0 (0.0%) |
| Total | 0 (0.0%) | 0 (0.0%) |
Income Below Poverty Among Married-Couple vs Single-Parent Households in La Jara
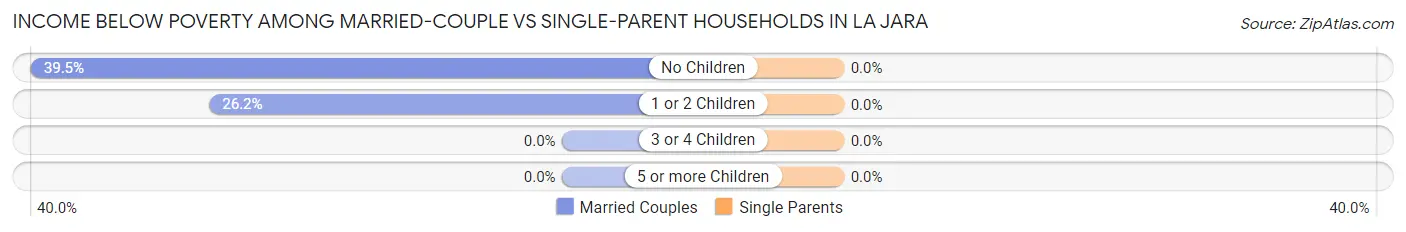
| Children | Married-Couple Families | Single-Parent Households |
| No Children | 17 (39.5%) | 0 (0.0%) |
| 1 or 2 Children | 16 (26.2%) | 0 (0.0%) |
| 3 or 4 Children | 0 (0.0%) | 0 (0.0%) |
| 5 or more Children | 0 (0.0%) | 0 (0.0%) |
| Total | 33 (31.7%) | 0 (0.0%) |
Race in La Jara
The most populous races in La Jara are Hispanic or Latino (258 | 71.5%), White / Caucasian (143 | 39.6%), and Native / Alaskan (116 | 32.1%).
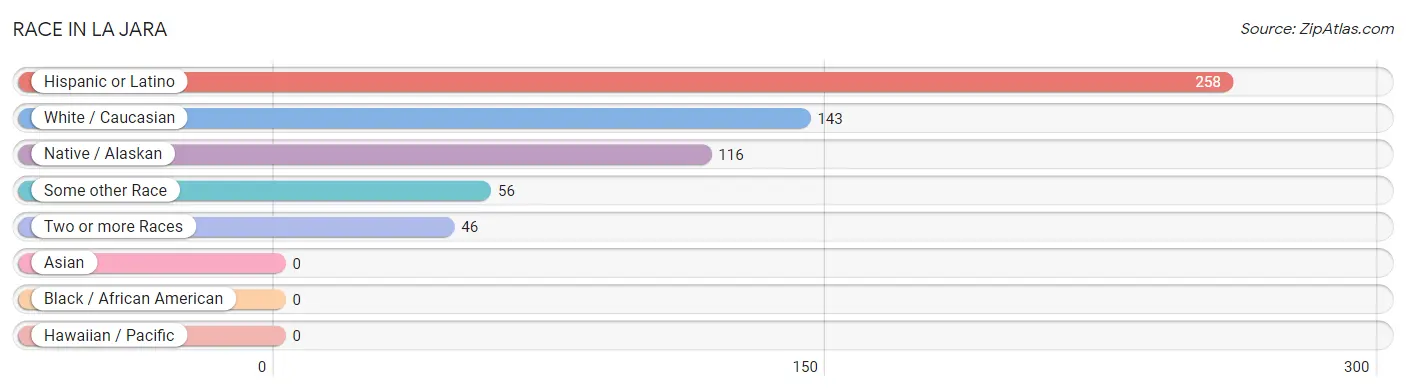
| Race | # Population | % Population |
| Asian | 0 | 0.0% |
| Black / African American | 0 | 0.0% |
| Hawaiian / Pacific | 0 | 0.0% |
| Hispanic or Latino | 258 | 71.5% |
| Native / Alaskan | 116 | 32.1% |
| White / Caucasian | 143 | 39.6% |
| Two or more Races | 46 | 12.7% |
| Some other Race | 56 | 15.5% |
| Total | 361 | 100.0% |
Ancestry in La Jara
The most populous ancestries reported in La Jara are Mexican (156 | 43.2%), Pueblo (85 | 23.5%), Spaniard (64 | 17.7%), Spanish (38 | 10.5%), and Navajo (31 | 8.6%), together accounting for 103.6% of all La Jara residents.
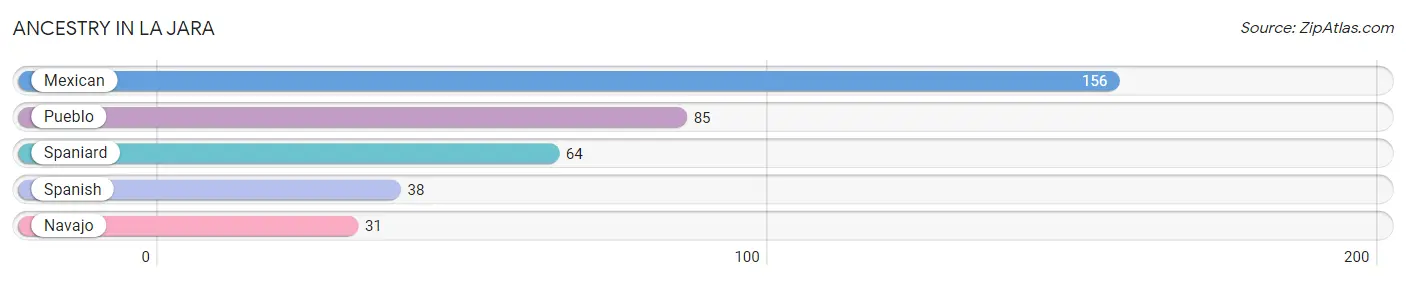
| Ancestry | # Population | % Population |
| Mexican | 156 | 43.2% |
| Navajo | 31 | 8.6% |
| Pueblo | 85 | 23.5% |
| Spaniard | 64 | 17.7% |
| Spanish | 38 | 10.5% | View All 5 Rows |
Immigrants in La Jara
The most numerous immigrant groups reported in La Jara came from Europe (17 | 4.7%), Germany (17 | 4.7%), and Western Europe (17 | 4.7%), together accounting for 14.1% of all La Jara residents.
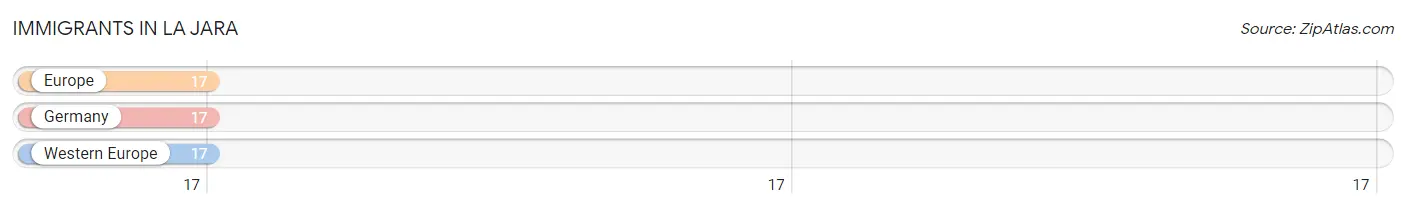
| Immigration Origin | # Population | % Population |
| Europe | 17 | 4.7% |
| Germany | 17 | 4.7% |
| Western Europe | 17 | 4.7% | View All 3 Rows |
Sex and Age in La Jara
Sex and Age in La Jara
The most populous age groups in La Jara are 30 to 34 Years (58 | 25.6%) for men and 65 to 69 Years (26 | 19.4%) for women.
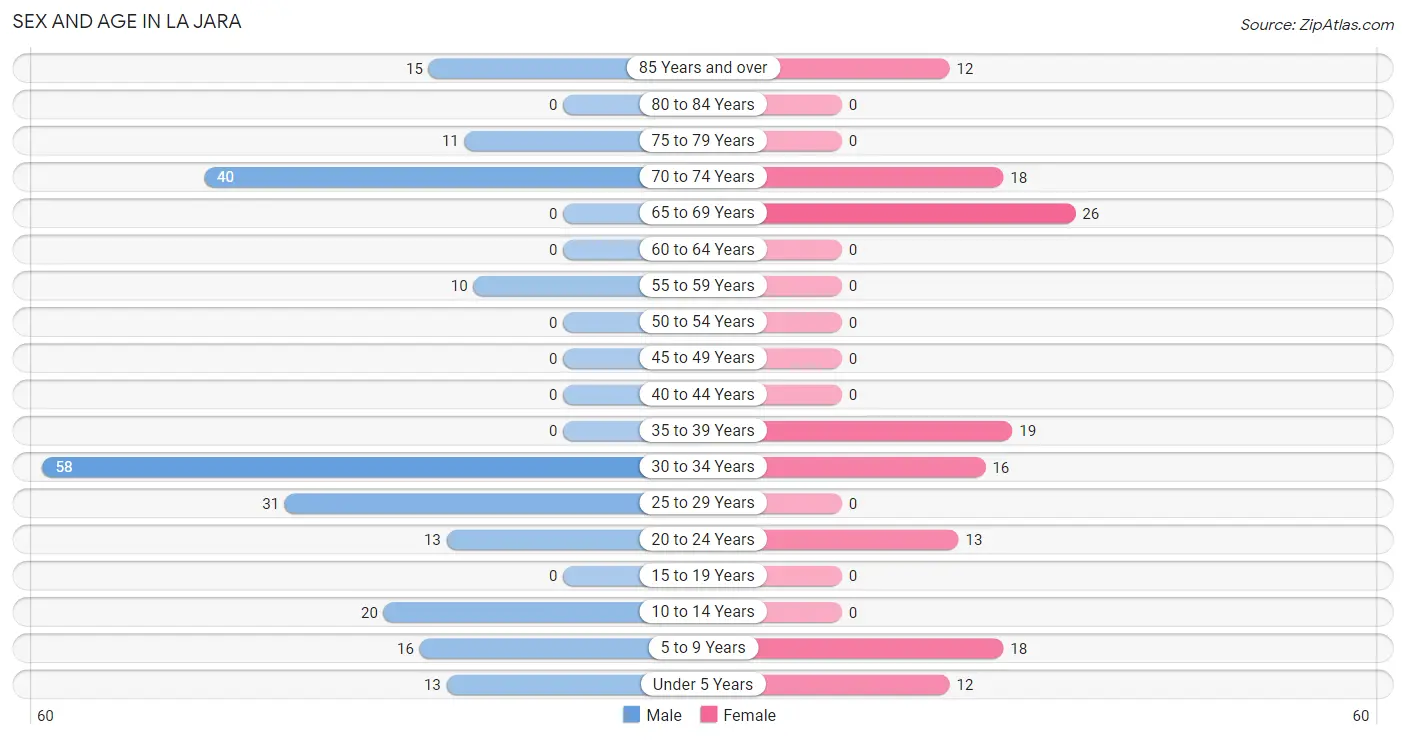
| Age Bracket | Male | Female |
| Under 5 Years | 13 (5.7%) | 12 (9.0%) |
| 5 to 9 Years | 16 (7.0%) | 18 (13.4%) |
| 10 to 14 Years | 20 (8.8%) | 0 (0.0%) |
| 15 to 19 Years | 0 (0.0%) | 0 (0.0%) |
| 20 to 24 Years | 13 (5.7%) | 13 (9.7%) |
| 25 to 29 Years | 31 (13.7%) | 0 (0.0%) |
| 30 to 34 Years | 58 (25.6%) | 16 (11.9%) |
| 35 to 39 Years | 0 (0.0%) | 19 (14.2%) |
| 40 to 44 Years | 0 (0.0%) | 0 (0.0%) |
| 45 to 49 Years | 0 (0.0%) | 0 (0.0%) |
| 50 to 54 Years | 0 (0.0%) | 0 (0.0%) |
| 55 to 59 Years | 10 (4.4%) | 0 (0.0%) |
| 60 to 64 Years | 0 (0.0%) | 0 (0.0%) |
| 65 to 69 Years | 0 (0.0%) | 26 (19.4%) |
| 70 to 74 Years | 40 (17.6%) | 18 (13.4%) |
| 75 to 79 Years | 11 (4.9%) | 0 (0.0%) |
| 80 to 84 Years | 0 (0.0%) | 0 (0.0%) |
| 85 Years and over | 15 (6.6%) | 12 (9.0%) |
| Total | 227 (100.0%) | 134 (100.0%) |
Families and Households in La Jara
Median Family Size in La Jara
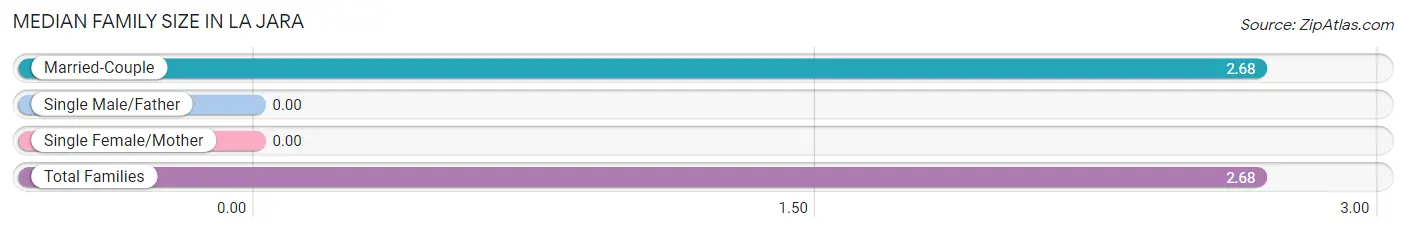
| Family Type | # Families | Family Size |
| Married-Couple | 104 (100.0%) | 2.68 |
| Single Male/Father | 0 (0.0%) | - |
| Single Female/Mother | 0 (0.0%) | - |
| Total Families | 104 (100.0%) | 2.68 |
Median Household Size in La Jara
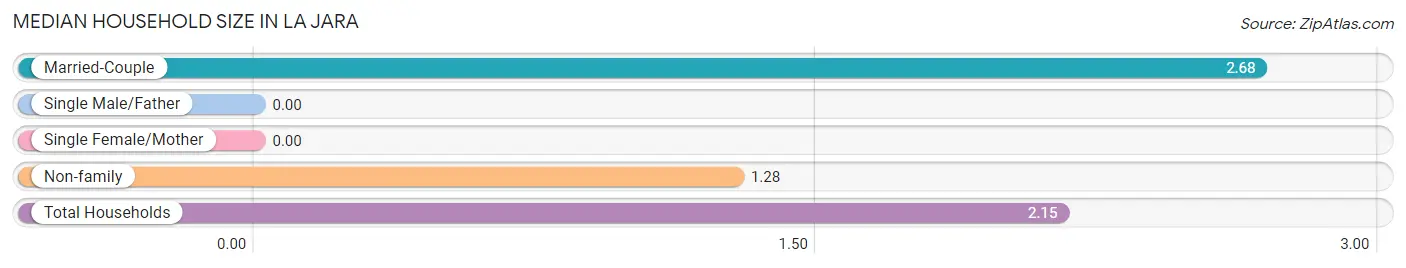
| Household Type | # Households | Household Size |
| Married-Couple | 104 (61.9%) | 2.68 |
| Single Male/Father | 0 (0.0%) | - |
| Single Female/Mother | 0 (0.0%) | - |
| Non-family | 64 (38.1%) | 1.28 |
| Total Households | 168 (100.0%) | 2.15 |
Household Size by Marriage Status in La Jara
Out of a total of 168 households in La Jara, 104 (61.9%) are family households, while 64 (38.1%) are nonfamily households. The most numerous type of family households are 4-person households, comprising 45, and the most common type of nonfamily households are 1-person households, comprising 49.
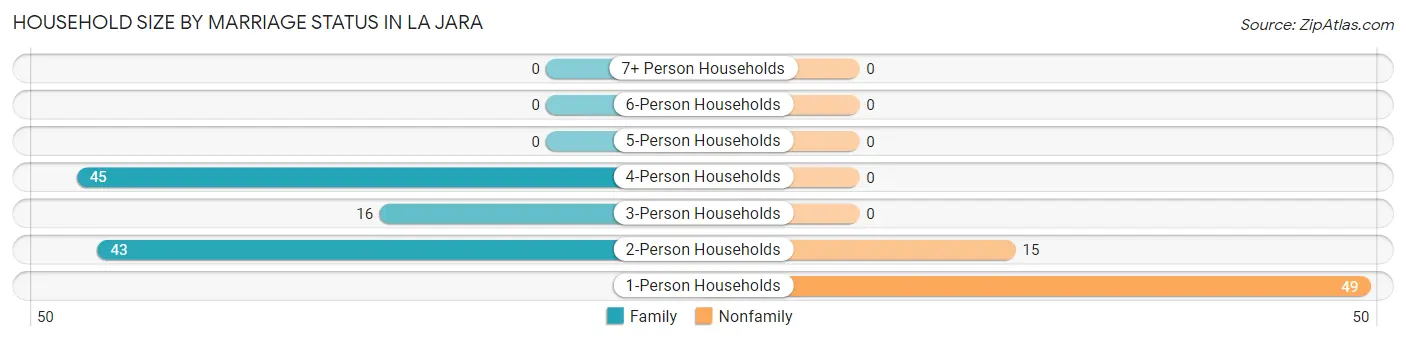
| Household Size | Family Households | Nonfamily Households |
| 1-Person Households | - | 49 (29.2%) |
| 2-Person Households | 43 (25.6%) | 15 (8.9%) |
| 3-Person Households | 16 (9.5%) | 0 (0.0%) |
| 4-Person Households | 45 (26.8%) | 0 (0.0%) |
| 5-Person Households | 0 (0.0%) | 0 (0.0%) |
| 6-Person Households | 0 (0.0%) | 0 (0.0%) |
| 7+ Person Households | 0 (0.0%) | 0 (0.0%) |
| Total | 104 (61.9%) | 64 (38.1%) |
Female Fertility in La Jara
Fertility by Age in La Jara
Average fertility rate in La Jara is 271.0 births per 1,000 women. Women in the age bracket of 20 to 34 years have the highest fertility rate with 448.0 births per 1,000 women. Women in the age bracket of 20 to 34 years acount for 100.0% of all women with births.
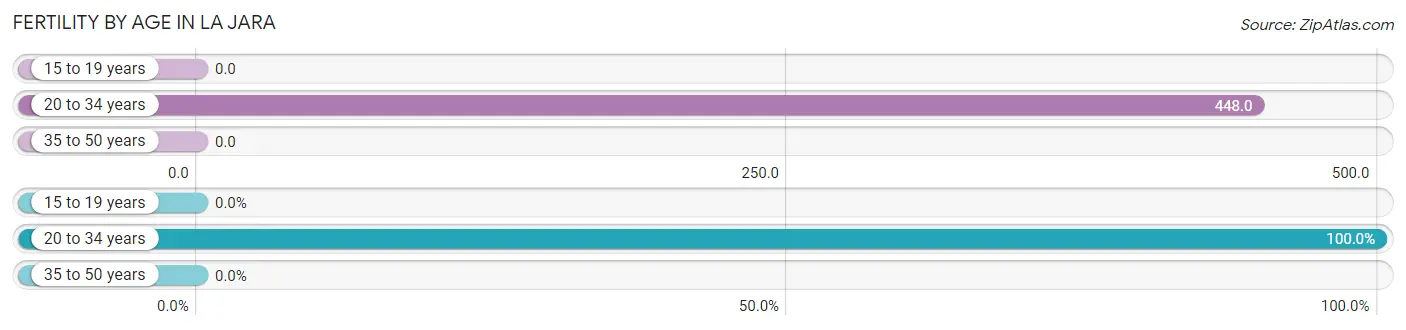
| Age Bracket | Women with Births | Births / 1,000 Women |
| 15 to 19 years | 0 (0.0%) | 0.0 |
| 20 to 34 years | 13 (100.0%) | 448.0 |
| 35 to 50 years | 0 (0.0%) | 0.0 |
| Total | 13 (100.0%) | 271.0 |
Fertility by Age by Marriage Status in La Jara
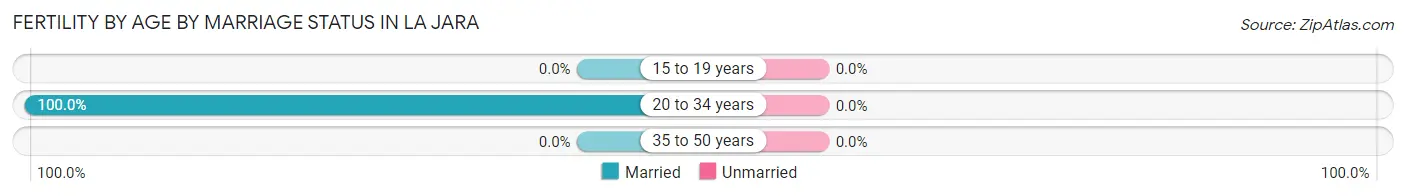
| Age Bracket | Married | Unmarried |
| 15 to 19 years | 0 (0.0%) | 0 (0.0%) |
| 20 to 34 years | 13 (100.0%) | 0 (0.0%) |
| 35 to 50 years | 0 (0.0%) | 0 (0.0%) |
| Total | 13 (100.0%) | 0 (0.0%) |
Fertility by Education in La Jara
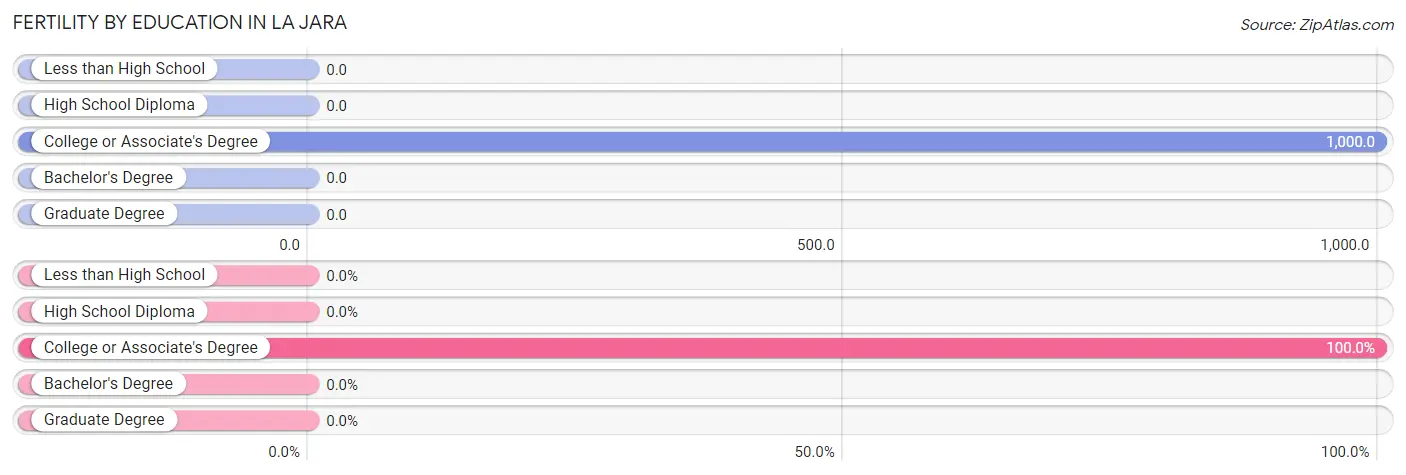
| Educational Attainment | Women with Births | Births / 1,000 Women |
| Less than High School | 0 (0.0%) | 0.0 |
| High School Diploma | 0 (0.0%) | 0.0 |
| College or Associate's Degree | 13 (100.0%) | 1,000.0 |
| Bachelor's Degree | 0 (0.0%) | 0.0 |
| Graduate Degree | 0 (0.0%) | 0.0 |
| Total | 13 (100.0%) | 271.0 |
Fertility by Education by Marriage Status in La Jara
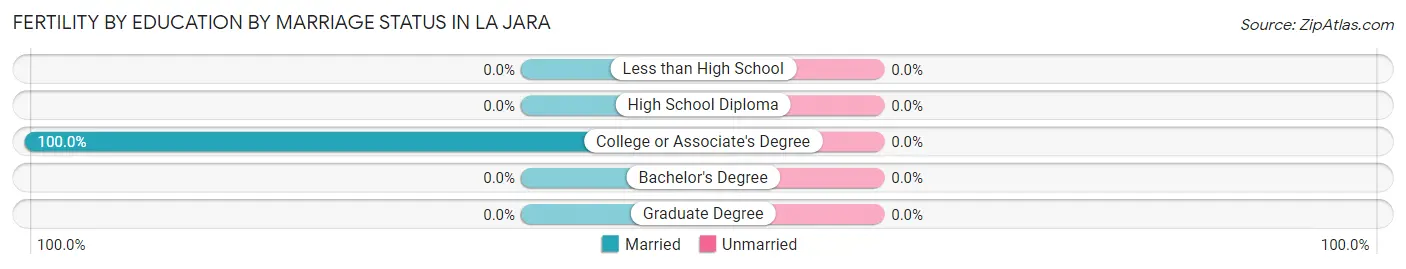
| Educational Attainment | Married | Unmarried |
| Less than High School | 0 (0.0%) | 0 (0.0%) |
| High School Diploma | 0 (0.0%) | 0 (0.0%) |
| College or Associate's Degree | 13 (100.0%) | 0 (0.0%) |
| Bachelor's Degree | 0 (0.0%) | 0 (0.0%) |
| Graduate Degree | 0 (0.0%) | 0 (0.0%) |
| Total | 13 (100.0%) | 0 (0.0%) |
Employment Characteristics in La Jara
Employment by Class of Employer in La Jara
Among the 65 employed individuals in La Jara, private company employees (52 | 80.0%), and local government employees (13 | 20.0%) make up the most common classes of employment.
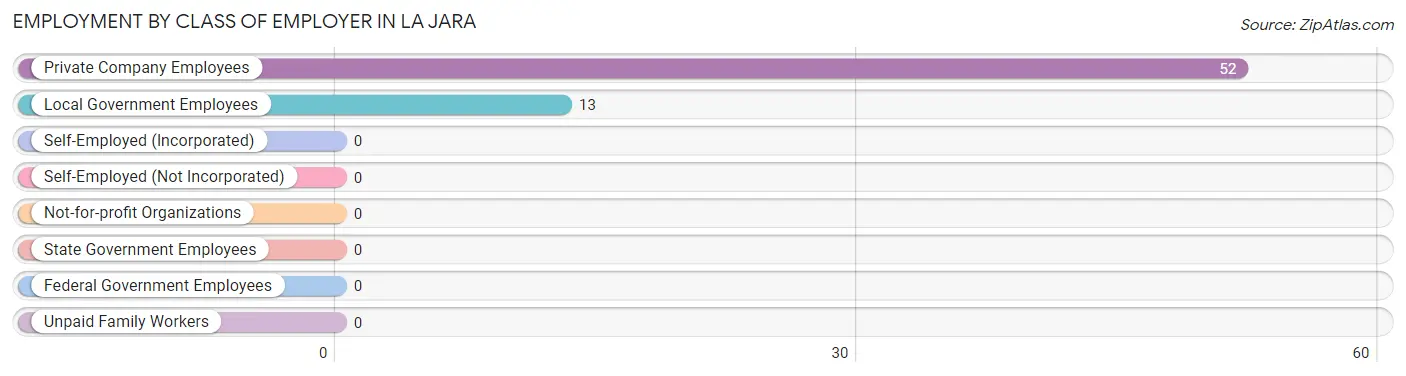
| Employer Class | # Employees | % Employees |
| Private Company Employees | 52 | 80.0% |
| Self-Employed (Incorporated) | 0 | 0.0% |
| Self-Employed (Not Incorporated) | 0 | 0.0% |
| Not-for-profit Organizations | 0 | 0.0% |
| Local Government Employees | 13 | 20.0% |
| State Government Employees | 0 | 0.0% |
| Federal Government Employees | 0 | 0.0% |
| Unpaid Family Workers | 0 | 0.0% |
| Total | 65 | 100.0% |
Employment Status by Age in La Jara
According to the labor force statistics for La Jara, out of the total population over 16 years of age (282), 26.2% or 74 individuals are in the labor force, with 12.2% or 9 of them unemployed. The age group with the highest labor force participation rate is 35 to 44 years, with 100.0% or 19 individuals in the labor force. Within the labor force, the 55 to 59 years age range has the highest percentage of unemployed individuals, with 90.0% or 9 of them being unemployed.
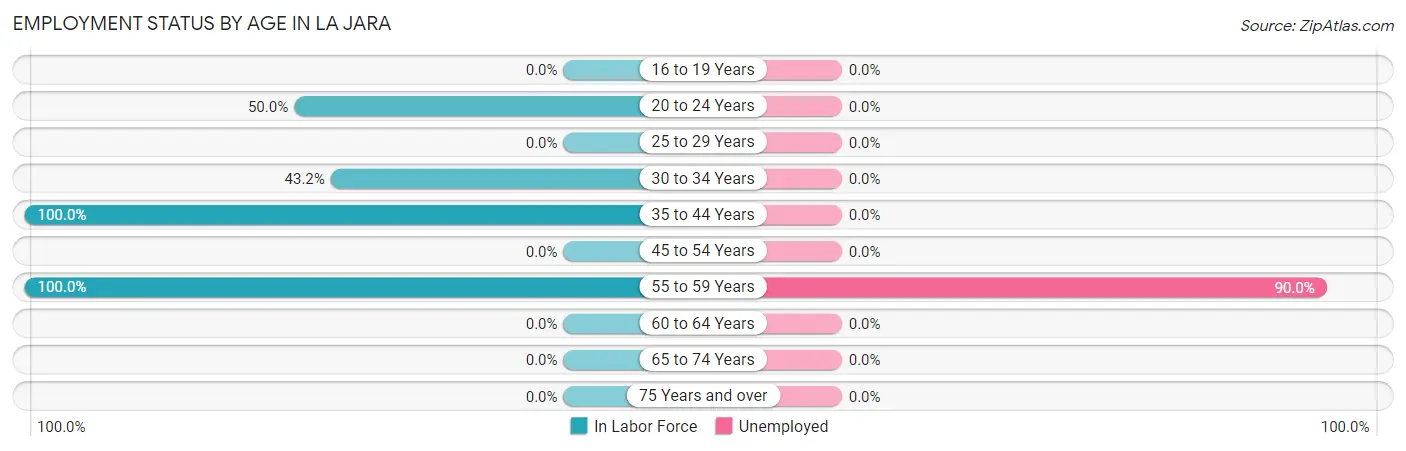
| Age Bracket | In Labor Force | Unemployed |
| 16 to 19 Years | 0 (0.0%) | 0 (0.0%) |
| 20 to 24 Years | 13 (50.0%) | 0 (0.0%) |
| 25 to 29 Years | 0 (0.0%) | 0 (0.0%) |
| 30 to 34 Years | 32 (43.2%) | 0 (0.0%) |
| 35 to 44 Years | 19 (100.0%) | 0 (0.0%) |
| 45 to 54 Years | 0 (0.0%) | 0 (0.0%) |
| 55 to 59 Years | 10 (100.0%) | 9 (90.0%) |
| 60 to 64 Years | 0 (0.0%) | 0 (0.0%) |
| 65 to 74 Years | 0 (0.0%) | 0 (0.0%) |
| 75 Years and over | 0 (0.0%) | 0 (0.0%) |
| Total | 74 (26.2%) | 9 (12.2%) |
Employment Status by Educational Attainment in La Jara
According to labor force statistics for La Jara, 45.5% of individuals (61) out of the total population between 25 and 64 years of age (134) are in the labor force, with 14.8% or 9 of them being unemployed. The group with the highest labor force participation rate are those with the educational attainment of high school diploma, with 100.0% or 1 individuals in the labor force. Within the labor force, individuals with less than high school education have the highest percentage of unemployment, with 100.0% or 9 of them being unemployed.
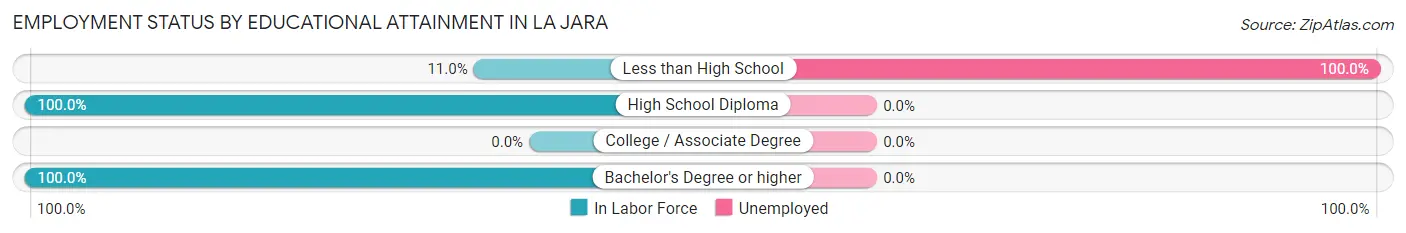
| Educational Attainment | In Labor Force | Unemployed |
| Less than High School | 9 (11.0%) | 82 (100.0%) |
| High School Diploma | 1 (100.0%) | 0 (0.0%) |
| College / Associate Degree | 0 (0.0%) | 0 (0.0%) |
| Bachelor's Degree or higher | 51 (100.0%) | 0 (0.0%) |
| Total | 61 (45.5%) | 20 (14.8%) |
Employment Occupations by Sex in La Jara
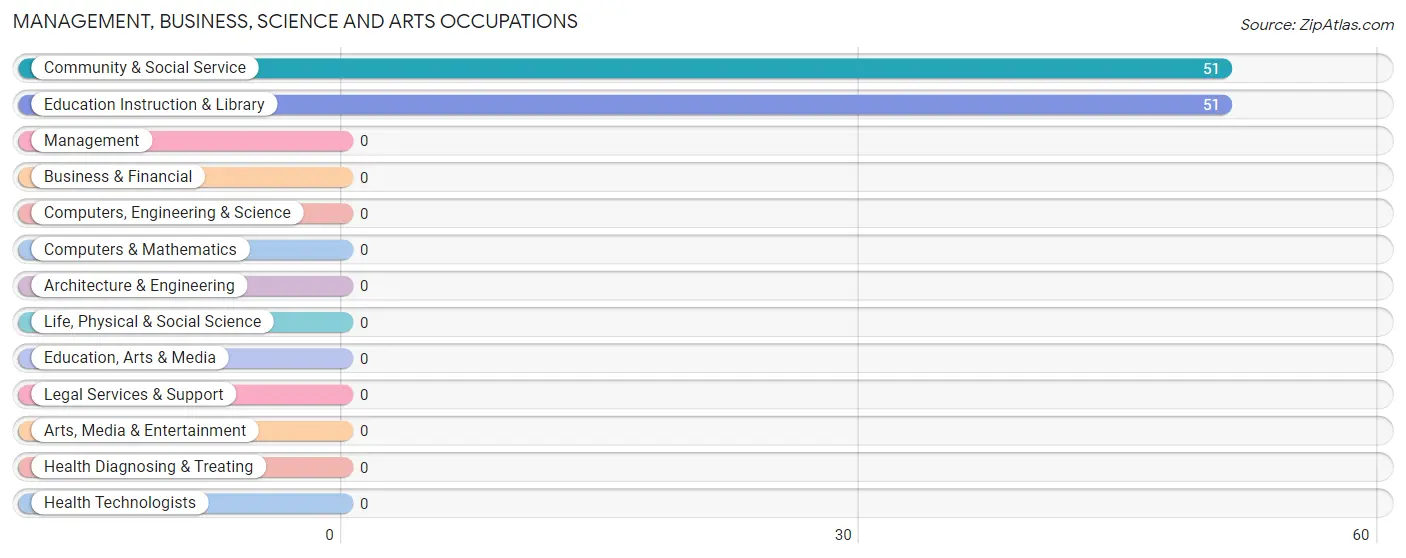
Management, Business, Science and Arts Occupations
The most common Management, Business, Science and Arts occupations in La Jara are Community & Social Service (51 | 78.5%), and Education Instruction & Library (51 | 78.5%).
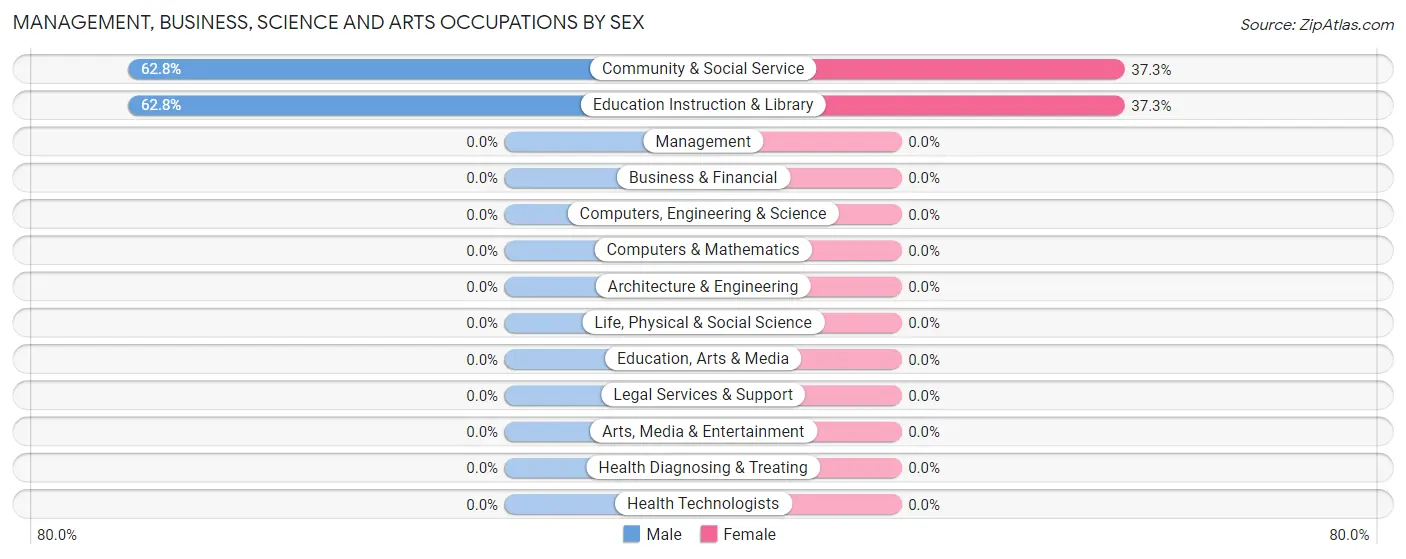
Management, Business, Science and Arts Occupations by Sex
Within the Management, Business, Science and Arts occupations in La Jara, the most male-oriented occupations are Community & Social Service (62.7%), and Education Instruction & Library (62.7%), while the most female-oriented occupations are Community & Social Service (37.2%), and Education Instruction & Library (37.2%).
| Occupation | Male | Female |
| Management | 0 (0.0%) | 0 (0.0%) |
| Business & Financial | 0 (0.0%) | 0 (0.0%) |
| Computers, Engineering & Science | 0 (0.0%) | 0 (0.0%) |
| Computers & Mathematics | 0 (0.0%) | 0 (0.0%) |
| Architecture & Engineering | 0 (0.0%) | 0 (0.0%) |
| Life, Physical & Social Science | 0 (0.0%) | 0 (0.0%) |
| Community & Social Service | 32 (62.7%) | 19 (37.2%) |
| Education, Arts & Media | 0 (0.0%) | 0 (0.0%) |
| Legal Services & Support | 0 (0.0%) | 0 (0.0%) |
| Education Instruction & Library | 32 (62.7%) | 19 (37.2%) |
| Arts, Media & Entertainment | 0 (0.0%) | 0 (0.0%) |
| Health Diagnosing & Treating | 0 (0.0%) | 0 (0.0%) |
| Health Technologists | 0 (0.0%) | 0 (0.0%) |
| Total (Category) | 32 (62.7%) | 19 (37.2%) |
| Total (Overall) | 46 (70.8%) | 19 (29.2%) |
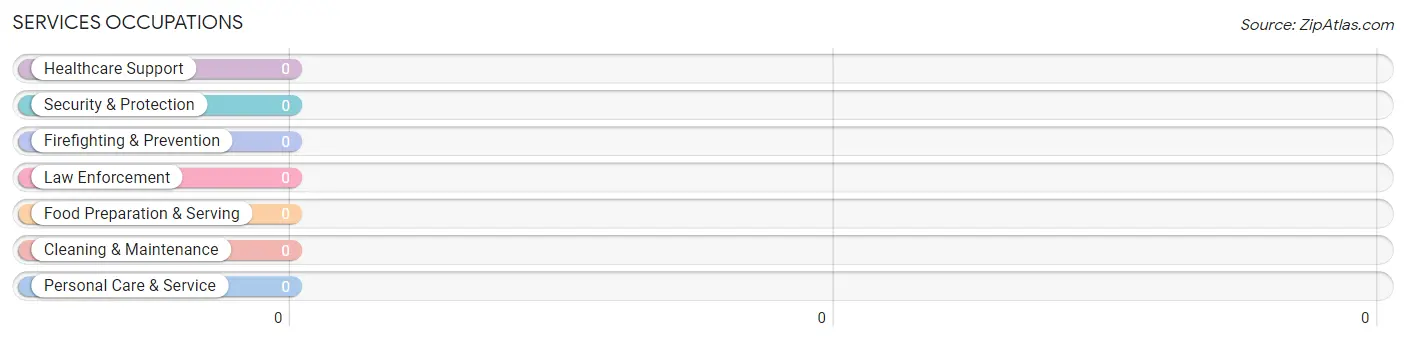
Services Occupations
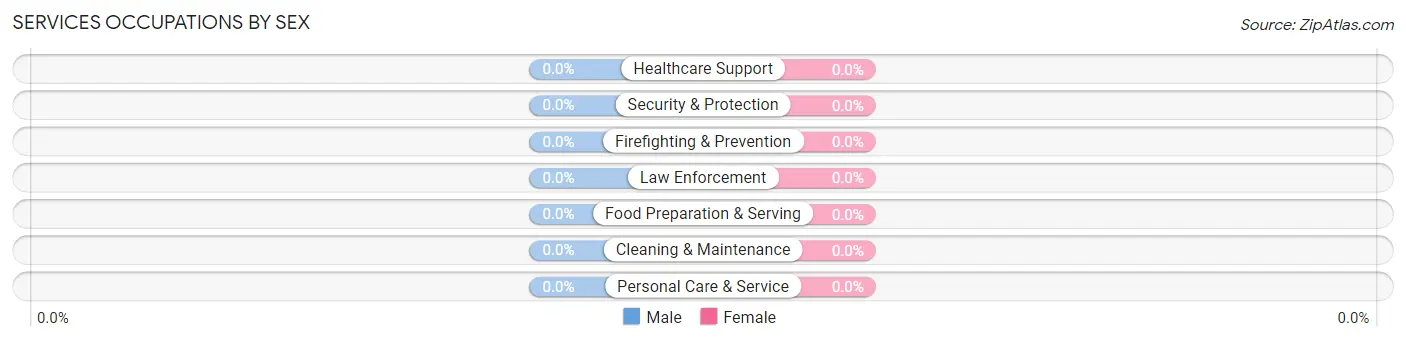
Services Occupations by Sex
| Occupation | Male | Female |
| Healthcare Support | 0 (0.0%) | 0 (0.0%) |
| Security & Protection | 0 (0.0%) | 0 (0.0%) |
| Firefighting & Prevention | 0 (0.0%) | 0 (0.0%) |
| Law Enforcement | 0 (0.0%) | 0 (0.0%) |
| Food Preparation & Serving | 0 (0.0%) | 0 (0.0%) |
| Cleaning & Maintenance | 0 (0.0%) | 0 (0.0%) |
| Personal Care & Service | 0 (0.0%) | 0 (0.0%) |
| Total (Category) | 0 (0.0%) | 0 (0.0%) |
| Total (Overall) | 46 (70.8%) | 19 (29.2%) |
Sales and Office Occupations
The most common Sales and Office occupations in La Jara are , and Sales & Related (1 | 1.5%).
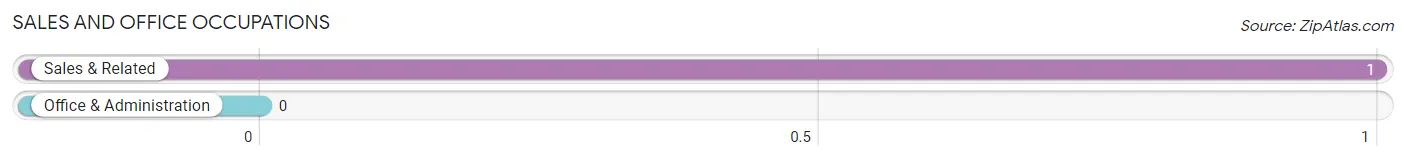
Sales and Office Occupations by Sex

| Occupation | Male | Female |
| Sales & Related | 1 (100.0%) | 0 (0.0%) |
| Office & Administration | 0 (0.0%) | 0 (0.0%) |
| Total (Category) | 1 (100.0%) | 0 (0.0%) |
| Total (Overall) | 46 (70.8%) | 19 (29.2%) |
Natural Resources, Construction and Maintenance Occupations
The most common Natural Resources, Construction and Maintenance occupations in La Jara are , and Construction & Extraction (13 | 20.0%).
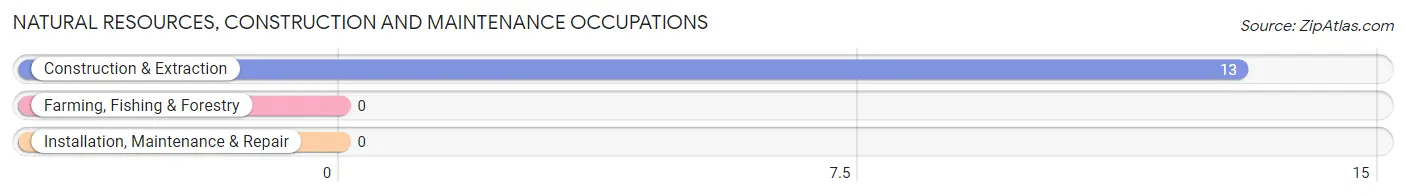
Natural Resources, Construction and Maintenance Occupations by Sex
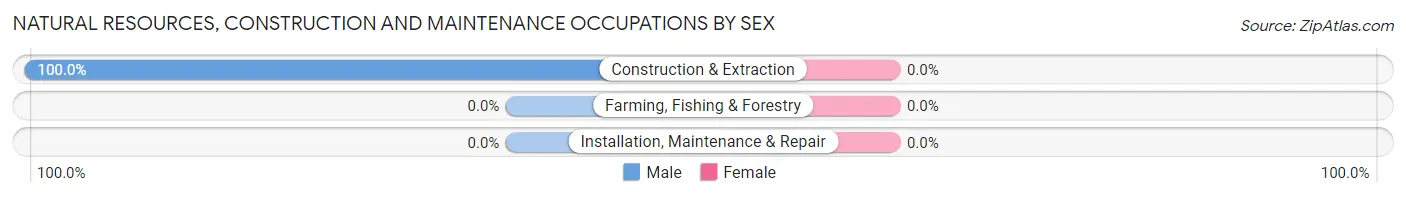
| Occupation | Male | Female |
| Farming, Fishing & Forestry | 0 (0.0%) | 0 (0.0%) |
| Construction & Extraction | 13 (100.0%) | 0 (0.0%) |
| Installation, Maintenance & Repair | 0 (0.0%) | 0 (0.0%) |
| Total (Category) | 13 (100.0%) | 0 (0.0%) |
| Total (Overall) | 46 (70.8%) | 19 (29.2%) |
Production, Transportation and Moving Occupations
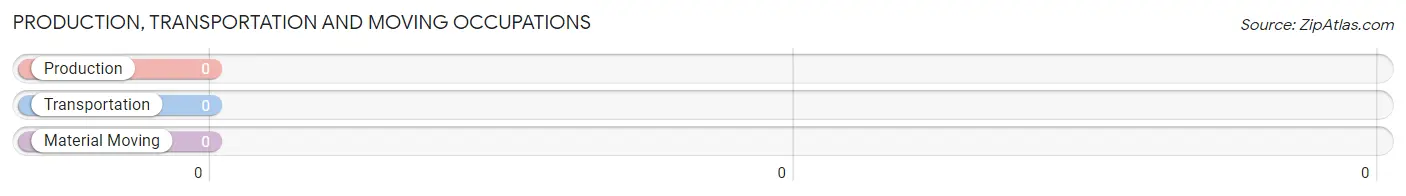
Production, Transportation and Moving Occupations by Sex
| Occupation | Male | Female |
| Production | 0 (0.0%) | 0 (0.0%) |
| Transportation | 0 (0.0%) | 0 (0.0%) |
| Material Moving | 0 (0.0%) | 0 (0.0%) |
| Total (Category) | 0 (0.0%) | 0 (0.0%) |
| Total (Overall) | 46 (70.8%) | 19 (29.2%) |
Employment Industries by Sex in La Jara
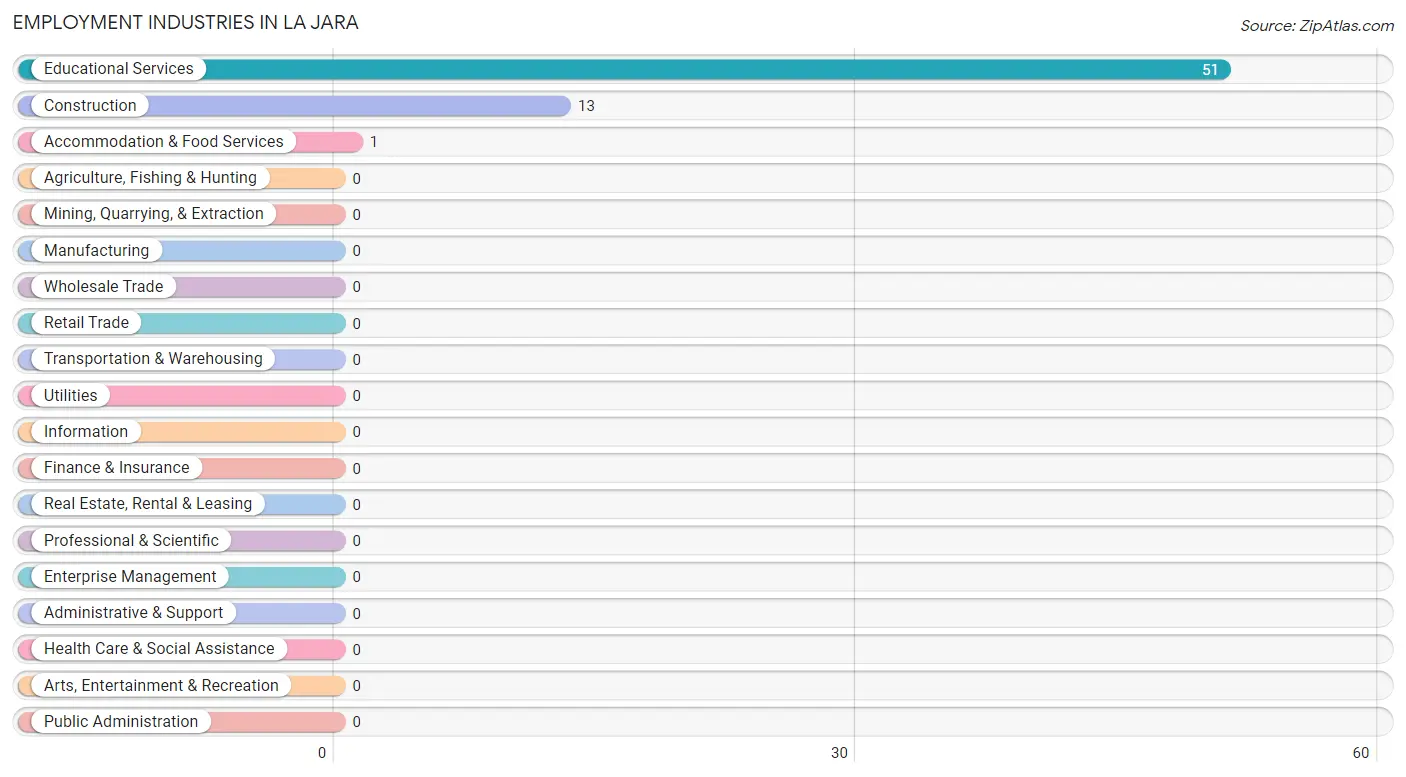
Employment Industries in La Jara
The major employment industries in La Jara include Educational Services (51 | 78.5%), Construction (13 | 20.0%), and Accommodation & Food Services (1 | 1.5%).
Employment Industries by Sex in La Jara
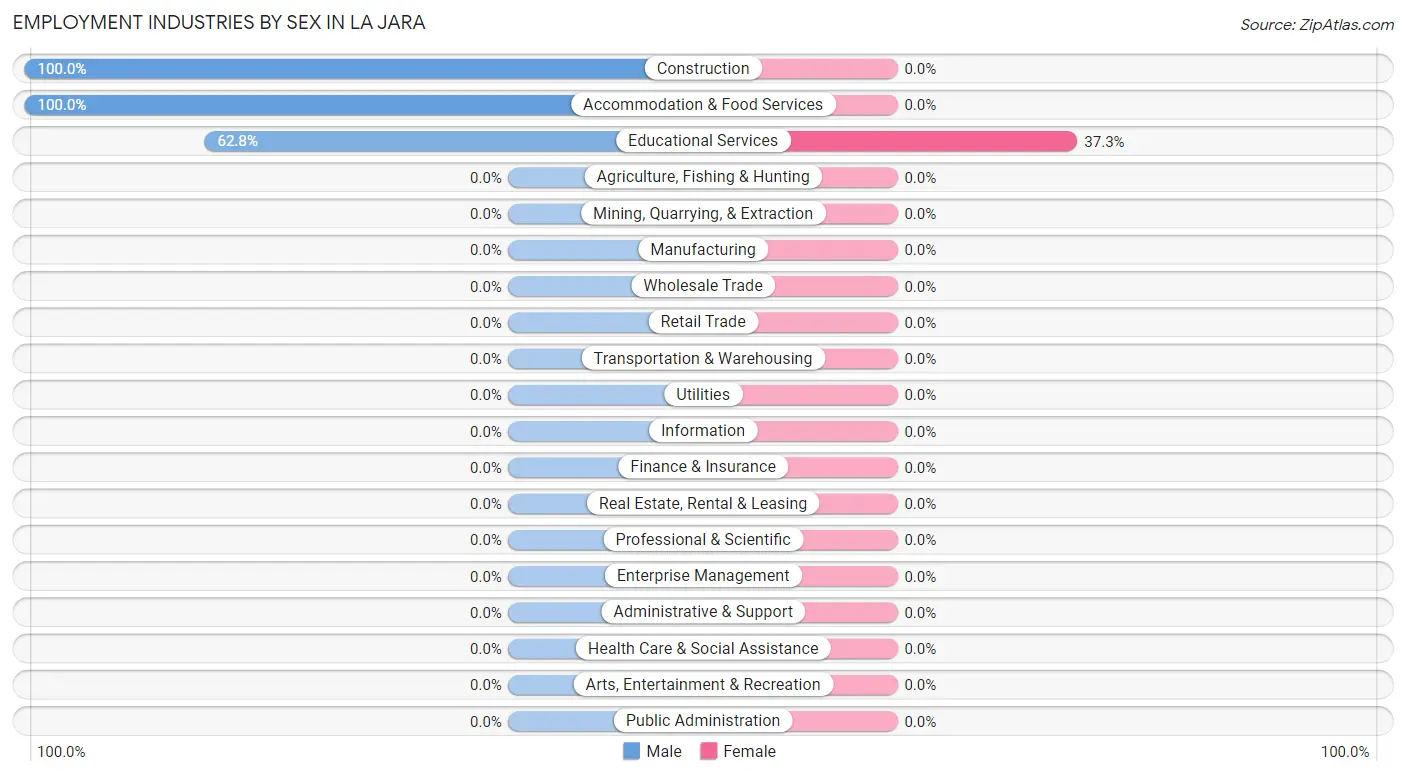
| Industry | Male | Female |
| Agriculture, Fishing & Hunting | 0 (0.0%) | 0 (0.0%) |
| Mining, Quarrying, & Extraction | 0 (0.0%) | 0 (0.0%) |
| Construction | 13 (100.0%) | 0 (0.0%) |
| Manufacturing | 0 (0.0%) | 0 (0.0%) |
| Wholesale Trade | 0 (0.0%) | 0 (0.0%) |
| Retail Trade | 0 (0.0%) | 0 (0.0%) |
| Transportation & Warehousing | 0 (0.0%) | 0 (0.0%) |
| Utilities | 0 (0.0%) | 0 (0.0%) |
| Information | 0 (0.0%) | 0 (0.0%) |
| Finance & Insurance | 0 (0.0%) | 0 (0.0%) |
| Real Estate, Rental & Leasing | 0 (0.0%) | 0 (0.0%) |
| Professional & Scientific | 0 (0.0%) | 0 (0.0%) |
| Enterprise Management | 0 (0.0%) | 0 (0.0%) |
| Administrative & Support | 0 (0.0%) | 0 (0.0%) |
| Educational Services | 32 (62.7%) | 19 (37.2%) |
| Health Care & Social Assistance | 0 (0.0%) | 0 (0.0%) |
| Arts, Entertainment & Recreation | 0 (0.0%) | 0 (0.0%) |
| Accommodation & Food Services | 1 (100.0%) | 0 (0.0%) |
| Public Administration | 0 (0.0%) | 0 (0.0%) |
| Total | 46 (70.8%) | 19 (29.2%) |
Education in La Jara
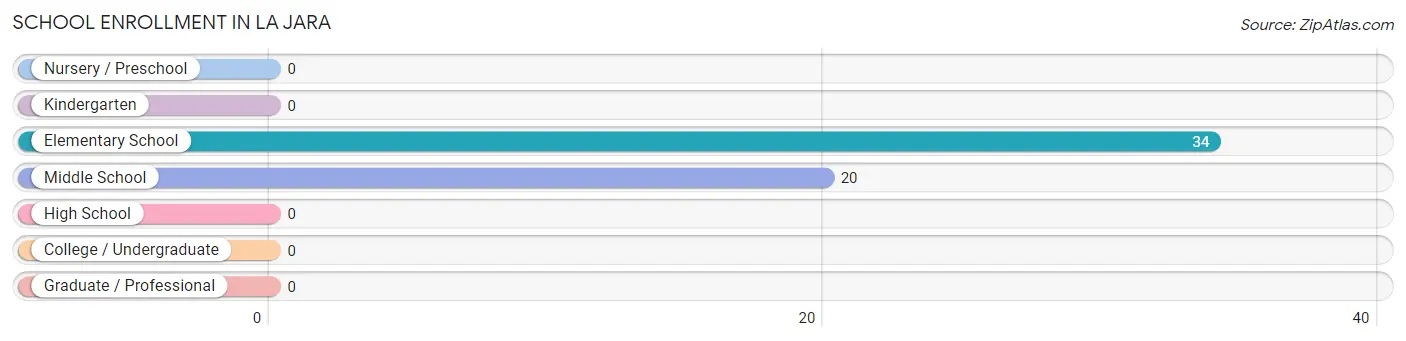
School Enrollment in La Jara
The most common levels of schooling among the 54 students in La Jara are elementary school (34 | 63.0%), and middle school (20 | 37.0%).
| School Level | # Students | % Students |
| Nursery / Preschool | 0 | 0.0% |
| Kindergarten | 0 | 0.0% |
| Elementary School | 34 | 63.0% |
| Middle School | 20 | 37.0% |
| High School | 0 | 0.0% |
| College / Undergraduate | 0 | 0.0% |
| Graduate / Professional | 0 | 0.0% |
| Total | 54 | 100.0% |
School Enrollment by Age by Funding Source in La Jara
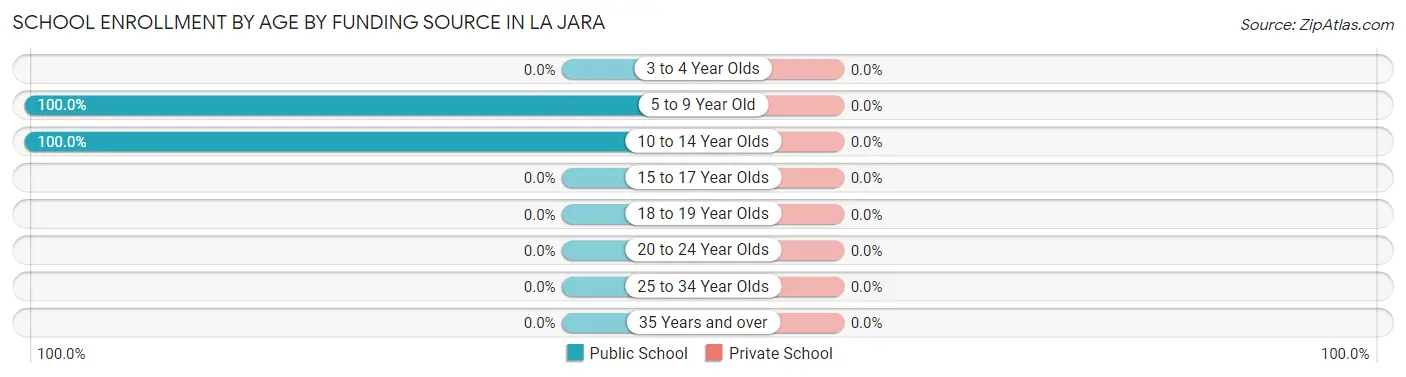
| Age Bracket | Public School | Private School |
| 3 to 4 Year Olds | 0 (0.0%) | 0 (0.0%) |
| 5 to 9 Year Old | 34 (100.0%) | 0 (0.0%) |
| 10 to 14 Year Olds | 20 (100.0%) | 0 (0.0%) |
| 15 to 17 Year Olds | 0 (0.0%) | 0 (0.0%) |
| 18 to 19 Year Olds | 0 (0.0%) | 0 (0.0%) |
| 20 to 24 Year Olds | 0 (0.0%) | 0 (0.0%) |
| 25 to 34 Year Olds | 0 (0.0%) | 0 (0.0%) |
| 35 Years and over | 0 (0.0%) | 0 (0.0%) |
| Total | 54 (100.0%) | 0 (0.0%) |
Educational Attainment by Field of Study in La Jara
Education (51 | 53.7%), literature & languages (18 | 19.0%), business (17 | 17.9%), and science & technology (9 | 9.5%) are the most common fields of study among 95 individuals in La Jara who have obtained a bachelor's degree or higher.
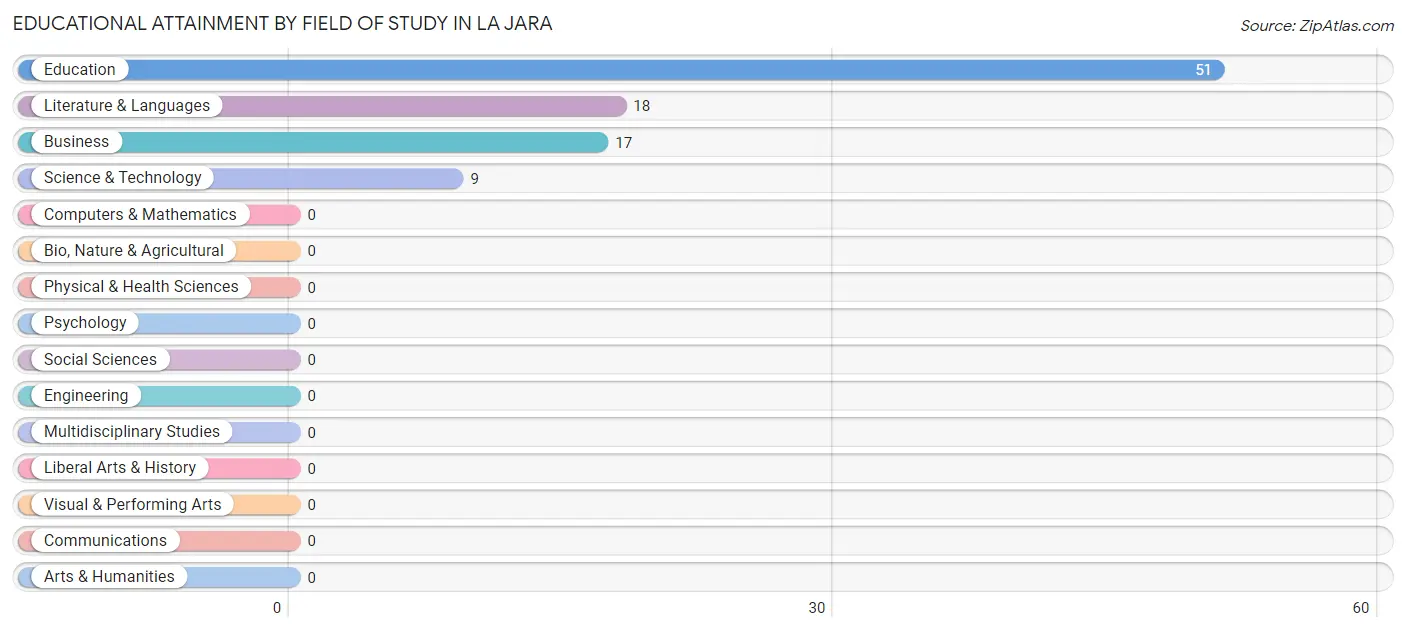
| Field of Study | # Graduates | % Graduates |
| Computers & Mathematics | 0 | 0.0% |
| Bio, Nature & Agricultural | 0 | 0.0% |
| Physical & Health Sciences | 0 | 0.0% |
| Psychology | 0 | 0.0% |
| Social Sciences | 0 | 0.0% |
| Engineering | 0 | 0.0% |
| Multidisciplinary Studies | 0 | 0.0% |
| Science & Technology | 9 | 9.5% |
| Business | 17 | 17.9% |
| Education | 51 | 53.7% |
| Literature & Languages | 18 | 19.0% |
| Liberal Arts & History | 0 | 0.0% |
| Visual & Performing Arts | 0 | 0.0% |
| Communications | 0 | 0.0% |
| Arts & Humanities | 0 | 0.0% |
| Total | 95 | 100.0% |
Transportation & Commute in La Jara
Vehicle Availability by Sex in La Jara
The most prevalent vehicle ownership categories in La Jara are males with 2 vehicles (32, accounting for 69.6%) and females with 2 vehicles (19, making up 168.4%).
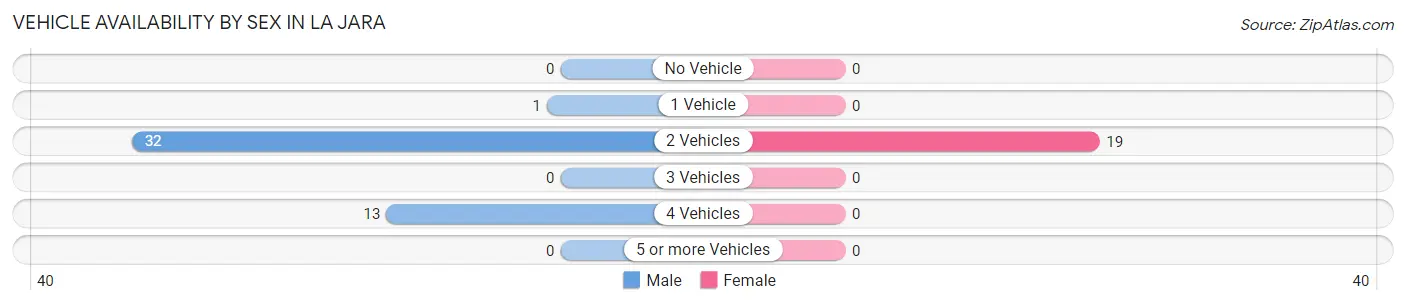
| Vehicles Available | Male | Female |
| No Vehicle | 0 (0.0%) | 0 (0.0%) |
| 1 Vehicle | 1 (2.2%) | 0 (0.0%) |
| 2 Vehicles | 32 (69.6%) | 19 (100.0%) |
| 3 Vehicles | 0 (0.0%) | 0 (0.0%) |
| 4 Vehicles | 13 (28.3%) | 0 (0.0%) |
| 5 or more Vehicles | 0 (0.0%) | 0 (0.0%) |
| Total | 46 (100.0%) | 19 (100.0%) |
Commute Time in La Jara
The most frequently occuring commute durations in La Jara are 25 to 29 minutes (51 commuters, 78.5%), 20 to 24 minutes (13 commuters, 20.0%), and 5 to 9 minutes (1 commuters, 1.5%).
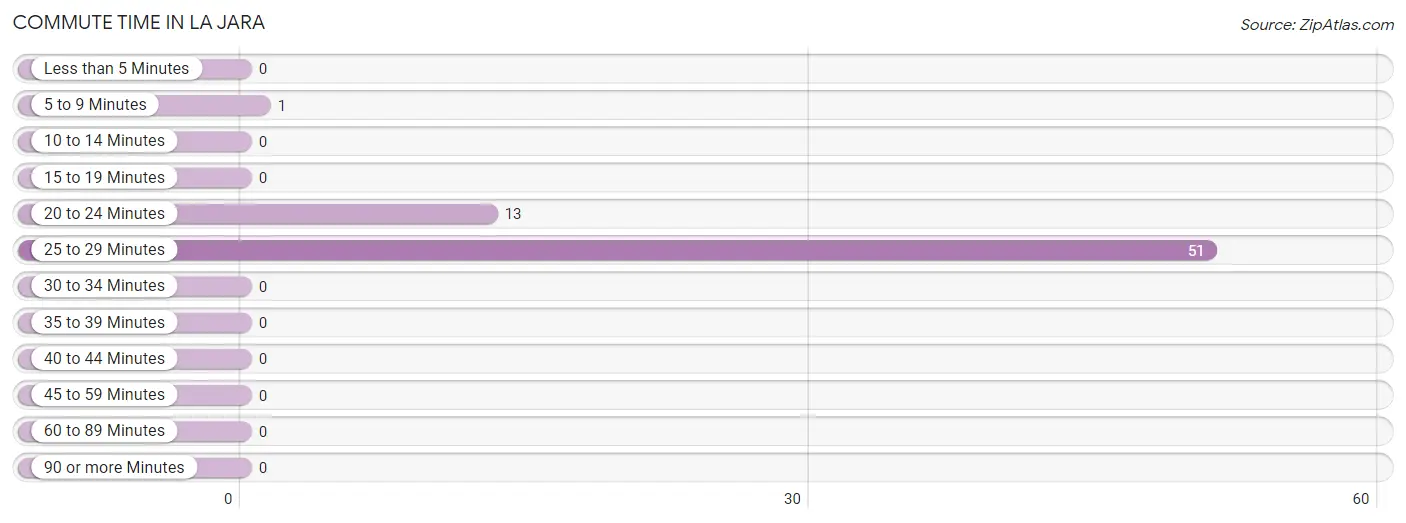
| Commute Time | # Commuters | % Commuters |
| Less than 5 Minutes | 0 | 0.0% |
| 5 to 9 Minutes | 1 | 1.5% |
| 10 to 14 Minutes | 0 | 0.0% |
| 15 to 19 Minutes | 0 | 0.0% |
| 20 to 24 Minutes | 13 | 20.0% |
| 25 to 29 Minutes | 51 | 78.5% |
| 30 to 34 Minutes | 0 | 0.0% |
| 35 to 39 Minutes | 0 | 0.0% |
| 40 to 44 Minutes | 0 | 0.0% |
| 45 to 59 Minutes | 0 | 0.0% |
| 60 to 89 Minutes | 0 | 0.0% |
| 90 or more Minutes | 0 | 0.0% |
Commute Time by Sex in La Jara
The most common commute times in La Jara are 25 to 29 minutes (32 commuters, 69.6%) for males and 25 to 29 minutes (19 commuters, 100.0%) for females.
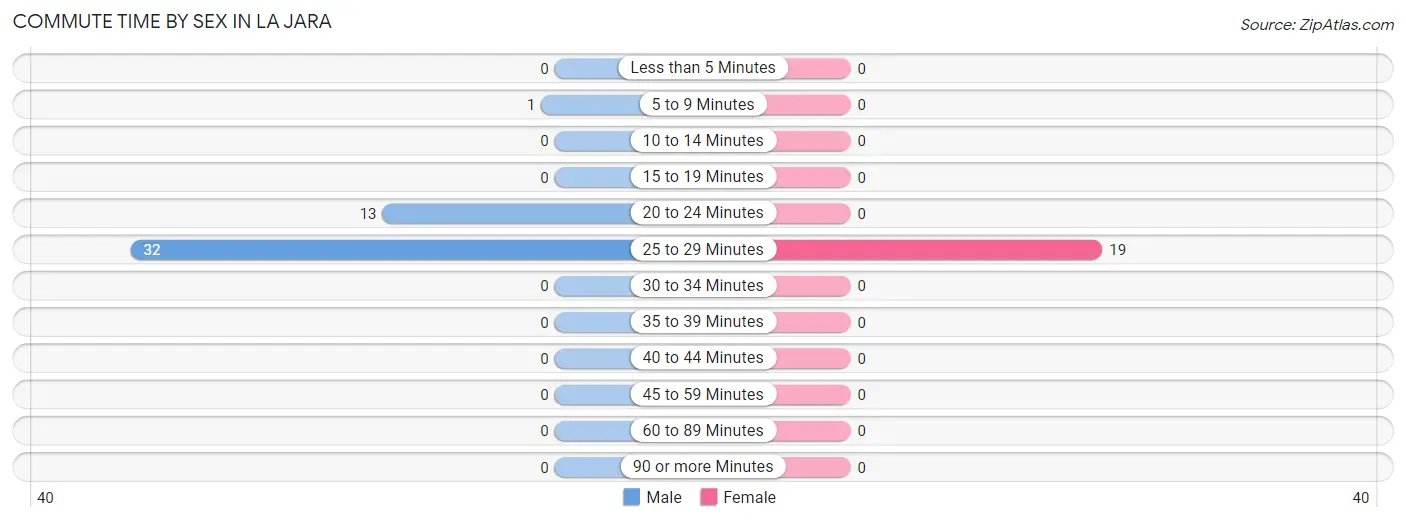
| Commute Time | Male | Female |
| Less than 5 Minutes | 0 (0.0%) | 0 (0.0%) |
| 5 to 9 Minutes | 1 (2.2%) | 0 (0.0%) |
| 10 to 14 Minutes | 0 (0.0%) | 0 (0.0%) |
| 15 to 19 Minutes | 0 (0.0%) | 0 (0.0%) |
| 20 to 24 Minutes | 13 (28.3%) | 0 (0.0%) |
| 25 to 29 Minutes | 32 (69.6%) | 19 (100.0%) |
| 30 to 34 Minutes | 0 (0.0%) | 0 (0.0%) |
| 35 to 39 Minutes | 0 (0.0%) | 0 (0.0%) |
| 40 to 44 Minutes | 0 (0.0%) | 0 (0.0%) |
| 45 to 59 Minutes | 0 (0.0%) | 0 (0.0%) |
| 60 to 89 Minutes | 0 (0.0%) | 0 (0.0%) |
| 90 or more Minutes | 0 (0.0%) | 0 (0.0%) |
Time of Departure to Work by Sex in La Jara
The most frequent times of departure to work in La Jara are 6:30 AM to 6:59 AM (32, 69.6%) for males and 6:30 AM to 6:59 AM (19, 100.0%) for females.
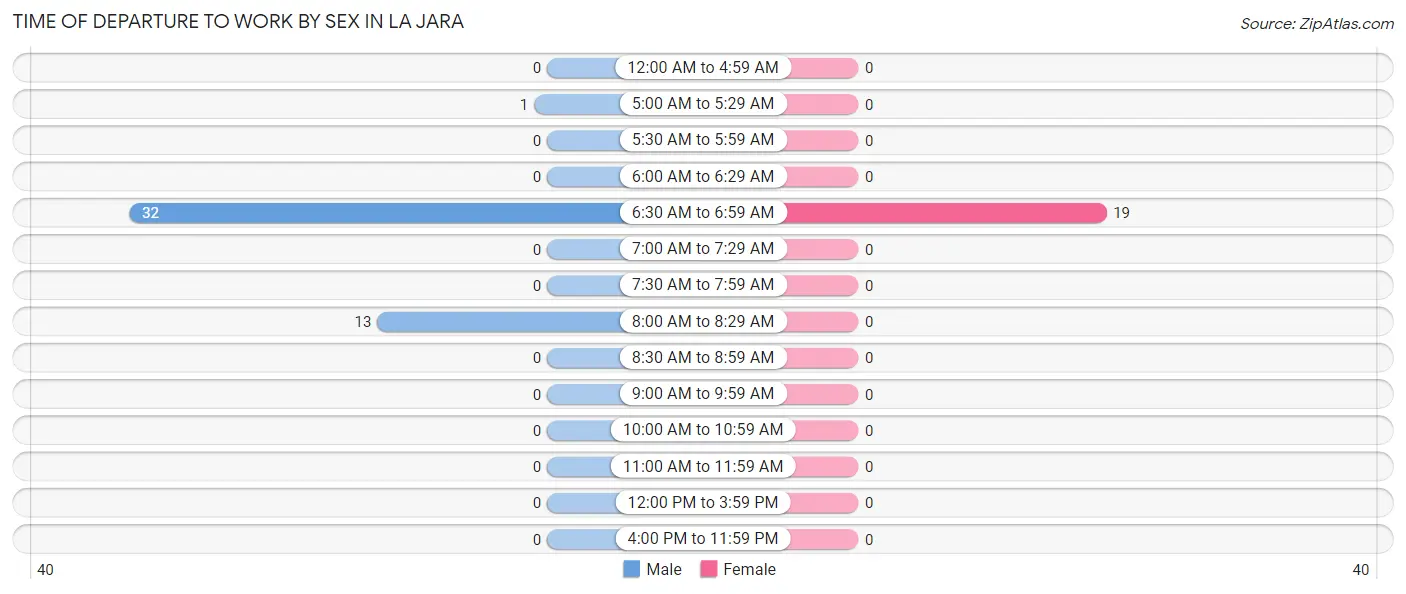
| Time of Departure | Male | Female |
| 12:00 AM to 4:59 AM | 0 (0.0%) | 0 (0.0%) |
| 5:00 AM to 5:29 AM | 1 (2.2%) | 0 (0.0%) |
| 5:30 AM to 5:59 AM | 0 (0.0%) | 0 (0.0%) |
| 6:00 AM to 6:29 AM | 0 (0.0%) | 0 (0.0%) |
| 6:30 AM to 6:59 AM | 32 (69.6%) | 19 (100.0%) |
| 7:00 AM to 7:29 AM | 0 (0.0%) | 0 (0.0%) |
| 7:30 AM to 7:59 AM | 0 (0.0%) | 0 (0.0%) |
| 8:00 AM to 8:29 AM | 13 (28.3%) | 0 (0.0%) |
| 8:30 AM to 8:59 AM | 0 (0.0%) | 0 (0.0%) |
| 9:00 AM to 9:59 AM | 0 (0.0%) | 0 (0.0%) |
| 10:00 AM to 10:59 AM | 0 (0.0%) | 0 (0.0%) |
| 11:00 AM to 11:59 AM | 0 (0.0%) | 0 (0.0%) |
| 12:00 PM to 3:59 PM | 0 (0.0%) | 0 (0.0%) |
| 4:00 PM to 11:59 PM | 0 (0.0%) | 0 (0.0%) |
| Total | 46 (100.0%) | 19 (100.0%) |
Housing Occupancy in La Jara
Occupancy by Ownership in La Jara
Of the total 168 dwellings in La Jara, owner-occupied units account for 80 (47.6%), while renter-occupied units make up 88 (52.4%).
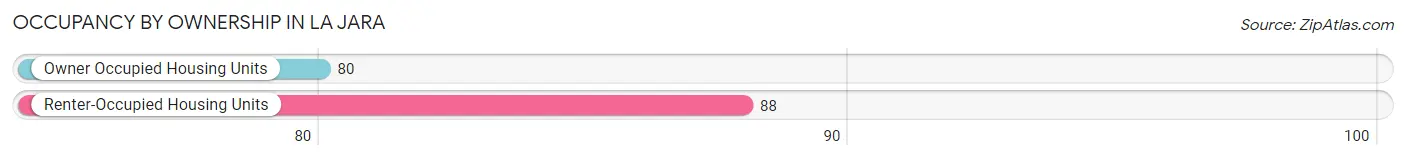
| Occupancy | # Housing Units | % Housing Units |
| Owner Occupied Housing Units | 80 | 47.6% |
| Renter-Occupied Housing Units | 88 | 52.4% |
| Total Occupied Housing Units | 168 | 100.0% |
Occupancy by Household Size in La Jara
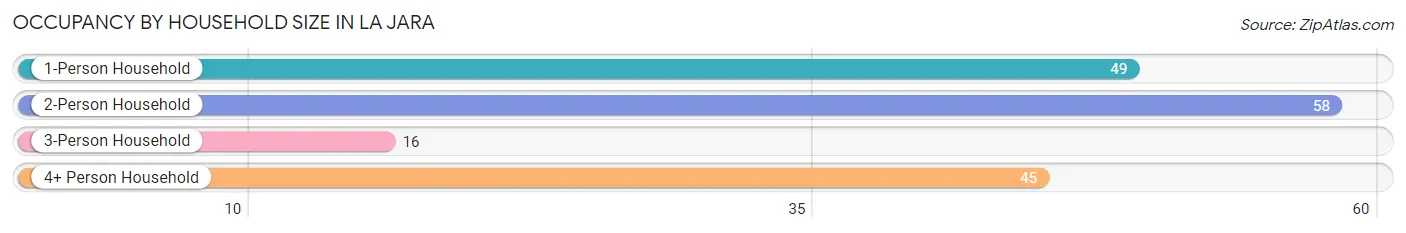
| Household Size | # Housing Units | % Housing Units |
| 1-Person Household | 49 | 29.2% |
| 2-Person Household | 58 | 34.5% |
| 3-Person Household | 16 | 9.5% |
| 4+ Person Household | 45 | 26.8% |
| Total Housing Units | 168 | 100.0% |
Occupancy by Ownership by Household Size in La Jara
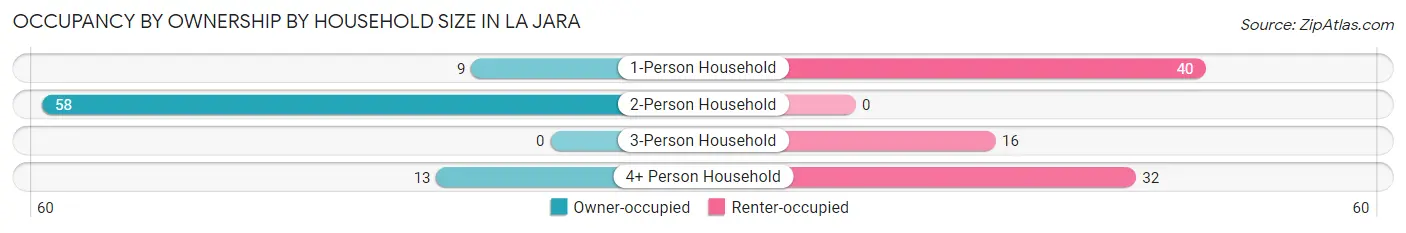
| Household Size | Owner-occupied | Renter-occupied |
| 1-Person Household | 9 (18.4%) | 40 (81.6%) |
| 2-Person Household | 58 (100.0%) | 0 (0.0%) |
| 3-Person Household | 0 (0.0%) | 16 (100.0%) |
| 4+ Person Household | 13 (28.9%) | 32 (71.1%) |
| Total Housing Units | 80 (47.6%) | 88 (52.4%) |
Occupancy by Educational Attainment in La Jara
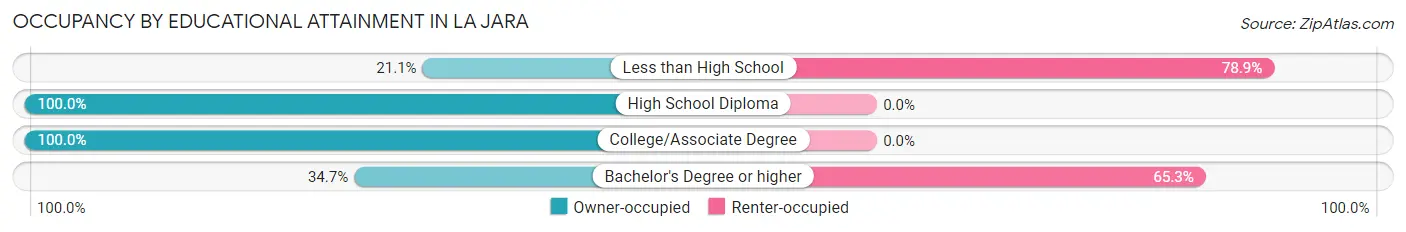
| Household Size | Owner-occupied | Renter-occupied |
| Less than High School | 15 (21.1%) | 56 (78.9%) |
| High School Diploma | 1 (100.0%) | 0 (0.0%) |
| College/Associate Degree | 47 (100.0%) | 0 (0.0%) |
| Bachelor's Degree or higher | 17 (34.7%) | 32 (65.3%) |
Occupancy by Age of Householder in La Jara
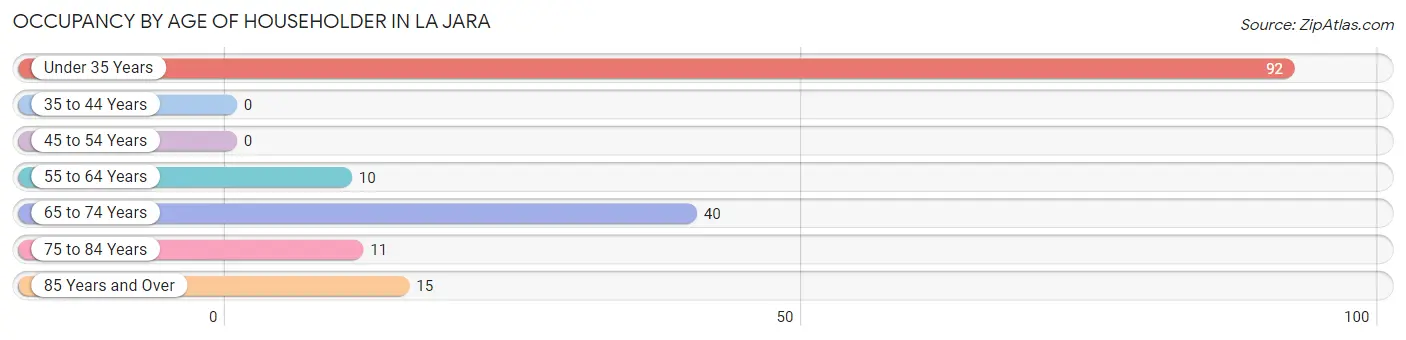
| Age Bracket | # Households | % Households |
| Under 35 Years | 92 | 54.8% |
| 35 to 44 Years | 0 | 0.0% |
| 45 to 54 Years | 0 | 0.0% |
| 55 to 64 Years | 10 | 5.9% |
| 65 to 74 Years | 40 | 23.8% |
| 75 to 84 Years | 11 | 6.6% |
| 85 Years and Over | 15 | 8.9% |
| Total | 168 | 100.0% |
Housing Finances in La Jara
Median Income by Occupancy in La Jara
| Occupancy Type | # Households | Median Income |
| Owner-Occupied | 80 (47.6%) | $0 |
| Renter-Occupied | 88 (52.4%) | $0 |
| Average | 168 (100.0%) | $0 |
Occupancy by Householder Income Bracket in La Jara
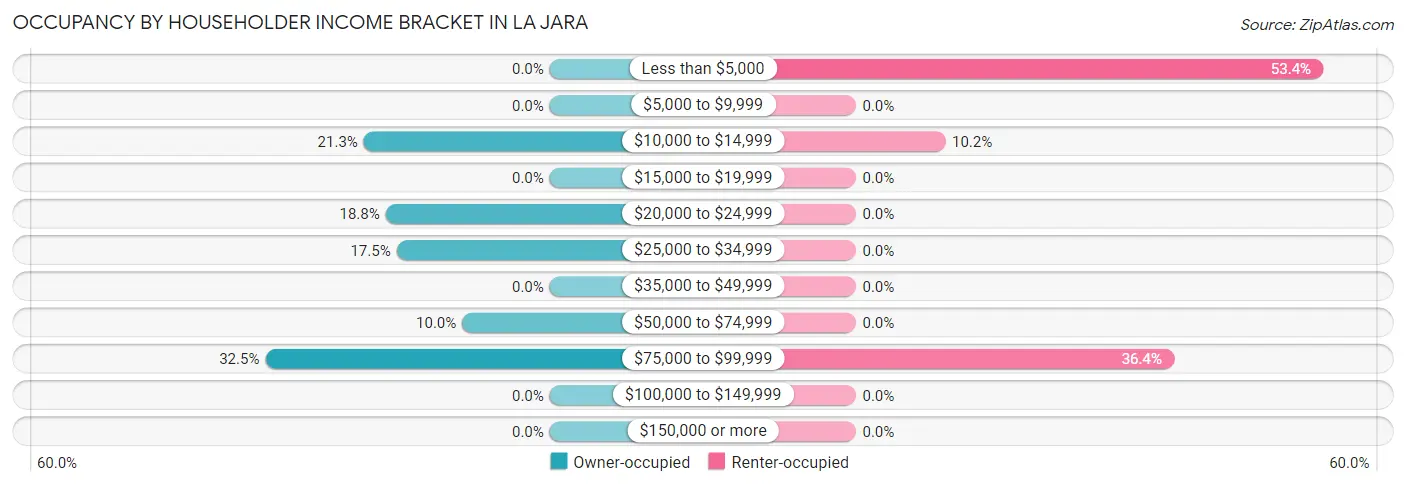
| Income Bracket | Owner-occupied | Renter-occupied |
| Less than $5,000 | 0 (0.0%) | 47 (53.4%) |
| $5,000 to $9,999 | 0 (0.0%) | 0 (0.0%) |
| $10,000 to $14,999 | 17 (21.2%) | 9 (10.2%) |
| $15,000 to $19,999 | 0 (0.0%) | 0 (0.0%) |
| $20,000 to $24,999 | 15 (18.8%) | 0 (0.0%) |
| $25,000 to $34,999 | 14 (17.5%) | 0 (0.0%) |
| $35,000 to $49,999 | 0 (0.0%) | 0 (0.0%) |
| $50,000 to $74,999 | 8 (10.0%) | 0 (0.0%) |
| $75,000 to $99,999 | 26 (32.5%) | 32 (36.4%) |
| $100,000 to $149,999 | 0 (0.0%) | 0 (0.0%) |
| $150,000 or more | 0 (0.0%) | 0 (0.0%) |
| Total | 80 (100.0%) | 88 (100.0%) |
Monthly Housing Cost Tiers in La Jara
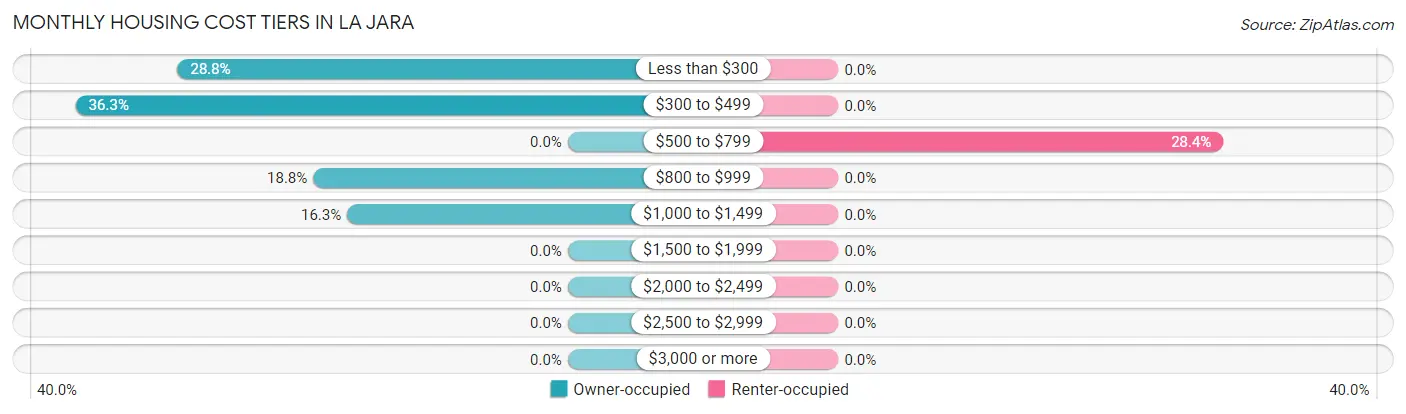
| Monthly Cost | Owner-occupied | Renter-occupied |
| Less than $300 | 23 (28.7%) | 0 (0.0%) |
| $300 to $499 | 29 (36.2%) | 0 (0.0%) |
| $500 to $799 | 0 (0.0%) | 25 (28.4%) |
| $800 to $999 | 15 (18.8%) | 0 (0.0%) |
| $1,000 to $1,499 | 13 (16.3%) | 0 (0.0%) |
| $1,500 to $1,999 | 0 (0.0%) | 0 (0.0%) |
| $2,000 to $2,499 | 0 (0.0%) | 0 (0.0%) |
| $2,500 to $2,999 | 0 (0.0%) | 0 (0.0%) |
| $3,000 or more | 0 (0.0%) | 0 (0.0%) |
| Total | 80 (100.0%) | 88 (100.0%) |
Physical Housing Characteristics in La Jara
Housing Structures in La Jara
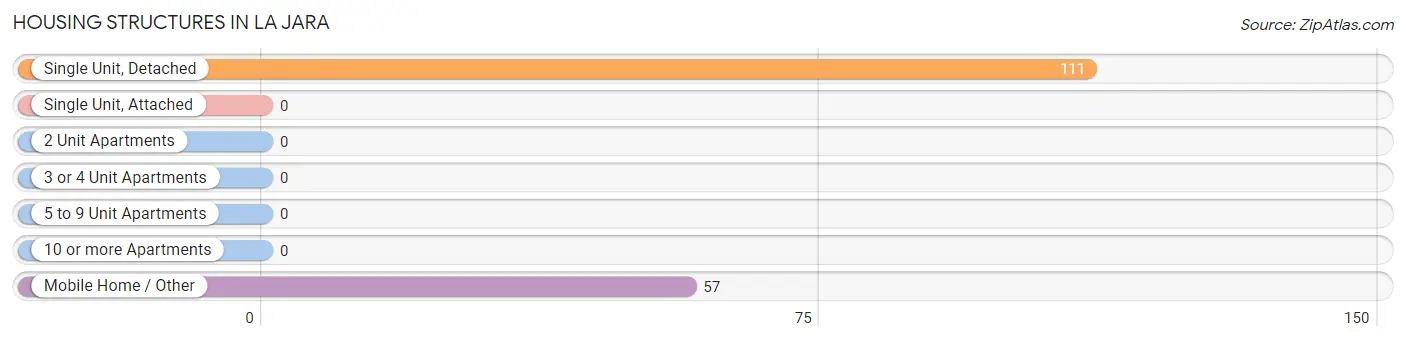
| Structure Type | # Housing Units | % Housing Units |
| Single Unit, Detached | 111 | 66.1% |
| Single Unit, Attached | 0 | 0.0% |
| 2 Unit Apartments | 0 | 0.0% |
| 3 or 4 Unit Apartments | 0 | 0.0% |
| 5 to 9 Unit Apartments | 0 | 0.0% |
| 10 or more Apartments | 0 | 0.0% |
| Mobile Home / Other | 57 | 33.9% |
| Total | 168 | 100.0% |
Housing Structures by Occupancy in La Jara
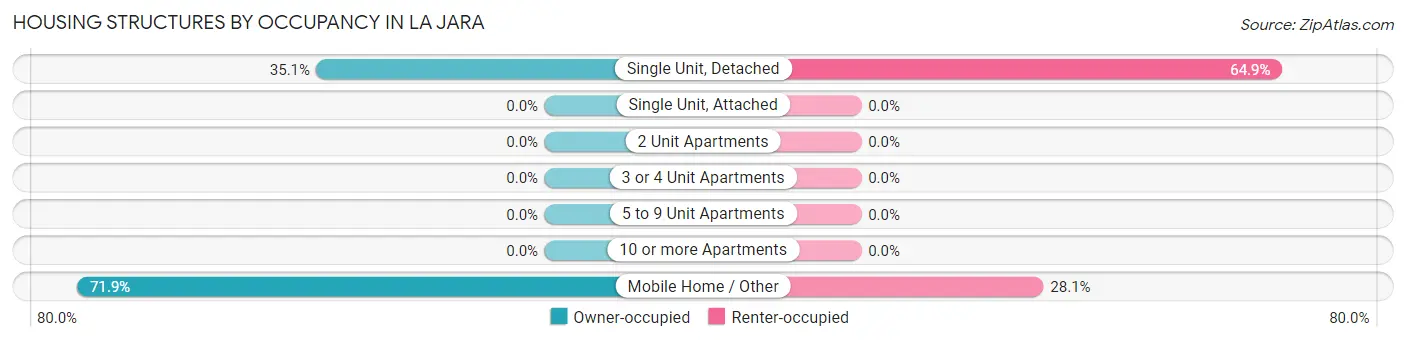
| Structure Type | Owner-occupied | Renter-occupied |
| Single Unit, Detached | 39 (35.1%) | 72 (64.9%) |
| Single Unit, Attached | 0 (0.0%) | 0 (0.0%) |
| 2 Unit Apartments | 0 (0.0%) | 0 (0.0%) |
| 3 or 4 Unit Apartments | 0 (0.0%) | 0 (0.0%) |
| 5 to 9 Unit Apartments | 0 (0.0%) | 0 (0.0%) |
| 10 or more Apartments | 0 (0.0%) | 0 (0.0%) |
| Mobile Home / Other | 41 (71.9%) | 16 (28.1%) |
| Total | 80 (47.6%) | 88 (52.4%) |
Housing Structures by Number of Rooms in La Jara
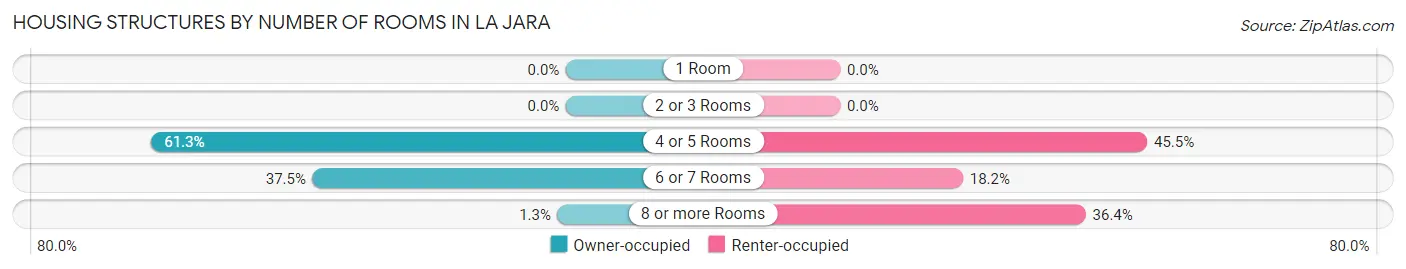
| Number of Rooms | Owner-occupied | Renter-occupied |
| 1 Room | 0 (0.0%) | 0 (0.0%) |
| 2 or 3 Rooms | 0 (0.0%) | 0 (0.0%) |
| 4 or 5 Rooms | 49 (61.3%) | 40 (45.5%) |
| 6 or 7 Rooms | 30 (37.5%) | 16 (18.2%) |
| 8 or more Rooms | 1 (1.3%) | 32 (36.4%) |
| Total | 80 (100.0%) | 88 (100.0%) |
Housing Structure by Heating Type in La Jara
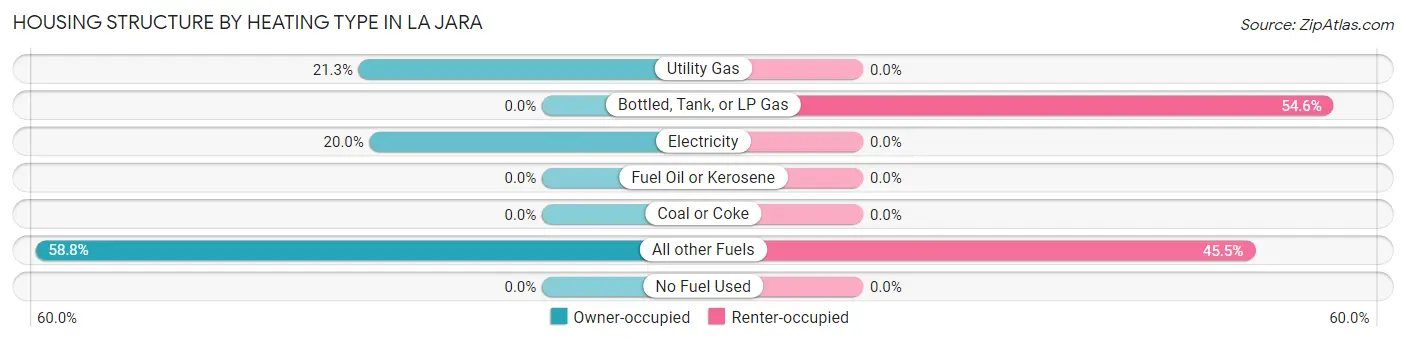
| Heating Type | Owner-occupied | Renter-occupied |
| Utility Gas | 17 (21.2%) | 0 (0.0%) |
| Bottled, Tank, or LP Gas | 0 (0.0%) | 48 (54.5%) |
| Electricity | 16 (20.0%) | 0 (0.0%) |
| Fuel Oil or Kerosene | 0 (0.0%) | 0 (0.0%) |
| Coal or Coke | 0 (0.0%) | 0 (0.0%) |
| All other Fuels | 47 (58.8%) | 40 (45.5%) |
| No Fuel Used | 0 (0.0%) | 0 (0.0%) |
| Total | 80 (100.0%) | 88 (100.0%) |
Household Vehicle Usage in La Jara
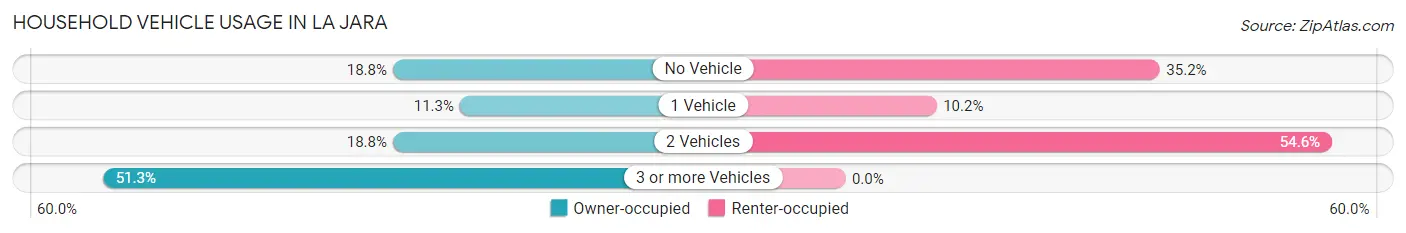
| Vehicles per Household | Owner-occupied | Renter-occupied |
| No Vehicle | 15 (18.8%) | 31 (35.2%) |
| 1 Vehicle | 9 (11.3%) | 9 (10.2%) |
| 2 Vehicles | 15 (18.8%) | 48 (54.5%) |
| 3 or more Vehicles | 41 (51.2%) | 0 (0.0%) |
| Total | 80 (100.0%) | 88 (100.0%) |
Real Estate & Mortgages in La Jara
Real Estate and Mortgage Overview in La Jara
| Characteristic | Without Mortgage | With Mortgage |
| Housing Units | 52 | 28 |
| Median Property Value | - | - |
| Median Household Income | - | - |
| Monthly Housing Costs | $314 | $0 |
| Real Estate Taxes | - | - |
Property Value by Mortgage Status in La Jara
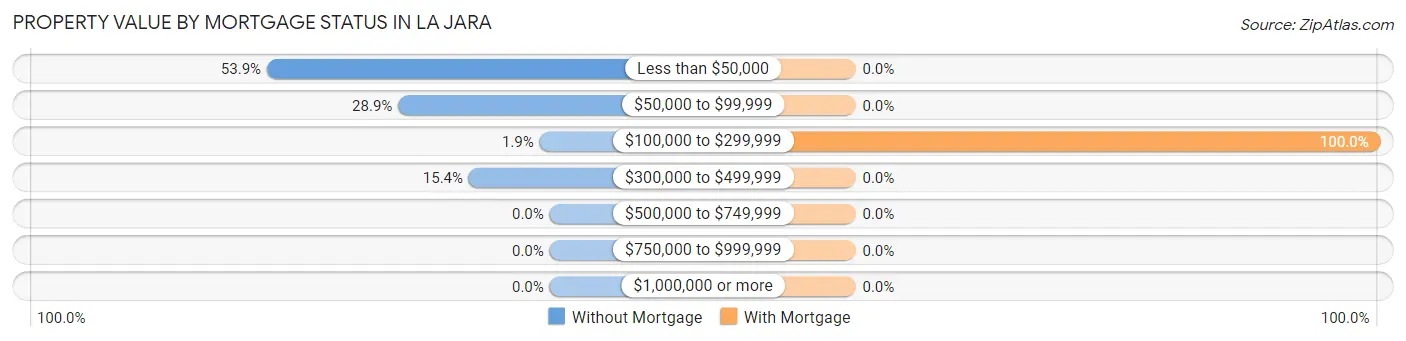
| Property Value | Without Mortgage | With Mortgage |
| Less than $50,000 | 28 (53.8%) | 0 (0.0%) |
| $50,000 to $99,999 | 15 (28.8%) | 0 (0.0%) |
| $100,000 to $299,999 | 1 (1.9%) | 28 (100.0%) |
| $300,000 to $499,999 | 8 (15.4%) | 0 (0.0%) |
| $500,000 to $749,999 | 0 (0.0%) | 0 (0.0%) |
| $750,000 to $999,999 | 0 (0.0%) | 0 (0.0%) |
| $1,000,000 or more | 0 (0.0%) | 0 (0.0%) |
| Total | 52 (100.0%) | 28 (100.0%) |
Household Income by Mortgage Status in La Jara
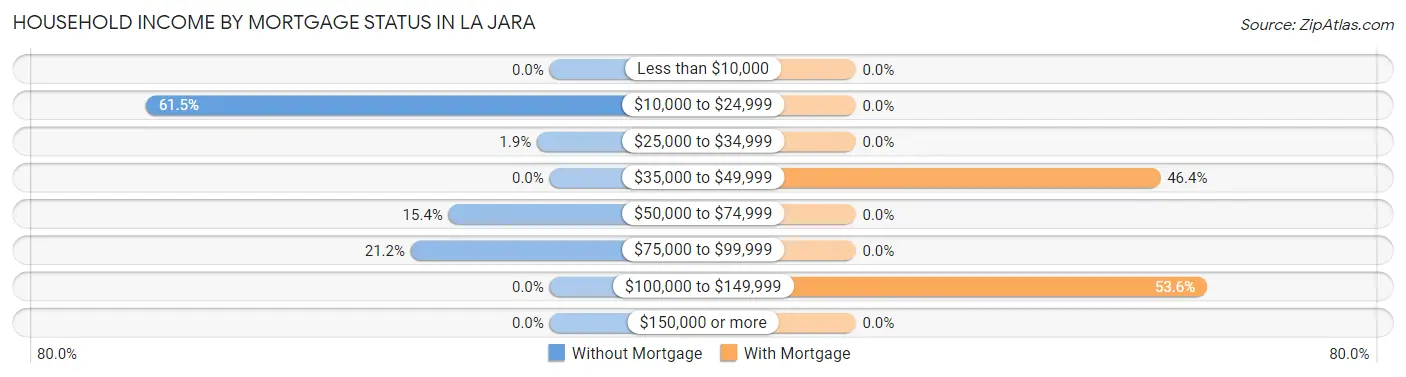
| Household Income | Without Mortgage | With Mortgage |
| Less than $10,000 | 0 (0.0%) | 0 (0.0%) |
| $10,000 to $24,999 | 32 (61.5%) | 0 (0.0%) |
| $25,000 to $34,999 | 1 (1.9%) | 0 (0.0%) |
| $35,000 to $49,999 | 0 (0.0%) | 13 (46.4%) |
| $50,000 to $74,999 | 8 (15.4%) | 0 (0.0%) |
| $75,000 to $99,999 | 11 (21.1%) | 0 (0.0%) |
| $100,000 to $149,999 | 0 (0.0%) | 15 (53.6%) |
| $150,000 or more | 0 (0.0%) | 0 (0.0%) |
| Total | 52 (100.0%) | 28 (100.0%) |
Property Value to Household Income Ratio in La Jara
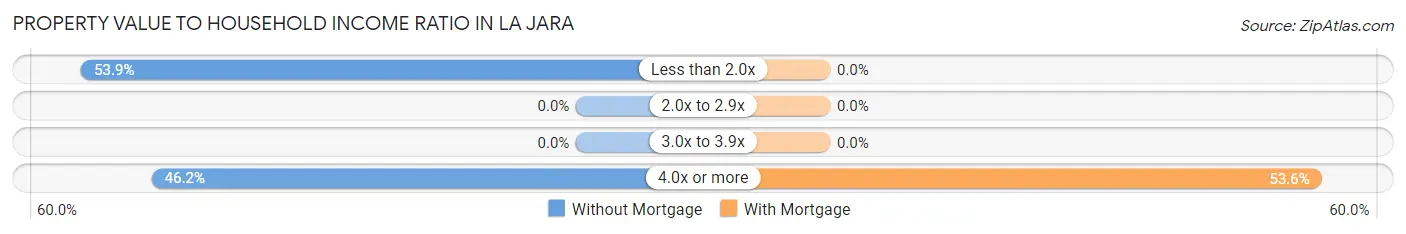
| Value-to-Income Ratio | Without Mortgage | With Mortgage |
| Less than 2.0x | 28 (53.8%) | 0 (0.0%) |
| 2.0x to 2.9x | 0 (0.0%) | 0 (0.0%) |
| 3.0x to 3.9x | 0 (0.0%) | 0 (0.0%) |
| 4.0x or more | 24 (46.2%) | 15 (53.6%) |
| Total | 52 (100.0%) | 28 (100.0%) |
Real Estate Taxes by Mortgage Status in La Jara
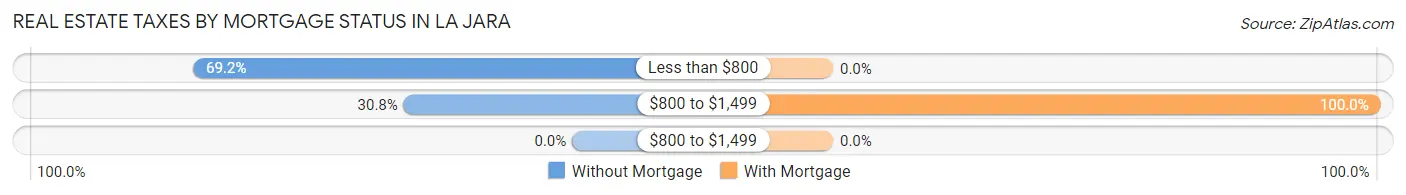
| Property Taxes | Without Mortgage | With Mortgage |
| Less than $800 | 36 (69.2%) | 0 (0.0%) |
| $800 to $1,499 | 16 (30.8%) | 28 (100.0%) |
| $800 to $1,499 | 0 (0.0%) | 0 (0.0%) |
| Total | 52 (100.0%) | 28 (100.0%) |
Health & Disability in La Jara
Health Insurance Coverage by Age in La Jara
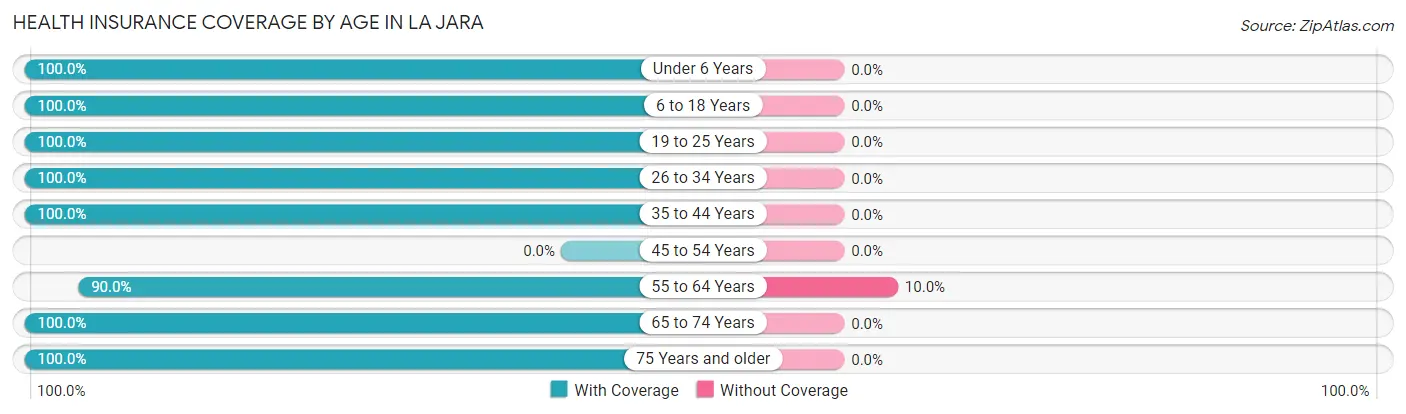
| Age Bracket | With Coverage | Without Coverage |
| Under 6 Years | 25 (100.0%) | 0 (0.0%) |
| 6 to 18 Years | 54 (100.0%) | 0 (0.0%) |
| 19 to 25 Years | 26 (100.0%) | 0 (0.0%) |
| 26 to 34 Years | 105 (100.0%) | 0 (0.0%) |
| 35 to 44 Years | 19 (100.0%) | 0 (0.0%) |
| 45 to 54 Years | 0 (0.0%) | 0 (0.0%) |
| 55 to 64 Years | 9 (90.0%) | 1 (10.0%) |
| 65 to 74 Years | 84 (100.0%) | 0 (0.0%) |
| 75 Years and older | 38 (100.0%) | 0 (0.0%) |
| Total | 360 (99.7%) | 1 (0.3%) |
Health Insurance Coverage by Citizenship Status in La Jara
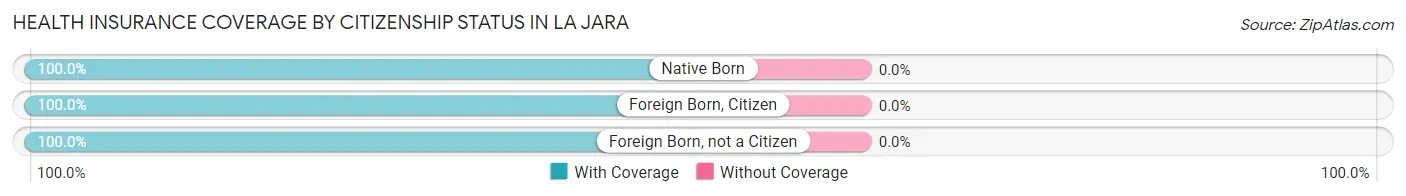
| Citizenship Status | With Coverage | Without Coverage |
| Native Born | 25 (100.0%) | 0 (0.0%) |
| Foreign Born, Citizen | 54 (100.0%) | 0 (0.0%) |
| Foreign Born, not a Citizen | 26 (100.0%) | 0 (0.0%) |
Health Insurance Coverage by Household Income in La Jara
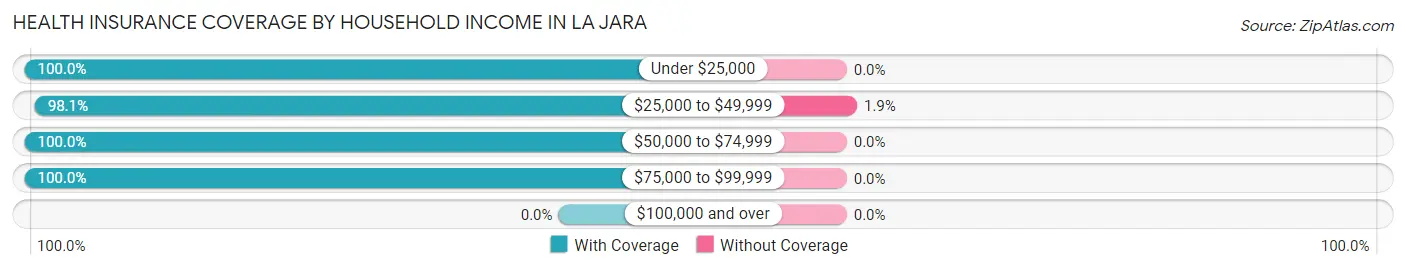
| Household Income | With Coverage | Without Coverage |
| Under $25,000 | 159 (100.0%) | 0 (0.0%) |
| $25,000 to $49,999 | 51 (98.1%) | 1 (1.9%) |
| $50,000 to $74,999 | 8 (100.0%) | 0 (0.0%) |
| $75,000 to $99,999 | 142 (100.0%) | 0 (0.0%) |
| $100,000 and over | 0 (0.0%) | 0 (0.0%) |
Public vs Private Health Insurance Coverage by Age in La Jara
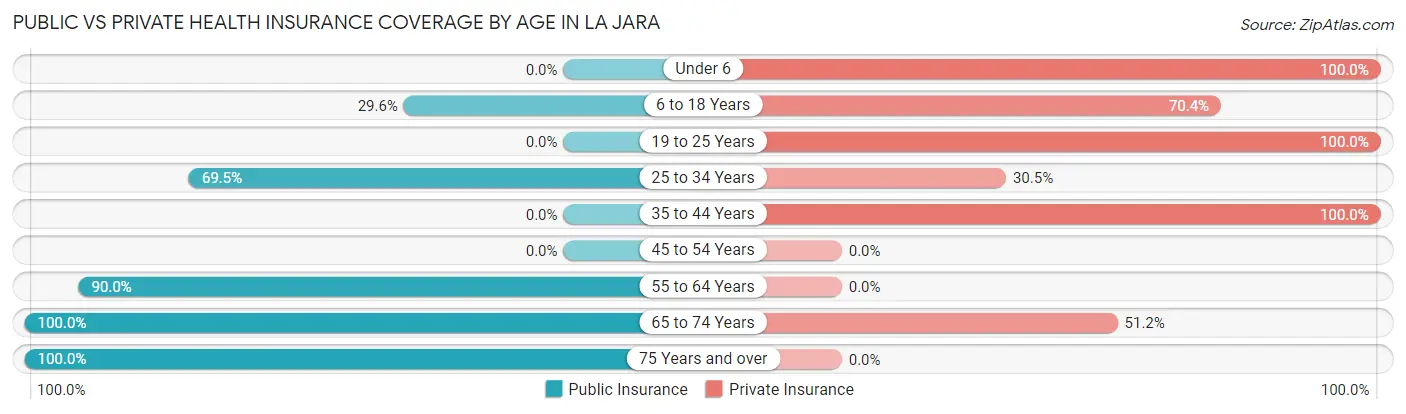
| Age Bracket | Public Insurance | Private Insurance |
| Under 6 | 0 (0.0%) | 25 (100.0%) |
| 6 to 18 Years | 16 (29.6%) | 38 (70.4%) |
| 19 to 25 Years | 0 (0.0%) | 26 (100.0%) |
| 25 to 34 Years | 73 (69.5%) | 32 (30.5%) |
| 35 to 44 Years | 0 (0.0%) | 19 (100.0%) |
| 45 to 54 Years | 0 (0.0%) | 0 (0.0%) |
| 55 to 64 Years | 9 (90.0%) | 0 (0.0%) |
| 65 to 74 Years | 84 (100.0%) | 43 (51.2%) |
| 75 Years and over | 38 (100.0%) | 0 (0.0%) |
| Total | 220 (60.9%) | 183 (50.7%) |
Disability Status by Sex by Age in La Jara
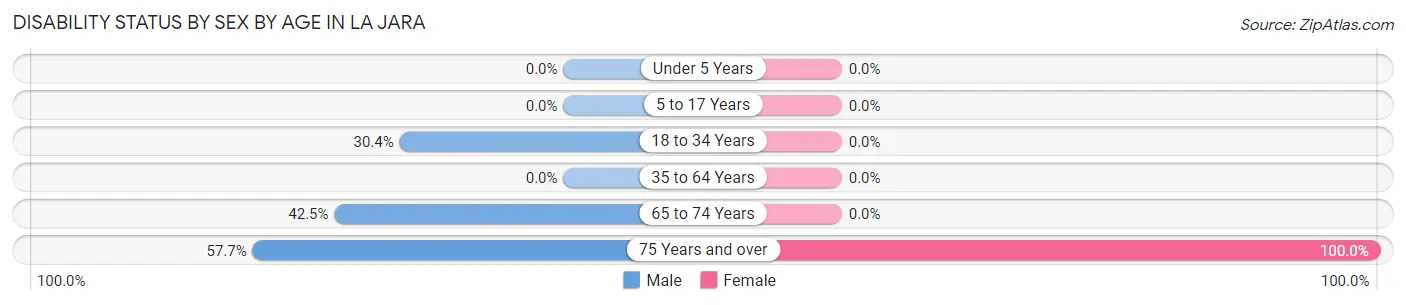
| Age Bracket | Male | Female |
| Under 5 Years | 0 (0.0%) | 0 (0.0%) |
| 5 to 17 Years | 0 (0.0%) | 0 (0.0%) |
| 18 to 34 Years | 31 (30.4%) | 0 (0.0%) |
| 35 to 64 Years | 0 (0.0%) | 0 (0.0%) |
| 65 to 74 Years | 17 (42.5%) | 0 (0.0%) |
| 75 Years and over | 15 (57.7%) | 12 (100.0%) |
Disability Class by Sex by Age in La Jara
Disability Class: Hearing Difficulty
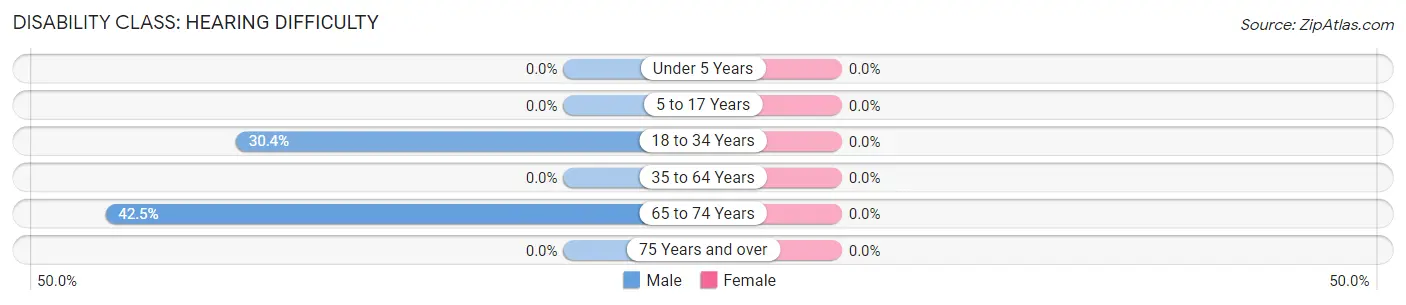
| Age Bracket | Male | Female |
| Under 5 Years | 0 (0.0%) | 0 (0.0%) |
| 5 to 17 Years | 0 (0.0%) | 0 (0.0%) |
| 18 to 34 Years | 31 (30.4%) | 0 (0.0%) |
| 35 to 64 Years | 0 (0.0%) | 0 (0.0%) |
| 65 to 74 Years | 17 (42.5%) | 0 (0.0%) |
| 75 Years and over | 0 (0.0%) | 0 (0.0%) |
Disability Class: Vision Difficulty
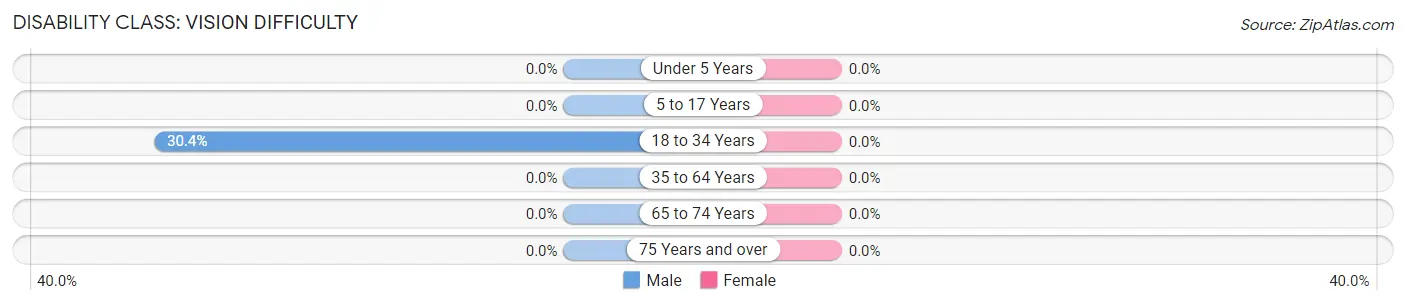
| Age Bracket | Male | Female |
| Under 5 Years | 0 (0.0%) | 0 (0.0%) |
| 5 to 17 Years | 0 (0.0%) | 0 (0.0%) |
| 18 to 34 Years | 31 (30.4%) | 0 (0.0%) |
| 35 to 64 Years | 0 (0.0%) | 0 (0.0%) |
| 65 to 74 Years | 0 (0.0%) | 0 (0.0%) |
| 75 Years and over | 0 (0.0%) | 0 (0.0%) |
Disability Class: Cognitive Difficulty
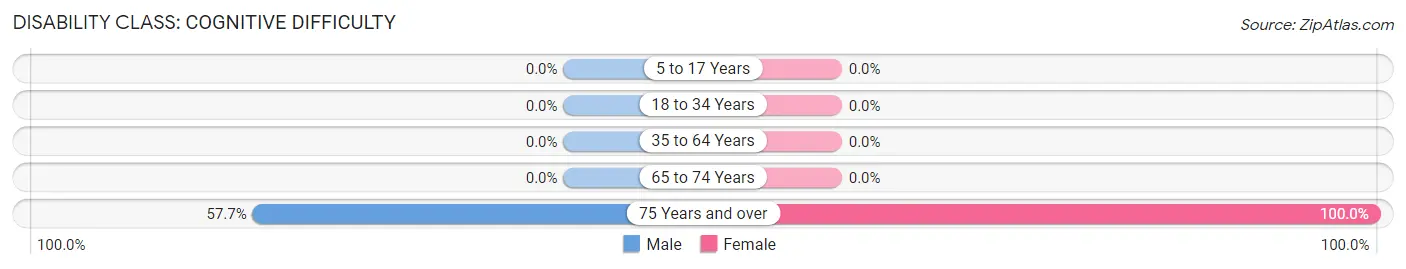
| Age Bracket | Male | Female |
| 5 to 17 Years | 0 (0.0%) | 0 (0.0%) |
| 18 to 34 Years | 0 (0.0%) | 0 (0.0%) |
| 35 to 64 Years | 0 (0.0%) | 0 (0.0%) |
| 65 to 74 Years | 0 (0.0%) | 0 (0.0%) |
| 75 Years and over | 15 (57.7%) | 12 (100.0%) |
Disability Class: Ambulatory Difficulty
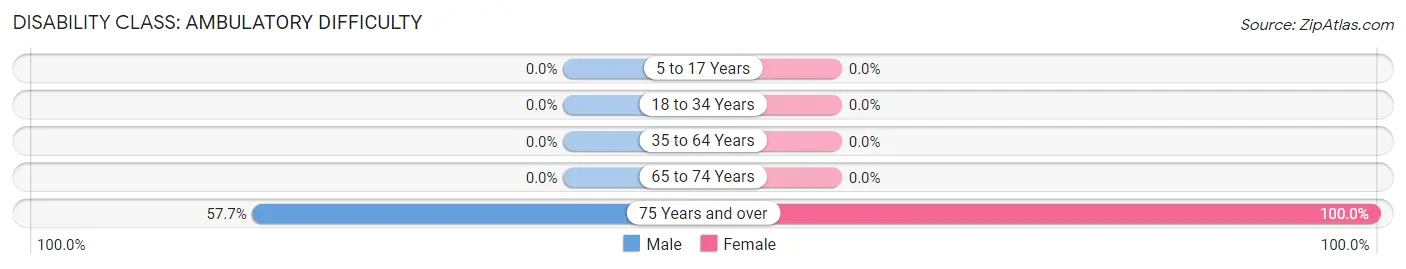
| Age Bracket | Male | Female |
| 5 to 17 Years | 0 (0.0%) | 0 (0.0%) |
| 18 to 34 Years | 0 (0.0%) | 0 (0.0%) |
| 35 to 64 Years | 0 (0.0%) | 0 (0.0%) |
| 65 to 74 Years | 0 (0.0%) | 0 (0.0%) |
| 75 Years and over | 15 (57.7%) | 12 (100.0%) |
Disability Class: Self-Care Difficulty
| Age Bracket | Male | Female |
| 5 to 17 Years | 0 (0.0%) | 0 (0.0%) |
| 18 to 34 Years | 0 (0.0%) | 0 (0.0%) |
| 35 to 64 Years | 0 (0.0%) | 0 (0.0%) |
| 65 to 74 Years | 0 (0.0%) | 0 (0.0%) |
| 75 Years and over | 0 (0.0%) | 0 (0.0%) |
Technology Access in La Jara
Computing Device Access in La Jara
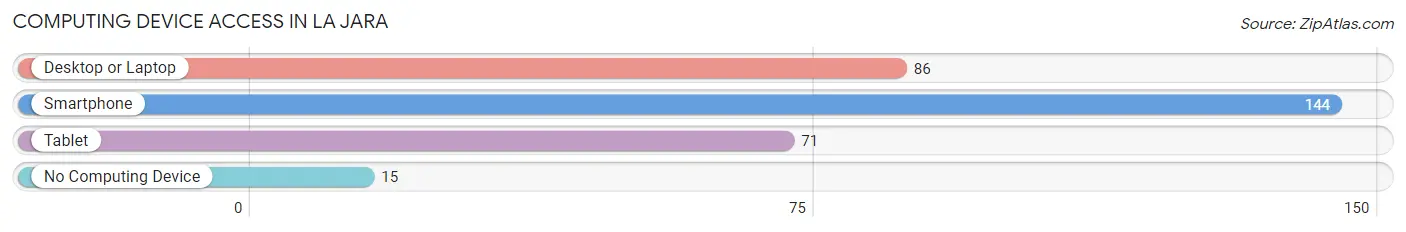
| Device Type | # Households | % Households |
| Desktop or Laptop | 86 | 51.2% |
| Smartphone | 144 | 85.7% |
| Tablet | 71 | 42.3% |
| No Computing Device | 15 | 8.9% |
| Total | 168 | 100.0% |
Internet Access in La Jara
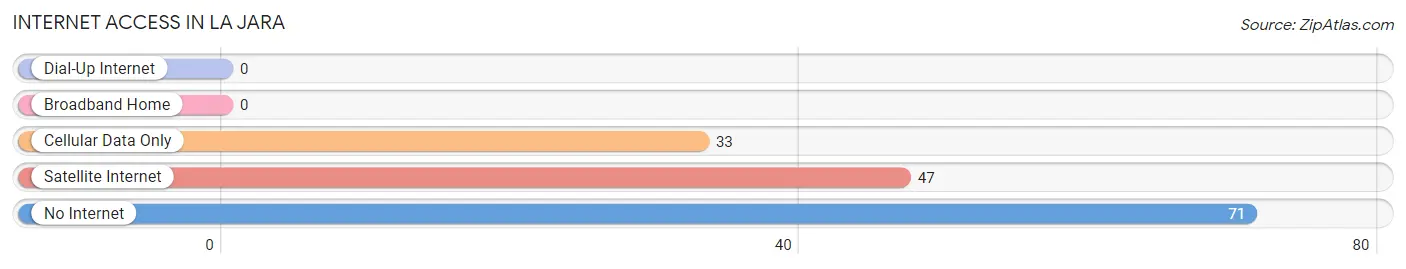
| Internet Type | # Households | % Households |
| Dial-Up Internet | 0 | 0.0% |
| Broadband Home | 0 | 0.0% |
| Cellular Data Only | 33 | 19.6% |
| Satellite Internet | 47 | 28.0% |
| No Internet | 71 | 42.3% |
| Total | 168 | 100.0% |
La Jara Summary
La Jara, New Mexico is a small town located in the northern part of the state, in the San Juan Basin. It is situated in the foothills of the Sangre de Cristo Mountains, and is surrounded by the Chama River Valley. The town was founded in 1876, and is the oldest settlement in the area.
Geography
La Jara is located in the northern part of New Mexico, in the San Juan Basin. It is situated in the foothills of the Sangre de Cristo Mountains, and is surrounded by the Chama River Valley. The town is located at an elevation of 6,000 feet, and has a total area of 0.7 square miles. The climate is semi-arid, with hot summers and cold winters.
Economy
The economy of La Jara is largely based on agriculture and tourism. The town is home to several farms, which produce a variety of crops, including alfalfa, corn, wheat, and hay. The town also has a number of small businesses, including restaurants, shops, and a gas station. Tourism is also an important part of the local economy, with visitors coming to the area to enjoy the natural beauty of the Sangre de Cristo Mountains.
Demographics
As of the 2010 census, La Jara had a population of 1,072. The racial makeup of the town was 75.3% White, 0.7% African American, 0.9% Native American, 0.2% Asian, 0.1% Pacific Islander, and 21.7% from other races. The median household income was $25,938, and the median family income was $30,625.
History
La Jara was founded in 1876 by a group of settlers from the nearby town of Chama. The town was named after the nearby La Jara Creek, which was named after the Spanish word for “hollow”. The town quickly grew, and by the early 1900s it had become a thriving agricultural center. The town was also home to several businesses, including a hotel, a general store, and a post office.
In the early 20th century, La Jara was a popular destination for tourists, who came to enjoy the natural beauty of the Sangre de Cristo Mountains. The town also became a popular stop for travelers on the Santa Fe Trail. In the 1950s, the town began to decline, as many of its residents moved away in search of better economic opportunities.
Today, La Jara is a small, quiet town. It is still home to several farms, and is a popular destination for tourists who come to enjoy the natural beauty of the area. The town is also home to a number of small businesses, including restaurants, shops, and a gas station.
Common Questions
What is Per Capita Income in La Jara?
Per Capita income in La Jara is $16,521.
What is Inequality or Gini Index in La Jara?
Inequality or Gini Index in La Jara is 0.50.
What is the Total Population of La Jara?
Total Population of La Jara is 361.
What is the Total Male Population of La Jara?
Total Male Population of La Jara is 227.
What is the Total Female Population of La Jara?
Total Female Population of La Jara is 134.
What is the Ratio of Males per 100 Females in La Jara?
There are 169.40 Males per 100 Females in La Jara.
What is the Ratio of Females per 100 Males in La Jara?
There are 59.03 Females per 100 Males in La Jara.
What is the Median Population Age in La Jara?
Median Population Age in La Jara is 32.6 Years.
What is the Average Family Size in La Jara
Average Family Size in La Jara is 2.7 People.
What is the Average Household Size in La Jara
Average Household Size in La Jara is 2.1 People.
How Large is the Labor Force in La Jara?
There are 74 People in the Labor Forcein in La Jara.
What is the Percentage of People in the Labor Force in La Jara?
26.2% of People are in the Labor Force in La Jara.
What is the Unemployment Rate in La Jara?
Unemployment Rate in La Jara is 12.2%.