Zip Codes with the Highest Percentage of Families with Income Below $10,000 in Rio Rancho, NM
RELATED REPORTS & OPTIONS
Family Income | $0-10k
Rio Rancho
Compare Zip Codes
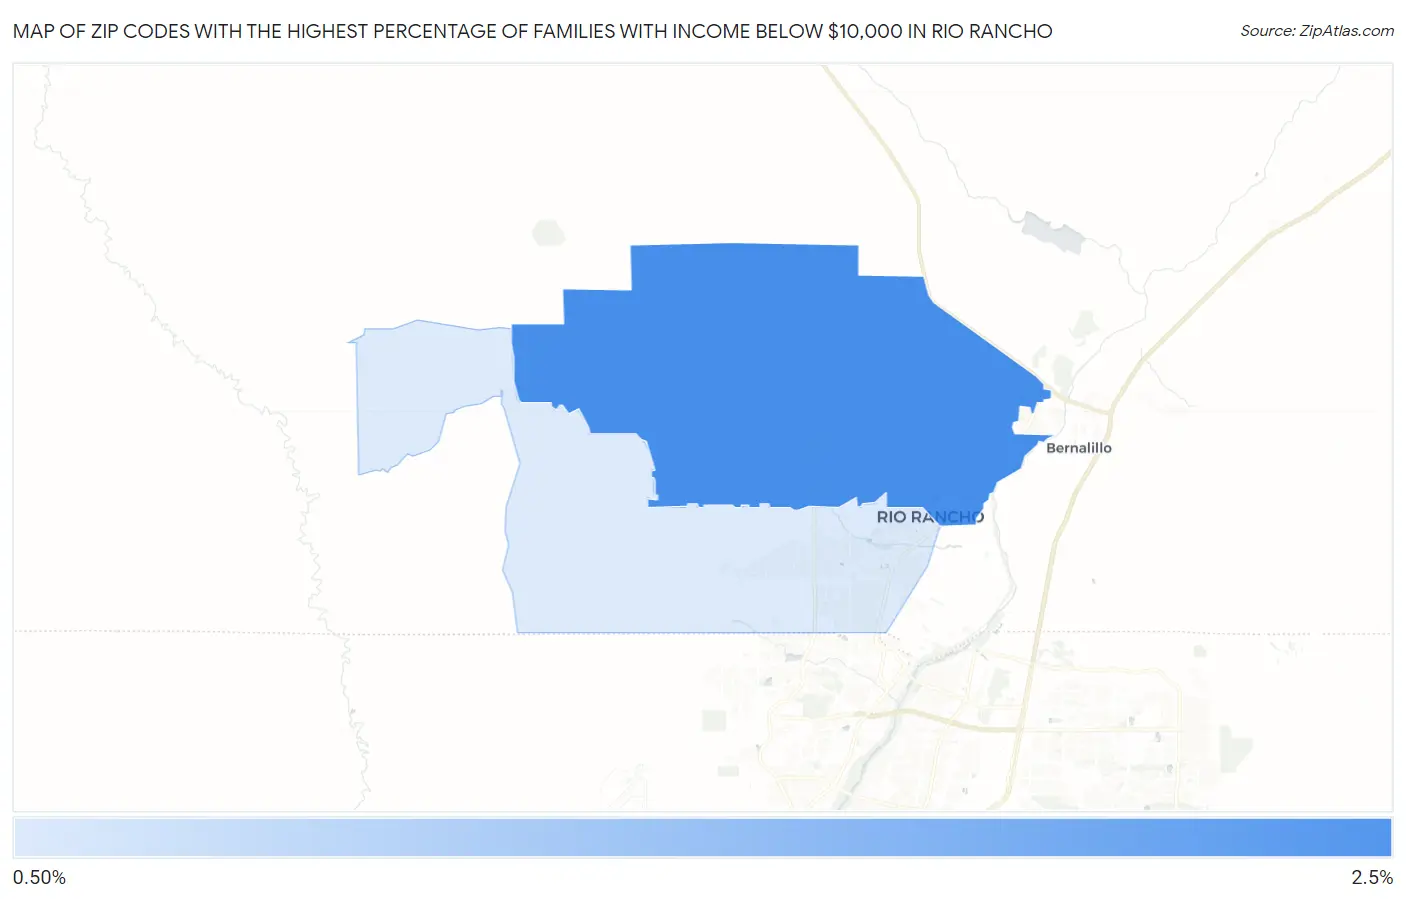
Map of Zip Codes with the Highest Percentage of Families with Income Below $10,000 in Rio Rancho
1.0%
2.3%
Zip Codes with the Highest Percentage of Families with Income Below $10,000 in Rio Rancho, NM
| Zip Code | Families with Income < $10k | vs State | vs National | |
| 1. | 87144 | 2.3% | 4.6%(-2.30)#155 | 3.1%(-0.800)#13,883 |
| 2. | 87124 | 1.0% | 4.6%(-3.60)#168 | 3.1%(-2.10)#20,187 |
1
Common Questions
What are the Top Zip Codes with the Highest Percentage of Families with Income Below $10,000 in Rio Rancho, NM?
Top Zip Codes with the Highest Percentage of Families with Income Below $10,000 in Rio Rancho, NM are:
What zip code has the Highest Percentage of Families with Income Below $10,000 in Rio Rancho, NM?
87144 has the Highest Percentage of Families with Income Below $10,000 in Rio Rancho, NM with 2.3%.
What is the Percentage of Families with Income Below $10,000 in Rio Rancho, NM?
Percentage of Families with Income Below $10,000 in Rio Rancho is 1.6%.
What is the Percentage of Families with Income Below $10,000 in New Mexico?
Percentage of Families with Income Below $10,000 in New Mexico is 4.6%.
What is the Percentage of Families with Income Below $10,000 in the United States?
Percentage of Families with Income Below $10,000 in the United States is 3.1%.