Zip Codes with the Highest Percentage of Population Employed in Installation, Maintenance & Repair in Santa Fe, NM
RELATED REPORTS & OPTIONS
Installation, Maintenance & Repair
Santa Fe
Compare Zip Codes
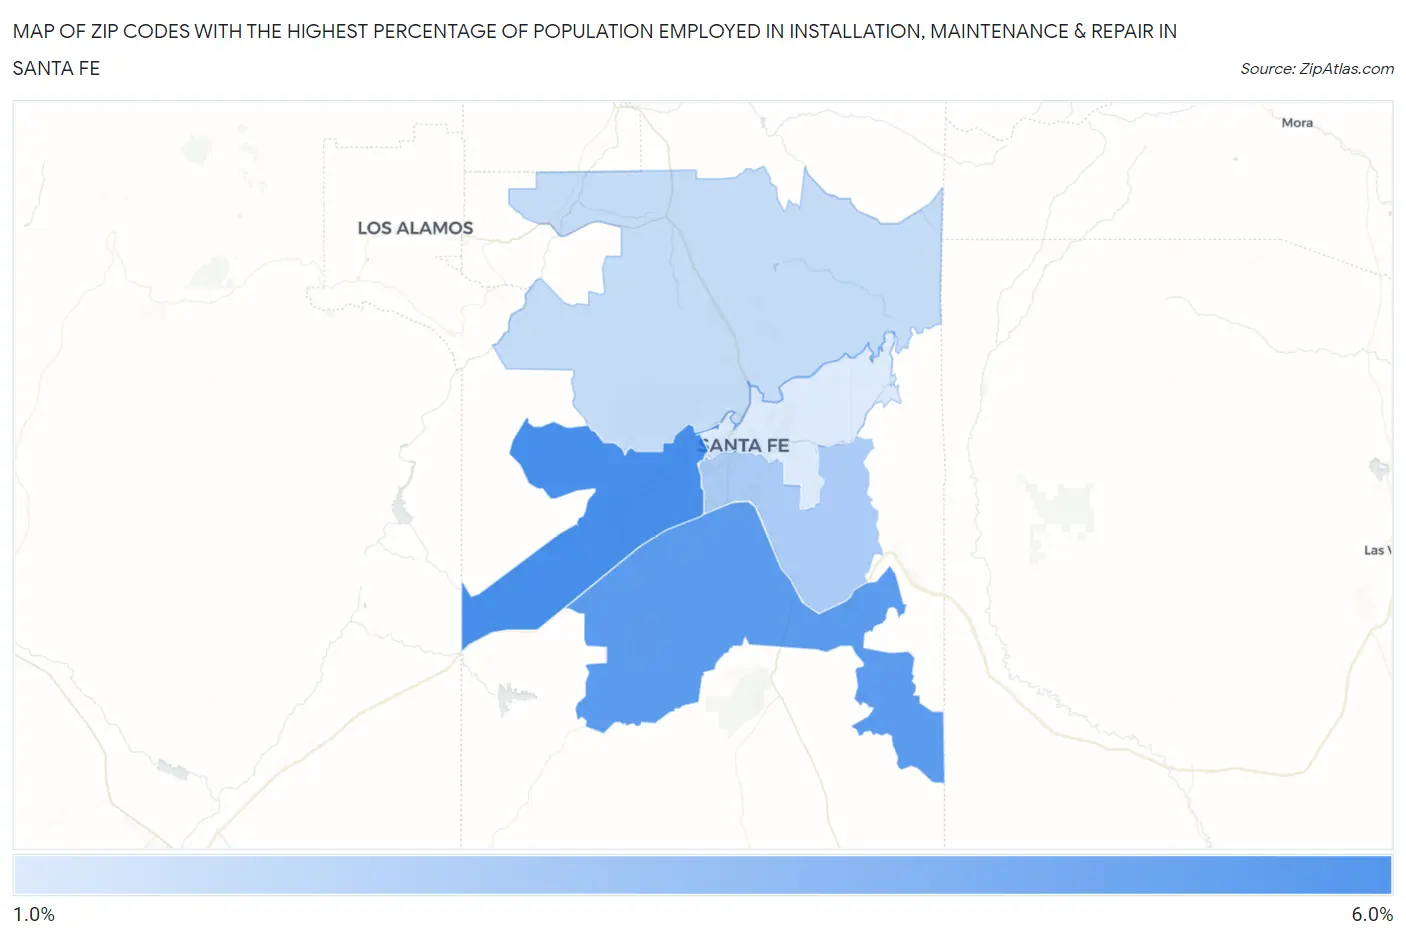
Map of Zip Codes with the Highest Percentage of Population Employed in Installation, Maintenance & Repair in Santa Fe
1.4%
5.0%
Zip Codes with the Highest Percentage of Population Employed in Installation, Maintenance & Repair in Santa Fe, NM
| Zip Code | % Employed | vs State | vs National | |
| 1. | 87507 | 5.0% | 3.7%(+1.32)#72 | 3.1%(+1.94)#8,690 |
| 2. | 87508 | 4.5% | 3.7%(+0.858)#90 | 3.1%(+1.48)#10,236 |
| 3. | 87505 | 2.7% | 3.7%(-1.03)#133 | 3.1%(-0.410)#18,775 |
| 4. | 87506 | 2.0% | 3.7%(-1.73)#157 | 3.1%(-1.10)#22,183 |
| 5. | 87501 | 1.4% | 3.7%(-2.26)#176 | 3.1%(-1.63)#24,420 |
1
Common Questions
What are the Top 3 Zip Codes with the Highest Percentage of Population Employed in Installation, Maintenance & Repair in Santa Fe, NM?
Top 3 Zip Codes with the Highest Percentage of Population Employed in Installation, Maintenance & Repair in Santa Fe, NM are:
What zip code has the Highest Percentage of Population Employed in Installation, Maintenance & Repair in Santa Fe, NM?
87507 has the Highest Percentage of Population Employed in Installation, Maintenance & Repair in Santa Fe, NM with 5.0%.
What is the Percentage of Population Employed in Installation, Maintenance & Repair in Santa Fe, NM?
Percentage of Population Employed in Installation, Maintenance & Repair in Santa Fe is 3.7%.
What is the Percentage of Population Employed in Installation, Maintenance & Repair in New Mexico?
Percentage of Population Employed in Installation, Maintenance & Repair in New Mexico is 3.7%.
What is the Percentage of Population Employed in Installation, Maintenance & Repair in the United States?
Percentage of Population Employed in Installation, Maintenance & Repair in the United States is 3.1%.