Zip Codes with the Highest Percentage of Population Employed in Health Diagnosing & Treating in Santa Fe, NM
RELATED REPORTS & OPTIONS
Health Diagnosing & Treating
Santa Fe
Compare Zip Codes
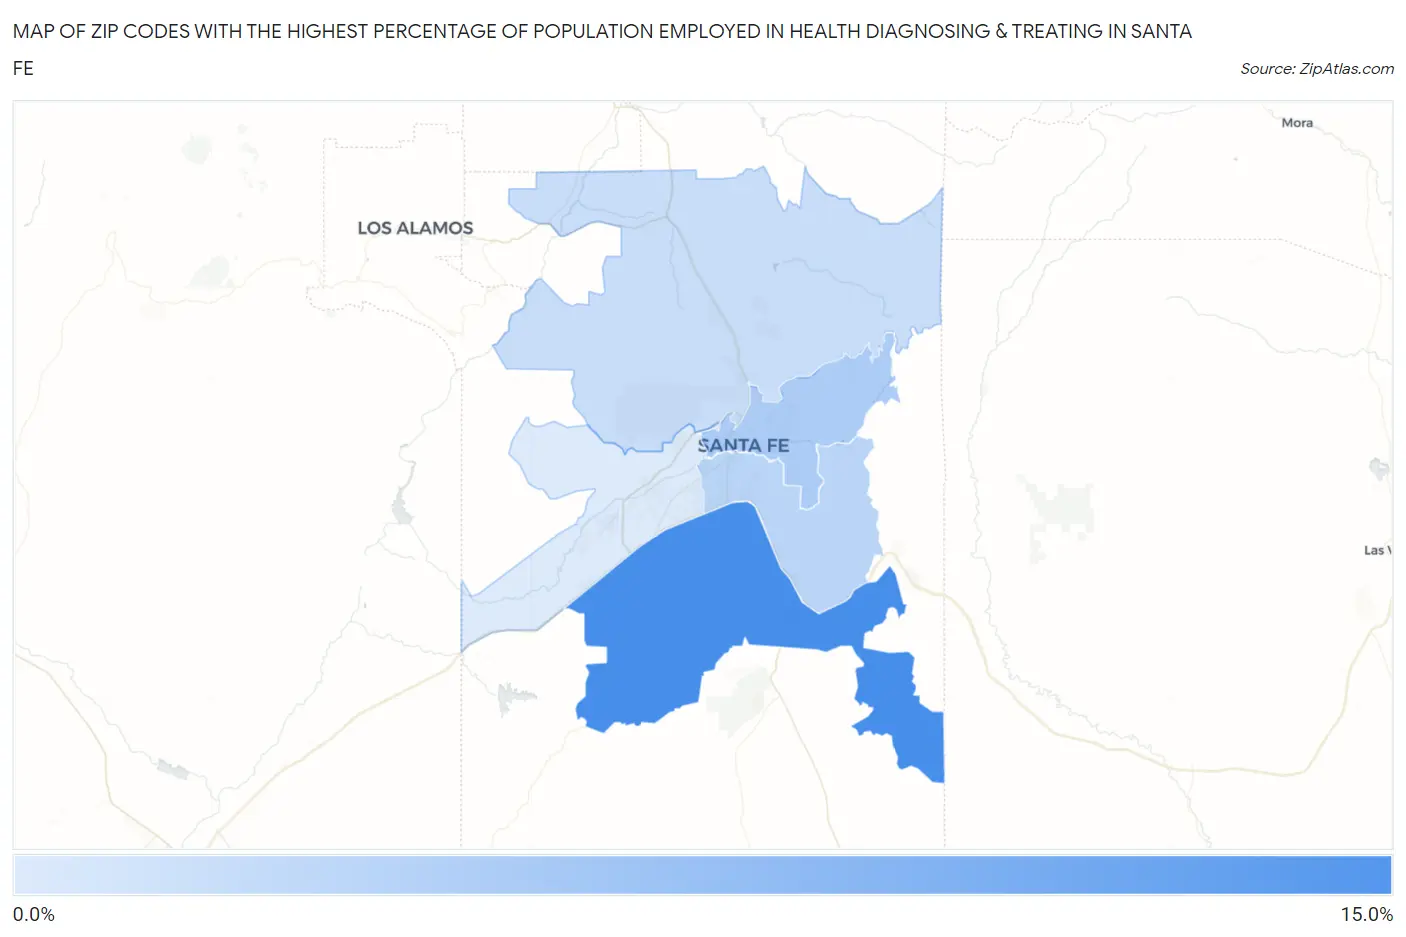
Map of Zip Codes with the Highest Percentage of Population Employed in Health Diagnosing & Treating in Santa Fe
4.1%
10.0%
Zip Codes with the Highest Percentage of Population Employed in Health Diagnosing & Treating in Santa Fe, NM
| Zip Code | % Employed | vs State | vs National | |
| 1. | 87508 | 10.0% | 5.9%(+4.08)#31 | 6.2%(+3.77)#3,863 |
| 2. | 87501 | 6.0% | 5.9%(+0.013)#86 | 6.2%(-0.291)#14,036 |
| 3. | 87505 | 5.4% | 5.9%(-0.523)#91 | 6.2%(-0.828)#16,108 |
| 4. | 87506 | 4.9% | 5.9%(-1.06)#102 | 6.2%(-1.37)#18,192 |
| 5. | 87507 | 4.1% | 5.9%(-1.82)#121 | 6.2%(-2.12)#20,989 |
1
Common Questions
What are the Top 3 Zip Codes with the Highest Percentage of Population Employed in Health Diagnosing & Treating in Santa Fe, NM?
Top 3 Zip Codes with the Highest Percentage of Population Employed in Health Diagnosing & Treating in Santa Fe, NM are:
What zip code has the Highest Percentage of Population Employed in Health Diagnosing & Treating in Santa Fe, NM?
87508 has the Highest Percentage of Population Employed in Health Diagnosing & Treating in Santa Fe, NM with 10.0%.
What is the Percentage of Population Employed in Health Diagnosing & Treating in Santa Fe, NM?
Percentage of Population Employed in Health Diagnosing & Treating in Santa Fe is 5.0%.
What is the Percentage of Population Employed in Health Diagnosing & Treating in New Mexico?
Percentage of Population Employed in Health Diagnosing & Treating in New Mexico is 5.9%.
What is the Percentage of Population Employed in Health Diagnosing & Treating in the United States?
Percentage of Population Employed in Health Diagnosing & Treating in the United States is 6.2%.