Bell Arthur, NC Map & Demographics
Bell Arthur Map
Bell Arthur Overview
$21,113
PER CAPITA INCOME
0.29
INEQUALITY / GINI INDEX
491
TOTAL POPULATION
249
MALE POPULATION
242
FEMALE POPULATION
102.89
MALES / 100 FEMALES
97.19
FEMALES / 100 MALES
29.1
MEDIAN AGE
3.3
AVG FAMILY SIZE
2.8
AVG HOUSEHOLD SIZE
257
LABOR FORCE [ PEOPLE ]
73.6%
PERCENT IN LABOR FORCE
16.3%
UNEMPLOYMENT RATE
Income in Bell Arthur
Income Overview in Bell Arthur
| Characteristic | Number | Measure |
| Per Capita Income | 491 | $21,113 |
| Median Family Income | 132 | $0 |
| Mean Family Income | 132 | $59,498 |
| Median Household Income | 174 | $0 |
| Mean Household Income | 174 | $64,111 |
| Income Deficit | 132 | $0 |
| Wage / Income Gap (%) | 491 | 0.00% |
| Wage / Income Gap ($) | 491 | 100.00¢ per $1 |
| Gini / Inequality Index | 491 | 0.29 |
Earnings by Sex in Bell Arthur
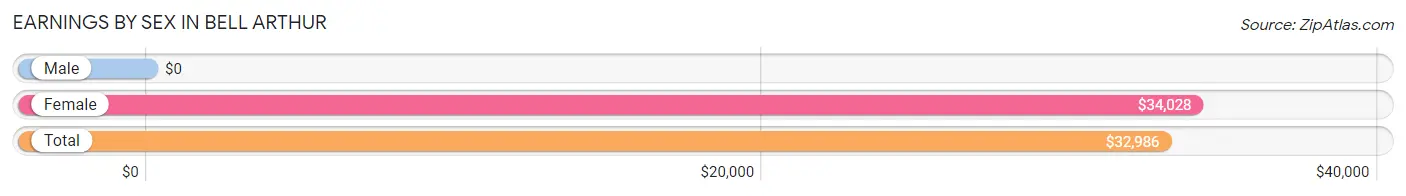
| Sex | Number | Average Earnings |
| Male | 151 (58.8%) | $0 |
| Female | 106 (41.2%) | $34,028 |
| Total | 257 (100.0%) | $32,986 |
Earnings by Sex by Income Bracket in Bell Arthur
The most common earnings brackets in Bell Arthur are $55,000 to $64,999 for men (50 | 33.1%) and $20,000 to $22,499 for women (42 | 39.6%).
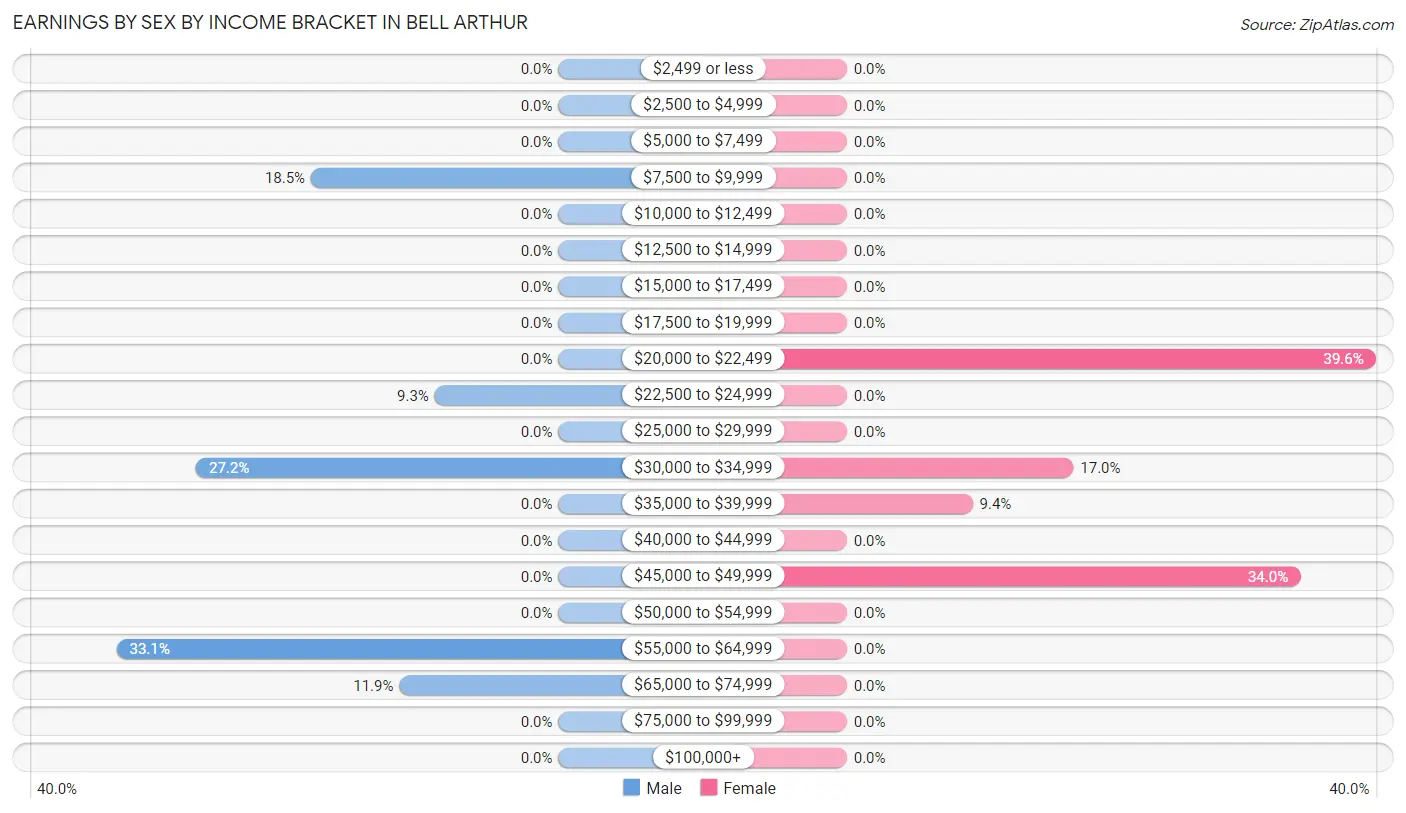
| Income | Male | Female |
| $2,499 or less | 0 (0.0%) | 0 (0.0%) |
| $2,500 to $4,999 | 0 (0.0%) | 0 (0.0%) |
| $5,000 to $7,499 | 0 (0.0%) | 0 (0.0%) |
| $7,500 to $9,999 | 28 (18.5%) | 0 (0.0%) |
| $10,000 to $12,499 | 0 (0.0%) | 0 (0.0%) |
| $12,500 to $14,999 | 0 (0.0%) | 0 (0.0%) |
| $15,000 to $17,499 | 0 (0.0%) | 0 (0.0%) |
| $17,500 to $19,999 | 0 (0.0%) | 0 (0.0%) |
| $20,000 to $22,499 | 0 (0.0%) | 42 (39.6%) |
| $22,500 to $24,999 | 14 (9.3%) | 0 (0.0%) |
| $25,000 to $29,999 | 0 (0.0%) | 0 (0.0%) |
| $30,000 to $34,999 | 41 (27.2%) | 18 (17.0%) |
| $35,000 to $39,999 | 0 (0.0%) | 10 (9.4%) |
| $40,000 to $44,999 | 0 (0.0%) | 0 (0.0%) |
| $45,000 to $49,999 | 0 (0.0%) | 36 (34.0%) |
| $50,000 to $54,999 | 0 (0.0%) | 0 (0.0%) |
| $55,000 to $64,999 | 50 (33.1%) | 0 (0.0%) |
| $65,000 to $74,999 | 18 (11.9%) | 0 (0.0%) |
| $75,000 to $99,999 | 0 (0.0%) | 0 (0.0%) |
| $100,000+ | 0 (0.0%) | 0 (0.0%) |
| Total | 151 (100.0%) | 106 (100.0%) |
Earnings by Sex by Educational Attainment in Bell Arthur
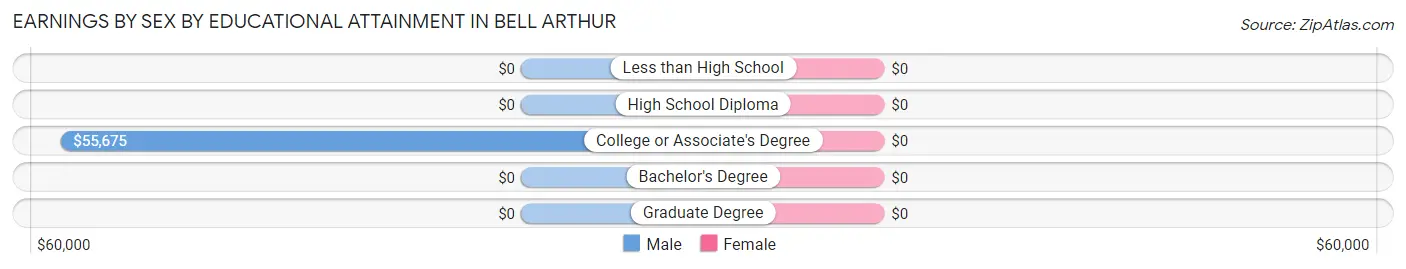
| Educational Attainment | Male Income | Female Income |
| Less than High School | - | - |
| High School Diploma | - | - |
| College or Associate's Degree | $55,675 | $0 |
| Bachelor's Degree | - | - |
| Graduate Degree | - | - |
| Total | $55,325 | $34,028 |
Family Income in Bell Arthur
Family Income Brackets in Bell Arthur
According to the Bell Arthur family income data, there are 82 families falling into the $25,000 to $34,999 income range, which is the most common income bracket and makes up 62.1% of all families.
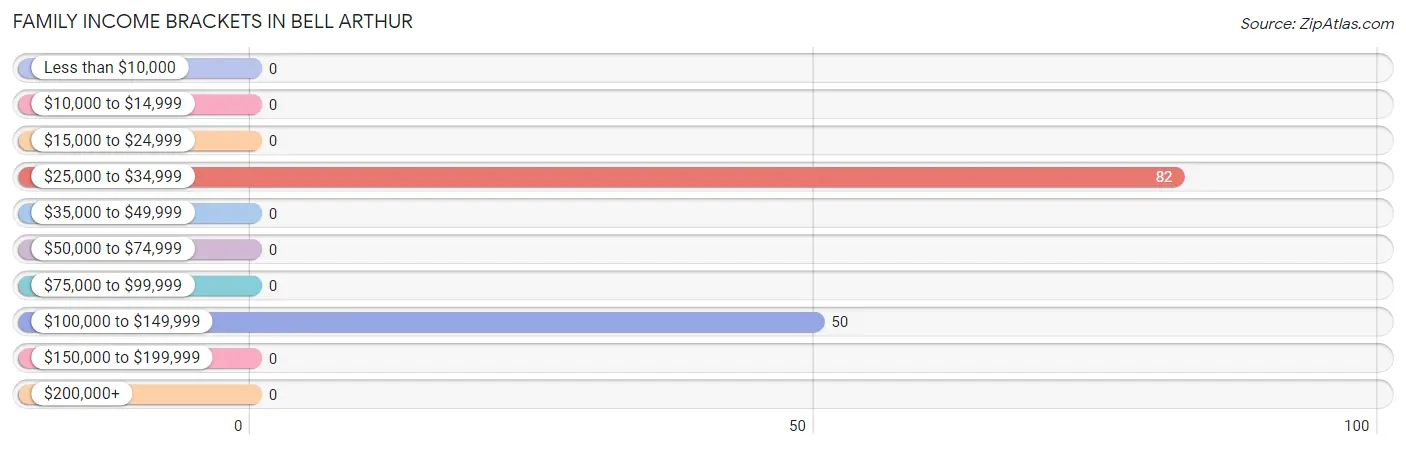
| Income Bracket | # Families | % Families |
| Less than $10,000 | 0 | 0.0% |
| $10,000 to $14,999 | 0 | 0.0% |
| $15,000 to $24,999 | 0 | 0.0% |
| $25,000 to $34,999 | 82 | 62.1% |
| $35,000 to $49,999 | 0 | 0.0% |
| $50,000 to $74,999 | 0 | 0.0% |
| $75,000 to $99,999 | 0 | 0.0% |
| $100,000 to $149,999 | 50 | 37.9% |
| $150,000 to $199,999 | 0 | 0.0% |
| $200,000+ | 0 | 0.0% |
Family Income by Famaliy Size in Bell Arthur
| Income Bracket | # Families | Median Income |
| 2-Person Families | 0 (0.0%) | $0 |
| 3-Person Families | 90 (68.2%) | $0 |
| 4-Person Families | 42 (31.8%) | $0 |
| 5-Person Families | 0 (0.0%) | $0 |
| 6-Person Families | 0 (0.0%) | $0 |
| 7+ Person Families | 0 (0.0%) | $0 |
| Total | 132 (100.0%) | $0 |
Family Income by Number of Earners in Bell Arthur
| Number of Earners | # Families | Median Income |
| No Earners | 0 (0.0%) | $0 |
| 1 Earner | 40 (30.3%) | $0 |
| 2 Earners | 92 (69.7%) | $0 |
| 3+ Earners | 0 (0.0%) | $0 |
| Total | 132 (100.0%) | $0 |
Household Income in Bell Arthur
Household Income Brackets in Bell Arthur
With 82 households falling in the category, the $25,000 to $34,999 income range is the most frequent in Bell Arthur, accounting for 47.1% of all households.
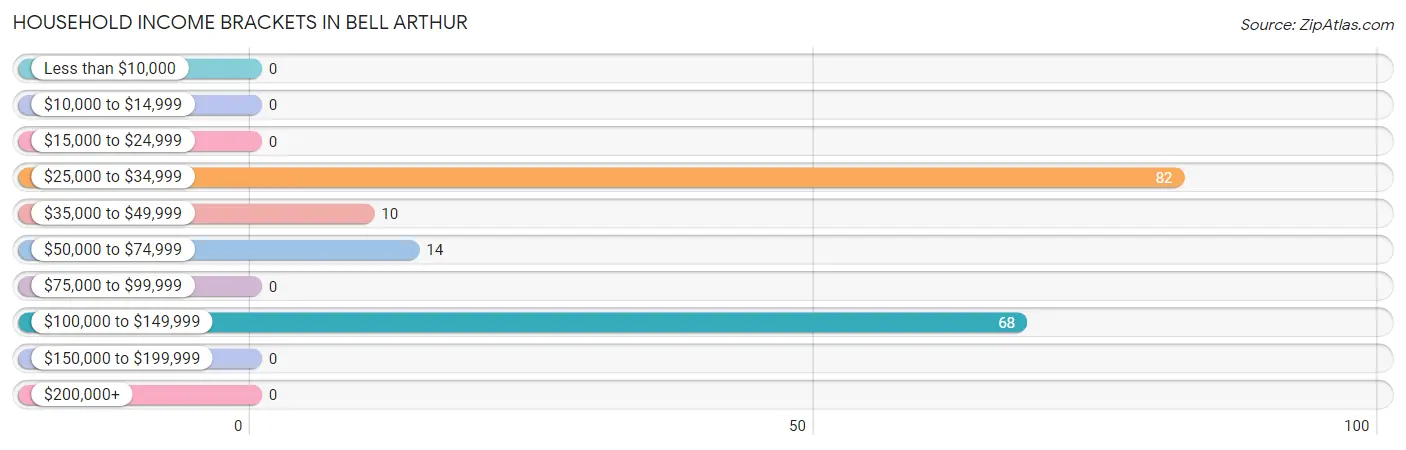
| Income Bracket | # Households | % Households |
| Less than $10,000 | 0 | 0.0% |
| $10,000 to $14,999 | 0 | 0.0% |
| $15,000 to $24,999 | 0 | 0.0% |
| $25,000 to $34,999 | 82 | 47.1% |
| $35,000 to $49,999 | 10 | 5.7% |
| $50,000 to $74,999 | 14 | 8.0% |
| $75,000 to $99,999 | 0 | 0.0% |
| $100,000 to $149,999 | 68 | 39.1% |
| $150,000 to $199,999 | 0 | 0.0% |
| $200,000+ | 0 | 0.0% |
Household Income by Householder Age in Bell Arthur
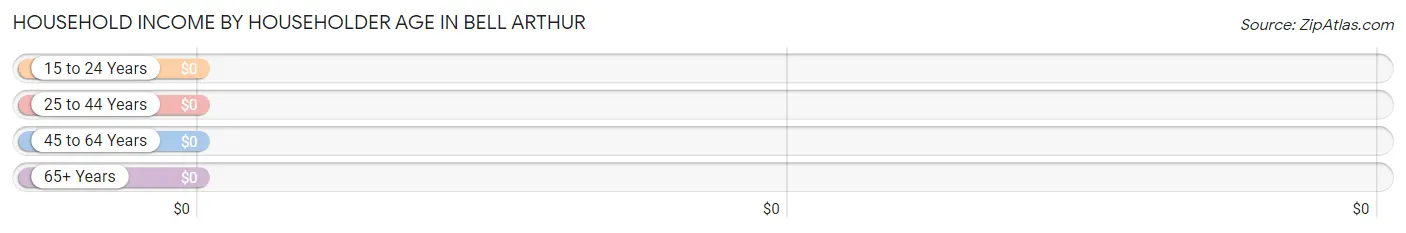
| Income Bracket | # Households | Median Income |
| 15 to 24 Years | 0 (0.0%) | $0 |
| 25 to 44 Years | 118 (67.8%) | $0 |
| 45 to 64 Years | 42 (24.1%) | $0 |
| 65+ Years | 14 (8.1%) | $0 |
| Total | 174 (100.0%) | $0 |
Poverty in Bell Arthur
Income Below Poverty by Sex and Age in Bell Arthur
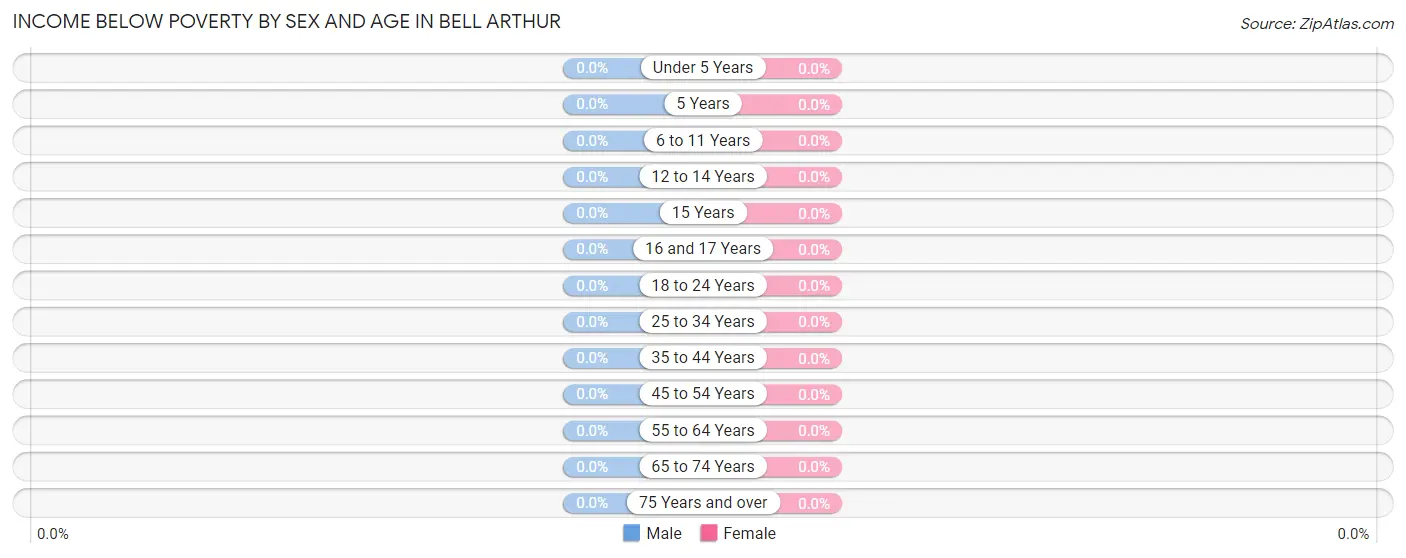
| Age Bracket | Male | Female |
| Under 5 Years | 0 (0.0%) | 0 (0.0%) |
| 5 Years | 0 (0.0%) | 0 (0.0%) |
| 6 to 11 Years | 0 (0.0%) | 0 (0.0%) |
| 12 to 14 Years | 0 (0.0%) | 0 (0.0%) |
| 15 Years | 0 (0.0%) | 0 (0.0%) |
| 16 and 17 Years | 0 (0.0%) | 0 (0.0%) |
| 18 to 24 Years | 0 (0.0%) | 0 (0.0%) |
| 25 to 34 Years | 0 (0.0%) | 0 (0.0%) |
| 35 to 44 Years | 0 (0.0%) | 0 (0.0%) |
| 45 to 54 Years | 0 (0.0%) | 0 (0.0%) |
| 55 to 64 Years | 0 (0.0%) | 0 (0.0%) |
| 65 to 74 Years | 0 (0.0%) | 0 (0.0%) |
| 75 Years and over | 0 (0.0%) | 0 (0.0%) |
| Total | 0 (0.0%) | 0 (0.0%) |
Income Above Poverty by Sex and Age in Bell Arthur
According to the poverty statistics in Bell Arthur, males aged under 5 years and females aged under 5 years are the age groups that are most secure financially, with 100.0% of males and 100.0% of females in these age groups living above the poverty line.

| Age Bracket | Male | Female |
| Under 5 Years | 45 (100.0%) | 44 (100.0%) |
| 5 Years | 0 (0.0%) | 0 (0.0%) |
| 6 to 11 Years | 53 (100.0%) | 0 (0.0%) |
| 12 to 14 Years | 0 (0.0%) | 0 (0.0%) |
| 15 Years | 0 (0.0%) | 0 (0.0%) |
| 16 and 17 Years | 0 (0.0%) | 52 (100.0%) |
| 18 to 24 Years | 28 (100.0%) | 0 (0.0%) |
| 25 to 34 Years | 91 (100.0%) | 104 (100.0%) |
| 35 to 44 Years | 18 (100.0%) | 0 (0.0%) |
| 45 to 54 Years | 0 (0.0%) | 42 (100.0%) |
| 55 to 64 Years | 0 (0.0%) | 0 (0.0%) |
| 65 to 74 Years | 14 (100.0%) | 0 (0.0%) |
| 75 Years and over | 0 (0.0%) | 0 (0.0%) |
| Total | 249 (100.0%) | 242 (100.0%) |
Income Below Poverty Among Married-Couple Families in Bell Arthur
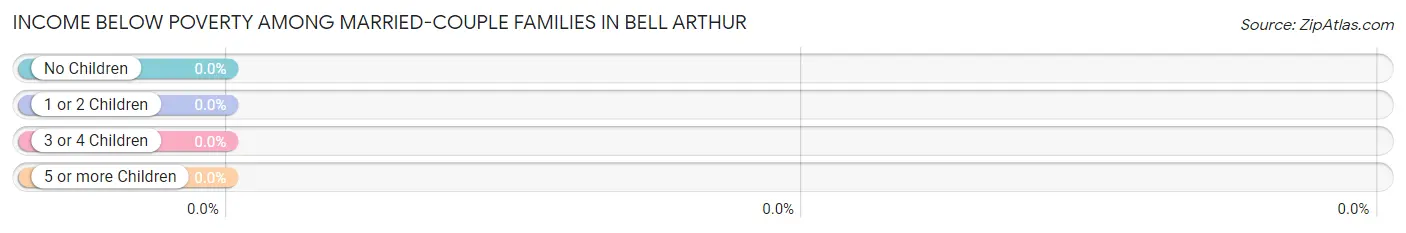
| Children | Above Poverty | Below Poverty |
| No Children | 0 (0.0%) | 0 (0.0%) |
| 1 or 2 Children | 90 (100.0%) | 0 (0.0%) |
| 3 or 4 Children | 0 (0.0%) | 0 (0.0%) |
| 5 or more Children | 0 (0.0%) | 0 (0.0%) |
| Total | 90 (100.0%) | 0 (0.0%) |
Income Below Poverty Among Single-Parent Households in Bell Arthur
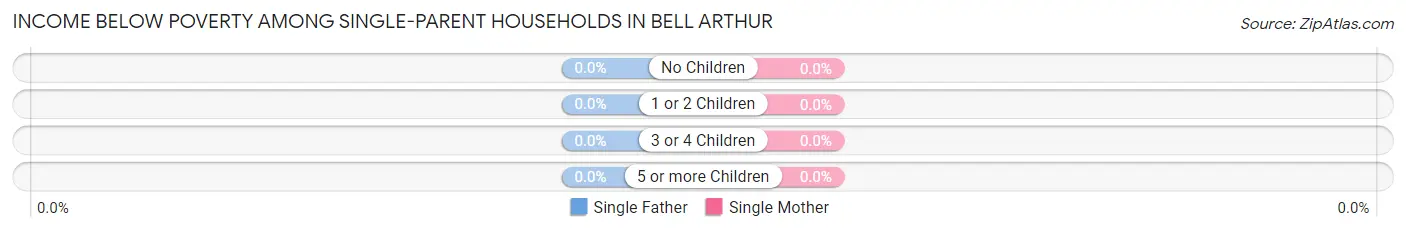
| Children | Single Father | Single Mother |
| No Children | 0 (0.0%) | 0 (0.0%) |
| 1 or 2 Children | 0 (0.0%) | 0 (0.0%) |
| 3 or 4 Children | 0 (0.0%) | 0 (0.0%) |
| 5 or more Children | 0 (0.0%) | 0 (0.0%) |
| Total | 0 (0.0%) | 0 (0.0%) |
Income Below Poverty Among Married-Couple vs Single-Parent Households in Bell Arthur
| Children | Married-Couple Families | Single-Parent Households |
| No Children | 0 (0.0%) | 0 (0.0%) |
| 1 or 2 Children | 0 (0.0%) | 0 (0.0%) |
| 3 or 4 Children | 0 (0.0%) | 0 (0.0%) |
| 5 or more Children | 0 (0.0%) | 0 (0.0%) |
| Total | 0 (0.0%) | 0 (0.0%) |
Race in Bell Arthur
The most populous races in Bell Arthur are White / Caucasian (445 | 90.6%), Two or more Races (46 | 9.4%), and Hispanic or Latino (10 | 2.0%).
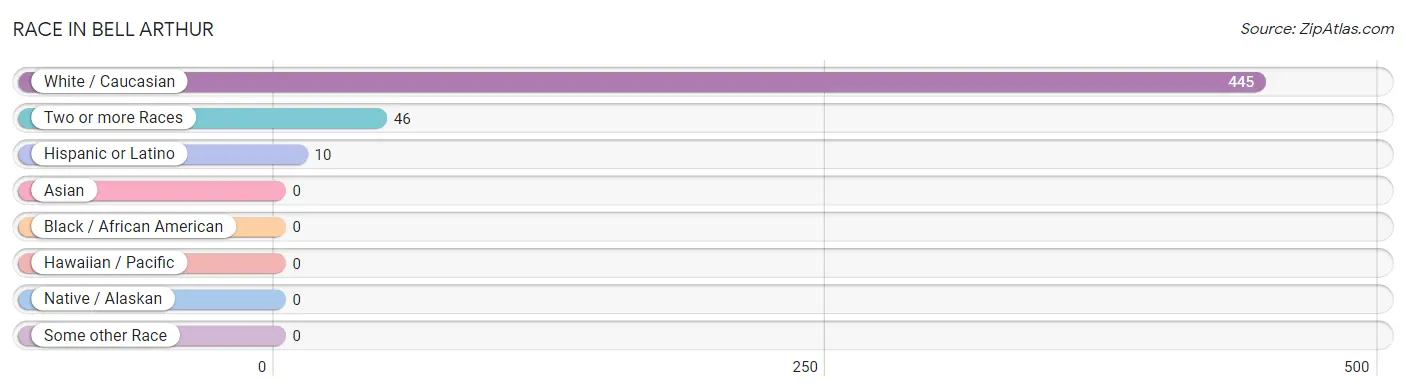
| Race | # Population | % Population |
| Asian | 0 | 0.0% |
| Black / African American | 0 | 0.0% |
| Hawaiian / Pacific | 0 | 0.0% |
| Hispanic or Latino | 10 | 2.0% |
| Native / Alaskan | 0 | 0.0% |
| White / Caucasian | 445 | 90.6% |
| Two or more Races | 46 | 9.4% |
| Some other Race | 0 | 0.0% |
| Total | 491 | 100.0% |
Ancestry in Bell Arthur
The most populous ancestries reported in Bell Arthur are Scottish (167 | 34.0%), Ukrainian (125 | 25.5%), German (60 | 12.2%), Irish (18 | 3.7%), and English (14 | 2.9%), together accounting for 78.2% of all Bell Arthur residents.
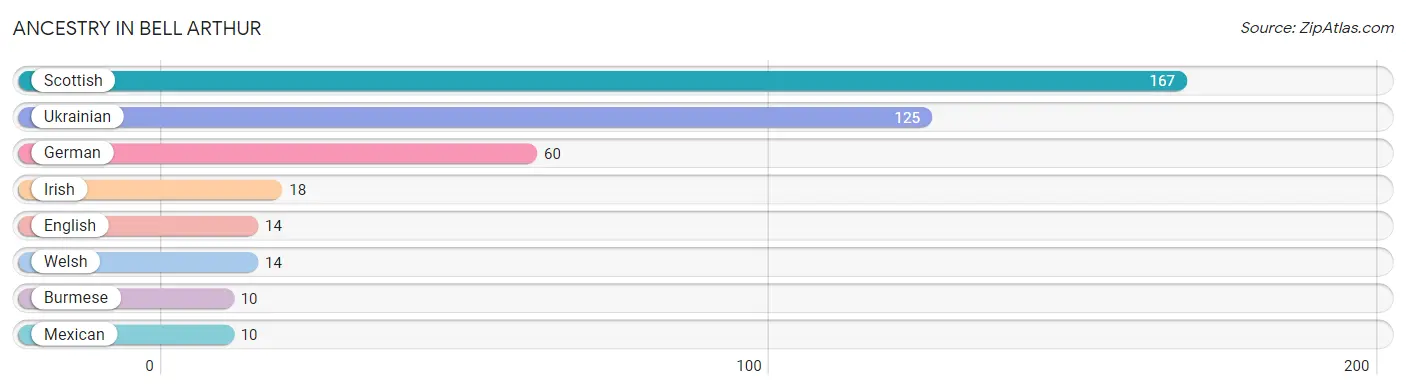
| Ancestry | # Population | % Population |
| Burmese | 10 | 2.0% |
| English | 14 | 2.9% |
| German | 60 | 12.2% |
| Irish | 18 | 3.7% |
| Mexican | 10 | 2.0% |
| Scottish | 167 | 34.0% |
| Ukrainian | 125 | 25.5% |
| Welsh | 14 | 2.9% | View All 8 Rows |
Immigrants in Bell Arthur
The most numerous immigrant groups reported in Bell Arthur came from Eastern Europe (81 | 16.5%), Europe (81 | 16.5%), and Ukraine (81 | 16.5%), together accounting for 49.5% of all Bell Arthur residents.
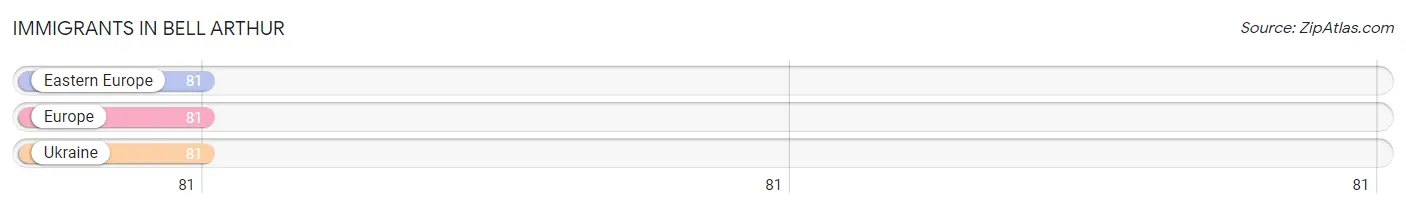
| Immigration Origin | # Population | % Population |
| Eastern Europe | 81 | 16.5% |
| Europe | 81 | 16.5% |
| Ukraine | 81 | 16.5% | View All 3 Rows |
Sex and Age in Bell Arthur
Sex and Age in Bell Arthur
The most populous age groups in Bell Arthur are 30 to 34 Years (91 | 36.5%) for men and 25 to 29 Years (104 | 43.0%) for women.
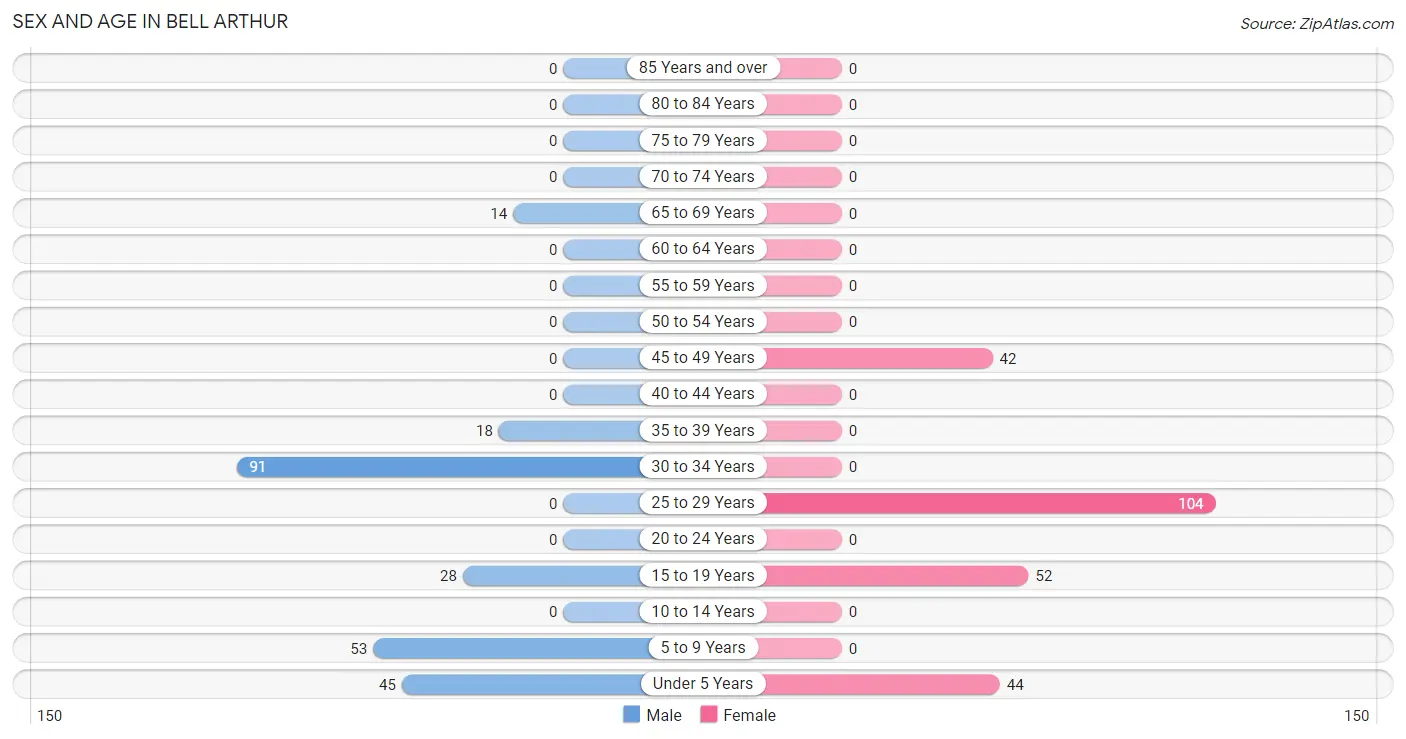
| Age Bracket | Male | Female |
| Under 5 Years | 45 (18.1%) | 44 (18.2%) |
| 5 to 9 Years | 53 (21.3%) | 0 (0.0%) |
| 10 to 14 Years | 0 (0.0%) | 0 (0.0%) |
| 15 to 19 Years | 28 (11.2%) | 52 (21.5%) |
| 20 to 24 Years | 0 (0.0%) | 0 (0.0%) |
| 25 to 29 Years | 0 (0.0%) | 104 (43.0%) |
| 30 to 34 Years | 91 (36.5%) | 0 (0.0%) |
| 35 to 39 Years | 18 (7.2%) | 0 (0.0%) |
| 40 to 44 Years | 0 (0.0%) | 0 (0.0%) |
| 45 to 49 Years | 0 (0.0%) | 42 (17.4%) |
| 50 to 54 Years | 0 (0.0%) | 0 (0.0%) |
| 55 to 59 Years | 0 (0.0%) | 0 (0.0%) |
| 60 to 64 Years | 0 (0.0%) | 0 (0.0%) |
| 65 to 69 Years | 14 (5.6%) | 0 (0.0%) |
| 70 to 74 Years | 0 (0.0%) | 0 (0.0%) |
| 75 to 79 Years | 0 (0.0%) | 0 (0.0%) |
| 80 to 84 Years | 0 (0.0%) | 0 (0.0%) |
| 85 Years and over | 0 (0.0%) | 0 (0.0%) |
| Total | 249 (100.0%) | 242 (100.0%) |
Families and Households in Bell Arthur
Median Family Size in Bell Arthur
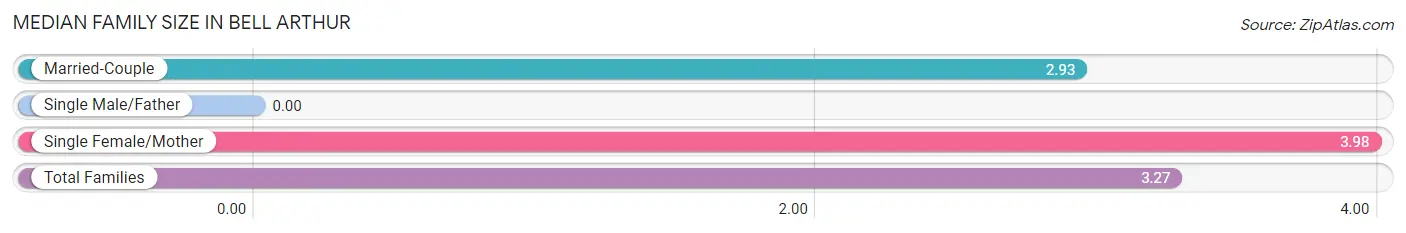
| Family Type | # Families | Family Size |
| Married-Couple | 90 (68.2%) | 2.93 |
| Single Male/Father | 0 (0.0%) | - |
| Single Female/Mother | 42 (31.8%) | 3.98 |
| Total Families | 132 (100.0%) | 3.27 |
Median Household Size in Bell Arthur
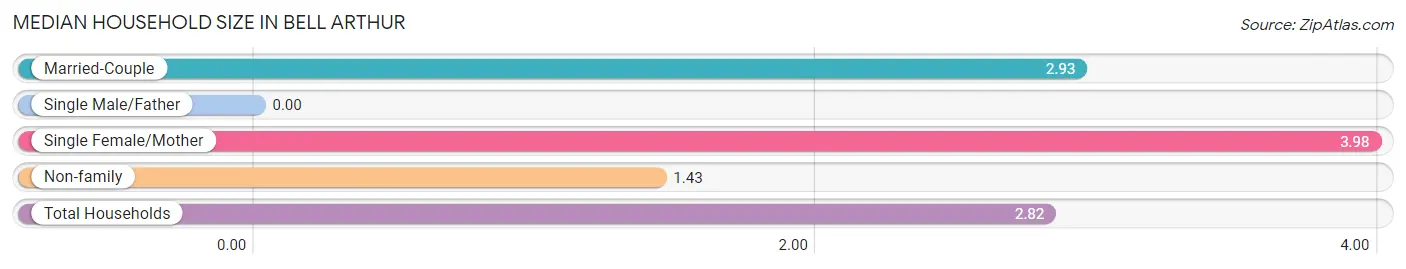
| Household Type | # Households | Household Size |
| Married-Couple | 90 (51.7%) | 2.93 |
| Single Male/Father | 0 (0.0%) | - |
| Single Female/Mother | 42 (24.1%) | 3.98 |
| Non-family | 42 (24.1%) | 1.43 |
| Total Households | 174 (100.0%) | 2.82 |
Household Size by Marriage Status in Bell Arthur
Out of a total of 174 households in Bell Arthur, 132 (75.9%) are family households, while 42 (24.1%) are nonfamily households. The most numerous type of family households are 3-person households, comprising 90, and the most common type of nonfamily households are 1-person households, comprising 24.
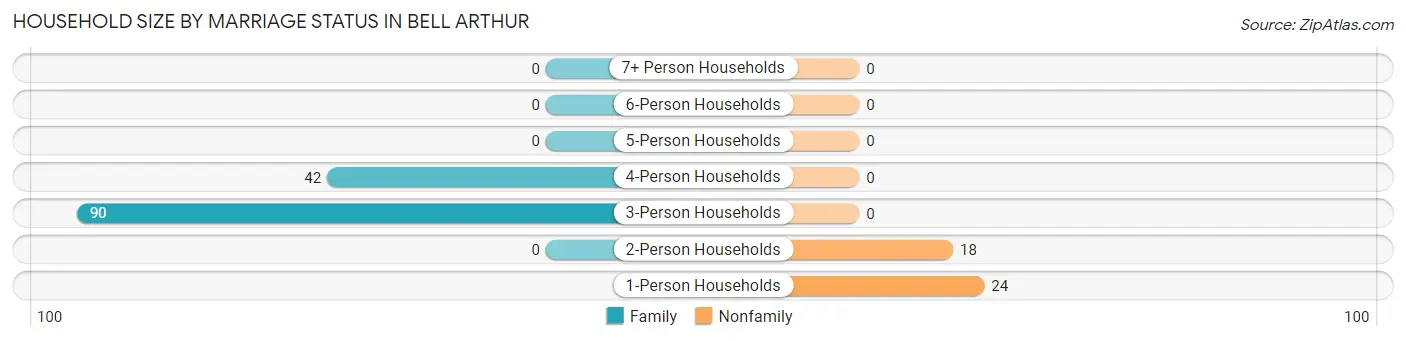
| Household Size | Family Households | Nonfamily Households |
| 1-Person Households | - | 24 (13.8%) |
| 2-Person Households | 0 (0.0%) | 18 (10.3%) |
| 3-Person Households | 90 (51.7%) | 0 (0.0%) |
| 4-Person Households | 42 (24.1%) | 0 (0.0%) |
| 5-Person Households | 0 (0.0%) | 0 (0.0%) |
| 6-Person Households | 0 (0.0%) | 0 (0.0%) |
| 7+ Person Households | 0 (0.0%) | 0 (0.0%) |
| Total | 132 (75.9%) | 42 (24.1%) |
Female Fertility in Bell Arthur
Fertility by Age in Bell Arthur
| Age Bracket | Women with Births | Births / 1,000 Women |
| 15 to 19 years | 0 (0.0%) | 0.0 |
| 20 to 34 years | 0 (0.0%) | 0.0 |
| 35 to 50 years | 0 (0.0%) | 0.0 |
| Total | 0 (0.0%) | 0.0 |
Fertility by Age by Marriage Status in Bell Arthur
| Age Bracket | Married | Unmarried |
| 15 to 19 years | 0 (0.0%) | 0 (0.0%) |
| 20 to 34 years | 0 (0.0%) | 0 (0.0%) |
| 35 to 50 years | 0 (0.0%) | 0 (0.0%) |
| Total | 0 (0.0%) | 0 (0.0%) |
Fertility by Education in Bell Arthur
| Educational Attainment | Women with Births | Births / 1,000 Women |
| Less than High School | 0 (0.0%) | 0.0 |
| High School Diploma | 0 (0.0%) | 0.0 |
| College or Associate's Degree | 0 (0.0%) | 0.0 |
| Bachelor's Degree | 0 (0.0%) | 0.0 |
| Graduate Degree | 0 (0.0%) | 0.0 |
| Total | 0 (0.0%) | 0.0 |
Fertility by Education by Marriage Status in Bell Arthur
| Educational Attainment | Married | Unmarried |
| Less than High School | 0 (0.0%) | 0 (0.0%) |
| High School Diploma | 0 (0.0%) | 0 (0.0%) |
| College or Associate's Degree | 0 (0.0%) | 0 (0.0%) |
| Bachelor's Degree | 0 (0.0%) | 0 (0.0%) |
| Graduate Degree | 0 (0.0%) | 0 (0.0%) |
| Total | 0 (0.0%) | 0 (0.0%) |
Employment Characteristics in Bell Arthur
Employment by Class of Employer in Bell Arthur
Among the 215 employed individuals in Bell Arthur, private company employees (173 | 80.5%), local government employees (32 | 14.9%), and state government employees (10 | 4.6%) make up the most common classes of employment.
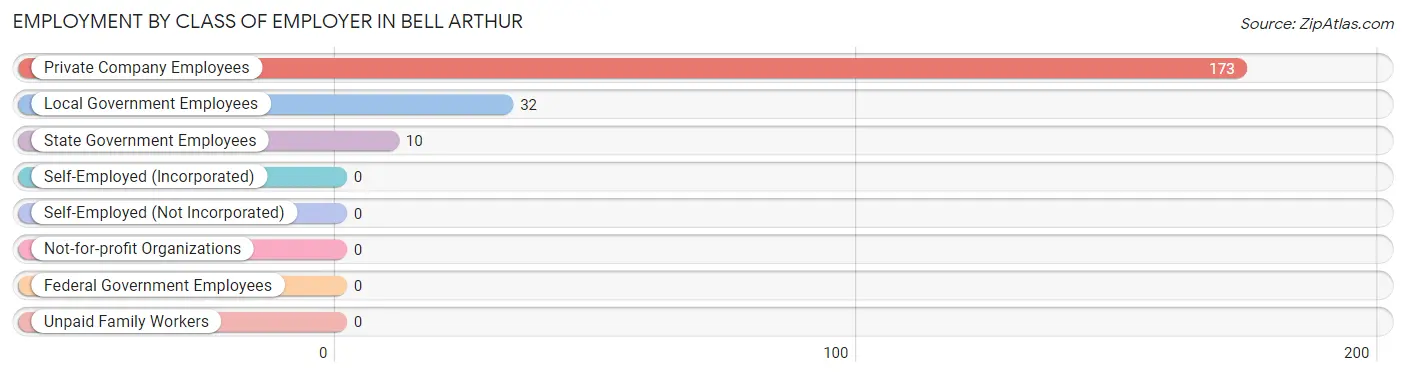
| Employer Class | # Employees | % Employees |
| Private Company Employees | 173 | 80.5% |
| Self-Employed (Incorporated) | 0 | 0.0% |
| Self-Employed (Not Incorporated) | 0 | 0.0% |
| Not-for-profit Organizations | 0 | 0.0% |
| Local Government Employees | 32 | 14.9% |
| State Government Employees | 10 | 4.6% |
| Federal Government Employees | 0 | 0.0% |
| Unpaid Family Workers | 0 | 0.0% |
| Total | 215 | 100.0% |
Employment Status by Age in Bell Arthur
According to the labor force statistics for Bell Arthur, out of the total population over 16 years of age (349), 73.6% or 257 individuals are in the labor force, with 16.3% or 42 of them unemployed. The age group with the highest labor force participation rate is 30 to 34 years, with 100.0% or 91 individuals in the labor force. Within the labor force, the 45 to 54 years age range has the highest percentage of unemployed individuals, with 100.0% or 42 of them being unemployed.
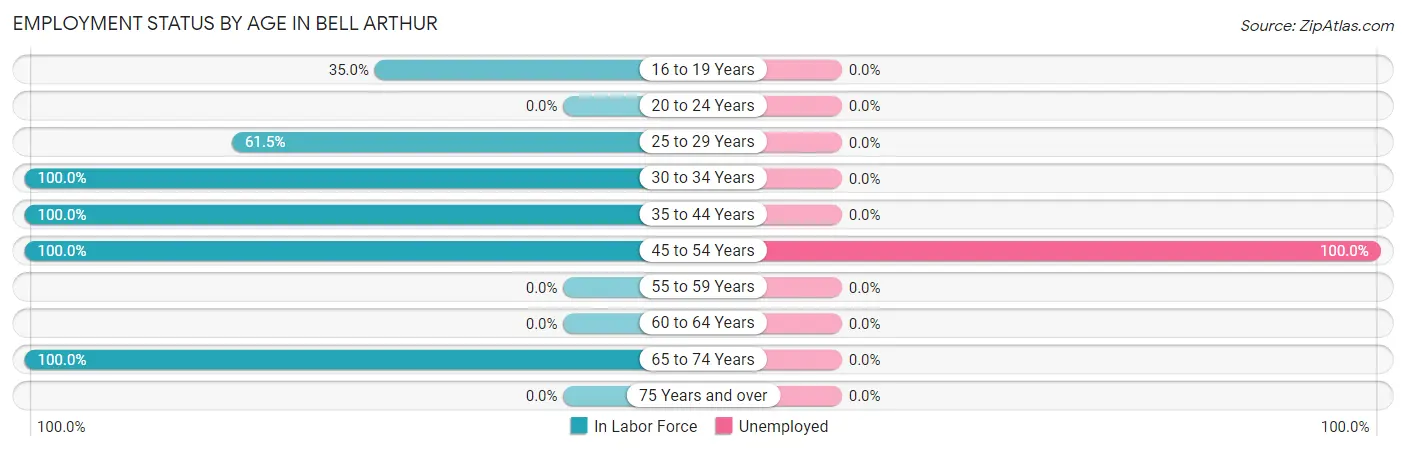
| Age Bracket | In Labor Force | Unemployed |
| 16 to 19 Years | 28 (35.0%) | 0 (0.0%) |
| 20 to 24 Years | 0 (0.0%) | 0 (0.0%) |
| 25 to 29 Years | 64 (61.5%) | 0 (0.0%) |
| 30 to 34 Years | 91 (100.0%) | 0 (0.0%) |
| 35 to 44 Years | 18 (100.0%) | 0 (0.0%) |
| 45 to 54 Years | 42 (100.0%) | 42 (100.0%) |
| 55 to 59 Years | 0 (0.0%) | 0 (0.0%) |
| 60 to 64 Years | 0 (0.0%) | 0 (0.0%) |
| 65 to 74 Years | 14 (100.0%) | 0 (0.0%) |
| 75 Years and over | 0 (0.0%) | 0 (0.0%) |
| Total | 257 (73.6%) | 42 (16.3%) |
Employment Status by Educational Attainment in Bell Arthur
According to labor force statistics for Bell Arthur, 84.3% of individuals (215) out of the total population between 25 and 64 years of age (255) are in the labor force, with 19.5% or 42 of them being unemployed. The group with the highest labor force participation rate are those with the educational attainment of high school diploma, with 100.0% or 42 individuals in the labor force. Within the labor force, individuals with high school diploma education have the highest percentage of unemployment, with 100.0% or 42 of them being unemployed.
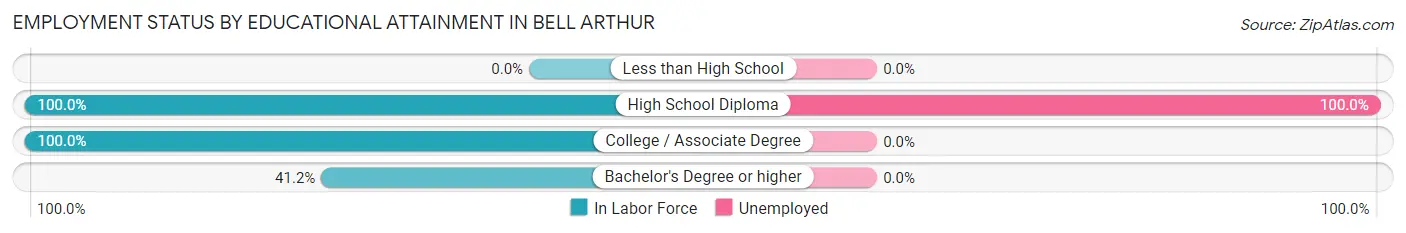
| Educational Attainment | In Labor Force | Unemployed |
| Less than High School | 0 (0.0%) | 0 (0.0%) |
| High School Diploma | 42 (100.0%) | 42 (100.0%) |
| College / Associate Degree | 145 (100.0%) | 0 (0.0%) |
| Bachelor's Degree or higher | 28 (41.2%) | 0 (0.0%) |
| Total | 215 (84.3%) | 50 (19.5%) |
Employment Occupations by Sex in Bell Arthur
Management, Business, Science and Arts Occupations
The most common Management, Business, Science and Arts occupations in Bell Arthur are Management (54 | 25.1%), Community & Social Service (24 | 11.2%), and Education Instruction & Library (24 | 11.2%).
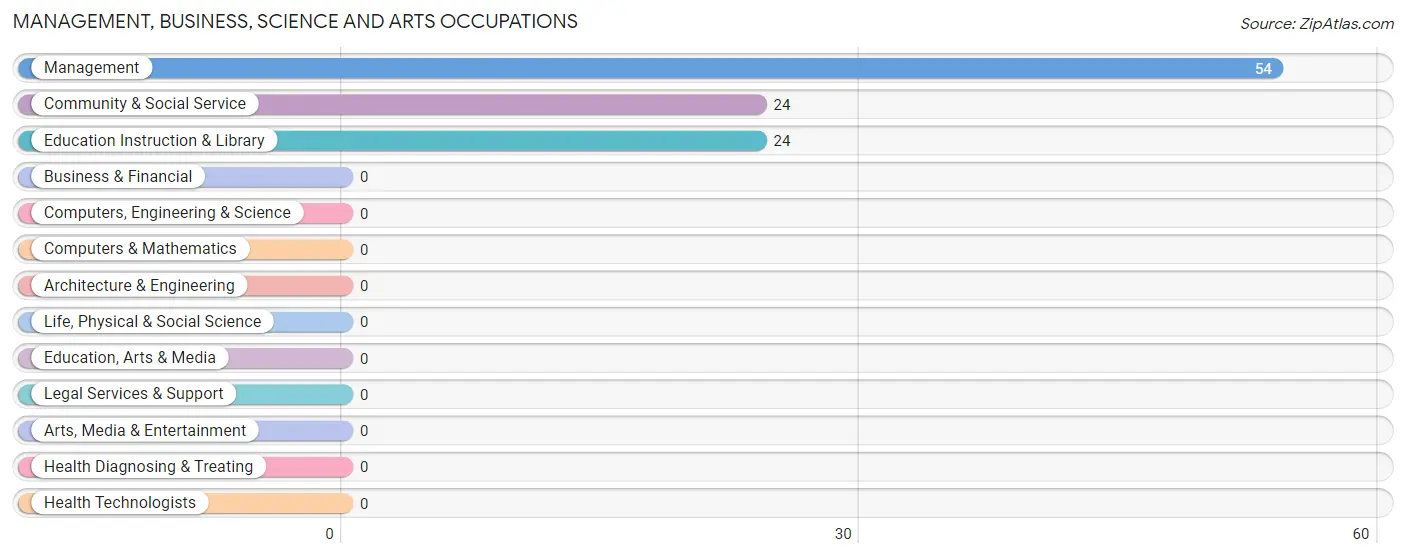
Management, Business, Science and Arts Occupations by Sex
Within the Management, Business, Science and Arts occupations in Bell Arthur, the most male-oriented occupations are Community & Social Service (58.3%), and Education Instruction & Library (58.3%), while the most female-oriented occupations are Management (100.0%), Community & Social Service (41.7%), and Education Instruction & Library (41.7%).
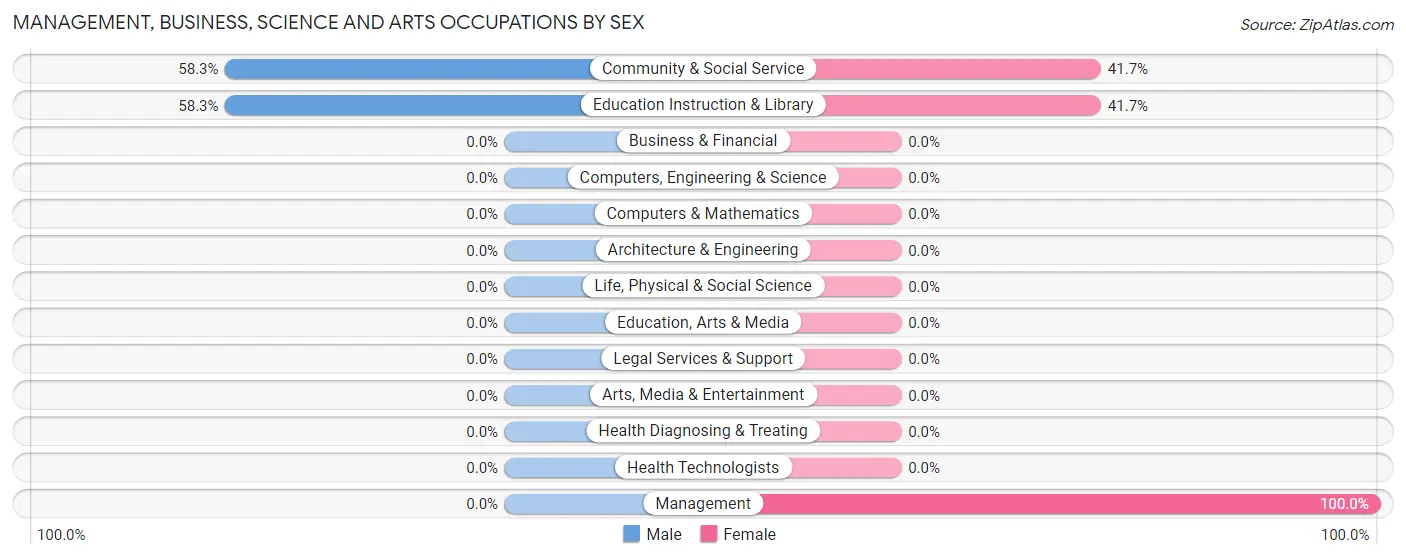
| Occupation | Male | Female |
| Management | 0 (0.0%) | 54 (100.0%) |
| Business & Financial | 0 (0.0%) | 0 (0.0%) |
| Computers, Engineering & Science | 0 (0.0%) | 0 (0.0%) |
| Computers & Mathematics | 0 (0.0%) | 0 (0.0%) |
| Architecture & Engineering | 0 (0.0%) | 0 (0.0%) |
| Life, Physical & Social Science | 0 (0.0%) | 0 (0.0%) |
| Community & Social Service | 14 (58.3%) | 10 (41.7%) |
| Education, Arts & Media | 0 (0.0%) | 0 (0.0%) |
| Legal Services & Support | 0 (0.0%) | 0 (0.0%) |
| Education Instruction & Library | 14 (58.3%) | 10 (41.7%) |
| Arts, Media & Entertainment | 0 (0.0%) | 0 (0.0%) |
| Health Diagnosing & Treating | 0 (0.0%) | 0 (0.0%) |
| Health Technologists | 0 (0.0%) | 0 (0.0%) |
| Total (Category) | 14 (17.9%) | 64 (82.1%) |
| Total (Overall) | 151 (70.2%) | 64 (29.8%) |
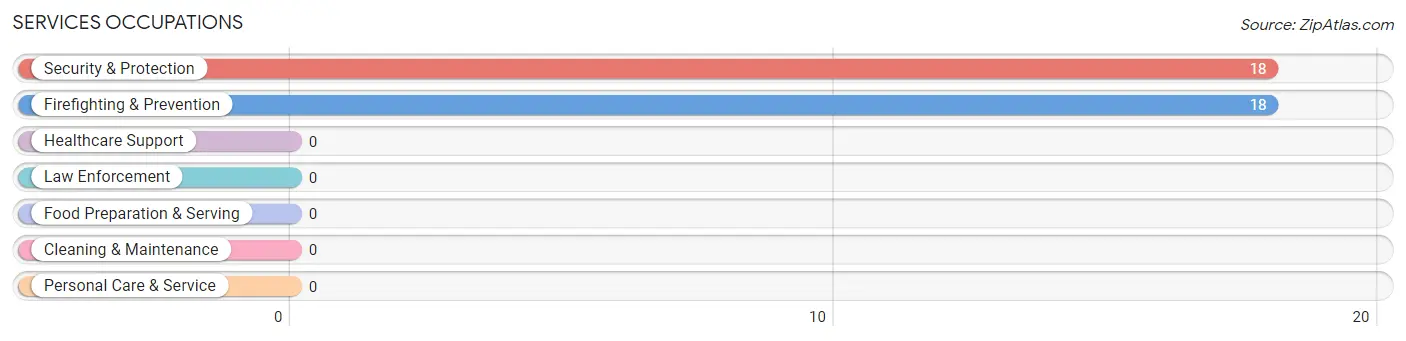
Services Occupations
The most common Services occupations in Bell Arthur are Security & Protection (18 | 8.4%), and Firefighting & Prevention (18 | 8.4%).
Services Occupations by Sex
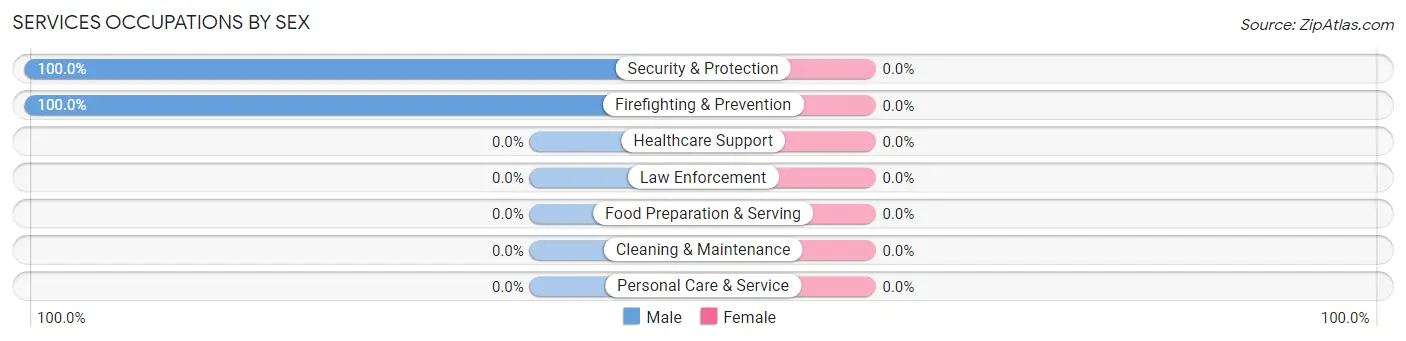
| Occupation | Male | Female |
| Healthcare Support | 0 (0.0%) | 0 (0.0%) |
| Security & Protection | 18 (100.0%) | 0 (0.0%) |
| Firefighting & Prevention | 18 (100.0%) | 0 (0.0%) |
| Law Enforcement | 0 (0.0%) | 0 (0.0%) |
| Food Preparation & Serving | 0 (0.0%) | 0 (0.0%) |
| Cleaning & Maintenance | 0 (0.0%) | 0 (0.0%) |
| Personal Care & Service | 0 (0.0%) | 0 (0.0%) |
| Total (Category) | 18 (100.0%) | 0 (0.0%) |
| Total (Overall) | 151 (70.2%) | 64 (29.8%) |
Sales and Office Occupations
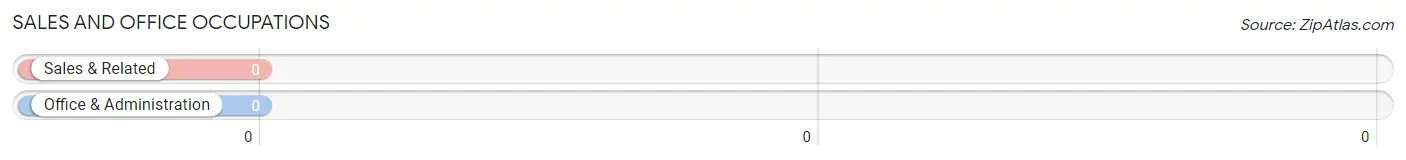
Sales and Office Occupations by Sex
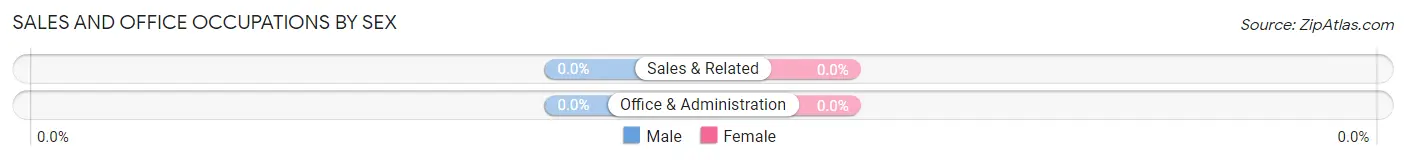
| Occupation | Male | Female |
| Sales & Related | 0 (0.0%) | 0 (0.0%) |
| Office & Administration | 0 (0.0%) | 0 (0.0%) |
| Total (Category) | 0 (0.0%) | 0 (0.0%) |
| Total (Overall) | 151 (70.2%) | 64 (29.8%) |
Natural Resources, Construction and Maintenance Occupations
The most common Natural Resources, Construction and Maintenance occupations in Bell Arthur are , and Installation, Maintenance & Repair (41 | 19.1%).
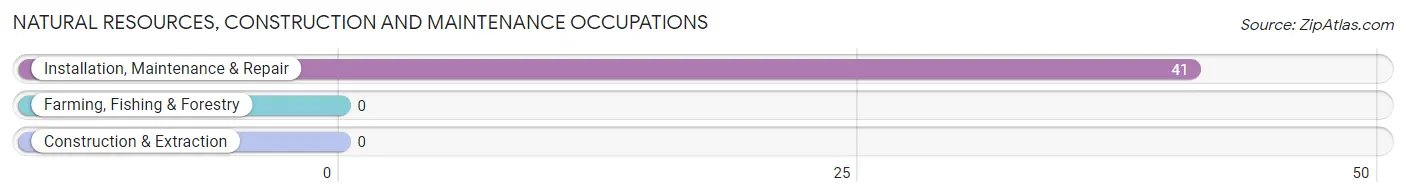
Natural Resources, Construction and Maintenance Occupations by Sex
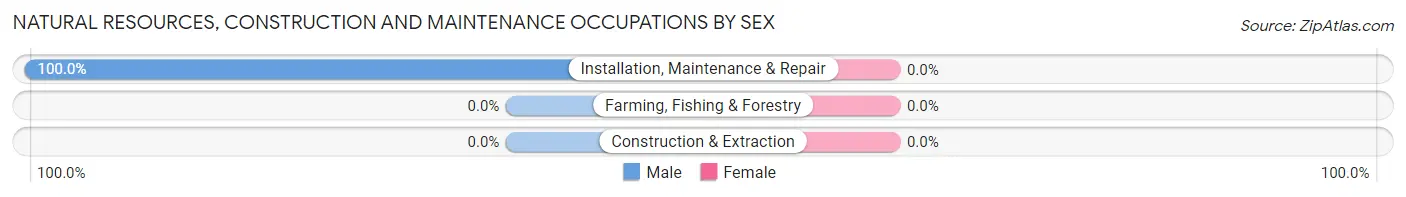
| Occupation | Male | Female |
| Farming, Fishing & Forestry | 0 (0.0%) | 0 (0.0%) |
| Construction & Extraction | 0 (0.0%) | 0 (0.0%) |
| Installation, Maintenance & Repair | 41 (100.0%) | 0 (0.0%) |
| Total (Category) | 41 (100.0%) | 0 (0.0%) |
| Total (Overall) | 151 (70.2%) | 64 (29.8%) |
Production, Transportation and Moving Occupations
The most common Production, Transportation and Moving occupations in Bell Arthur are Production (50 | 23.3%), and Transportation (28 | 13.0%).
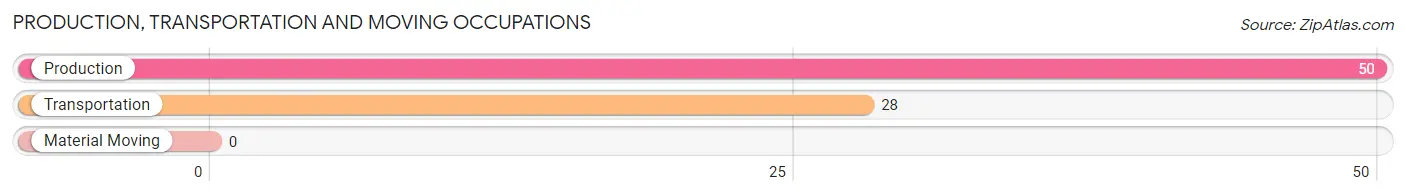
Production, Transportation and Moving Occupations by Sex
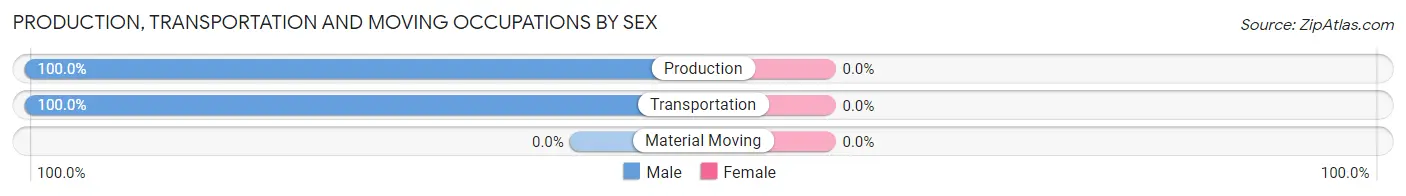
| Occupation | Male | Female |
| Production | 50 (100.0%) | 0 (0.0%) |
| Transportation | 28 (100.0%) | 0 (0.0%) |
| Material Moving | 0 (0.0%) | 0 (0.0%) |
| Total (Category) | 78 (100.0%) | 0 (0.0%) |
| Total (Overall) | 151 (70.2%) | 64 (29.8%) |
Employment Industries by Sex in Bell Arthur
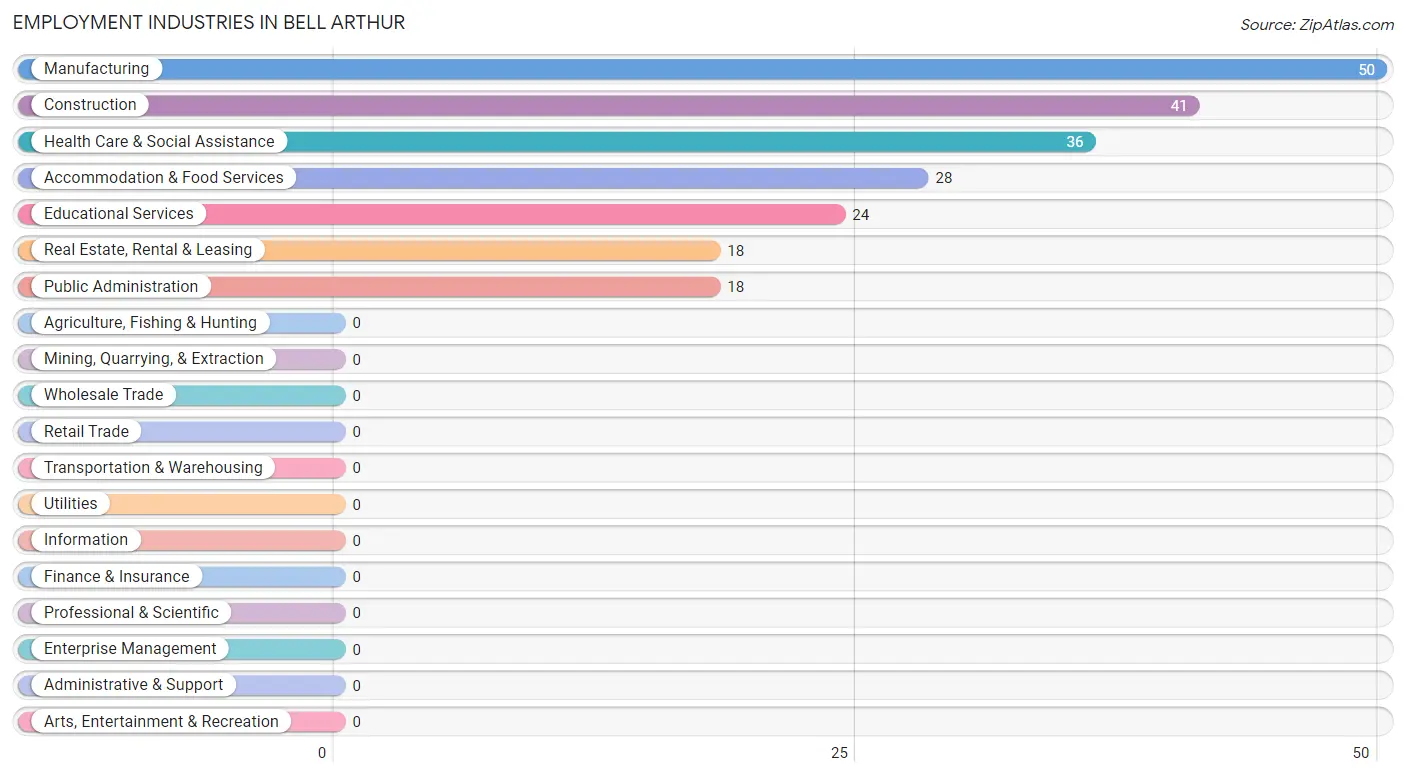
Employment Industries in Bell Arthur
The major employment industries in Bell Arthur include Manufacturing (50 | 23.3%), Construction (41 | 19.1%), Health Care & Social Assistance (36 | 16.7%), Accommodation & Food Services (28 | 13.0%), and Educational Services (24 | 11.2%).
Employment Industries by Sex in Bell Arthur
The Bell Arthur industries that see more men than women are Construction (100.0%), Manufacturing (100.0%), and Accommodation & Food Services (100.0%), whereas the industries that tend to have a higher number of women are Real Estate, Rental & Leasing (100.0%), Health Care & Social Assistance (100.0%), and Educational Services (41.7%).
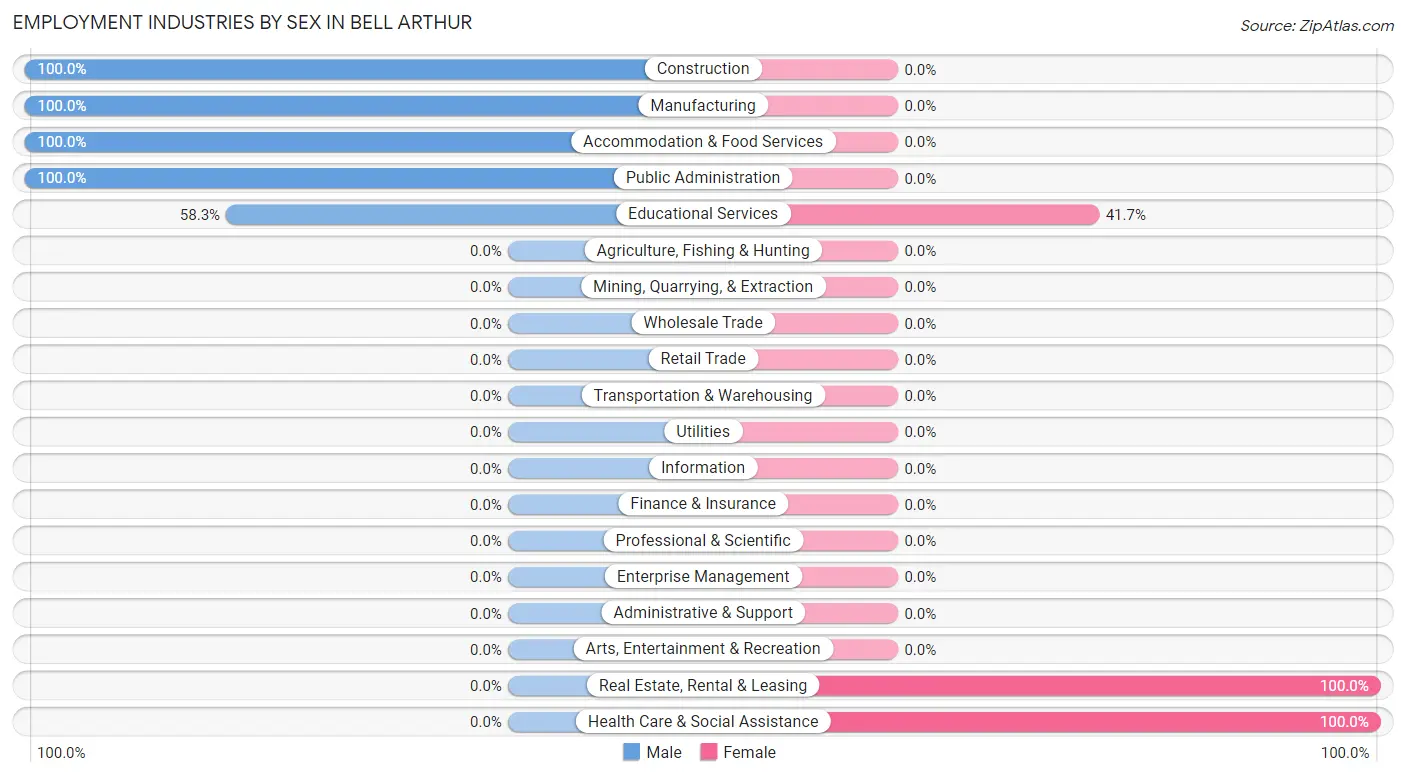
| Industry | Male | Female |
| Agriculture, Fishing & Hunting | 0 (0.0%) | 0 (0.0%) |
| Mining, Quarrying, & Extraction | 0 (0.0%) | 0 (0.0%) |
| Construction | 41 (100.0%) | 0 (0.0%) |
| Manufacturing | 50 (100.0%) | 0 (0.0%) |
| Wholesale Trade | 0 (0.0%) | 0 (0.0%) |
| Retail Trade | 0 (0.0%) | 0 (0.0%) |
| Transportation & Warehousing | 0 (0.0%) | 0 (0.0%) |
| Utilities | 0 (0.0%) | 0 (0.0%) |
| Information | 0 (0.0%) | 0 (0.0%) |
| Finance & Insurance | 0 (0.0%) | 0 (0.0%) |
| Real Estate, Rental & Leasing | 0 (0.0%) | 18 (100.0%) |
| Professional & Scientific | 0 (0.0%) | 0 (0.0%) |
| Enterprise Management | 0 (0.0%) | 0 (0.0%) |
| Administrative & Support | 0 (0.0%) | 0 (0.0%) |
| Educational Services | 14 (58.3%) | 10 (41.7%) |
| Health Care & Social Assistance | 0 (0.0%) | 36 (100.0%) |
| Arts, Entertainment & Recreation | 0 (0.0%) | 0 (0.0%) |
| Accommodation & Food Services | 28 (100.0%) | 0 (0.0%) |
| Public Administration | 18 (100.0%) | 0 (0.0%) |
| Total | 151 (70.2%) | 64 (29.8%) |
Education in Bell Arthur
School Enrollment in Bell Arthur
The most common levels of schooling among the 133 students in Bell Arthur are elementary school (53 | 39.9%), high school (52 | 39.1%), and college / undergraduate (28 | 21.0%).
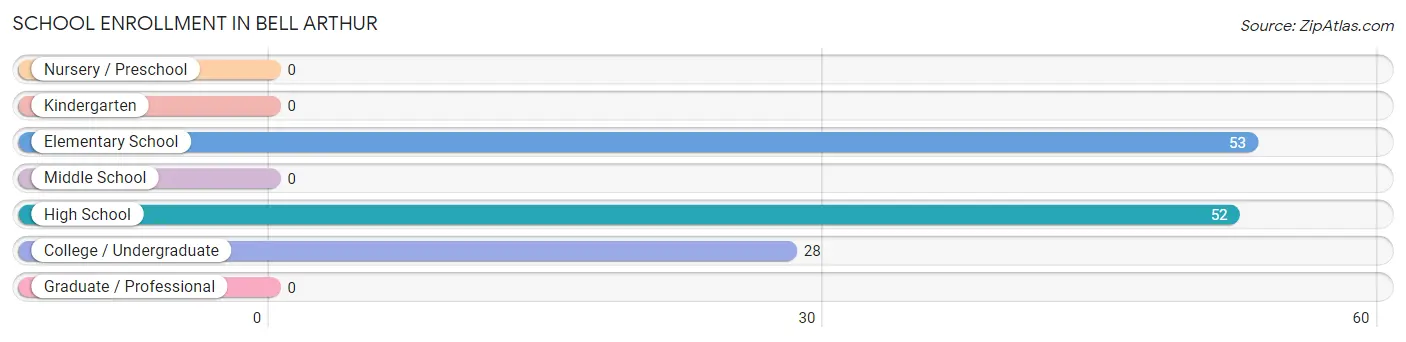
| School Level | # Students | % Students |
| Nursery / Preschool | 0 | 0.0% |
| Kindergarten | 0 | 0.0% |
| Elementary School | 53 | 39.9% |
| Middle School | 0 | 0.0% |
| High School | 52 | 39.1% |
| College / Undergraduate | 28 | 21.0% |
| Graduate / Professional | 0 | 0.0% |
| Total | 133 | 100.0% |
School Enrollment by Age by Funding Source in Bell Arthur
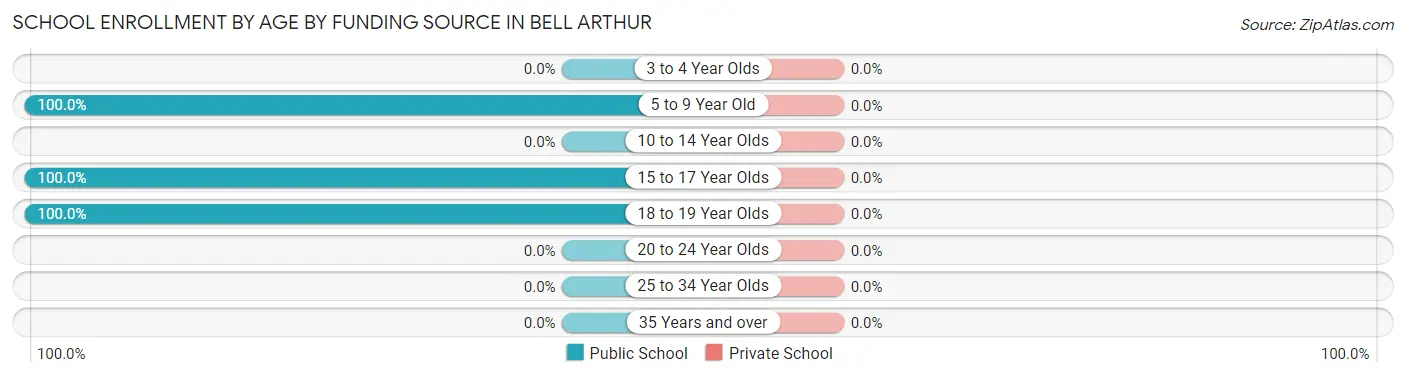
| Age Bracket | Public School | Private School |
| 3 to 4 Year Olds | 0 (0.0%) | 0 (0.0%) |
| 5 to 9 Year Old | 53 (100.0%) | 0 (0.0%) |
| 10 to 14 Year Olds | 0 (0.0%) | 0 (0.0%) |
| 15 to 17 Year Olds | 52 (100.0%) | 0 (0.0%) |
| 18 to 19 Year Olds | 28 (100.0%) | 0 (0.0%) |
| 20 to 24 Year Olds | 0 (0.0%) | 0 (0.0%) |
| 25 to 34 Year Olds | 0 (0.0%) | 0 (0.0%) |
| 35 Years and over | 0 (0.0%) | 0 (0.0%) |
| Total | 133 (100.0%) | 0 (0.0%) |
Educational Attainment by Field of Study in Bell Arthur
Arts & humanities (40 | 48.8%), communications (18 | 22.0%), liberal arts & history (14 | 17.1%), and visual & performing arts (10 | 12.2%) are the most common fields of study among 82 individuals in Bell Arthur who have obtained a bachelor's degree or higher.
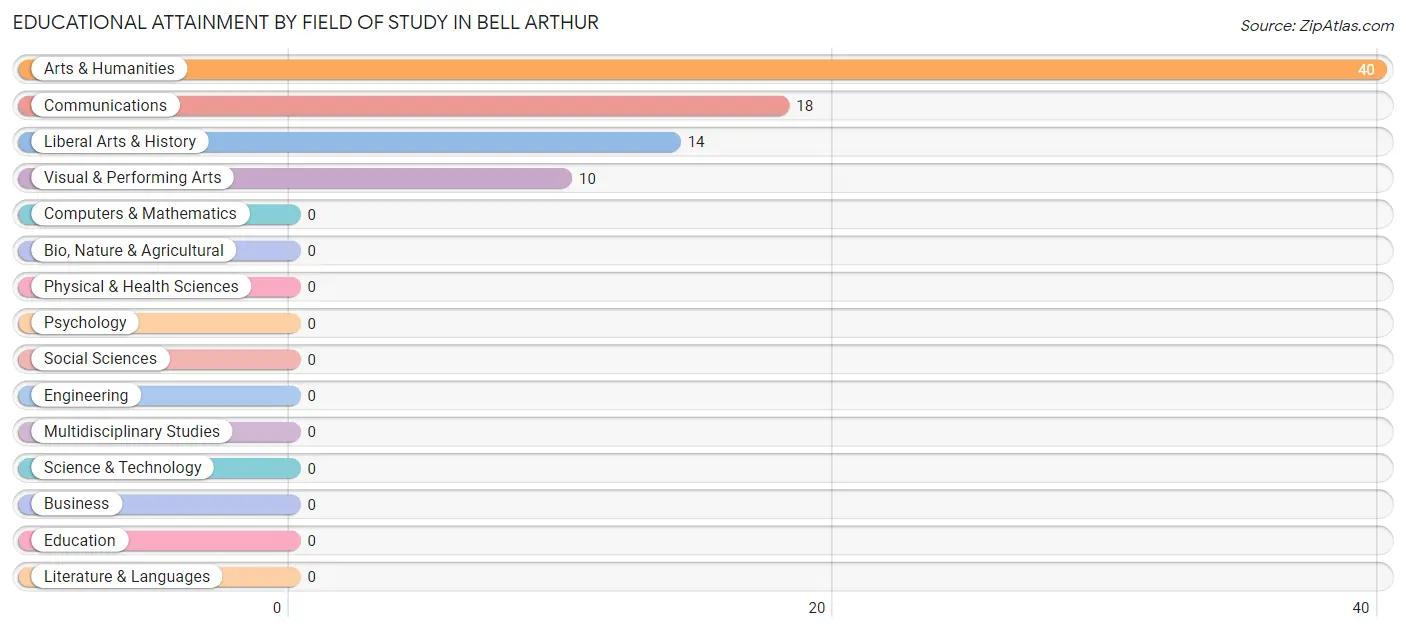
| Field of Study | # Graduates | % Graduates |
| Computers & Mathematics | 0 | 0.0% |
| Bio, Nature & Agricultural | 0 | 0.0% |
| Physical & Health Sciences | 0 | 0.0% |
| Psychology | 0 | 0.0% |
| Social Sciences | 0 | 0.0% |
| Engineering | 0 | 0.0% |
| Multidisciplinary Studies | 0 | 0.0% |
| Science & Technology | 0 | 0.0% |
| Business | 0 | 0.0% |
| Education | 0 | 0.0% |
| Literature & Languages | 0 | 0.0% |
| Liberal Arts & History | 14 | 17.1% |
| Visual & Performing Arts | 10 | 12.2% |
| Communications | 18 | 22.0% |
| Arts & Humanities | 40 | 48.8% |
| Total | 82 | 100.0% |
Transportation & Commute in Bell Arthur
Vehicle Availability by Sex in Bell Arthur
The most prevalent vehicle ownership categories in Bell Arthur are males with 2 vehicles (68, accounting for 45.0%) and females with 2 vehicles (64, making up 106.2%).
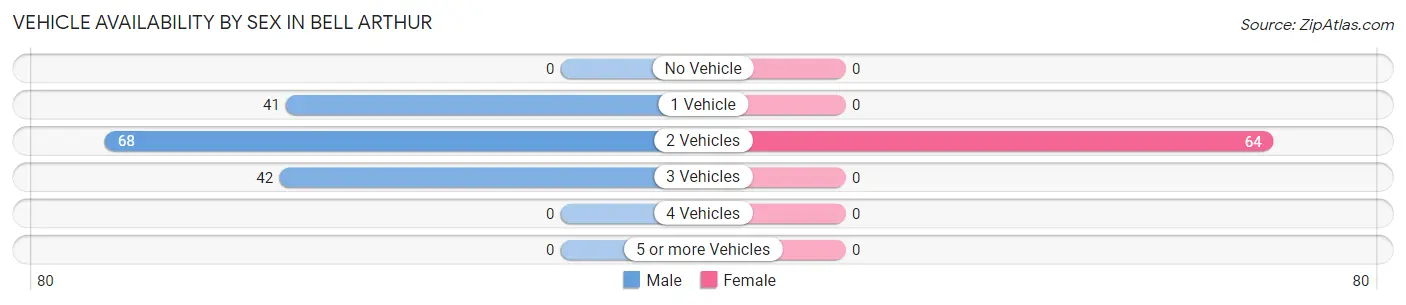
| Vehicles Available | Male | Female |
| No Vehicle | 0 (0.0%) | 0 (0.0%) |
| 1 Vehicle | 41 (27.2%) | 0 (0.0%) |
| 2 Vehicles | 68 (45.0%) | 64 (100.0%) |
| 3 Vehicles | 42 (27.8%) | 0 (0.0%) |
| 4 Vehicles | 0 (0.0%) | 0 (0.0%) |
| 5 or more Vehicles | 0 (0.0%) | 0 (0.0%) |
| Total | 151 (100.0%) | 64 (100.0%) |
Commute Time in Bell Arthur
The most frequently occuring commute durations in Bell Arthur are 40 to 44 minutes (50 commuters, 23.3%), less than 5 minutes (41 commuters, 19.1%), and 60 to 89 minutes (36 commuters, 16.7%).
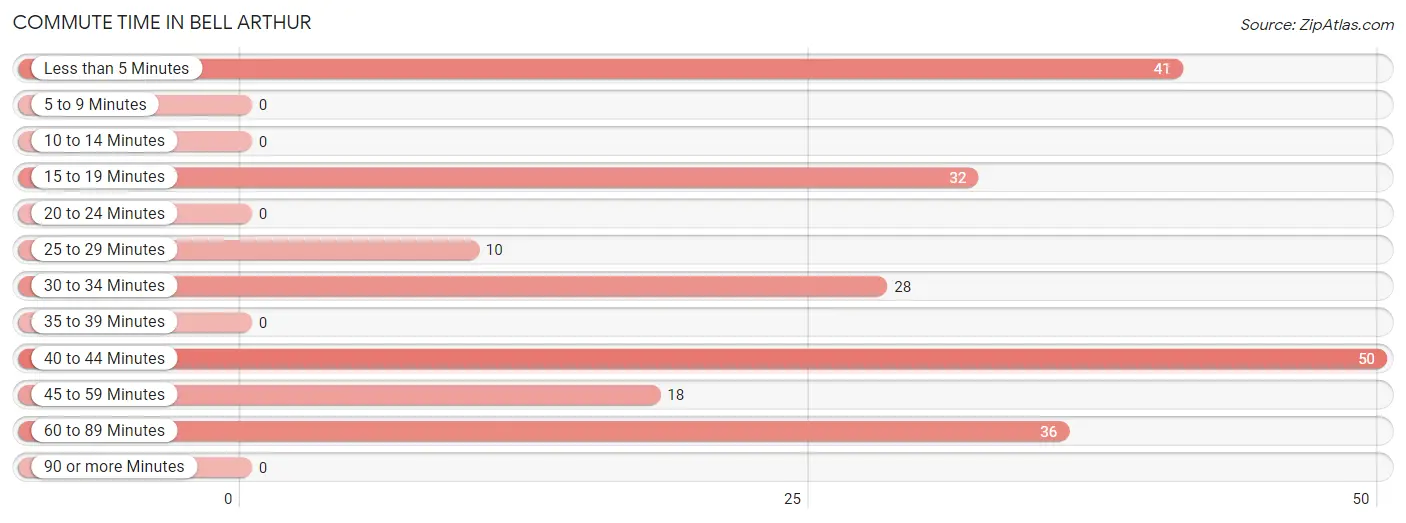
| Commute Time | # Commuters | % Commuters |
| Less than 5 Minutes | 41 | 19.1% |
| 5 to 9 Minutes | 0 | 0.0% |
| 10 to 14 Minutes | 0 | 0.0% |
| 15 to 19 Minutes | 32 | 14.9% |
| 20 to 24 Minutes | 0 | 0.0% |
| 25 to 29 Minutes | 10 | 4.6% |
| 30 to 34 Minutes | 28 | 13.0% |
| 35 to 39 Minutes | 0 | 0.0% |
| 40 to 44 Minutes | 50 | 23.3% |
| 45 to 59 Minutes | 18 | 8.4% |
| 60 to 89 Minutes | 36 | 16.7% |
| 90 or more Minutes | 0 | 0.0% |
Commute Time by Sex in Bell Arthur
The most common commute times in Bell Arthur are 40 to 44 minutes (50 commuters, 33.1%) for males and 60 to 89 minutes (36 commuters, 56.2%) for females.
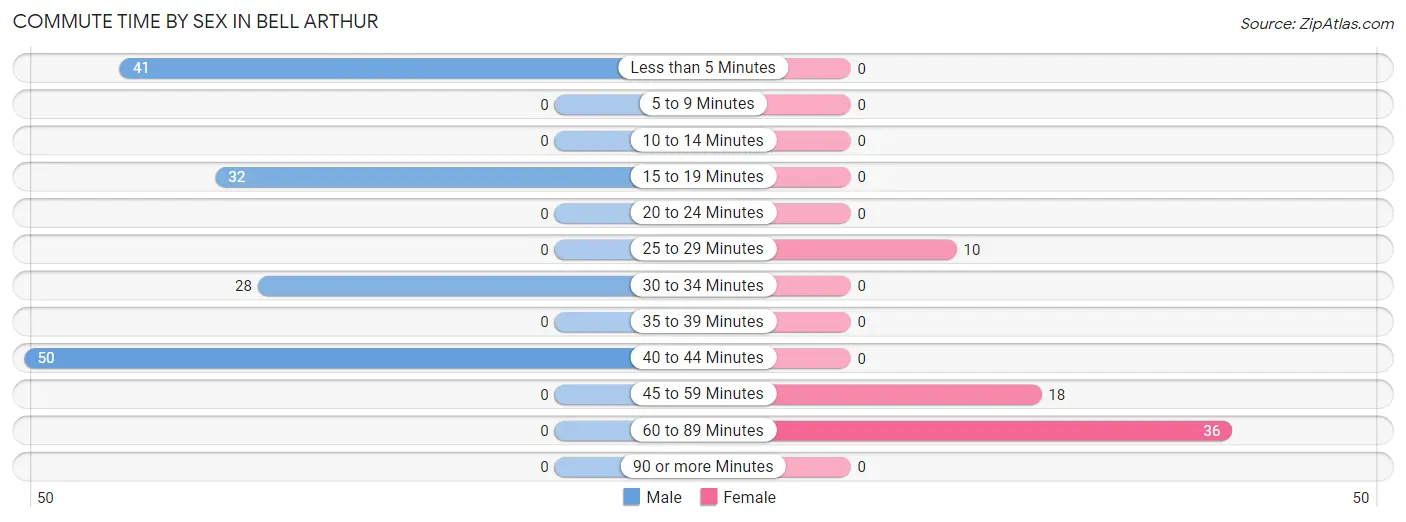
| Commute Time | Male | Female |
| Less than 5 Minutes | 41 (27.2%) | 0 (0.0%) |
| 5 to 9 Minutes | 0 (0.0%) | 0 (0.0%) |
| 10 to 14 Minutes | 0 (0.0%) | 0 (0.0%) |
| 15 to 19 Minutes | 32 (21.2%) | 0 (0.0%) |
| 20 to 24 Minutes | 0 (0.0%) | 0 (0.0%) |
| 25 to 29 Minutes | 0 (0.0%) | 10 (15.6%) |
| 30 to 34 Minutes | 28 (18.5%) | 0 (0.0%) |
| 35 to 39 Minutes | 0 (0.0%) | 0 (0.0%) |
| 40 to 44 Minutes | 50 (33.1%) | 0 (0.0%) |
| 45 to 59 Minutes | 0 (0.0%) | 18 (28.1%) |
| 60 to 89 Minutes | 0 (0.0%) | 36 (56.2%) |
| 90 or more Minutes | 0 (0.0%) | 0 (0.0%) |
Time of Departure to Work by Sex in Bell Arthur
The most frequent times of departure to work in Bell Arthur are 6:00 AM to 6:29 AM (50, 33.1%) for males and 7:30 AM to 7:59 AM (46, 71.9%) for females.
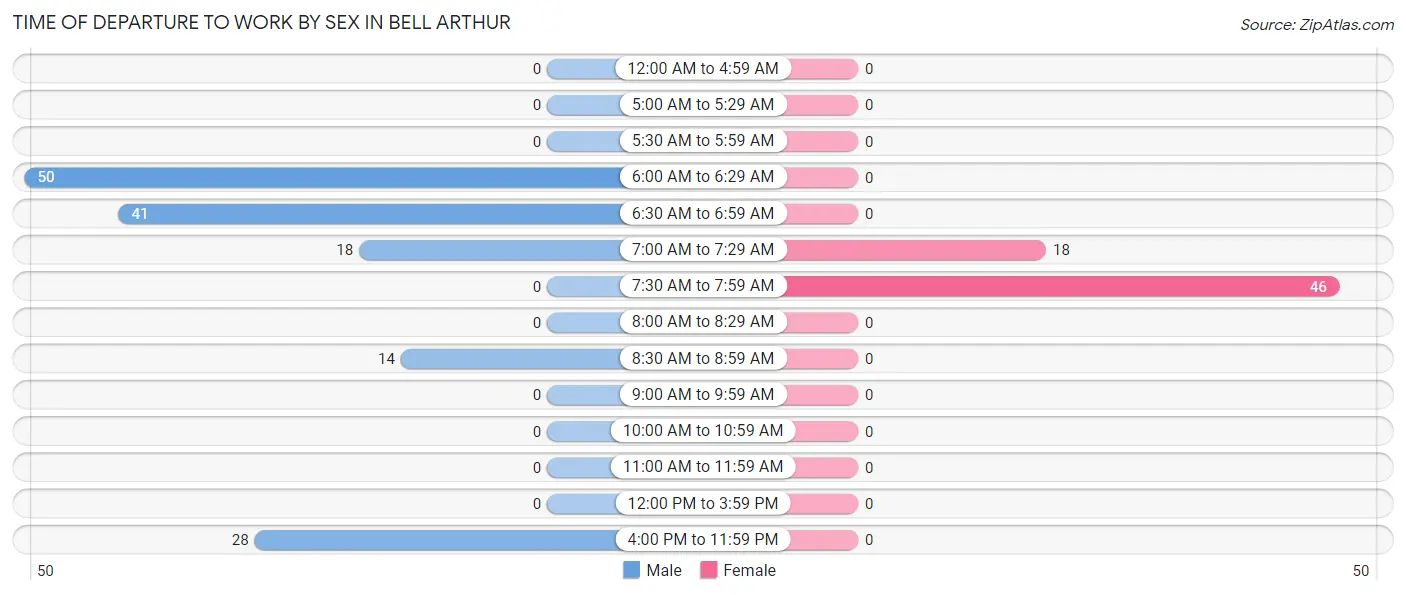
| Time of Departure | Male | Female |
| 12:00 AM to 4:59 AM | 0 (0.0%) | 0 (0.0%) |
| 5:00 AM to 5:29 AM | 0 (0.0%) | 0 (0.0%) |
| 5:30 AM to 5:59 AM | 0 (0.0%) | 0 (0.0%) |
| 6:00 AM to 6:29 AM | 50 (33.1%) | 0 (0.0%) |
| 6:30 AM to 6:59 AM | 41 (27.2%) | 0 (0.0%) |
| 7:00 AM to 7:29 AM | 18 (11.9%) | 18 (28.1%) |
| 7:30 AM to 7:59 AM | 0 (0.0%) | 46 (71.9%) |
| 8:00 AM to 8:29 AM | 0 (0.0%) | 0 (0.0%) |
| 8:30 AM to 8:59 AM | 14 (9.3%) | 0 (0.0%) |
| 9:00 AM to 9:59 AM | 0 (0.0%) | 0 (0.0%) |
| 10:00 AM to 10:59 AM | 0 (0.0%) | 0 (0.0%) |
| 11:00 AM to 11:59 AM | 0 (0.0%) | 0 (0.0%) |
| 12:00 PM to 3:59 PM | 0 (0.0%) | 0 (0.0%) |
| 4:00 PM to 11:59 PM | 28 (18.5%) | 0 (0.0%) |
| Total | 151 (100.0%) | 64 (100.0%) |
Housing Occupancy in Bell Arthur
Occupancy by Ownership in Bell Arthur
Of the total 174 dwellings in Bell Arthur, owner-occupied units account for 92 (52.9%), while renter-occupied units make up 82 (47.1%).
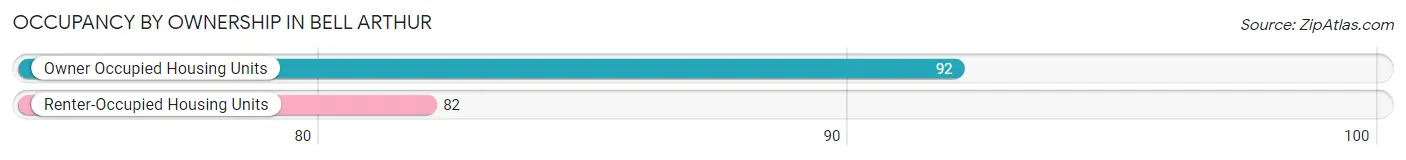
| Occupancy | # Housing Units | % Housing Units |
| Owner Occupied Housing Units | 92 | 52.9% |
| Renter-Occupied Housing Units | 82 | 47.1% |
| Total Occupied Housing Units | 174 | 100.0% |
Occupancy by Household Size in Bell Arthur
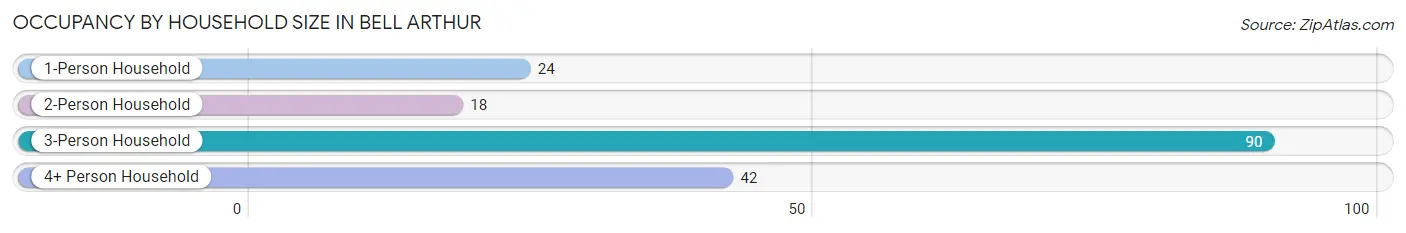
| Household Size | # Housing Units | % Housing Units |
| 1-Person Household | 24 | 13.8% |
| 2-Person Household | 18 | 10.3% |
| 3-Person Household | 90 | 51.7% |
| 4+ Person Household | 42 | 24.1% |
| Total Housing Units | 174 | 100.0% |
Occupancy by Ownership by Household Size in Bell Arthur
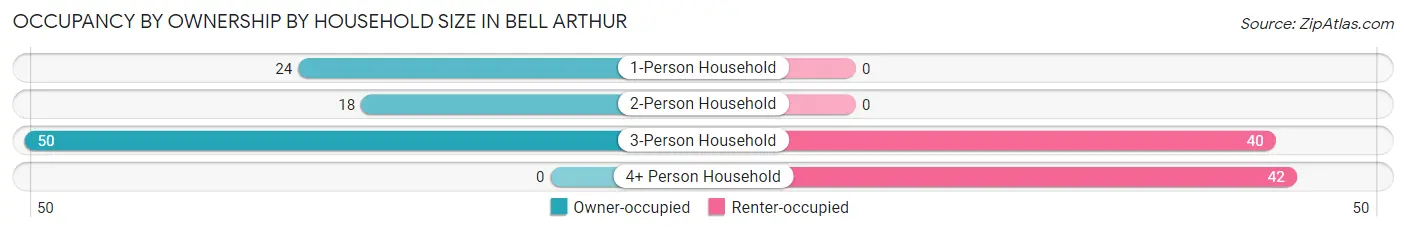
| Household Size | Owner-occupied | Renter-occupied |
| 1-Person Household | 24 (100.0%) | 0 (0.0%) |
| 2-Person Household | 18 (100.0%) | 0 (0.0%) |
| 3-Person Household | 50 (55.6%) | 40 (44.4%) |
| 4+ Person Household | 0 (0.0%) | 42 (100.0%) |
| Total Housing Units | 92 (52.9%) | 82 (47.1%) |
Occupancy by Educational Attainment in Bell Arthur
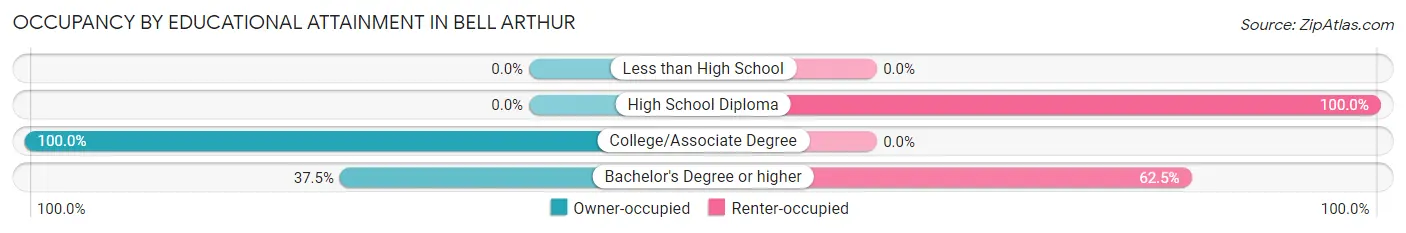
| Household Size | Owner-occupied | Renter-occupied |
| Less than High School | 0 (0.0%) | 0 (0.0%) |
| High School Diploma | 0 (0.0%) | 42 (100.0%) |
| College/Associate Degree | 68 (100.0%) | 0 (0.0%) |
| Bachelor's Degree or higher | 24 (37.5%) | 40 (62.5%) |
Occupancy by Age of Householder in Bell Arthur
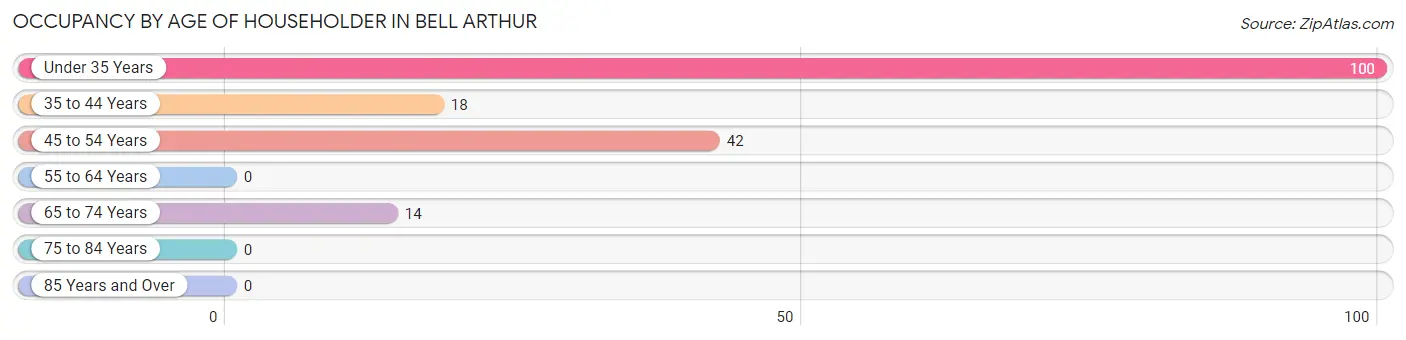
| Age Bracket | # Households | % Households |
| Under 35 Years | 100 | 57.5% |
| 35 to 44 Years | 18 | 10.3% |
| 45 to 54 Years | 42 | 24.1% |
| 55 to 64 Years | 0 | 0.0% |
| 65 to 74 Years | 14 | 8.1% |
| 75 to 84 Years | 0 | 0.0% |
| 85 Years and Over | 0 | 0.0% |
| Total | 174 | 100.0% |
Housing Finances in Bell Arthur
Median Income by Occupancy in Bell Arthur
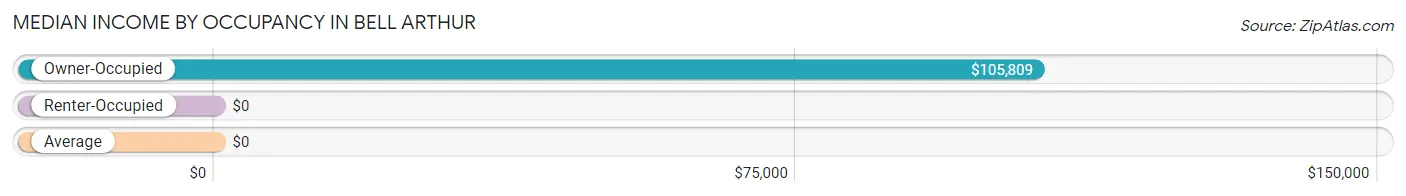
| Occupancy Type | # Households | Median Income |
| Owner-Occupied | 92 (52.9%) | $105,809 |
| Renter-Occupied | 82 (47.1%) | $0 |
| Average | 174 (100.0%) | $0 |
Occupancy by Householder Income Bracket in Bell Arthur
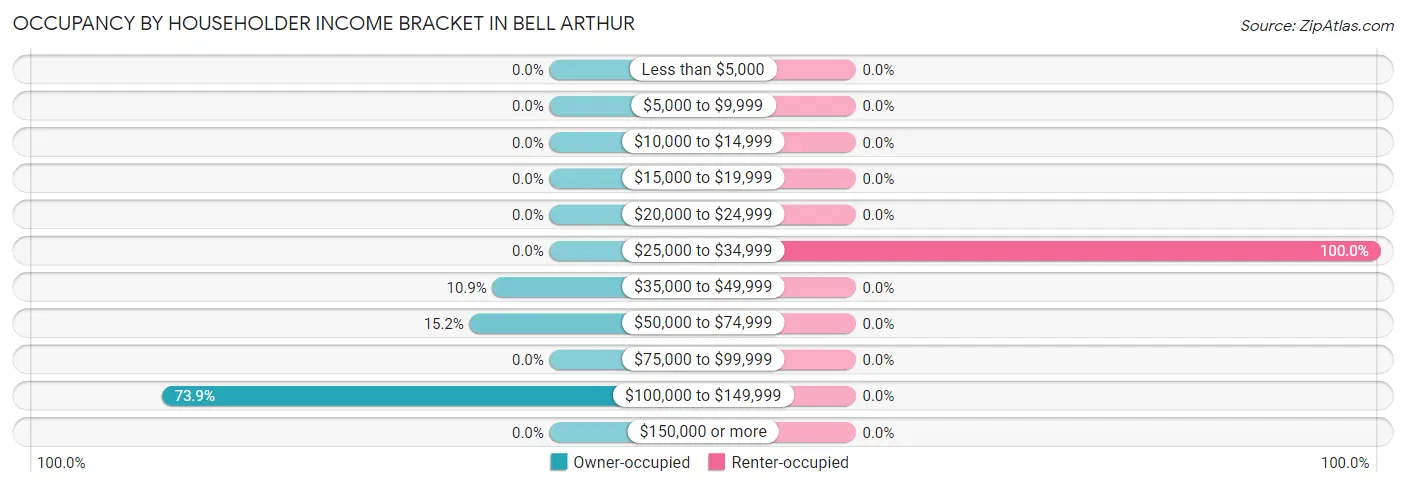
| Income Bracket | Owner-occupied | Renter-occupied |
| Less than $5,000 | 0 (0.0%) | 0 (0.0%) |
| $5,000 to $9,999 | 0 (0.0%) | 0 (0.0%) |
| $10,000 to $14,999 | 0 (0.0%) | 0 (0.0%) |
| $15,000 to $19,999 | 0 (0.0%) | 0 (0.0%) |
| $20,000 to $24,999 | 0 (0.0%) | 0 (0.0%) |
| $25,000 to $34,999 | 0 (0.0%) | 82 (100.0%) |
| $35,000 to $49,999 | 10 (10.9%) | 0 (0.0%) |
| $50,000 to $74,999 | 14 (15.2%) | 0 (0.0%) |
| $75,000 to $99,999 | 0 (0.0%) | 0 (0.0%) |
| $100,000 to $149,999 | 68 (73.9%) | 0 (0.0%) |
| $150,000 or more | 0 (0.0%) | 0 (0.0%) |
| Total | 92 (100.0%) | 82 (100.0%) |
Monthly Housing Cost Tiers in Bell Arthur
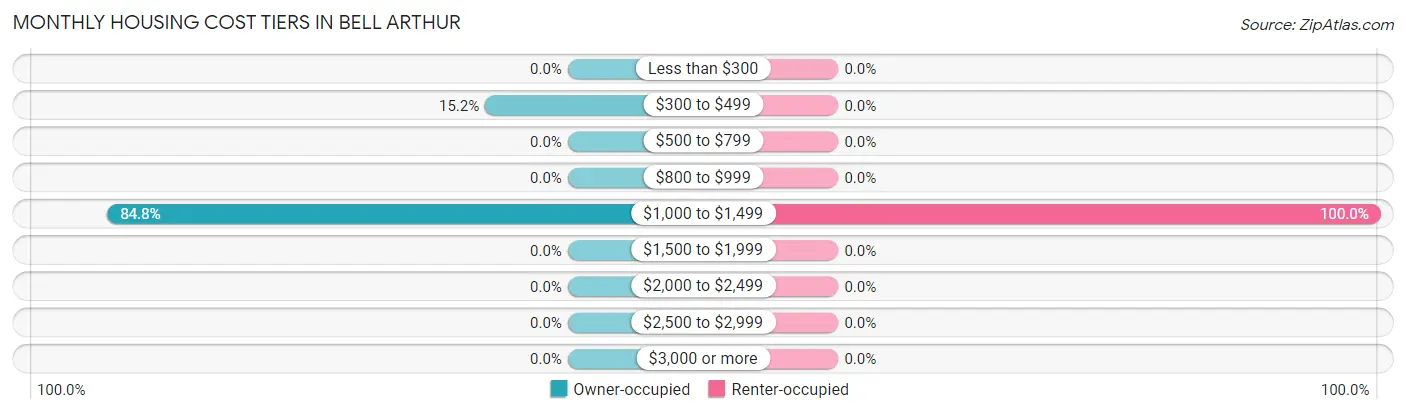
| Monthly Cost | Owner-occupied | Renter-occupied |
| Less than $300 | 0 (0.0%) | 0 (0.0%) |
| $300 to $499 | 14 (15.2%) | 0 (0.0%) |
| $500 to $799 | 0 (0.0%) | 0 (0.0%) |
| $800 to $999 | 0 (0.0%) | 0 (0.0%) |
| $1,000 to $1,499 | 78 (84.8%) | 82 (100.0%) |
| $1,500 to $1,999 | 0 (0.0%) | 0 (0.0%) |
| $2,000 to $2,499 | 0 (0.0%) | 0 (0.0%) |
| $2,500 to $2,999 | 0 (0.0%) | 0 (0.0%) |
| $3,000 or more | 0 (0.0%) | 0 (0.0%) |
| Total | 92 (100.0%) | 82 (100.0%) |
Physical Housing Characteristics in Bell Arthur
Housing Structures in Bell Arthur
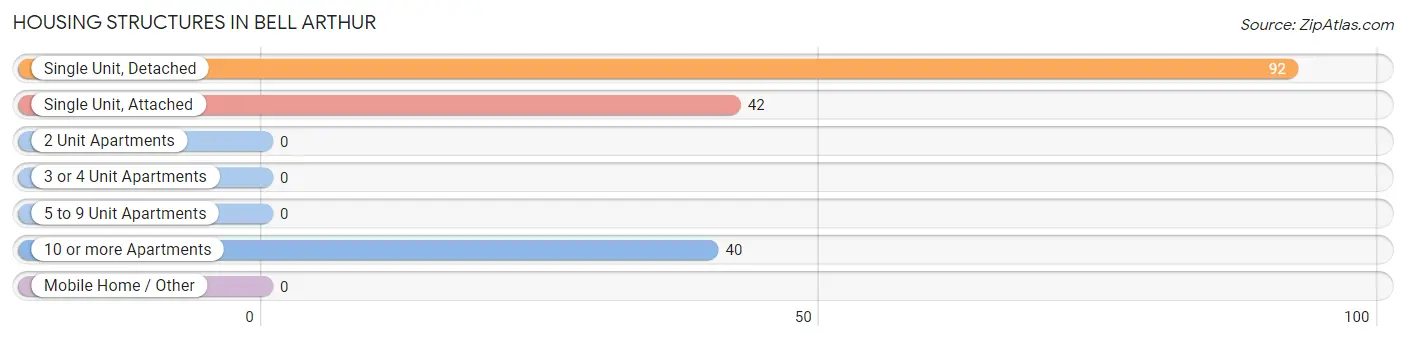
| Structure Type | # Housing Units | % Housing Units |
| Single Unit, Detached | 92 | 52.9% |
| Single Unit, Attached | 42 | 24.1% |
| 2 Unit Apartments | 0 | 0.0% |
| 3 or 4 Unit Apartments | 0 | 0.0% |
| 5 to 9 Unit Apartments | 0 | 0.0% |
| 10 or more Apartments | 40 | 23.0% |
| Mobile Home / Other | 0 | 0.0% |
| Total | 174 | 100.0% |
Housing Structures by Occupancy in Bell Arthur
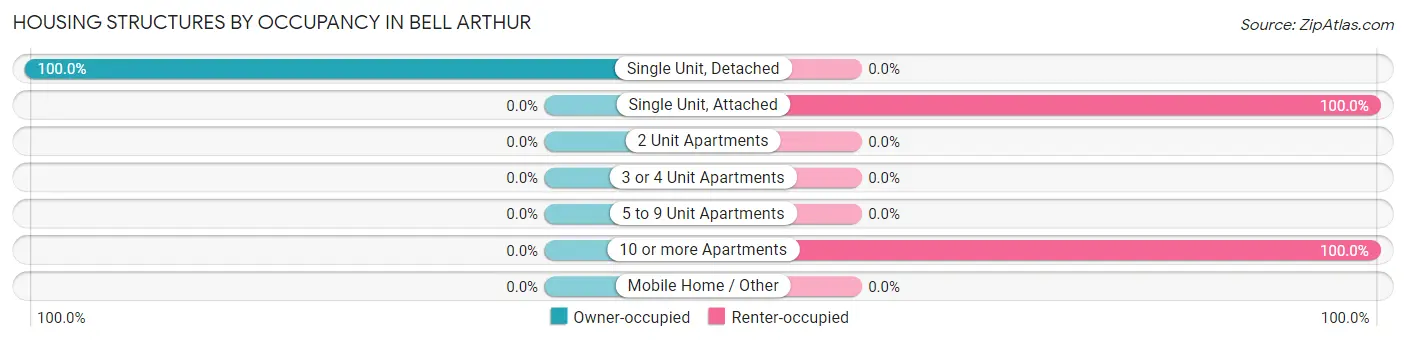
| Structure Type | Owner-occupied | Renter-occupied |
| Single Unit, Detached | 92 (100.0%) | 0 (0.0%) |
| Single Unit, Attached | 0 (0.0%) | 42 (100.0%) |
| 2 Unit Apartments | 0 (0.0%) | 0 (0.0%) |
| 3 or 4 Unit Apartments | 0 (0.0%) | 0 (0.0%) |
| 5 to 9 Unit Apartments | 0 (0.0%) | 0 (0.0%) |
| 10 or more Apartments | 0 (0.0%) | 40 (100.0%) |
| Mobile Home / Other | 0 (0.0%) | 0 (0.0%) |
| Total | 92 (52.9%) | 82 (47.1%) |
Housing Structures by Number of Rooms in Bell Arthur
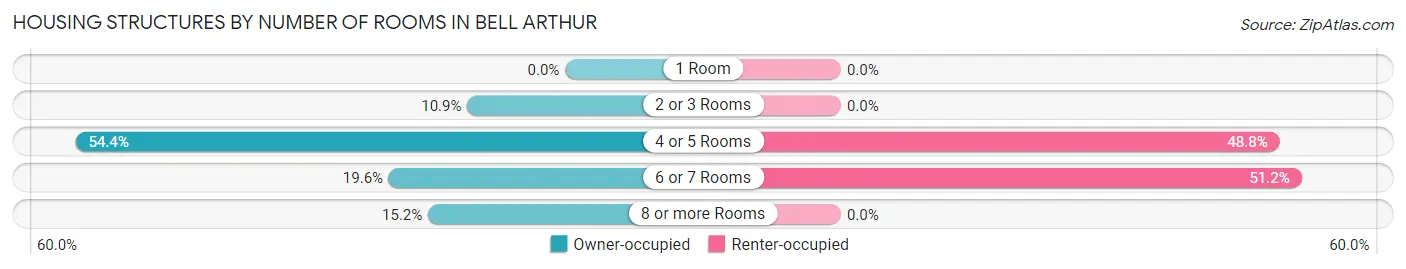
| Number of Rooms | Owner-occupied | Renter-occupied |
| 1 Room | 0 (0.0%) | 0 (0.0%) |
| 2 or 3 Rooms | 10 (10.9%) | 0 (0.0%) |
| 4 or 5 Rooms | 50 (54.3%) | 40 (48.8%) |
| 6 or 7 Rooms | 18 (19.6%) | 42 (51.2%) |
| 8 or more Rooms | 14 (15.2%) | 0 (0.0%) |
| Total | 92 (100.0%) | 82 (100.0%) |
Housing Structure by Heating Type in Bell Arthur
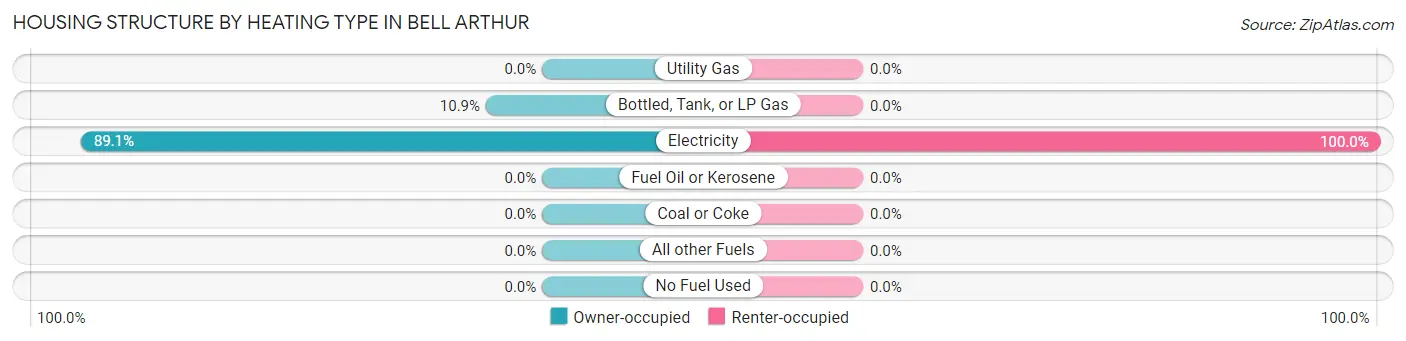
| Heating Type | Owner-occupied | Renter-occupied |
| Utility Gas | 0 (0.0%) | 0 (0.0%) |
| Bottled, Tank, or LP Gas | 10 (10.9%) | 0 (0.0%) |
| Electricity | 82 (89.1%) | 82 (100.0%) |
| Fuel Oil or Kerosene | 0 (0.0%) | 0 (0.0%) |
| Coal or Coke | 0 (0.0%) | 0 (0.0%) |
| All other Fuels | 0 (0.0%) | 0 (0.0%) |
| No Fuel Used | 0 (0.0%) | 0 (0.0%) |
| Total | 92 (100.0%) | 82 (100.0%) |
Household Vehicle Usage in Bell Arthur

| Vehicles per Household | Owner-occupied | Renter-occupied |
| No Vehicle | 0 (0.0%) | 0 (0.0%) |
| 1 Vehicle | 0 (0.0%) | 40 (48.8%) |
| 2 Vehicles | 78 (84.8%) | 0 (0.0%) |
| 3 or more Vehicles | 14 (15.2%) | 42 (51.2%) |
| Total | 92 (100.0%) | 82 (100.0%) |
Real Estate & Mortgages in Bell Arthur
Real Estate and Mortgage Overview in Bell Arthur
| Characteristic | Without Mortgage | With Mortgage |
| Housing Units | 14 | 78 |
| Median Property Value | - | - |
| Median Household Income | - | - |
| Monthly Housing Costs | - | - |
| Real Estate Taxes | - | - |
Property Value by Mortgage Status in Bell Arthur
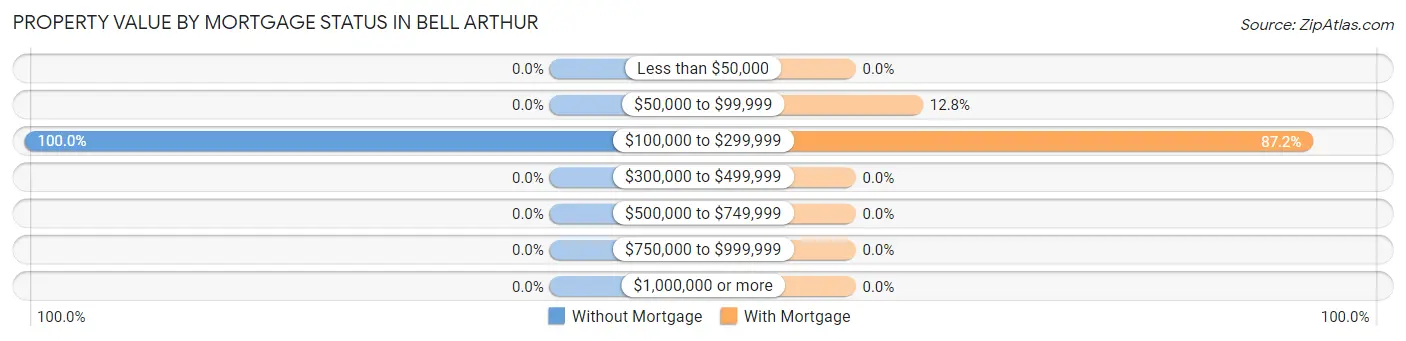
| Property Value | Without Mortgage | With Mortgage |
| Less than $50,000 | 0 (0.0%) | 0 (0.0%) |
| $50,000 to $99,999 | 0 (0.0%) | 10 (12.8%) |
| $100,000 to $299,999 | 14 (100.0%) | 68 (87.2%) |
| $300,000 to $499,999 | 0 (0.0%) | 0 (0.0%) |
| $500,000 to $749,999 | 0 (0.0%) | 0 (0.0%) |
| $750,000 to $999,999 | 0 (0.0%) | 0 (0.0%) |
| $1,000,000 or more | 0 (0.0%) | 0 (0.0%) |
| Total | 14 (100.0%) | 78 (100.0%) |
Household Income by Mortgage Status in Bell Arthur
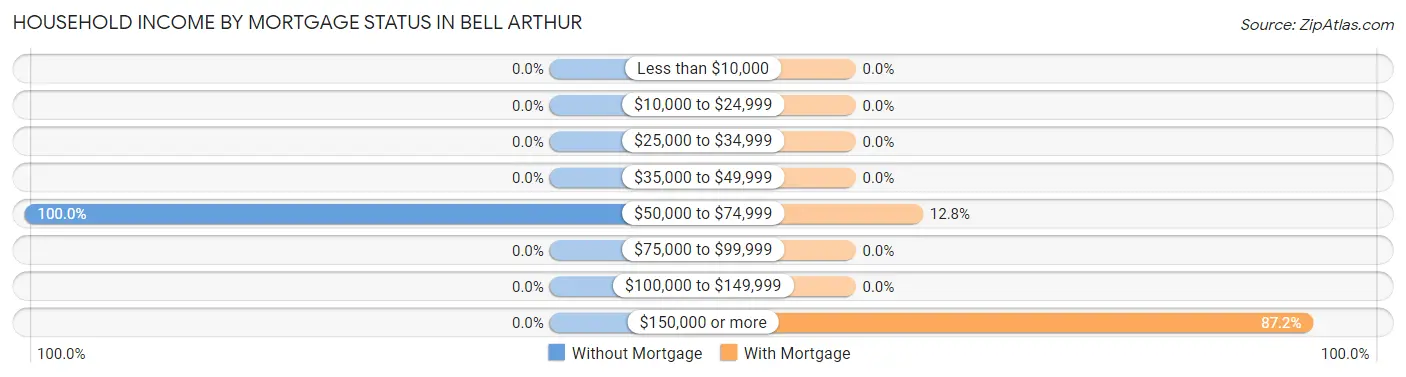
| Household Income | Without Mortgage | With Mortgage |
| Less than $10,000 | 0 (0.0%) | 0 (0.0%) |
| $10,000 to $24,999 | 0 (0.0%) | 0 (0.0%) |
| $25,000 to $34,999 | 0 (0.0%) | 0 (0.0%) |
| $35,000 to $49,999 | 0 (0.0%) | 0 (0.0%) |
| $50,000 to $74,999 | 14 (100.0%) | 10 (12.8%) |
| $75,000 to $99,999 | 0 (0.0%) | 0 (0.0%) |
| $100,000 to $149,999 | 0 (0.0%) | 0 (0.0%) |
| $150,000 or more | 0 (0.0%) | 68 (87.2%) |
| Total | 14 (100.0%) | 78 (100.0%) |
Property Value to Household Income Ratio in Bell Arthur
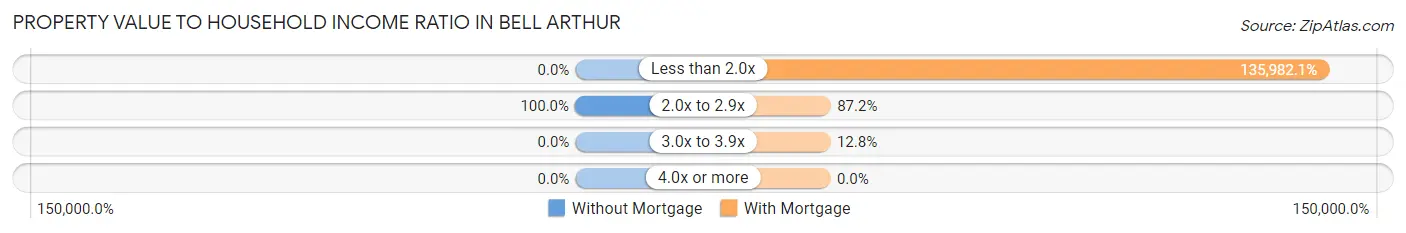
| Value-to-Income Ratio | Without Mortgage | With Mortgage |
| Less than 2.0x | 0 (0.0%) | 106,066 (135,982.1%) |
| 2.0x to 2.9x | 14 (100.0%) | 68 (87.2%) |
| 3.0x to 3.9x | 0 (0.0%) | 10 (12.8%) |
| 4.0x or more | 0 (0.0%) | 0 (0.0%) |
| Total | 14 (100.0%) | 78 (100.0%) |
Real Estate Taxes by Mortgage Status in Bell Arthur
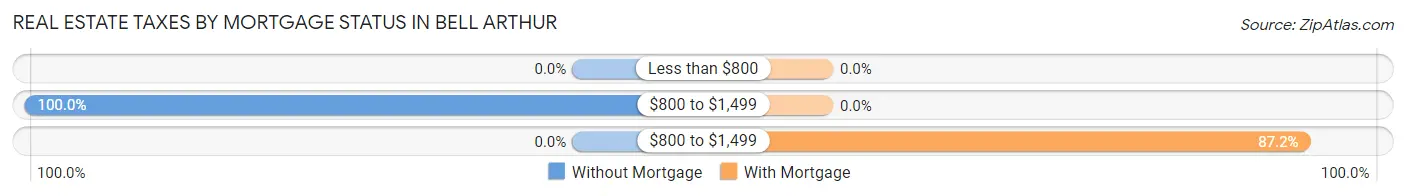
| Property Taxes | Without Mortgage | With Mortgage |
| Less than $800 | 0 (0.0%) | 0 (0.0%) |
| $800 to $1,499 | 14 (100.0%) | 0 (0.0%) |
| $800 to $1,499 | 0 (0.0%) | 68 (87.2%) |
| Total | 14 (100.0%) | 78 (100.0%) |
Health & Disability in Bell Arthur
Health Insurance Coverage by Age in Bell Arthur
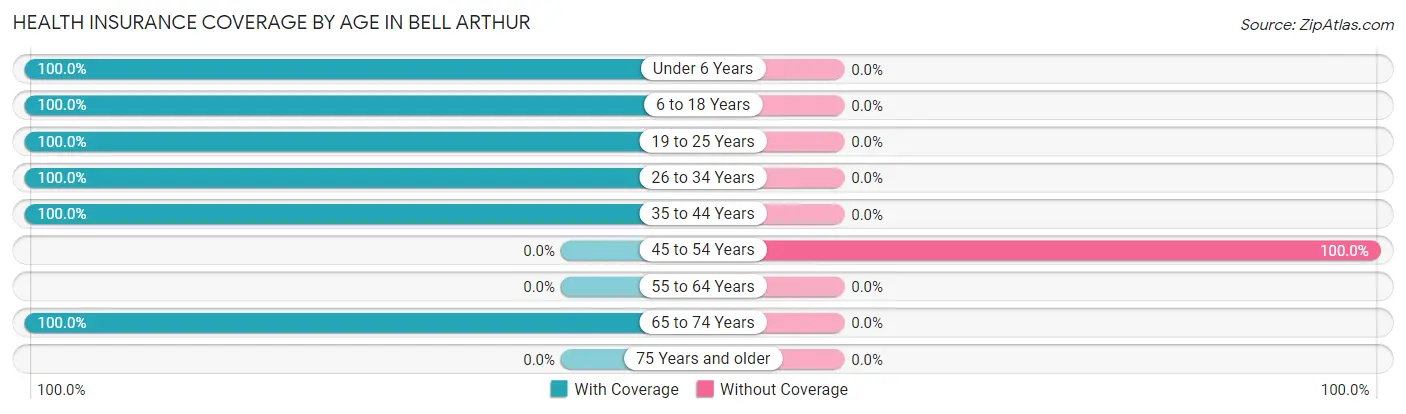
| Age Bracket | With Coverage | Without Coverage |
| Under 6 Years | 89 (100.0%) | 0 (0.0%) |
| 6 to 18 Years | 133 (100.0%) | 0 (0.0%) |
| 19 to 25 Years | 18 (100.0%) | 0 (0.0%) |
| 26 to 34 Years | 177 (100.0%) | 0 (0.0%) |
| 35 to 44 Years | 18 (100.0%) | 0 (0.0%) |
| 45 to 54 Years | 0 (0.0%) | 42 (100.0%) |
| 55 to 64 Years | 0 (0.0%) | 0 (0.0%) |
| 65 to 74 Years | 14 (100.0%) | 0 (0.0%) |
| 75 Years and older | 0 (0.0%) | 0 (0.0%) |
| Total | 449 (91.4%) | 42 (8.6%) |
Health Insurance Coverage by Citizenship Status in Bell Arthur
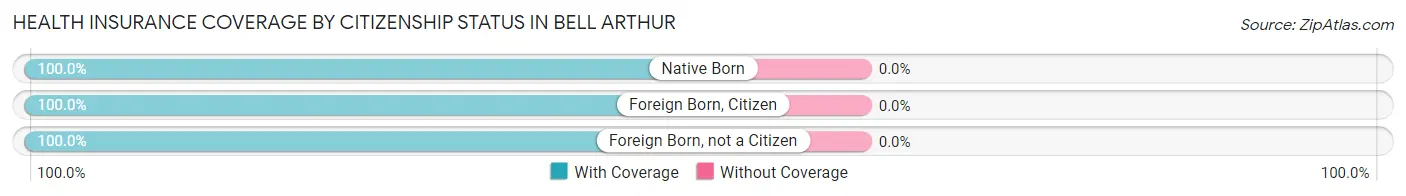
| Citizenship Status | With Coverage | Without Coverage |
| Native Born | 89 (100.0%) | 0 (0.0%) |
| Foreign Born, Citizen | 133 (100.0%) | 0 (0.0%) |
| Foreign Born, not a Citizen | 18 (100.0%) | 0 (0.0%) |
Health Insurance Coverage by Household Income in Bell Arthur
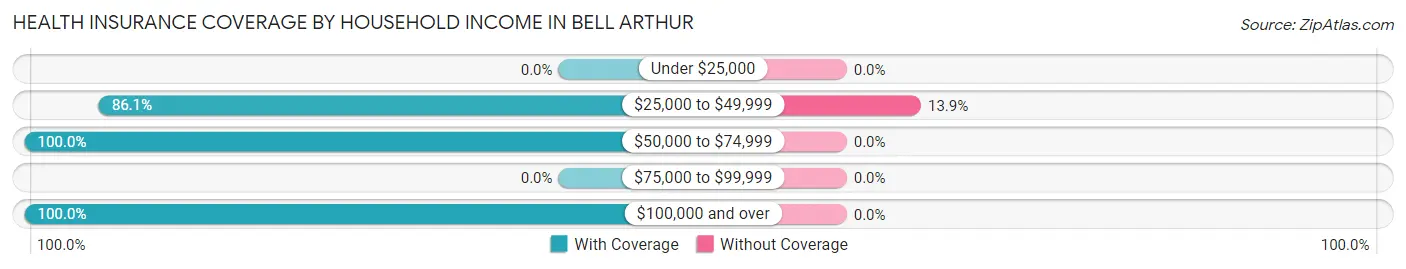
| Household Income | With Coverage | Without Coverage |
| Under $25,000 | 0 (0.0%) | 0 (0.0%) |
| $25,000 to $49,999 | 260 (86.1%) | 42 (13.9%) |
| $50,000 to $74,999 | 14 (100.0%) | 0 (0.0%) |
| $75,000 to $99,999 | 0 (0.0%) | 0 (0.0%) |
| $100,000 and over | 175 (100.0%) | 0 (0.0%) |
Public vs Private Health Insurance Coverage by Age in Bell Arthur
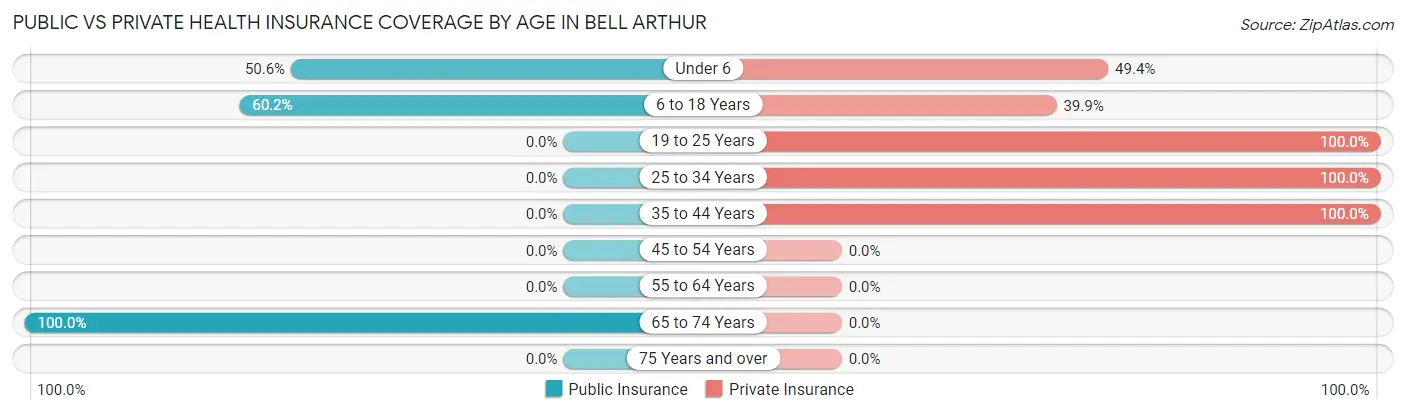
| Age Bracket | Public Insurance | Private Insurance |
| Under 6 | 45 (50.6%) | 44 (49.4%) |
| 6 to 18 Years | 80 (60.2%) | 53 (39.9%) |
| 19 to 25 Years | 0 (0.0%) | 18 (100.0%) |
| 25 to 34 Years | 0 (0.0%) | 177 (100.0%) |
| 35 to 44 Years | 0 (0.0%) | 18 (100.0%) |
| 45 to 54 Years | 0 (0.0%) | 0 (0.0%) |
| 55 to 64 Years | 0 (0.0%) | 0 (0.0%) |
| 65 to 74 Years | 14 (100.0%) | 0 (0.0%) |
| 75 Years and over | 0 (0.0%) | 0 (0.0%) |
| Total | 139 (28.3%) | 310 (63.1%) |
Disability Status by Sex by Age in Bell Arthur
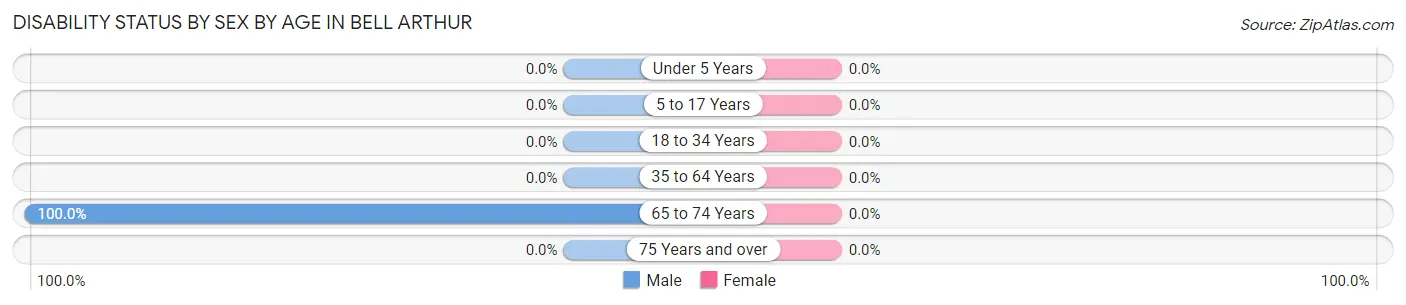
| Age Bracket | Male | Female |
| Under 5 Years | 0 (0.0%) | 0 (0.0%) |
| 5 to 17 Years | 0 (0.0%) | 0 (0.0%) |
| 18 to 34 Years | 0 (0.0%) | 0 (0.0%) |
| 35 to 64 Years | 0 (0.0%) | 0 (0.0%) |
| 65 to 74 Years | 14 (100.0%) | 0 (0.0%) |
| 75 Years and over | 0 (0.0%) | 0 (0.0%) |
Disability Class by Sex by Age in Bell Arthur
Disability Class: Hearing Difficulty
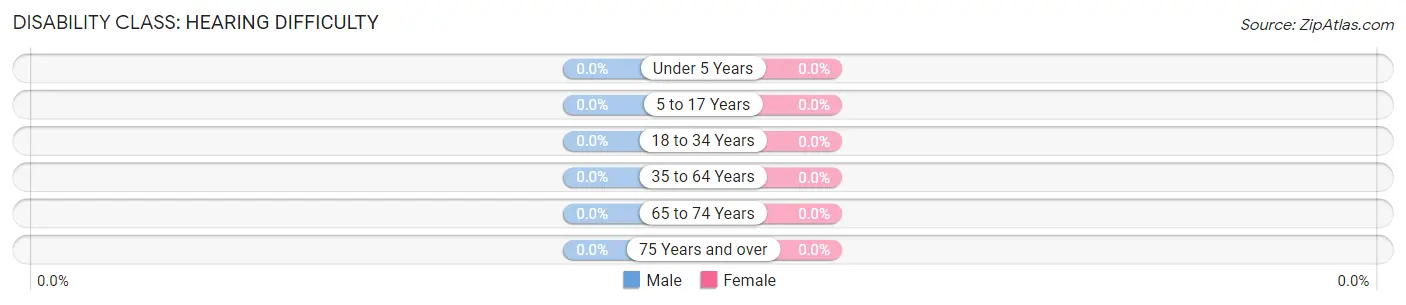
| Age Bracket | Male | Female |
| Under 5 Years | 0 (0.0%) | 0 (0.0%) |
| 5 to 17 Years | 0 (0.0%) | 0 (0.0%) |
| 18 to 34 Years | 0 (0.0%) | 0 (0.0%) |
| 35 to 64 Years | 0 (0.0%) | 0 (0.0%) |
| 65 to 74 Years | 0 (0.0%) | 0 (0.0%) |
| 75 Years and over | 0 (0.0%) | 0 (0.0%) |
Disability Class: Vision Difficulty
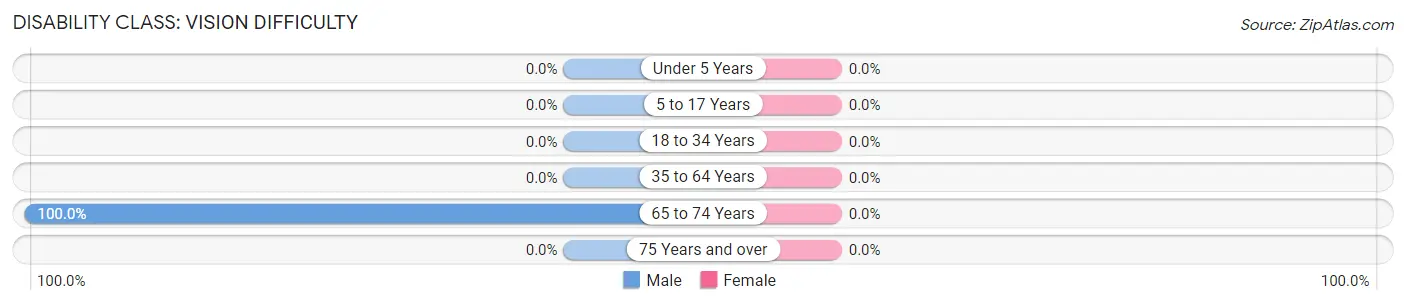
| Age Bracket | Male | Female |
| Under 5 Years | 0 (0.0%) | 0 (0.0%) |
| 5 to 17 Years | 0 (0.0%) | 0 (0.0%) |
| 18 to 34 Years | 0 (0.0%) | 0 (0.0%) |
| 35 to 64 Years | 0 (0.0%) | 0 (0.0%) |
| 65 to 74 Years | 14 (100.0%) | 0 (0.0%) |
| 75 Years and over | 0 (0.0%) | 0 (0.0%) |
Disability Class: Cognitive Difficulty
| Age Bracket | Male | Female |
| 5 to 17 Years | 0 (0.0%) | 0 (0.0%) |
| 18 to 34 Years | 0 (0.0%) | 0 (0.0%) |
| 35 to 64 Years | 0 (0.0%) | 0 (0.0%) |
| 65 to 74 Years | 0 (0.0%) | 0 (0.0%) |
| 75 Years and over | 0 (0.0%) | 0 (0.0%) |
Disability Class: Ambulatory Difficulty
| Age Bracket | Male | Female |
| 5 to 17 Years | 0 (0.0%) | 0 (0.0%) |
| 18 to 34 Years | 0 (0.0%) | 0 (0.0%) |
| 35 to 64 Years | 0 (0.0%) | 0 (0.0%) |
| 65 to 74 Years | 0 (0.0%) | 0 (0.0%) |
| 75 Years and over | 0 (0.0%) | 0 (0.0%) |
Disability Class: Self-Care Difficulty
| Age Bracket | Male | Female |
| 5 to 17 Years | 0 (0.0%) | 0 (0.0%) |
| 18 to 34 Years | 0 (0.0%) | 0 (0.0%) |
| 35 to 64 Years | 0 (0.0%) | 0 (0.0%) |
| 65 to 74 Years | 0 (0.0%) | 0 (0.0%) |
| 75 Years and over | 0 (0.0%) | 0 (0.0%) |
Technology Access in Bell Arthur
Computing Device Access in Bell Arthur
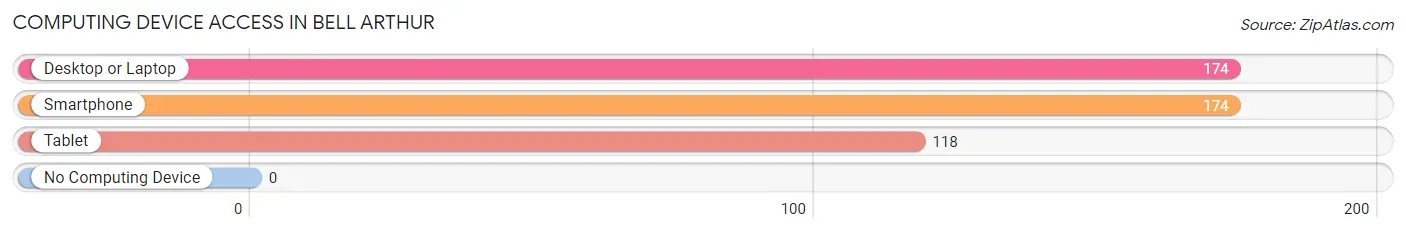
| Device Type | # Households | % Households |
| Desktop or Laptop | 174 | 100.0% |
| Smartphone | 174 | 100.0% |
| Tablet | 118 | 67.8% |
| No Computing Device | 0 | 0.0% |
| Total | 174 | 100.0% |
Internet Access in Bell Arthur
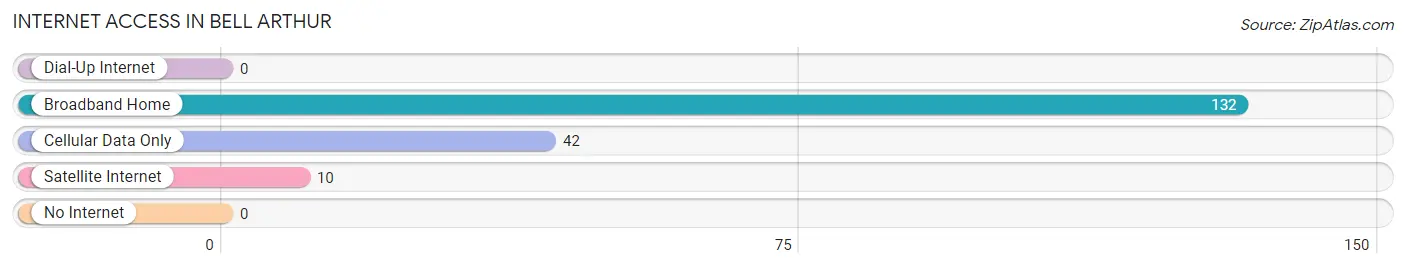
| Internet Type | # Households | % Households |
| Dial-Up Internet | 0 | 0.0% |
| Broadband Home | 132 | 75.9% |
| Cellular Data Only | 42 | 24.1% |
| Satellite Internet | 10 | 5.8% |
| No Internet | 0 | 0.0% |
| Total | 174 | 100.0% |
Bell Arthur Summary
Arthur, North Carolina is a small town located in the western part of the state, in the foothills of the Blue Ridge Mountains. It is situated in the Catawba River Valley, and is part of the Hickory-Lenoir-Morganton Metropolitan Statistical Area. The town was founded in 1891 and has a population of approximately 1,000 people.
Geography
Arthur is located in the foothills of the Blue Ridge Mountains, in the Catawba River Valley. The town is situated at an elevation of 1,000 feet above sea level. The town is surrounded by rolling hills and is located near the Catawba River. The town is located approximately 25 miles from the city of Hickory and approximately 40 miles from the city of Charlotte.
Climate
Arthur has a humid subtropical climate, with hot, humid summers and mild winters. The average annual temperature is around 60 degrees Fahrenheit. The average annual precipitation is around 45 inches.
Demographics
As of the 2010 census, the population of Arthur was 1,000 people. The racial makeup of the town was 97.2% White, 0.7% African American, 0.3% Native American, 0.2% Asian, 0.1% Pacific Islander, 0.7% from other races, and 0.9% from two or more races. Hispanic or Latino of any race were 1.3% of the population.
Economy
The economy of Arthur is largely based on agriculture and tourism. The town is home to several farms, which produce a variety of crops, including corn, soybeans, wheat, and hay. The town is also home to several small businesses, including restaurants, retail stores, and service providers.
Tourism is an important part of the economy of Arthur. The town is home to several attractions, including the Catawba River, the Hickory Motor Speedway, and the Hickory Motor Speedway Museum. The town also hosts several festivals and events throughout the year, including the Catawba Valley Bluegrass Festival and the Catawba Valley Apple Festival.
History
Arthur was founded in 1891 by a group of settlers from the nearby town of Hickory. The town was named after Arthur B. Smith, a local businessman and landowner. The town was incorporated in 1895 and has remained relatively unchanged since then.
In the early 20th century, Arthur was a thriving agricultural community. The town was home to several farms, which produced a variety of crops, including corn, soybeans, wheat, and hay. The town also had several small businesses, including restaurants, retail stores, and service providers.
In the late 20th century, the economy of Arthur shifted from agriculture to tourism. The town is now home to several attractions, including the Catawba River, the Hickory Motor Speedway, and the Hickory Motor Speedway Museum. The town also hosts several festivals and events throughout the year, including the Catawba Valley Bluegrass Festival and the Catawba Valley Apple Festival.
Conclusion
Arthur, North Carolina is a small town located in the western part of the state, in the foothills of the Blue Ridge Mountains. It is situated in the Catawba River Valley, and is part of the Hickory-Lenoir-Morganton Metropolitan Statistical Area. The town was founded in 1891 and has a population of approximately 1,000 people. The economy of Arthur is largely based on agriculture and tourism. The town is home to several farms, which produce a variety of crops, including corn, soybeans, wheat, and hay. The town is also home to several attractions, including the Catawba River, the Hickory Motor Speedway, and the Hickory Motor Speedway Museum. The town also hosts several festivals and events throughout the year, including the Catawba Valley Bluegrass Festival and the Catawba Valley Apple Festival.
Common Questions
What is Per Capita Income in Bell Arthur?
Per Capita income in Bell Arthur is $21,113.
What is Inequality or Gini Index in Bell Arthur?
Inequality or Gini Index in Bell Arthur is 0.29.
What is the Total Population of Bell Arthur?
Total Population of Bell Arthur is 491.
What is the Total Male Population of Bell Arthur?
Total Male Population of Bell Arthur is 249.
What is the Total Female Population of Bell Arthur?
Total Female Population of Bell Arthur is 242.
What is the Ratio of Males per 100 Females in Bell Arthur?
There are 102.89 Males per 100 Females in Bell Arthur.
What is the Ratio of Females per 100 Males in Bell Arthur?
There are 97.19 Females per 100 Males in Bell Arthur.
What is the Median Population Age in Bell Arthur?
Median Population Age in Bell Arthur is 29.1 Years.
What is the Average Family Size in Bell Arthur
Average Family Size in Bell Arthur is 3.3 People.
What is the Average Household Size in Bell Arthur
Average Household Size in Bell Arthur is 2.8 People.
How Large is the Labor Force in Bell Arthur?
There are 257 People in the Labor Forcein in Bell Arthur.
What is the Percentage of People in the Labor Force in Bell Arthur?
73.6% of People are in the Labor Force in Bell Arthur.
What is the Unemployment Rate in Bell Arthur?
Unemployment Rate in Bell Arthur is 16.3%.