Zip Codes with the Highest Percentage of Population with a Degree in Liberal Arts and History in Clayton, NC
RELATED REPORTS & OPTIONS
Liberal Arts and History
Clayton
Compare Zip Codes
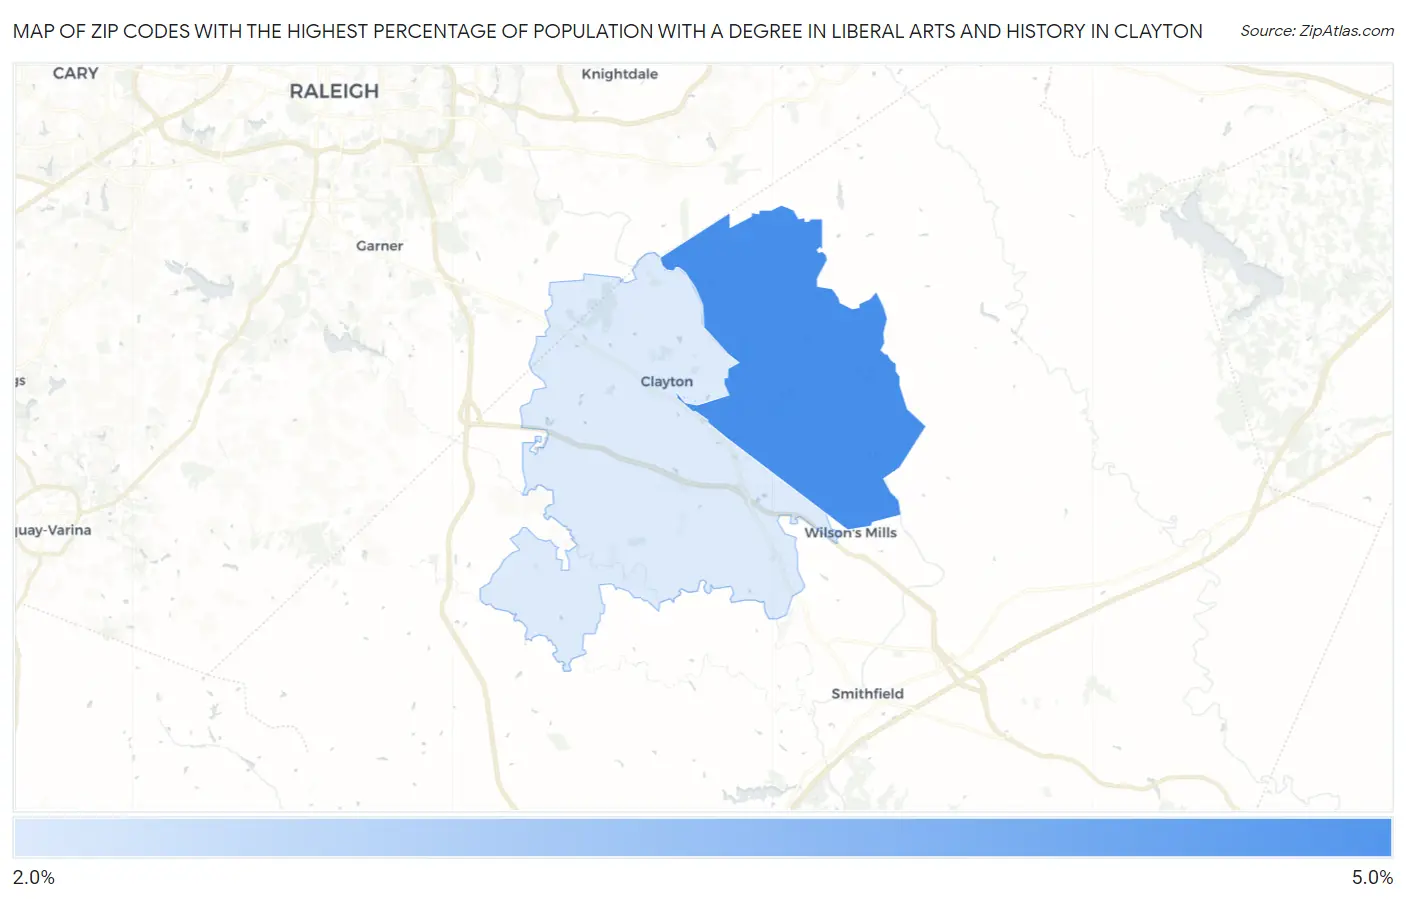
Map of Zip Codes with the Highest Percentage of Population with a Degree in Liberal Arts and History in Clayton
2.9%
4.2%
Zip Codes with the Highest Percentage of Population with a Degree in Liberal Arts and History in Clayton, NC
| Zip Code | % Graduates | vs State | vs National | |
| 1. | 27527 | 4.2% | 4.9%(-0.719)#417 | 4.9%(-0.691)#14,088 |
| 2. | 27520 | 2.9% | 4.9%(-1.96)#524 | 4.9%(-1.93)#18,546 |
1
Common Questions
What are the Top Zip Codes with the Highest Percentage of Population with a Degree in Liberal Arts and History in Clayton, NC?
Top Zip Codes with the Highest Percentage of Population with a Degree in Liberal Arts and History in Clayton, NC are:
What zip code has the Highest Percentage of Population with a Degree in Liberal Arts and History in Clayton, NC?
27527 has the Highest Percentage of Population with a Degree in Liberal Arts and History in Clayton, NC with 4.2%.
What is the Percentage of Population with a Degree in Liberal Arts and History in Clayton, NC?
Percentage of Population with a Degree in Liberal Arts and History in Clayton is 6.0%.
What is the Percentage of Population with a Degree in Liberal Arts and History in North Carolina?
Percentage of Population with a Degree in Liberal Arts and History in North Carolina is 4.9%.
What is the Percentage of Population with a Degree in Liberal Arts and History in the United States?
Percentage of Population with a Degree in Liberal Arts and History in the United States is 4.9%.