Zip Codes with the Highest Percentage of Population with a Degree in Liberal Arts and History in Fort Bragg, NC
RELATED REPORTS & OPTIONS
Liberal Arts and History
Fort Bragg
Compare Zip Codes
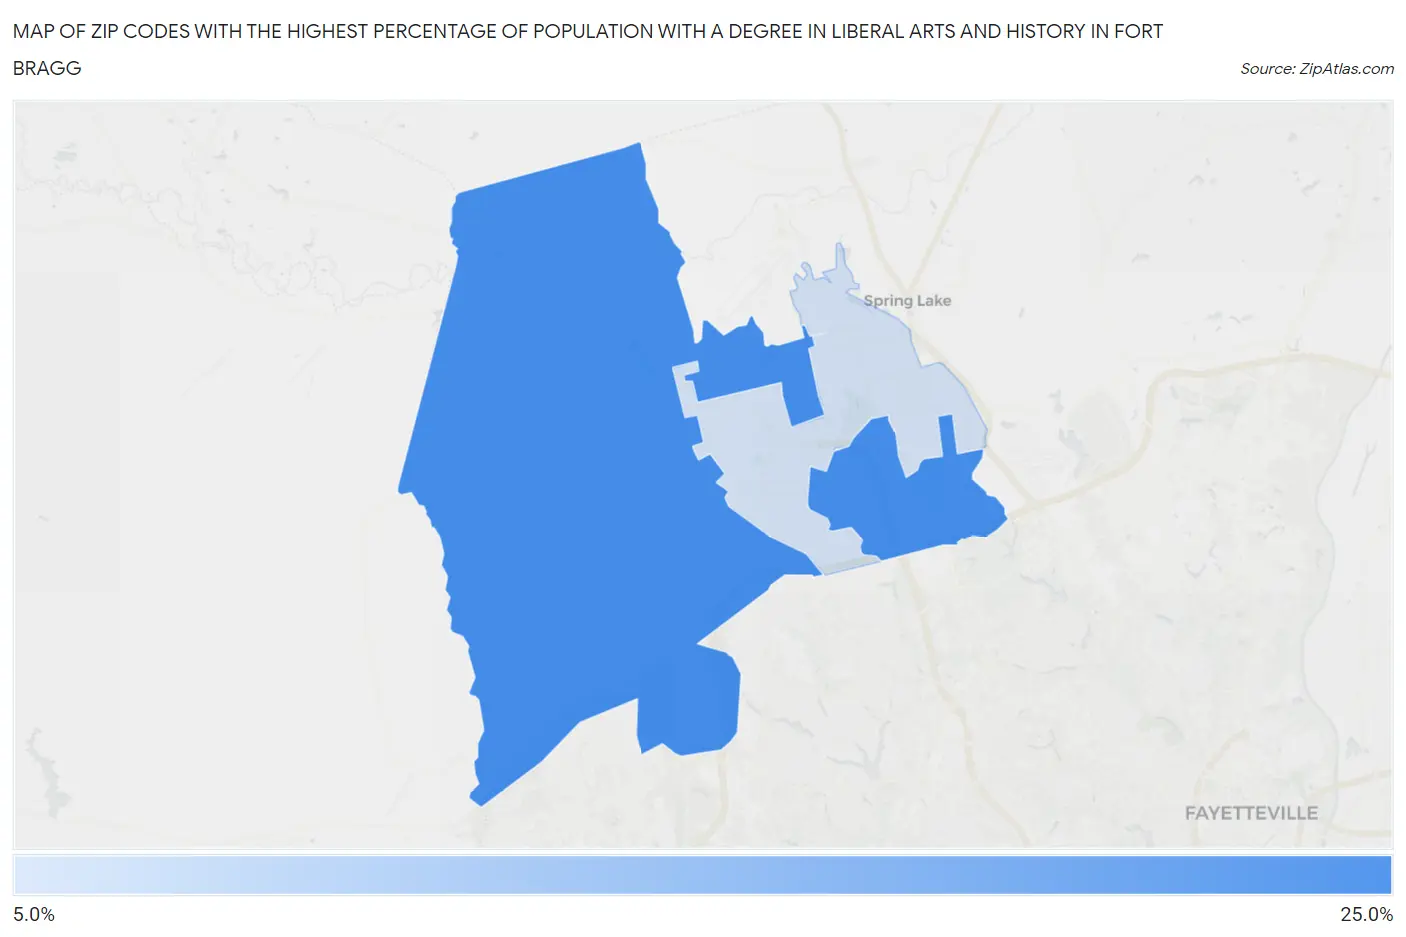
Map of Zip Codes with the Highest Percentage of Population with a Degree in Liberal Arts and History in Fort Bragg
6.4%
23.4%
Zip Codes with the Highest Percentage of Population with a Degree in Liberal Arts and History in Fort Bragg, NC
| Zip Code | % Graduates | vs State | vs National | |
| 1. | 28310 | 23.4% | 4.9%(+18.5)#18 | 4.9%(+18.5)#659 |
| 2. | 28307 | 6.4% | 4.9%(+1.51)#214 | 4.9%(+1.54)#7,547 |
1
Common Questions
What are the Top Zip Codes with the Highest Percentage of Population with a Degree in Liberal Arts and History in Fort Bragg, NC?
Top Zip Codes with the Highest Percentage of Population with a Degree in Liberal Arts and History in Fort Bragg, NC are:
What zip code has the Highest Percentage of Population with a Degree in Liberal Arts and History in Fort Bragg, NC?
28310 has the Highest Percentage of Population with a Degree in Liberal Arts and History in Fort Bragg, NC with 23.4%.
What is the Percentage of Population with a Degree in Liberal Arts and History in North Carolina?
Percentage of Population with a Degree in Liberal Arts and History in North Carolina is 4.9%.
What is the Percentage of Population with a Degree in Liberal Arts and History in the United States?
Percentage of Population with a Degree in Liberal Arts and History in the United States is 4.9%.