Zip Codes with the Highest Percentage of Population with a Degree in Liberal Arts and History in Mooresville, NC
RELATED REPORTS & OPTIONS
Liberal Arts and History
Mooresville
Compare Zip Codes
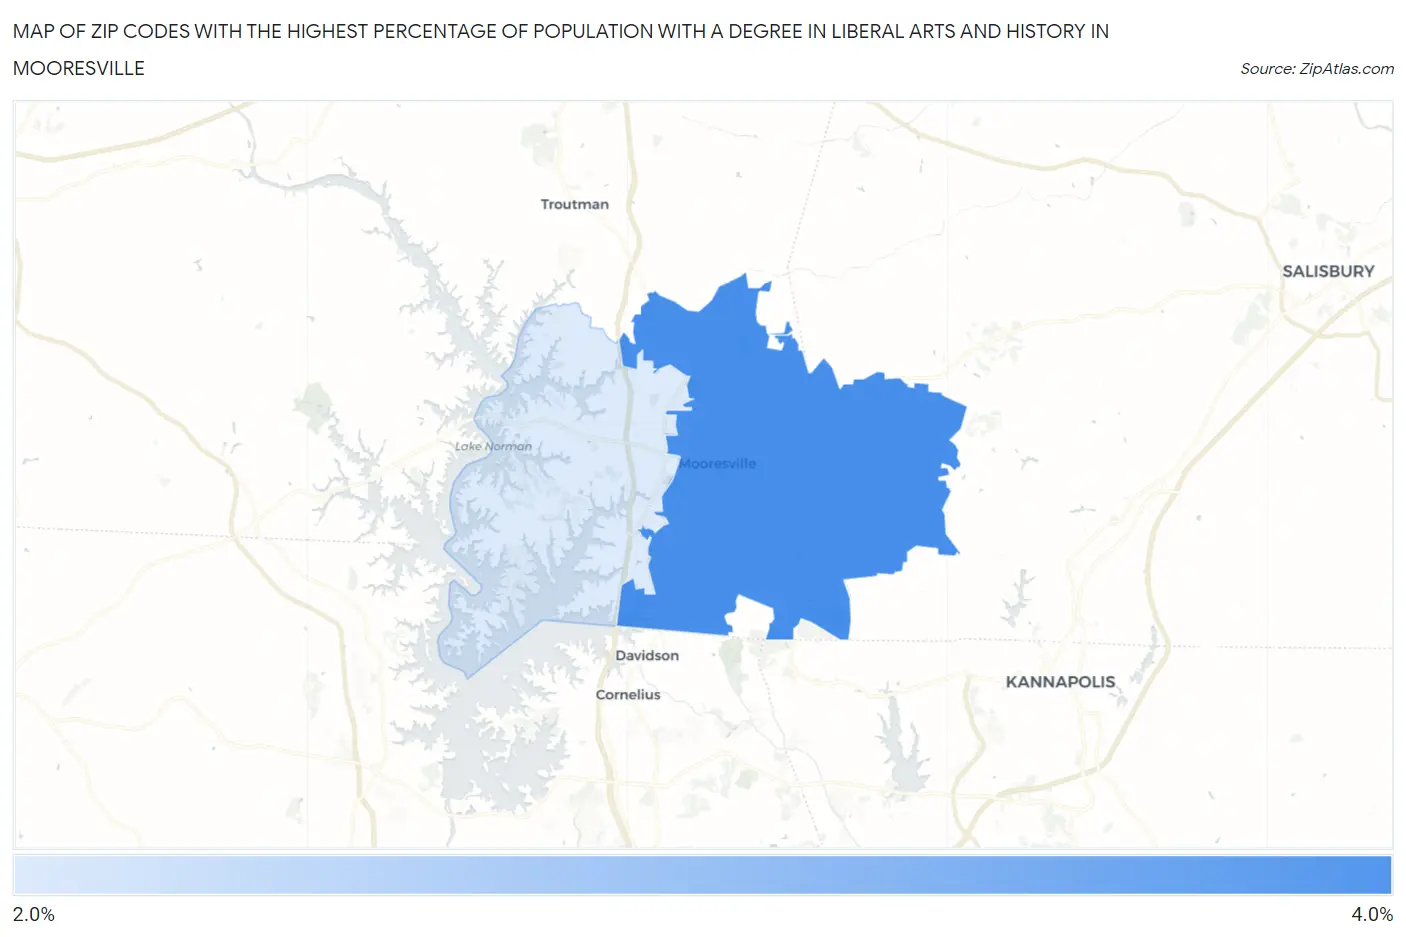
Map of Zip Codes with the Highest Percentage of Population with a Degree in Liberal Arts and History in Mooresville
2.9%
3.3%
Zip Codes with the Highest Percentage of Population with a Degree in Liberal Arts and History in Mooresville, NC
| Zip Code | % Graduates | vs State | vs National | |
| 1. | 28115 | 3.3% | 4.9%(-1.62)#504 | 4.9%(-1.59)#17,380 |
| 2. | 28117 | 2.9% | 4.9%(-2.01)#529 | 4.9%(-1.98)#18,713 |
1
Common Questions
What are the Top Zip Codes with the Highest Percentage of Population with a Degree in Liberal Arts and History in Mooresville, NC?
Top Zip Codes with the Highest Percentage of Population with a Degree in Liberal Arts and History in Mooresville, NC are:
What zip code has the Highest Percentage of Population with a Degree in Liberal Arts and History in Mooresville, NC?
28115 has the Highest Percentage of Population with a Degree in Liberal Arts and History in Mooresville, NC with 3.3%.
What is the Percentage of Population with a Degree in Liberal Arts and History in Mooresville, NC?
Percentage of Population with a Degree in Liberal Arts and History in Mooresville is 2.8%.
What is the Percentage of Population with a Degree in Liberal Arts and History in North Carolina?
Percentage of Population with a Degree in Liberal Arts and History in North Carolina is 4.9%.
What is the Percentage of Population with a Degree in Liberal Arts and History in the United States?
Percentage of Population with a Degree in Liberal Arts and History in the United States is 4.9%.