Asheboro, NC Map & Demographics
Asheboro Map
Asheboro Overview
$24,408
PER CAPITA INCOME
$53,327
AVG FAMILY INCOME
$44,405
AVG HOUSEHOLD INCOME
18.7%
WAGE / INCOME GAP [ % ]
81.3¢/ $1
WAGE / INCOME GAP [ $ ]
$11,755
FAMILY INCOME DEFICIT
0.43
INEQUALITY / GINI INDEX
27,117
TOTAL POPULATION
13,816
MALE POPULATION
13,301
FEMALE POPULATION
103.87
MALES / 100 FEMALES
96.27
FEMALES / 100 MALES
36.0
MEDIAN AGE
3.2
AVG FAMILY SIZE
2.4
AVG HOUSEHOLD SIZE
12,116
LABOR FORCE [ PEOPLE ]
57.8%
PERCENT IN LABOR FORCE
5.5%
UNEMPLOYMENT RATE
Asheboro Area Codes
Income in Asheboro
Income Overview in Asheboro
Per Capita Income in Asheboro is $24,408, while median incomes of families and households are $53,327 and $44,405 respectively.
| Characteristic | Number | Measure |
| Per Capita Income | 27,117 | $24,408 |
| Median Family Income | 6,314 | $53,327 |
| Mean Family Income | 6,314 | $67,517 |
| Median Household Income | 11,084 | $44,405 |
| Mean Household Income | 11,084 | $57,960 |
| Income Deficit | 6,314 | $11,755 |
| Wage / Income Gap (%) | 27,117 | 18.68% |
| Wage / Income Gap ($) | 27,117 | 81.32¢ per $1 |
| Gini / Inequality Index | 27,117 | 0.43 |
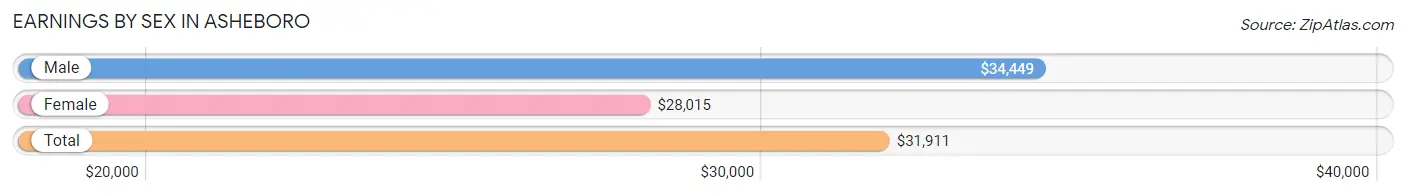
Earnings by Sex in Asheboro
Average Earnings in Asheboro are $31,911, $34,449 for men and $28,015 for women, a difference of 18.7%.
| Sex | Number | Average Earnings |
| Male | 6,867 (54.4%) | $34,449 |
| Female | 5,756 (45.6%) | $28,015 |
| Total | 12,623 (100.0%) | $31,911 |
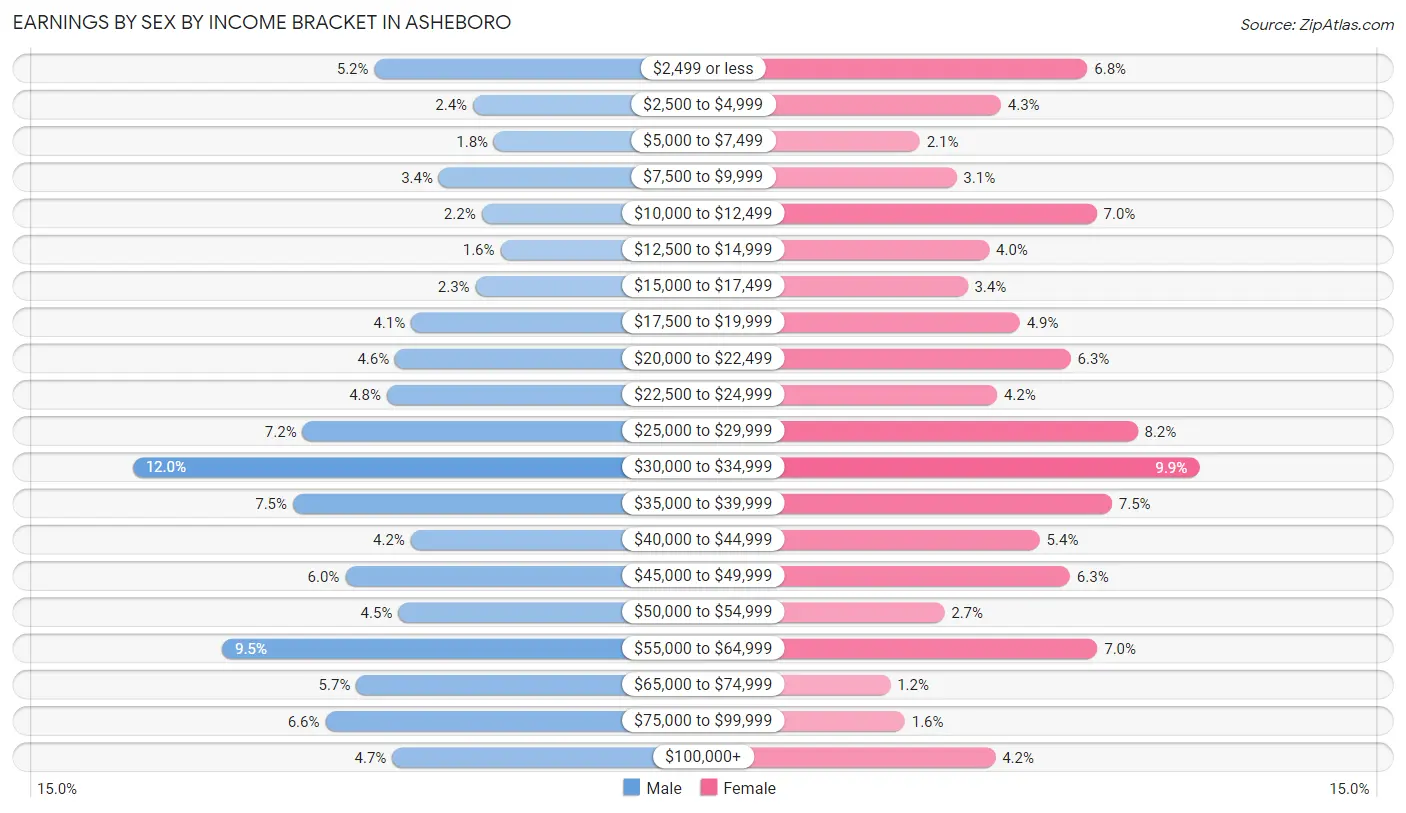
Earnings by Sex by Income Bracket in Asheboro
The most common earnings brackets in Asheboro are $30,000 to $34,999 for men (821 | 12.0%) and $30,000 to $34,999 for women (570 | 9.9%).
| Income | Male | Female |
| $2,499 or less | 355 (5.2%) | 389 (6.8%) |
| $2,500 to $4,999 | 165 (2.4%) | 249 (4.3%) |
| $5,000 to $7,499 | 124 (1.8%) | 118 (2.1%) |
| $7,500 to $9,999 | 231 (3.4%) | 177 (3.1%) |
| $10,000 to $12,499 | 148 (2.2%) | 404 (7.0%) |
| $12,500 to $14,999 | 112 (1.6%) | 230 (4.0%) |
| $15,000 to $17,499 | 160 (2.3%) | 195 (3.4%) |
| $17,500 to $19,999 | 284 (4.1%) | 280 (4.9%) |
| $20,000 to $22,499 | 315 (4.6%) | 362 (6.3%) |
| $22,500 to $24,999 | 331 (4.8%) | 243 (4.2%) |
| $25,000 to $29,999 | 494 (7.2%) | 470 (8.2%) |
| $30,000 to $34,999 | 821 (12.0%) | 570 (9.9%) |
| $35,000 to $39,999 | 512 (7.5%) | 429 (7.4%) |
| $40,000 to $44,999 | 285 (4.2%) | 312 (5.4%) |
| $45,000 to $49,999 | 411 (6.0%) | 361 (6.3%) |
| $50,000 to $54,999 | 309 (4.5%) | 158 (2.7%) |
| $55,000 to $64,999 | 649 (9.5%) | 405 (7.0%) |
| $65,000 to $74,999 | 390 (5.7%) | 70 (1.2%) |
| $75,000 to $99,999 | 450 (6.6%) | 94 (1.6%) |
| $100,000+ | 321 (4.7%) | 240 (4.2%) |
| Total | 6,867 (100.0%) | 5,756 (100.0%) |
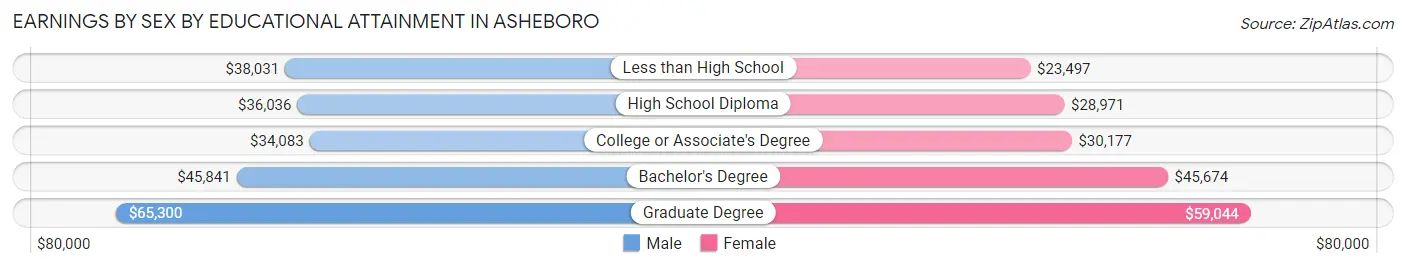
Earnings by Sex by Educational Attainment in Asheboro
Average earnings in Asheboro are $37,738 for men and $31,096 for women, a difference of 17.6%. Men with an educational attainment of graduate degree enjoy the highest average annual earnings of $65,300, while those with college or associate's degree education earn the least with $34,083. Women with an educational attainment of graduate degree earn the most with the average annual earnings of $59,044, while those with less than high school education have the smallest earnings of $23,497.
| Educational Attainment | Male Income | Female Income |
| Less than High School | $38,031 | $23,497 |
| High School Diploma | $36,036 | $28,971 |
| College or Associate's Degree | $34,083 | $30,177 |
| Bachelor's Degree | $45,841 | $45,674 |
| Graduate Degree | $65,300 | $59,044 |
| Total | $37,738 | $31,096 |
Family Income in Asheboro
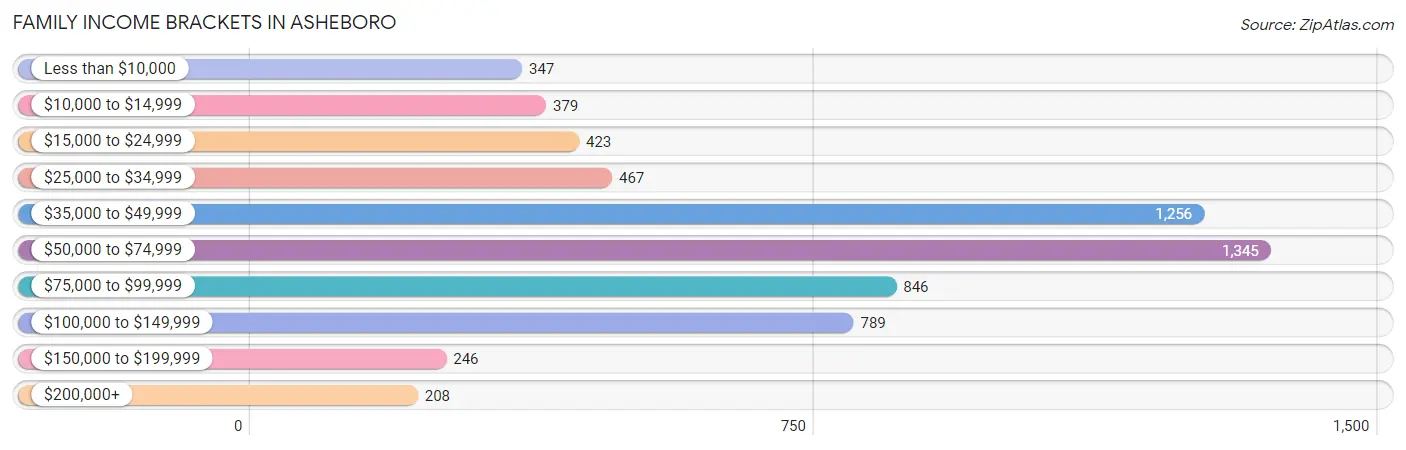
Family Income Brackets in Asheboro
According to the Asheboro family income data, there are 1,345 families falling into the $50,000 to $74,999 income range, which is the most common income bracket and makes up 21.3% of all families. Conversely, the $200,000+ income bracket is the least frequent group with only 208 families (3.3%) belonging to this category.
| Income Bracket | # Families | % Families |
| Less than $10,000 | 347 | 5.5% |
| $10,000 to $14,999 | 379 | 6.0% |
| $15,000 to $24,999 | 423 | 6.7% |
| $25,000 to $34,999 | 467 | 7.4% |
| $35,000 to $49,999 | 1,256 | 19.9% |
| $50,000 to $74,999 | 1,345 | 21.3% |
| $75,000 to $99,999 | 846 | 13.4% |
| $100,000 to $149,999 | 789 | 12.5% |
| $150,000 to $199,999 | 246 | 3.9% |
| $200,000+ | 208 | 3.3% |
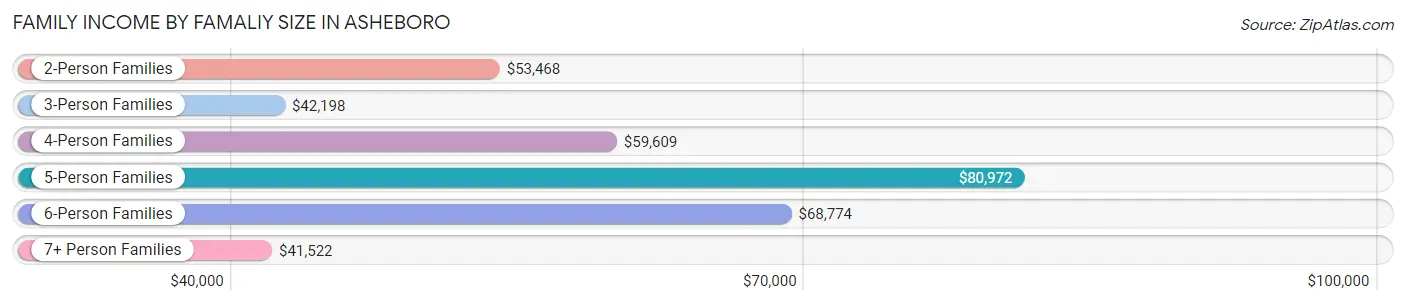
Family Income by Famaliy Size in Asheboro
5-person families (550 | 8.7%) account for the highest median family income in Asheboro with $80,972 per family, while 2-person families (3,194 | 50.6%) have the highest median income of $26,734 per family member.
| Income Bracket | # Families | Median Income |
| 2-Person Families | 3,194 (50.6%) | $53,468 |
| 3-Person Families | 1,252 (19.8%) | $42,198 |
| 4-Person Families | 921 (14.6%) | $59,609 |
| 5-Person Families | 550 (8.7%) | $80,972 |
| 6-Person Families | 195 (3.1%) | $68,774 |
| 7+ Person Families | 202 (3.2%) | $41,522 |
| Total | 6,314 (100.0%) | $53,327 |
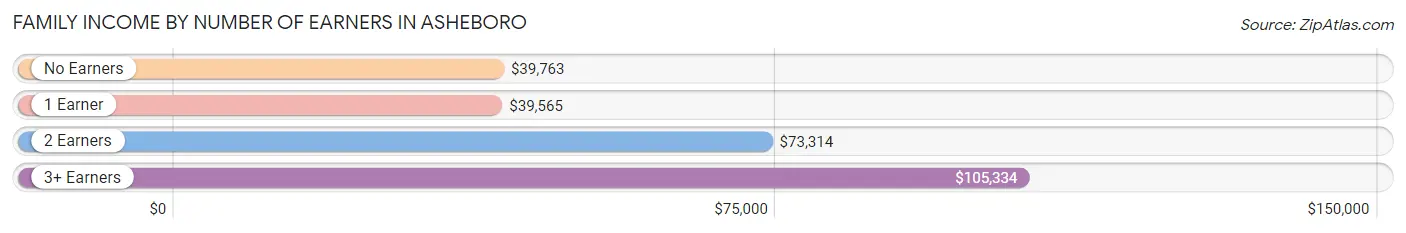
Family Income by Number of Earners in Asheboro
The median family income in Asheboro is $53,327, with families comprising 3+ earners (521) having the highest median family income of $105,334, while families with 1 earner (2,178) have the lowest median family income of $39,565, accounting for 8.3% and 34.5% of families, respectively.
| Number of Earners | # Families | Median Income |
| No Earners | 1,353 (21.4%) | $39,763 |
| 1 Earner | 2,178 (34.5%) | $39,565 |
| 2 Earners | 2,262 (35.8%) | $73,314 |
| 3+ Earners | 521 (8.3%) | $105,334 |
| Total | 6,314 (100.0%) | $53,327 |
Household Income in Asheboro
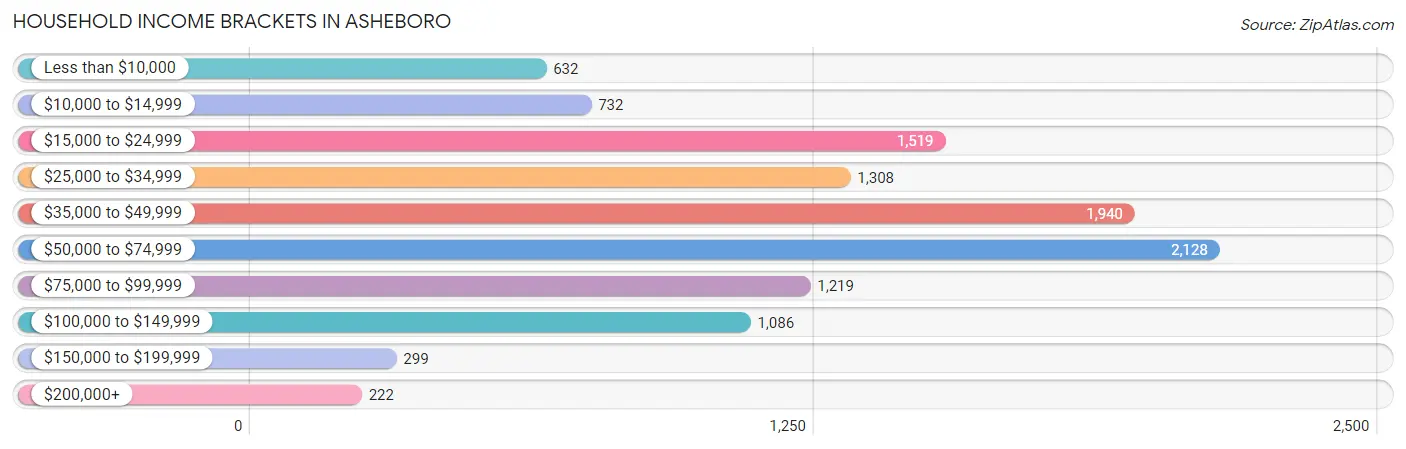
Household Income Brackets in Asheboro
With 2,128 households falling in the category, the $50,000 to $74,999 income range is the most frequent in Asheboro, accounting for 19.2% of all households. In contrast, only 222 households (2.0%) fall into the $200,000+ income bracket, making it the least populous group.
| Income Bracket | # Households | % Households |
| Less than $10,000 | 632 | 5.7% |
| $10,000 to $14,999 | 732 | 6.6% |
| $15,000 to $24,999 | 1,519 | 13.7% |
| $25,000 to $34,999 | 1,308 | 11.8% |
| $35,000 to $49,999 | 1,940 | 17.5% |
| $50,000 to $74,999 | 2,128 | 19.2% |
| $75,000 to $99,999 | 1,219 | 11.0% |
| $100,000 to $149,999 | 1,086 | 9.8% |
| $150,000 to $199,999 | 299 | 2.7% |
| $200,000+ | 222 | 2.0% |
Household Income by Householder Age in Asheboro
The median household income in Asheboro is $44,405, with the highest median household income of $53,435 found in the 45 to 64 years age bracket for the primary householder. A total of 3,320 households (29.9%) fall into this category. Meanwhile, the 15 to 24 years age bracket for the primary householder has the lowest median household income of $24,191, with 612 households (5.5%) in this group.
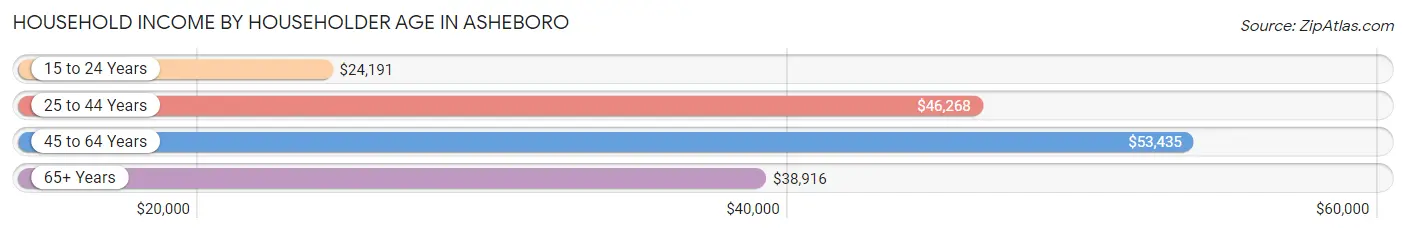
| Income Bracket | # Households | Median Income |
| 15 to 24 Years | 612 (5.5%) | $24,191 |
| 25 to 44 Years | 4,030 (36.4%) | $46,268 |
| 45 to 64 Years | 3,320 (29.9%) | $53,435 |
| 65+ Years | 3,122 (28.2%) | $38,916 |
| Total | 11,084 (100.0%) | $44,405 |
Poverty in Asheboro
Income Below Poverty by Sex and Age in Asheboro
With 18.9% poverty level for males and 24.5% for females among the residents of Asheboro, 16 and 17 year old males and 5 year old females are the most vulnerable to poverty, with 177 males (40.3%) and 105 females (54.7%) in their respective age groups living below the poverty level.
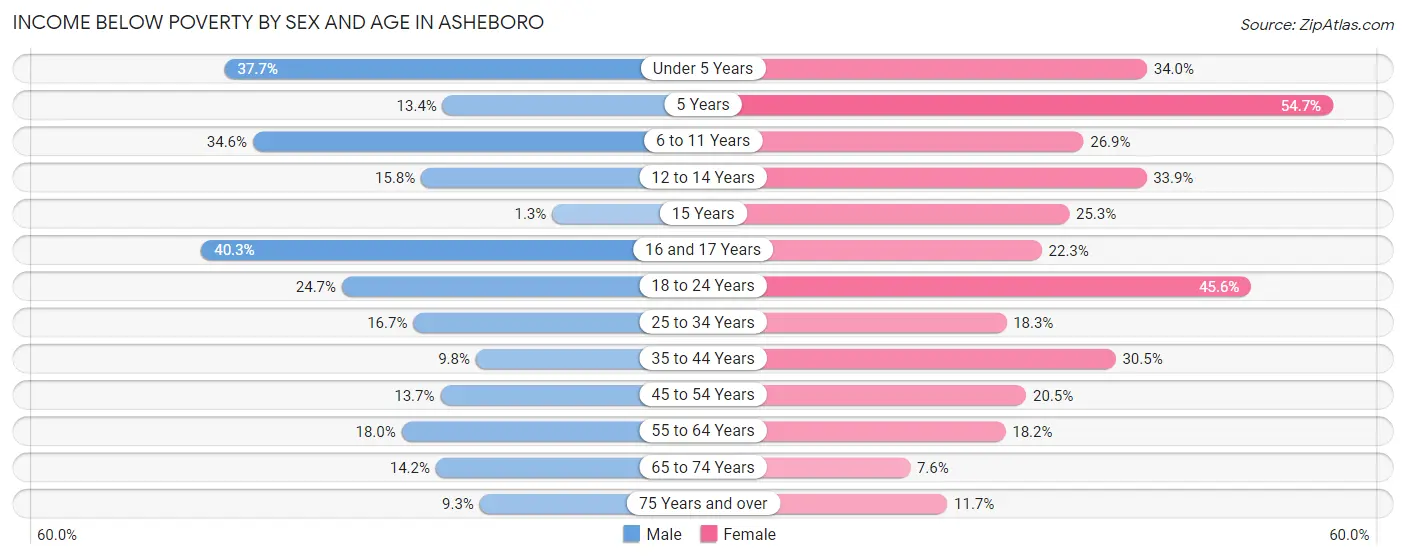
| Age Bracket | Male | Female |
| Under 5 Years | 312 (37.7%) | 340 (34.0%) |
| 5 Years | 25 (13.4%) | 105 (54.7%) |
| 6 to 11 Years | 436 (34.6%) | 259 (26.9%) |
| 12 to 14 Years | 131 (15.8%) | 181 (33.9%) |
| 15 Years | 2 (1.3%) | 41 (25.3%) |
| 16 and 17 Years | 177 (40.3%) | 93 (22.3%) |
| 18 to 24 Years | 282 (24.7%) | 548 (45.6%) |
| 25 to 34 Years | 304 (16.7%) | 329 (18.3%) |
| 35 to 44 Years | 196 (9.8%) | 590 (30.5%) |
| 45 to 54 Years | 202 (13.7%) | 223 (20.5%) |
| 55 to 64 Years | 240 (18.0%) | 230 (18.2%) |
| 65 to 74 Years | 158 (14.2%) | 88 (7.6%) |
| 75 Years and over | 85 (9.3%) | 145 (11.7%) |
| Total | 2,550 (18.9%) | 3,172 (24.5%) |
Income Above Poverty by Sex and Age in Asheboro
According to the poverty statistics in Asheboro, males aged 15 years and females aged 65 to 74 years are the age groups that are most secure financially, with 98.8% of males and 92.4% of females in these age groups living above the poverty line.
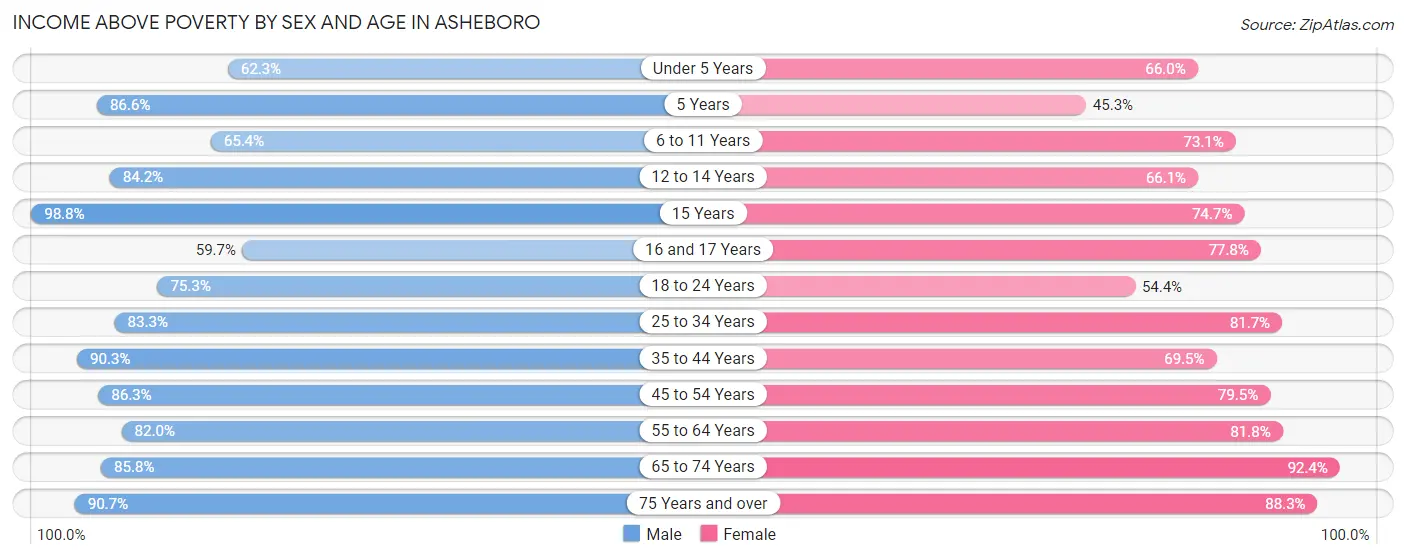
| Age Bracket | Male | Female |
| Under 5 Years | 515 (62.3%) | 661 (66.0%) |
| 5 Years | 161 (86.6%) | 87 (45.3%) |
| 6 to 11 Years | 825 (65.4%) | 704 (73.1%) |
| 12 to 14 Years | 696 (84.2%) | 353 (66.1%) |
| 15 Years | 158 (98.8%) | 121 (74.7%) |
| 16 and 17 Years | 262 (59.7%) | 325 (77.7%) |
| 18 to 24 Years | 861 (75.3%) | 654 (54.4%) |
| 25 to 34 Years | 1,514 (83.3%) | 1,468 (81.7%) |
| 35 to 44 Years | 1,814 (90.2%) | 1,346 (69.5%) |
| 45 to 54 Years | 1,272 (86.3%) | 864 (79.5%) |
| 55 to 64 Years | 1,092 (82.0%) | 1,033 (81.8%) |
| 65 to 74 Years | 954 (85.8%) | 1,072 (92.4%) |
| 75 Years and over | 827 (90.7%) | 1,091 (88.3%) |
| Total | 10,951 (81.1%) | 9,779 (75.5%) |
Income Below Poverty Among Married-Couple Families in Asheboro
The poverty statistics for married-couple families in Asheboro show that 8.6% or 362 of the total 4,200 families live below the poverty line. Families with 5 or more children have the highest poverty rate of 36.7%, comprising of 36 families. On the other hand, families with 1 or 2 children have the lowest poverty rate of 5.3%, which includes 71 families.
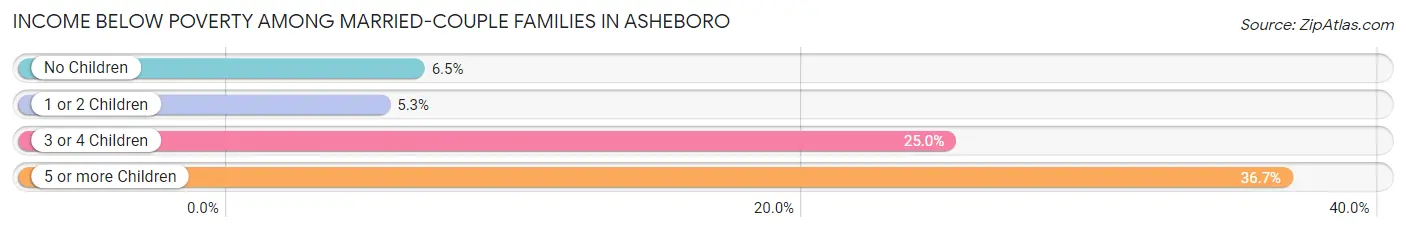
| Children | Above Poverty | Below Poverty |
| No Children | 2,201 (93.5%) | 153 (6.5%) |
| 1 or 2 Children | 1,269 (94.7%) | 71 (5.3%) |
| 3 or 4 Children | 306 (75.0%) | 102 (25.0%) |
| 5 or more Children | 62 (63.3%) | 36 (36.7%) |
| Total | 3,838 (91.4%) | 362 (8.6%) |
Income Below Poverty Among Single-Parent Households in Asheboro
According to the poverty data in Asheboro, 7.0% or 34 single-father households and 42.3% or 690 single-mother households are living below the poverty line. Among single-father households, those with 1 or 2 children have the highest poverty rate, with 32 households (12.0%) experiencing poverty. Likewise, among single-mother households, those with 3 or 4 children have the highest poverty rate, with 78 households (78.8%) falling below the poverty line.
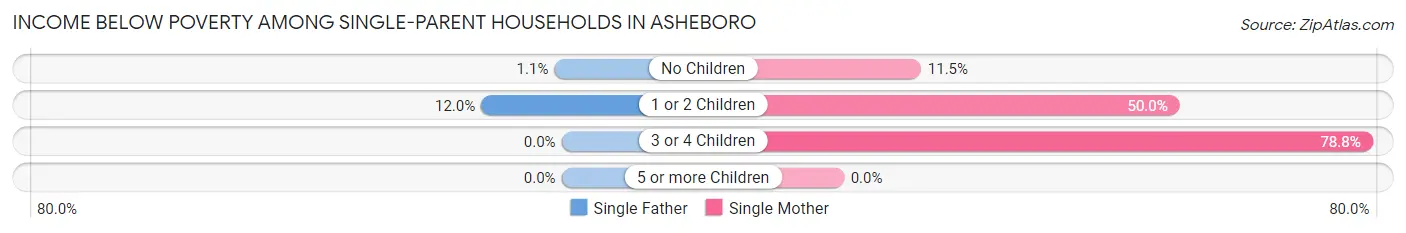
| Children | Single Father | Single Mother |
| No Children | 2 (1.1%) | 46 (11.5%) |
| 1 or 2 Children | 32 (12.0%) | 566 (50.0%) |
| 3 or 4 Children | 0 (0.0%) | 78 (78.8%) |
| 5 or more Children | 0 (0.0%) | 0 (0.0%) |
| Total | 34 (7.0%) | 690 (42.3%) |
Income Below Poverty Among Married-Couple vs Single-Parent Households in Asheboro
The poverty data for Asheboro shows that 362 of the married-couple family households (8.6%) and 724 of the single-parent households (34.3%) are living below the poverty level. Within the married-couple family households, those with 5 or more children have the highest poverty rate, with 36 households (36.7%) falling below the poverty line. Among the single-parent households, those with 3 or 4 children have the highest poverty rate, with 78 household (60.0%) living below poverty.
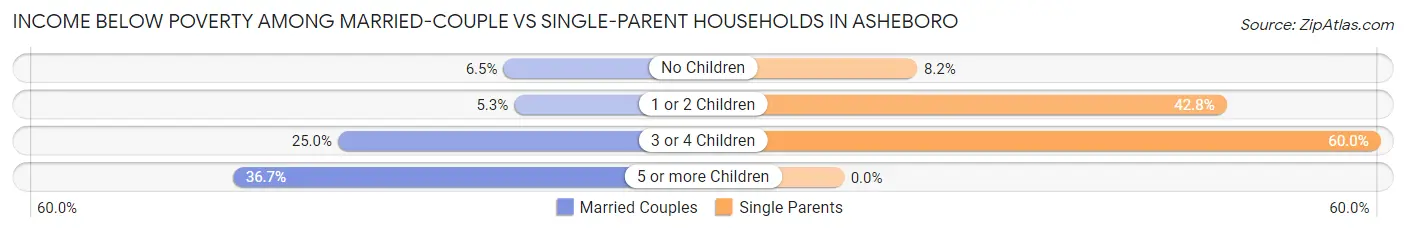
| Children | Married-Couple Families | Single-Parent Households |
| No Children | 153 (6.5%) | 48 (8.2%) |
| 1 or 2 Children | 71 (5.3%) | 598 (42.8%) |
| 3 or 4 Children | 102 (25.0%) | 78 (60.0%) |
| 5 or more Children | 36 (36.7%) | 0 (0.0%) |
| Total | 362 (8.6%) | 724 (34.3%) |
Race in Asheboro
The most populous races in Asheboro are White / Caucasian (17,591 | 64.9%), Hispanic or Latino (7,680 | 28.3%), and Some other Race (3,896 | 14.4%).
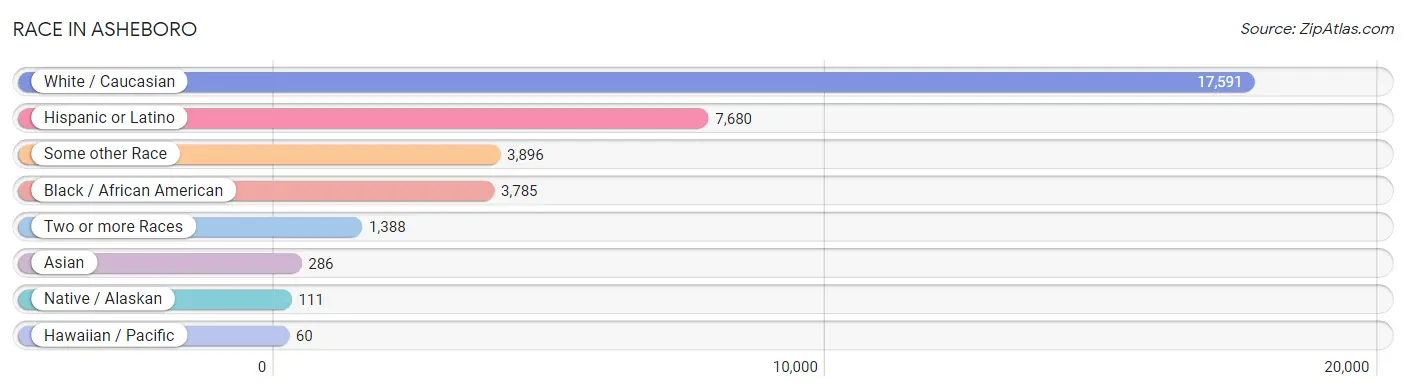
| Race | # Population | % Population |
| Asian | 286 | 1.1% |
| Black / African American | 3,785 | 14.0% |
| Hawaiian / Pacific | 60 | 0.2% |
| Hispanic or Latino | 7,680 | 28.3% |
| Native / Alaskan | 111 | 0.4% |
| White / Caucasian | 17,591 | 64.9% |
| Two or more Races | 1,388 | 5.1% |
| Some other Race | 3,896 | 14.4% |
| Total | 27,117 | 100.0% |
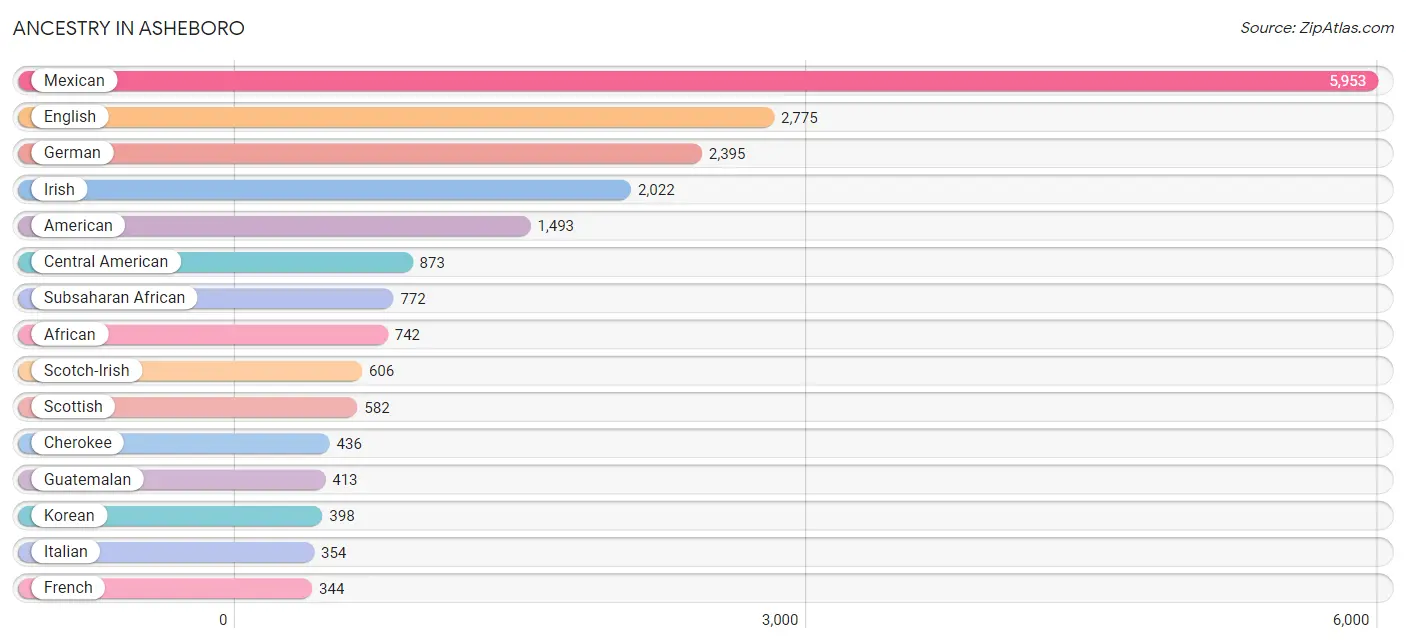
Ancestry in Asheboro
The most populous ancestries reported in Asheboro are Mexican (5,953 | 22.0%), English (2,775 | 10.2%), German (2,395 | 8.8%), Irish (2,022 | 7.5%), and American (1,493 | 5.5%), together accounting for 54.0% of all Asheboro residents.
| Ancestry | # Population | % Population |
| African | 742 | 2.7% |
| American | 1,493 | 5.5% |
| Arab | 41 | 0.2% |
| Bhutanese | 6 | 0.0% |
| Blackfeet | 38 | 0.1% |
| Brazilian | 8 | 0.0% |
| British | 153 | 0.6% |
| Burmese | 40 | 0.2% |
| Cajun | 9 | 0.0% |
| Canadian | 23 | 0.1% |
| Central American | 873 | 3.2% |
| Central American Indian | 12 | 0.0% |
| Cherokee | 436 | 1.6% |
| Chippewa | 31 | 0.1% |
| Choctaw | 4 | 0.0% |
| Colombian | 83 | 0.3% |
| Costa Rican | 13 | 0.1% |
| Creek | 6 | 0.0% |
| Cuban | 235 | 0.9% |
| Czech | 30 | 0.1% |
| Czechoslovakian | 32 | 0.1% |
| Danish | 81 | 0.3% |
| Delaware | 19 | 0.1% |
| Dominican | 69 | 0.3% |
| Dutch | 69 | 0.3% |
| Dutch West Indian | 13 | 0.1% |
| Eastern European | 42 | 0.2% |
| Ecuadorian | 23 | 0.1% |
| Egyptian | 5 | 0.0% |
| English | 2,775 | 10.2% |
| European | 268 | 1.0% |
| Filipino | 1 | 0.0% |
| French | 344 | 1.3% |
| French Canadian | 168 | 0.6% |
| German | 2,395 | 8.8% |
| Greek | 74 | 0.3% |
| Guamanian / Chamorro | 60 | 0.2% |
| Guatemalan | 413 | 1.5% |
| Honduran | 19 | 0.1% |
| Hungarian | 137 | 0.5% |
| Indian (Asian) | 166 | 0.6% |
| Irish | 2,022 | 7.5% |
| Italian | 354 | 1.3% |
| Jamaican | 5 | 0.0% |
| Korean | 398 | 1.5% |
| Lithuanian | 7 | 0.0% |
| Mexican | 5,953 | 22.0% |
| Mexican American Indian | 26 | 0.1% |
| Moroccan | 19 | 0.1% |
| Nicaraguan | 151 | 0.6% |
| Northern European | 12 | 0.0% |
| Norwegian | 123 | 0.4% |
| Pennsylvania German | 13 | 0.1% |
| Polish | 244 | 0.9% |
| Portuguese | 5 | 0.0% |
| Puerto Rican | 188 | 0.7% |
| Russian | 61 | 0.2% |
| Salvadoran | 277 | 1.0% |
| Scandinavian | 21 | 0.1% |
| Scotch-Irish | 606 | 2.2% |
| Scottish | 582 | 2.1% |
| Seminole | 36 | 0.1% |
| Serbian | 30 | 0.1% |
| Slovene | 14 | 0.1% |
| South American | 106 | 0.4% |
| Spaniard | 50 | 0.2% |
| Spanish | 24 | 0.1% |
| Subsaharan African | 772 | 2.9% |
| Swedish | 90 | 0.3% |
| Swiss | 68 | 0.3% |
| Thai | 22 | 0.1% |
| Ukrainian | 14 | 0.1% |
| Welsh | 107 | 0.4% | View All 73 Rows |
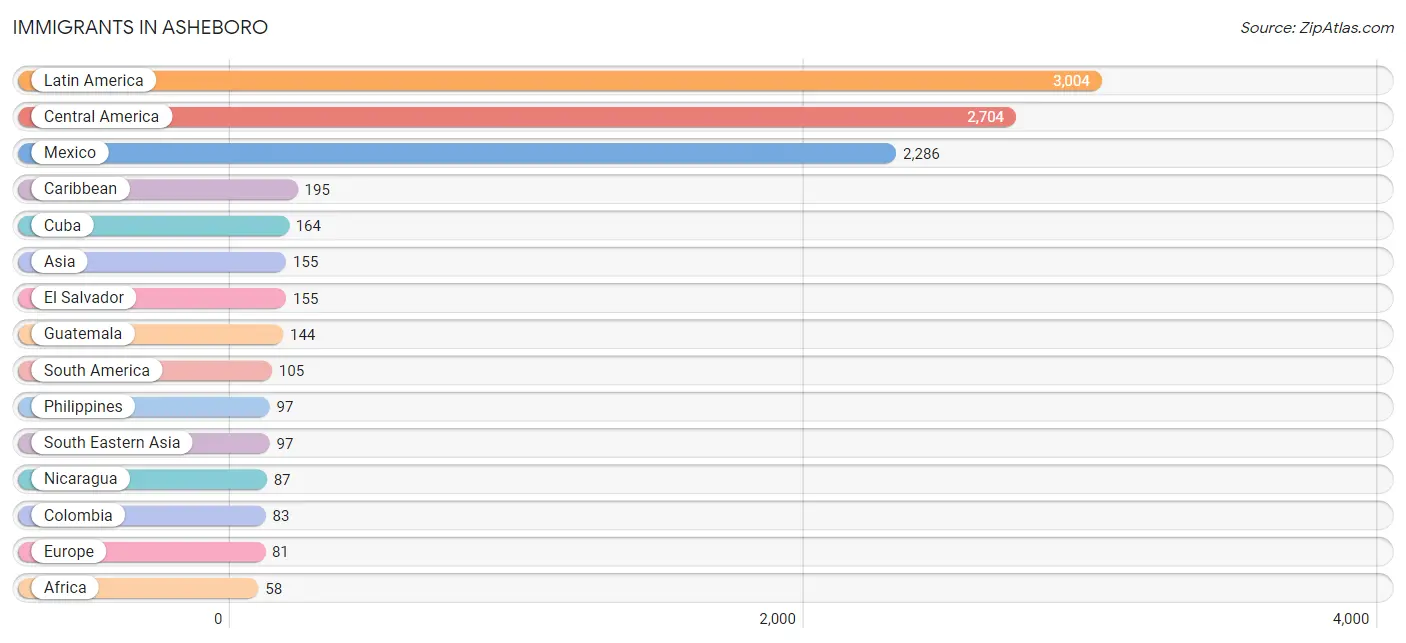
Immigrants in Asheboro
The most numerous immigrant groups reported in Asheboro came from Latin America (3,004 | 11.1%), Central America (2,704 | 10.0%), Mexico (2,286 | 8.4%), Caribbean (195 | 0.7%), and Cuba (164 | 0.6%), together accounting for 30.8% of all Asheboro residents.
| Immigration Origin | # Population | % Population |
| Africa | 58 | 0.2% |
| Asia | 155 | 0.6% |
| Brazil | 8 | 0.0% |
| Caribbean | 195 | 0.7% |
| Central America | 2,704 | 10.0% |
| China | 1 | 0.0% |
| Colombia | 83 | 0.3% |
| Costa Rica | 13 | 0.1% |
| Cuba | 164 | 0.6% |
| Dominican Republic | 24 | 0.1% |
| Eastern Asia | 47 | 0.2% |
| Ecuador | 14 | 0.1% |
| El Salvador | 155 | 0.6% |
| Europe | 81 | 0.3% |
| Germany | 21 | 0.1% |
| Ghana | 22 | 0.1% |
| Guatemala | 144 | 0.5% |
| Honduras | 19 | 0.1% |
| Israel | 11 | 0.0% |
| Jamaica | 7 | 0.0% |
| Japan | 6 | 0.0% |
| Korea | 40 | 0.2% |
| Latin America | 3,004 | 11.1% |
| Mexico | 2,286 | 8.4% |
| Morocco | 36 | 0.1% |
| Nicaragua | 87 | 0.3% |
| Northern Africa | 36 | 0.1% |
| Northern Europe | 33 | 0.1% |
| Philippines | 97 | 0.4% |
| South America | 105 | 0.4% |
| South Eastern Asia | 97 | 0.4% |
| Southern Europe | 27 | 0.1% |
| Spain | 27 | 0.1% |
| Taiwan | 1 | 0.0% |
| Western Africa | 22 | 0.1% |
| Western Asia | 11 | 0.0% |
| Western Europe | 21 | 0.1% | View All 37 Rows |
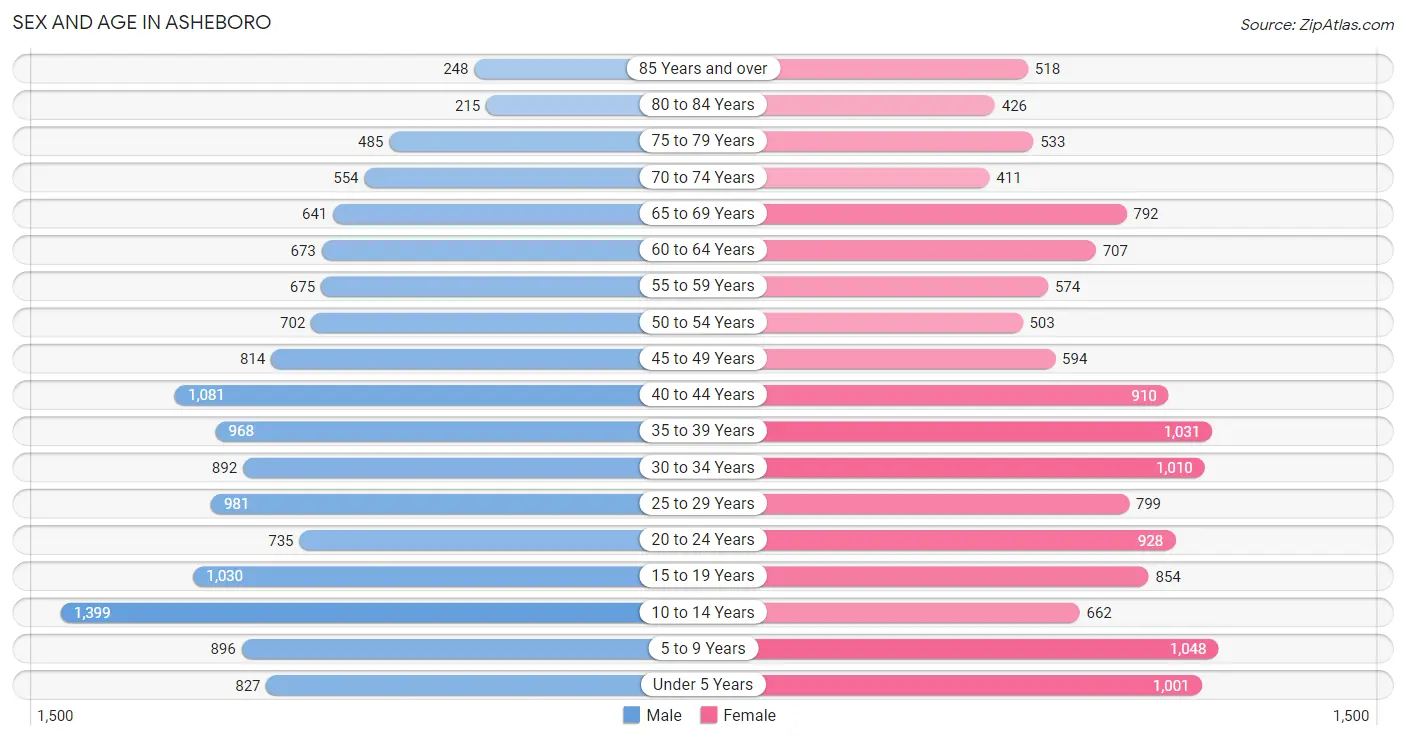
Sex and Age in Asheboro
Sex and Age in Asheboro
The most populous age groups in Asheboro are 10 to 14 Years (1,399 | 10.1%) for men and 5 to 9 Years (1,048 | 7.9%) for women.
| Age Bracket | Male | Female |
| Under 5 Years | 827 (6.0%) | 1,001 (7.5%) |
| 5 to 9 Years | 896 (6.5%) | 1,048 (7.9%) |
| 10 to 14 Years | 1,399 (10.1%) | 662 (5.0%) |
| 15 to 19 Years | 1,030 (7.5%) | 854 (6.4%) |
| 20 to 24 Years | 735 (5.3%) | 928 (7.0%) |
| 25 to 29 Years | 981 (7.1%) | 799 (6.0%) |
| 30 to 34 Years | 892 (6.5%) | 1,010 (7.6%) |
| 35 to 39 Years | 968 (7.0%) | 1,031 (7.7%) |
| 40 to 44 Years | 1,081 (7.8%) | 910 (6.8%) |
| 45 to 49 Years | 814 (5.9%) | 594 (4.5%) |
| 50 to 54 Years | 702 (5.1%) | 503 (3.8%) |
| 55 to 59 Years | 675 (4.9%) | 574 (4.3%) |
| 60 to 64 Years | 673 (4.9%) | 707 (5.3%) |
| 65 to 69 Years | 641 (4.6%) | 792 (5.9%) |
| 70 to 74 Years | 554 (4.0%) | 411 (3.1%) |
| 75 to 79 Years | 485 (3.5%) | 533 (4.0%) |
| 80 to 84 Years | 215 (1.6%) | 426 (3.2%) |
| 85 Years and over | 248 (1.8%) | 518 (3.9%) |
| Total | 13,816 (100.0%) | 13,301 (100.0%) |
Families and Households in Asheboro
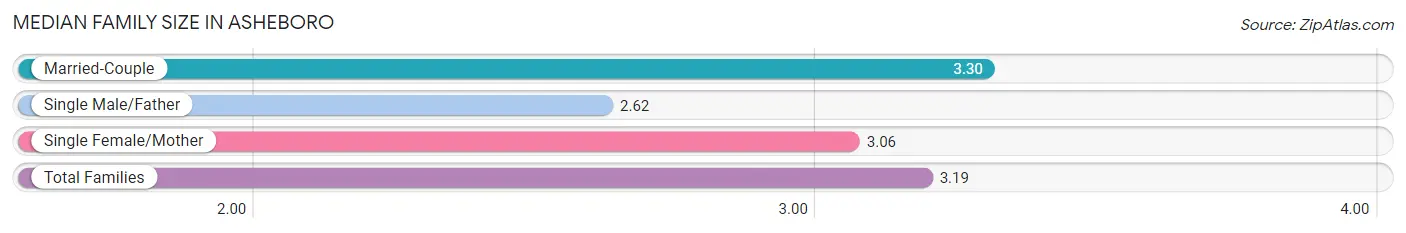
Median Family Size in Asheboro
The median family size in Asheboro is 3.19 persons per family, with married-couple families (4,200 | 66.5%) accounting for the largest median family size of 3.3 persons per family. On the other hand, single male/father families (484 | 7.7%) represent the smallest median family size with 2.62 persons per family.
| Family Type | # Families | Family Size |
| Married-Couple | 4,200 (66.5%) | 3.30 |
| Single Male/Father | 484 (7.7%) | 2.62 |
| Single Female/Mother | 1,630 (25.8%) | 3.06 |
| Total Families | 6,314 (100.0%) | 3.19 |
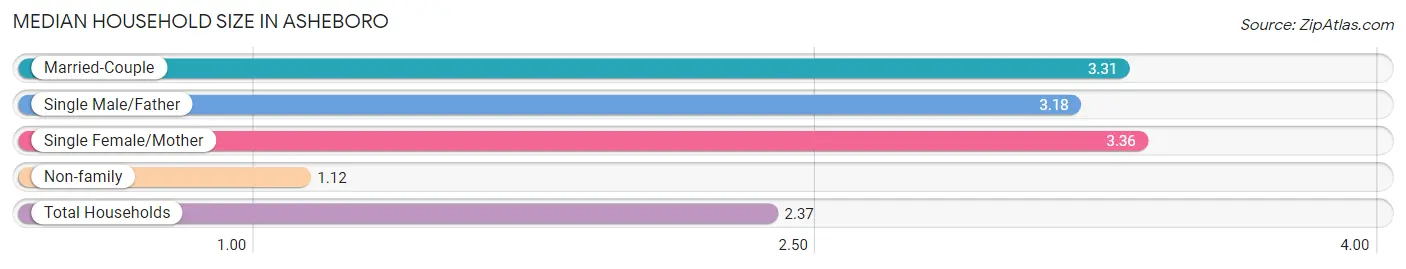
Median Household Size in Asheboro
The median household size in Asheboro is 2.37 persons per household, with single female/mother households (1,630 | 14.7%) accounting for the largest median household size of 3.36 persons per household. non-family households (4,770 | 43.0%) represent the smallest median household size with 1.12 persons per household.
| Household Type | # Households | Household Size |
| Married-Couple | 4,200 (37.9%) | 3.31 |
| Single Male/Father | 484 (4.4%) | 3.18 |
| Single Female/Mother | 1,630 (14.7%) | 3.36 |
| Non-family | 4,770 (43.0%) | 1.12 |
| Total Households | 11,084 (100.0%) | 2.37 |
Household Size by Marriage Status in Asheboro
Out of a total of 11,084 households in Asheboro, 6,314 (57.0%) are family households, while 4,770 (43.0%) are nonfamily households. The most numerous type of family households are 2-person households, comprising 2,956, and the most common type of nonfamily households are 1-person households, comprising 4,338.
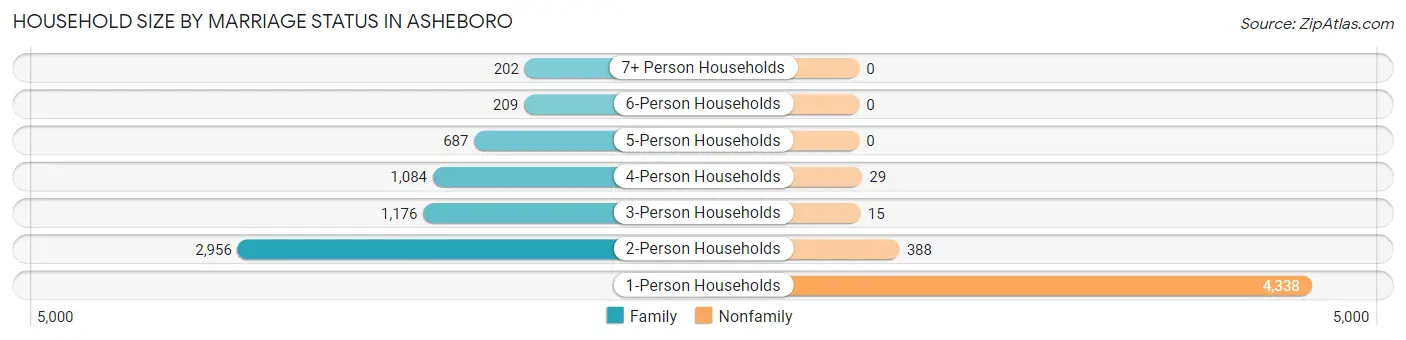
| Household Size | Family Households | Nonfamily Households |
| 1-Person Households | - | 4,338 (39.1%) |
| 2-Person Households | 2,956 (26.7%) | 388 (3.5%) |
| 3-Person Households | 1,176 (10.6%) | 15 (0.1%) |
| 4-Person Households | 1,084 (9.8%) | 29 (0.3%) |
| 5-Person Households | 687 (6.2%) | 0 (0.0%) |
| 6-Person Households | 209 (1.9%) | 0 (0.0%) |
| 7+ Person Households | 202 (1.8%) | 0 (0.0%) |
| Total | 6,314 (57.0%) | 4,770 (43.0%) |
Female Fertility in Asheboro
Fertility by Age in Asheboro
Average fertility rate in Asheboro is 68.0 births per 1,000 women. Women in the age bracket of 15 to 19 years have the highest fertility rate with 88.0 births per 1,000 women. Women in the age bracket of 20 to 34 years acount for 55.8% of all women with births.
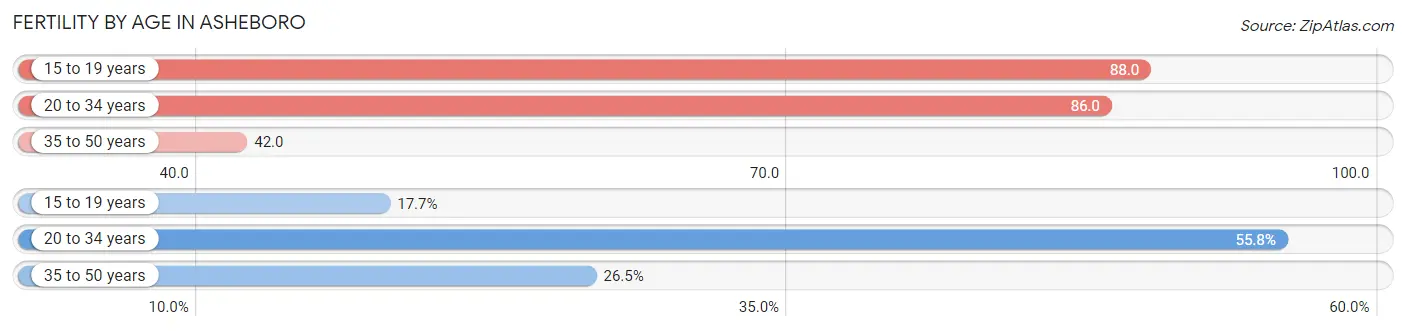
| Age Bracket | Women with Births | Births / 1,000 Women |
| 15 to 19 years | 75 (17.7%) | 88.0 |
| 20 to 34 years | 236 (55.8%) | 86.0 |
| 35 to 50 years | 112 (26.5%) | 42.0 |
| Total | 423 (100.0%) | 68.0 |
Fertility by Age by Marriage Status in Asheboro
48.0% of women with births (423) in Asheboro are married. The highest percentage of unmarried women with births falls into 15 to 19 years age bracket with 100.0% of them unmarried at the time of birth, while the lowest percentage of unmarried women with births belong to 35 to 50 years age bracket with 0.0% of them unmarried.
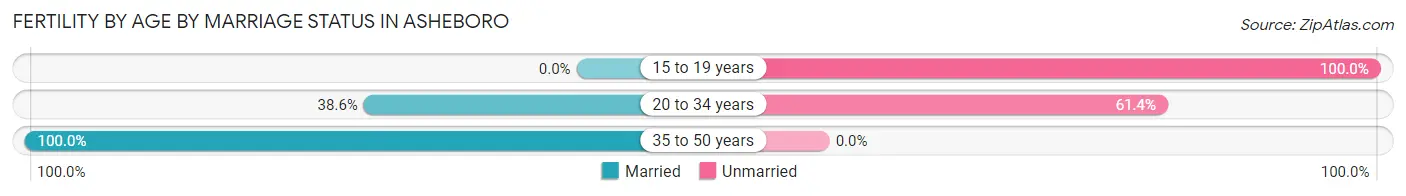
| Age Bracket | Married | Unmarried |
| 15 to 19 years | 0 (0.0%) | 75 (100.0%) |
| 20 to 34 years | 91 (38.6%) | 145 (61.4%) |
| 35 to 50 years | 112 (100.0%) | 0 (0.0%) |
| Total | 203 (48.0%) | 220 (52.0%) |
Fertility by Education in Asheboro
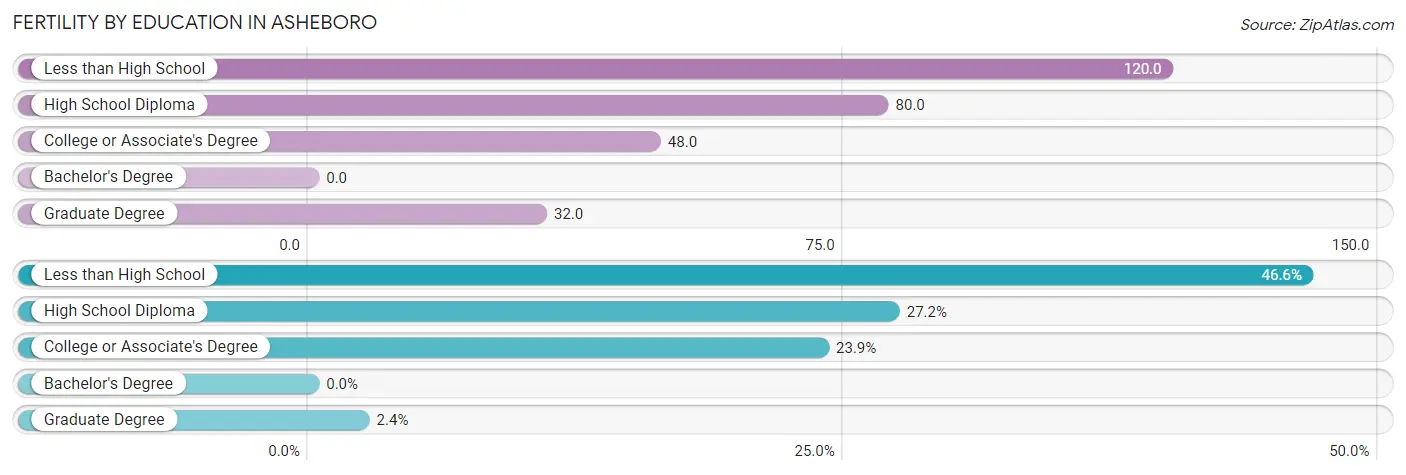
| Educational Attainment | Women with Births | Births / 1,000 Women |
| Less than High School | 197 (46.6%) | 120.0 |
| High School Diploma | 115 (27.2%) | 80.0 |
| College or Associate's Degree | 101 (23.9%) | 48.0 |
| Bachelor's Degree | 0 (0.0%) | 0.0 |
| Graduate Degree | 10 (2.4%) | 32.0 |
| Total | 423 (100.0%) | 68.0 |
Fertility by Education by Marriage Status in Asheboro
52.0% of women with births in Asheboro are unmarried. Women with the educational attainment of graduate degree are most likely to be married with 100.0% of them married at childbirth, while women with the educational attainment of less than high school are least likely to be married with 83.3% of them unmarried at childbirth.
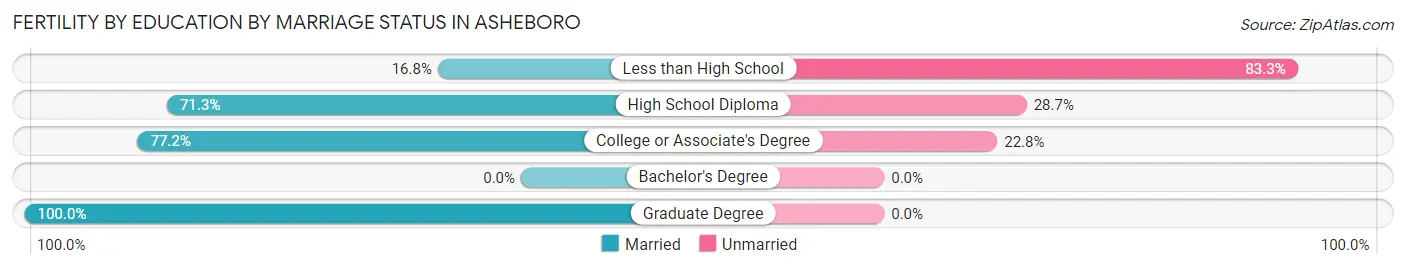
| Educational Attainment | Married | Unmarried |
| Less than High School | 33 (16.8%) | 164 (83.3%) |
| High School Diploma | 82 (71.3%) | 33 (28.7%) |
| College or Associate's Degree | 78 (77.2%) | 23 (22.8%) |
| Bachelor's Degree | 0 (0.0%) | 0 (0.0%) |
| Graduate Degree | 10 (100.0%) | 0 (0.0%) |
| Total | 203 (48.0%) | 220 (52.0%) |
Employment Characteristics in Asheboro
Employment by Class of Employer in Asheboro
Among the 11,051 employed individuals in Asheboro, private company employees (7,973 | 72.2%), local government employees (762 | 6.9%), and state government employees (729 | 6.6%) make up the most common classes of employment.
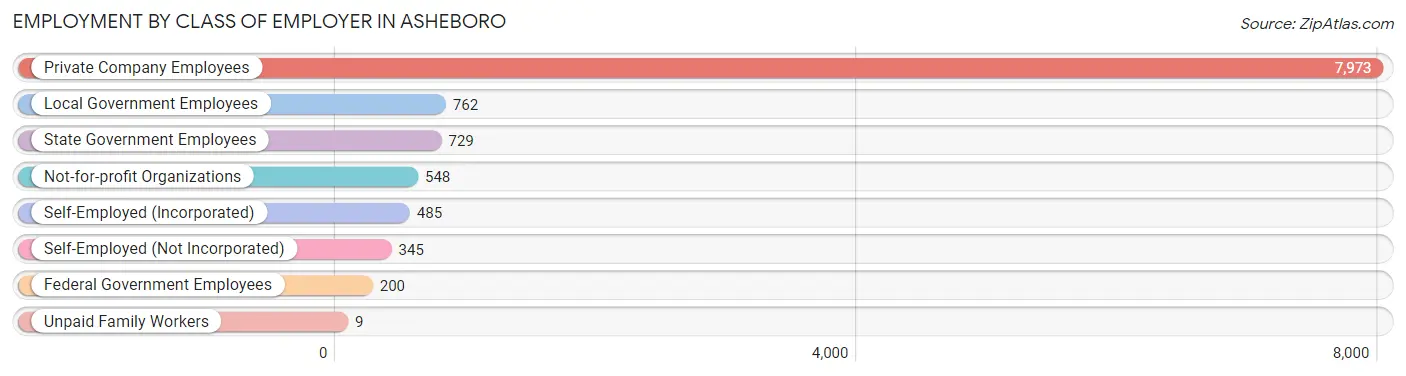
| Employer Class | # Employees | % Employees |
| Private Company Employees | 7,973 | 72.2% |
| Self-Employed (Incorporated) | 485 | 4.4% |
| Self-Employed (Not Incorporated) | 345 | 3.1% |
| Not-for-profit Organizations | 548 | 5.0% |
| Local Government Employees | 762 | 6.9% |
| State Government Employees | 729 | 6.6% |
| Federal Government Employees | 200 | 1.8% |
| Unpaid Family Workers | 9 | 0.1% |
| Total | 11,051 | 100.0% |
Employment Status by Age in Asheboro
According to the labor force statistics for Asheboro, out of the total population over 16 years of age (20,962), 57.8% or 12,116 individuals are in the labor force, with 5.5% or 666 of them unemployed. The age group with the highest labor force participation rate is 25 to 29 years, with 85.2% or 1,517 individuals in the labor force. Within the labor force, the 16 to 19 years age range has the highest percentage of unemployed individuals, with 18.4% or 97 of them being unemployed.
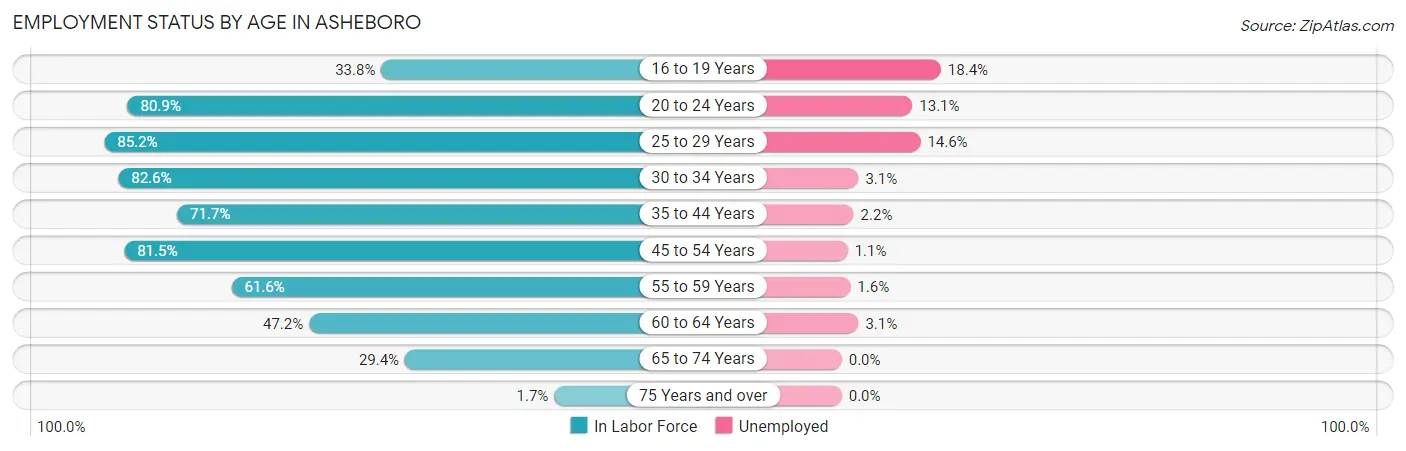
| Age Bracket | In Labor Force | Unemployed |
| 16 to 19 Years | 528 (33.8%) | 97 (18.4%) |
| 20 to 24 Years | 1,345 (80.9%) | 176 (13.1%) |
| 25 to 29 Years | 1,517 (85.2%) | 221 (14.6%) |
| 30 to 34 Years | 1,571 (82.6%) | 49 (3.1%) |
| 35 to 44 Years | 2,861 (71.7%) | 63 (2.2%) |
| 45 to 54 Years | 2,130 (81.5%) | 23 (1.1%) |
| 55 to 59 Years | 769 (61.6%) | 12 (1.6%) |
| 60 to 64 Years | 651 (47.2%) | 20 (3.1%) |
| 65 to 74 Years | 705 (29.4%) | 0 (0.0%) |
| 75 Years and over | 41 (1.7%) | 0 (0.0%) |
| Total | 12,116 (57.8%) | 666 (5.5%) |
Employment Status by Educational Attainment in Asheboro
According to labor force statistics for Asheboro, 73.6% of individuals (9,505) out of the total population between 25 and 64 years of age (12,914) are in the labor force, with 4.1% or 390 of them being unemployed. The group with the highest labor force participation rate are those with the educational attainment of bachelor's degree or higher, with 85.2% or 1,844 individuals in the labor force. Within the labor force, individuals with less than high school education have the highest percentage of unemployment, with 6.2% or 118 of them being unemployed.
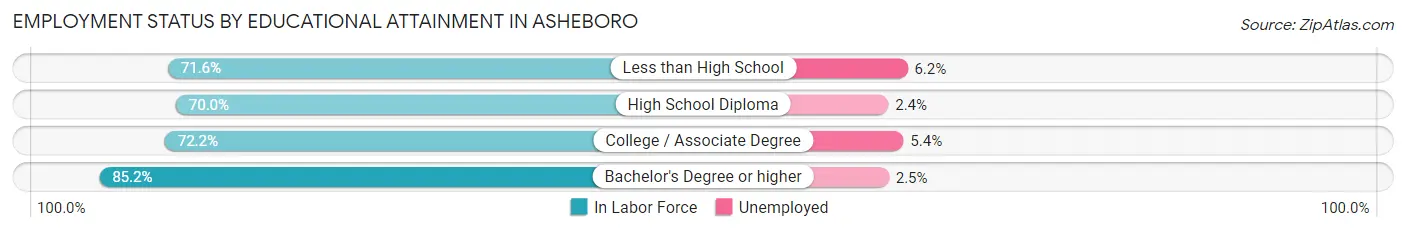
| Educational Attainment | In Labor Force | Unemployed |
| Less than High School | 1,909 (71.6%) | 165 (6.2%) |
| High School Diploma | 2,816 (70.0%) | 97 (2.4%) |
| College / Associate Degree | 2,932 (72.2%) | 219 (5.4%) |
| Bachelor's Degree or higher | 1,844 (85.2%) | 54 (2.5%) |
| Total | 9,505 (73.6%) | 529 (4.1%) |
Employment Occupations by Sex in Asheboro
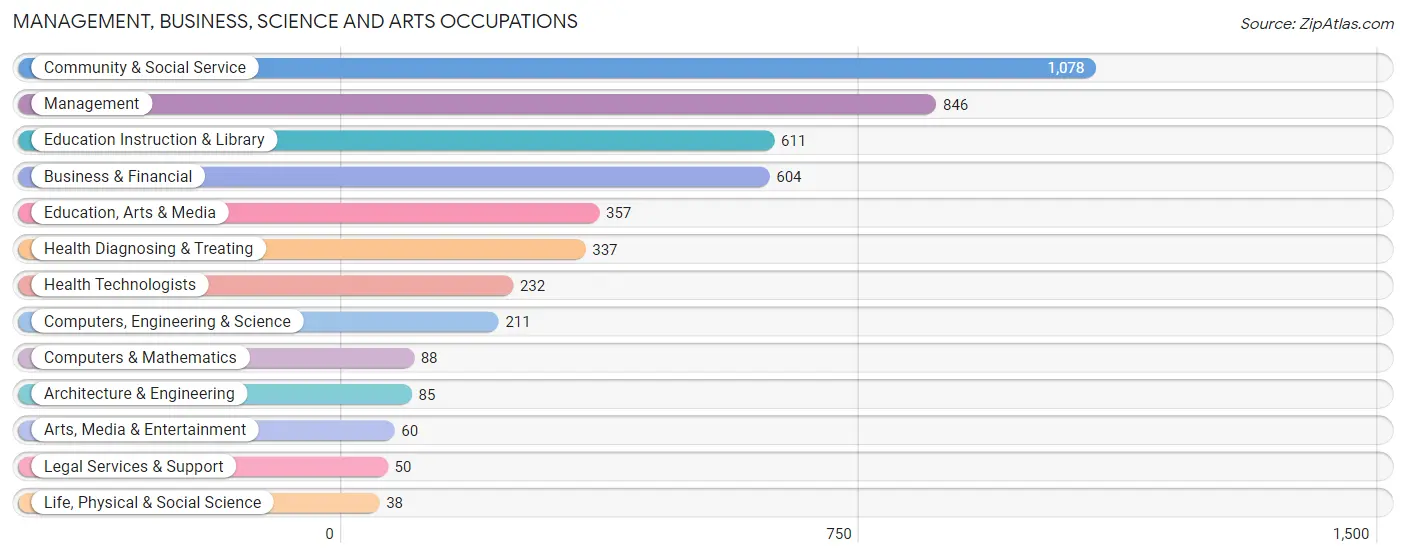
Management, Business, Science and Arts Occupations
The most common Management, Business, Science and Arts occupations in Asheboro are Community & Social Service (1,078 | 9.4%), Management (846 | 7.4%), Education Instruction & Library (611 | 5.3%), Business & Financial (604 | 5.3%), and Education, Arts & Media (357 | 3.1%).
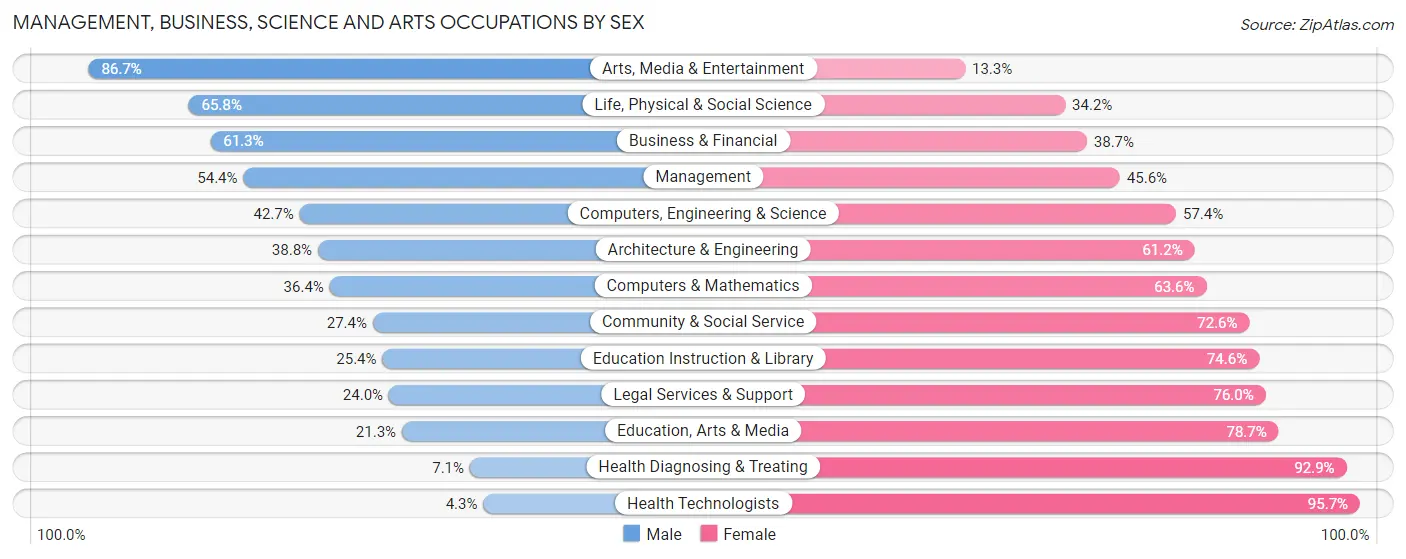
Management, Business, Science and Arts Occupations by Sex
Within the Management, Business, Science and Arts occupations in Asheboro, the most male-oriented occupations are Arts, Media & Entertainment (86.7%), Life, Physical & Social Science (65.8%), and Business & Financial (61.3%), while the most female-oriented occupations are Health Technologists (95.7%), Health Diagnosing & Treating (92.9%), and Education, Arts & Media (78.7%).
| Occupation | Male | Female |
| Management | 460 (54.4%) | 386 (45.6%) |
| Business & Financial | 370 (61.3%) | 234 (38.7%) |
| Computers, Engineering & Science | 90 (42.6%) | 121 (57.4%) |
| Computers & Mathematics | 32 (36.4%) | 56 (63.6%) |
| Architecture & Engineering | 33 (38.8%) | 52 (61.2%) |
| Life, Physical & Social Science | 25 (65.8%) | 13 (34.2%) |
| Community & Social Service | 295 (27.4%) | 783 (72.6%) |
| Education, Arts & Media | 76 (21.3%) | 281 (78.7%) |
| Legal Services & Support | 12 (24.0%) | 38 (76.0%) |
| Education Instruction & Library | 155 (25.4%) | 456 (74.6%) |
| Arts, Media & Entertainment | 52 (86.7%) | 8 (13.3%) |
| Health Diagnosing & Treating | 24 (7.1%) | 313 (92.9%) |
| Health Technologists | 10 (4.3%) | 222 (95.7%) |
| Total (Category) | 1,239 (40.3%) | 1,837 (59.7%) |
| Total (Overall) | 6,290 (54.9%) | 5,165 (45.1%) |
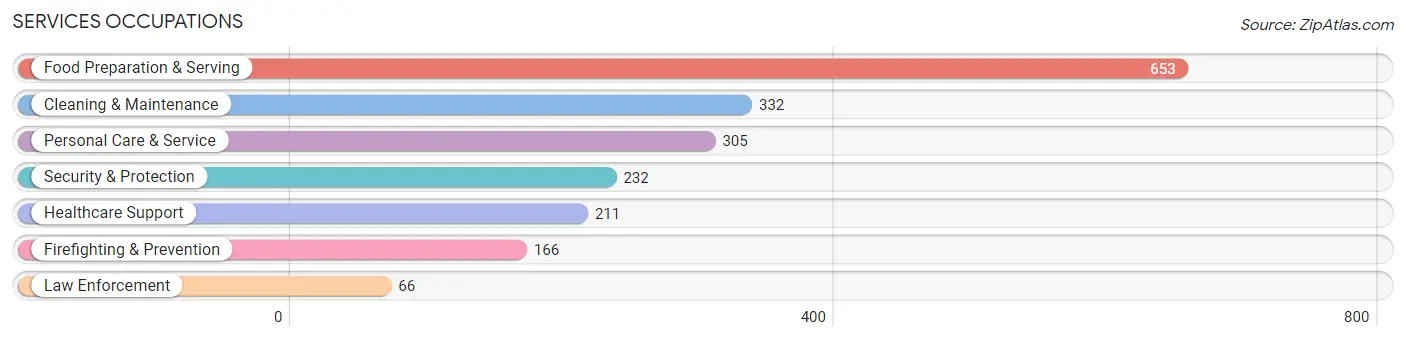
Services Occupations
The most common Services occupations in Asheboro are Food Preparation & Serving (653 | 5.7%), Cleaning & Maintenance (332 | 2.9%), Personal Care & Service (305 | 2.7%), Security & Protection (232 | 2.0%), and Healthcare Support (211 | 1.8%).
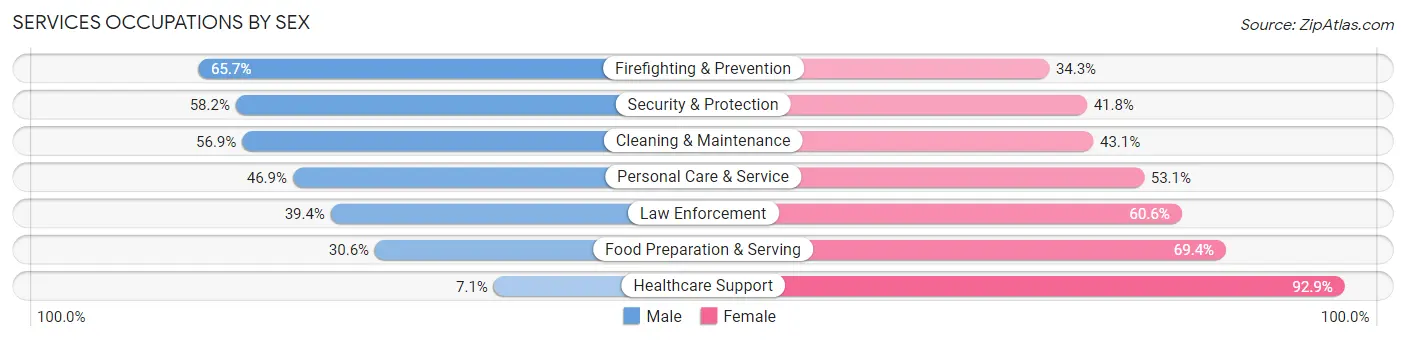
Services Occupations by Sex
Within the Services occupations in Asheboro, the most male-oriented occupations are Firefighting & Prevention (65.7%), Security & Protection (58.2%), and Cleaning & Maintenance (56.9%), while the most female-oriented occupations are Healthcare Support (92.9%), Food Preparation & Serving (69.4%), and Law Enforcement (60.6%).
| Occupation | Male | Female |
| Healthcare Support | 15 (7.1%) | 196 (92.9%) |
| Security & Protection | 135 (58.2%) | 97 (41.8%) |
| Firefighting & Prevention | 109 (65.7%) | 57 (34.3%) |
| Law Enforcement | 26 (39.4%) | 40 (60.6%) |
| Food Preparation & Serving | 200 (30.6%) | 453 (69.4%) |
| Cleaning & Maintenance | 189 (56.9%) | 143 (43.1%) |
| Personal Care & Service | 143 (46.9%) | 162 (53.1%) |
| Total (Category) | 682 (39.4%) | 1,051 (60.7%) |
| Total (Overall) | 6,290 (54.9%) | 5,165 (45.1%) |
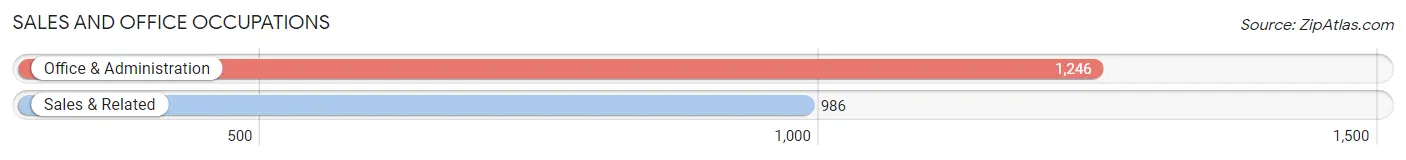
Sales and Office Occupations
The most common Sales and Office occupations in Asheboro are Office & Administration (1,246 | 10.9%), and Sales & Related (986 | 8.6%).
Sales and Office Occupations by Sex
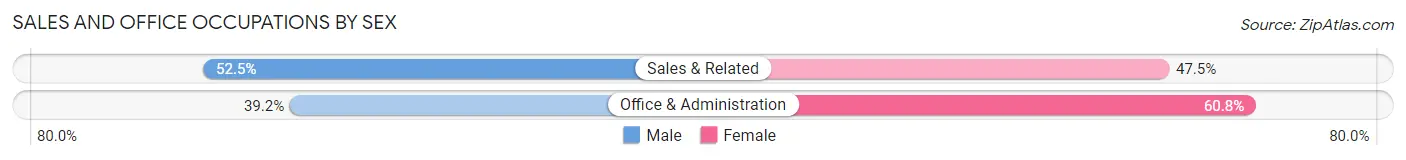
| Occupation | Male | Female |
| Sales & Related | 518 (52.5%) | 468 (47.5%) |
| Office & Administration | 488 (39.2%) | 758 (60.8%) |
| Total (Category) | 1,006 (45.1%) | 1,226 (54.9%) |
| Total (Overall) | 6,290 (54.9%) | 5,165 (45.1%) |
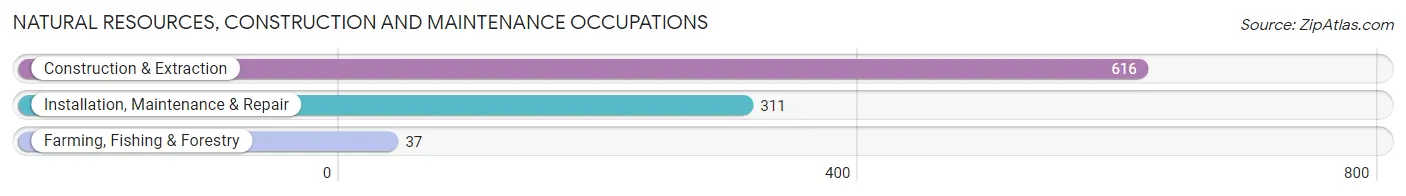
Natural Resources, Construction and Maintenance Occupations
The most common Natural Resources, Construction and Maintenance occupations in Asheboro are Construction & Extraction (616 | 5.4%), Installation, Maintenance & Repair (311 | 2.7%), and Farming, Fishing & Forestry (37 | 0.3%).
Natural Resources, Construction and Maintenance Occupations by Sex
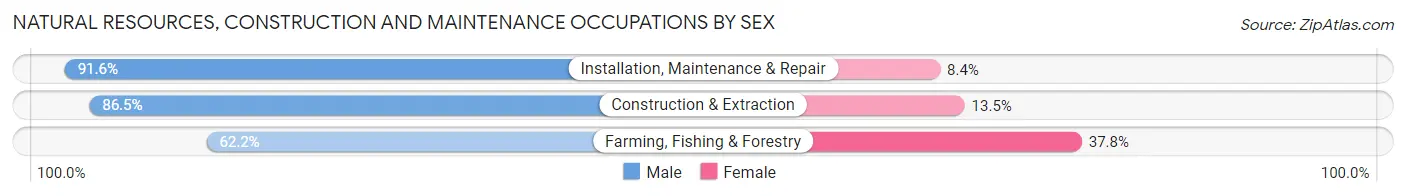
| Occupation | Male | Female |
| Farming, Fishing & Forestry | 23 (62.2%) | 14 (37.8%) |
| Construction & Extraction | 533 (86.5%) | 83 (13.5%) |
| Installation, Maintenance & Repair | 285 (91.6%) | 26 (8.4%) |
| Total (Category) | 841 (87.2%) | 123 (12.8%) |
| Total (Overall) | 6,290 (54.9%) | 5,165 (45.1%) |
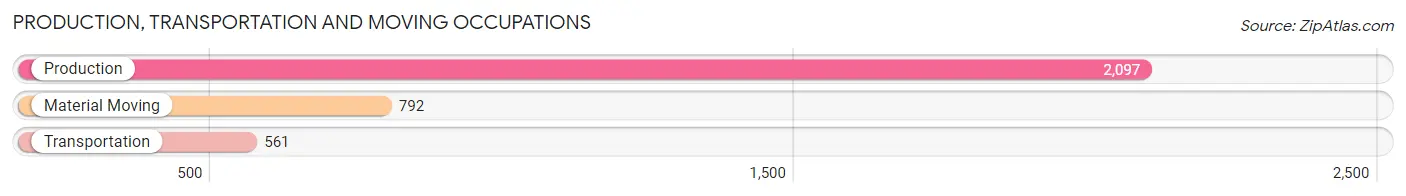
Production, Transportation and Moving Occupations
The most common Production, Transportation and Moving occupations in Asheboro are Production (2,097 | 18.3%), Material Moving (792 | 6.9%), and Transportation (561 | 4.9%).
Production, Transportation and Moving Occupations by Sex
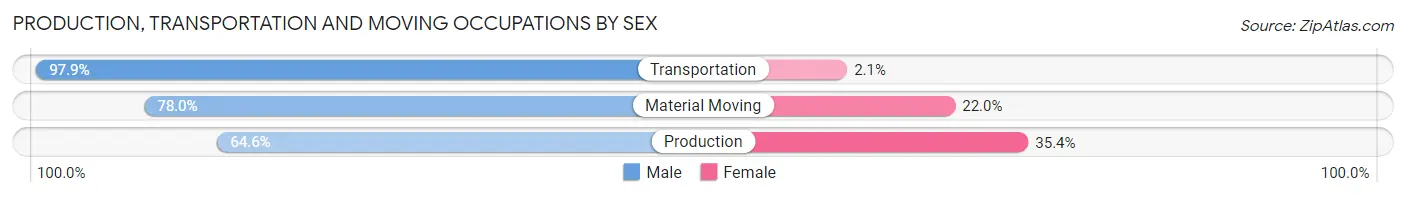
| Occupation | Male | Female |
| Production | 1,355 (64.6%) | 742 (35.4%) |
| Transportation | 549 (97.9%) | 12 (2.1%) |
| Material Moving | 618 (78.0%) | 174 (22.0%) |
| Total (Category) | 2,522 (73.1%) | 928 (26.9%) |
| Total (Overall) | 6,290 (54.9%) | 5,165 (45.1%) |
Employment Industries by Sex in Asheboro
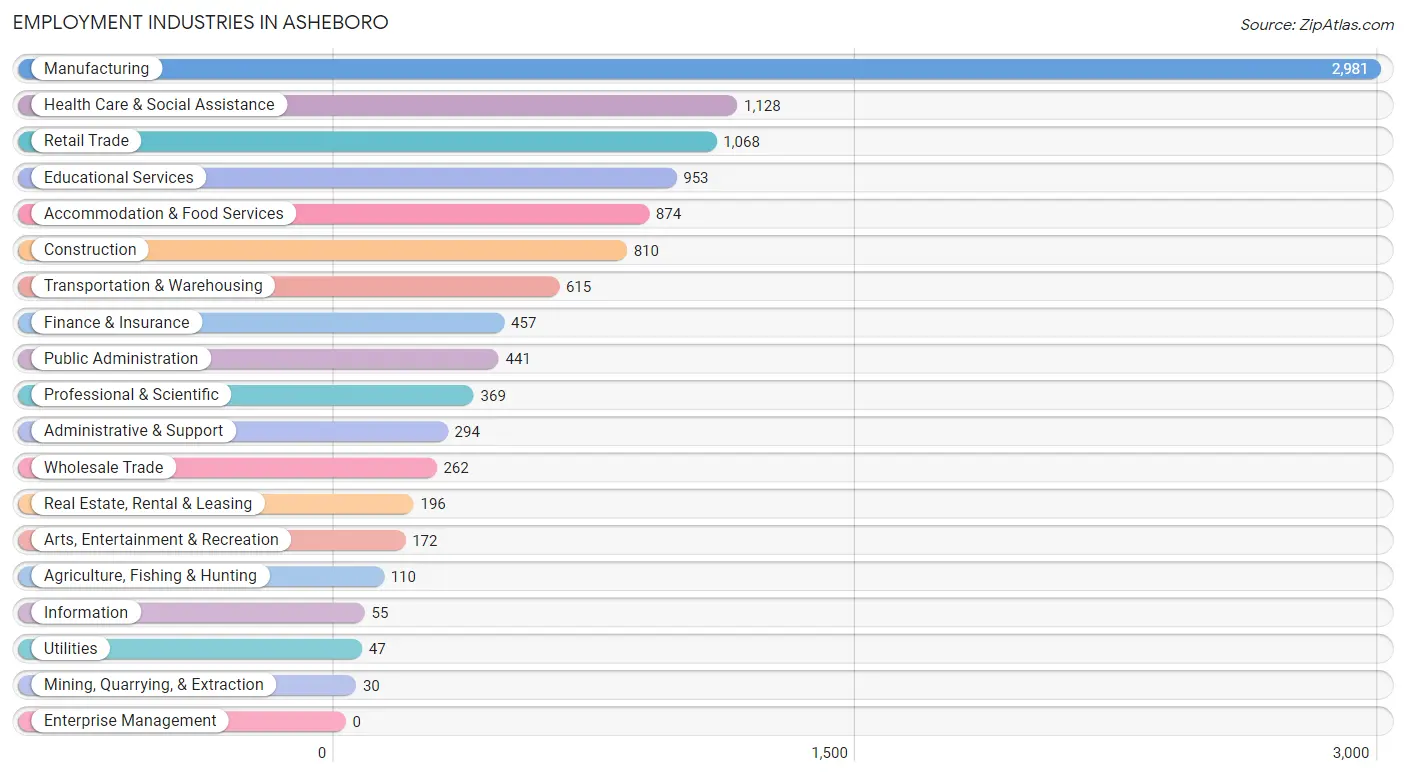
Employment Industries in Asheboro
The major employment industries in Asheboro include Manufacturing (2,981 | 26.0%), Health Care & Social Assistance (1,128 | 9.9%), Retail Trade (1,068 | 9.3%), Educational Services (953 | 8.3%), and Accommodation & Food Services (874 | 7.6%).
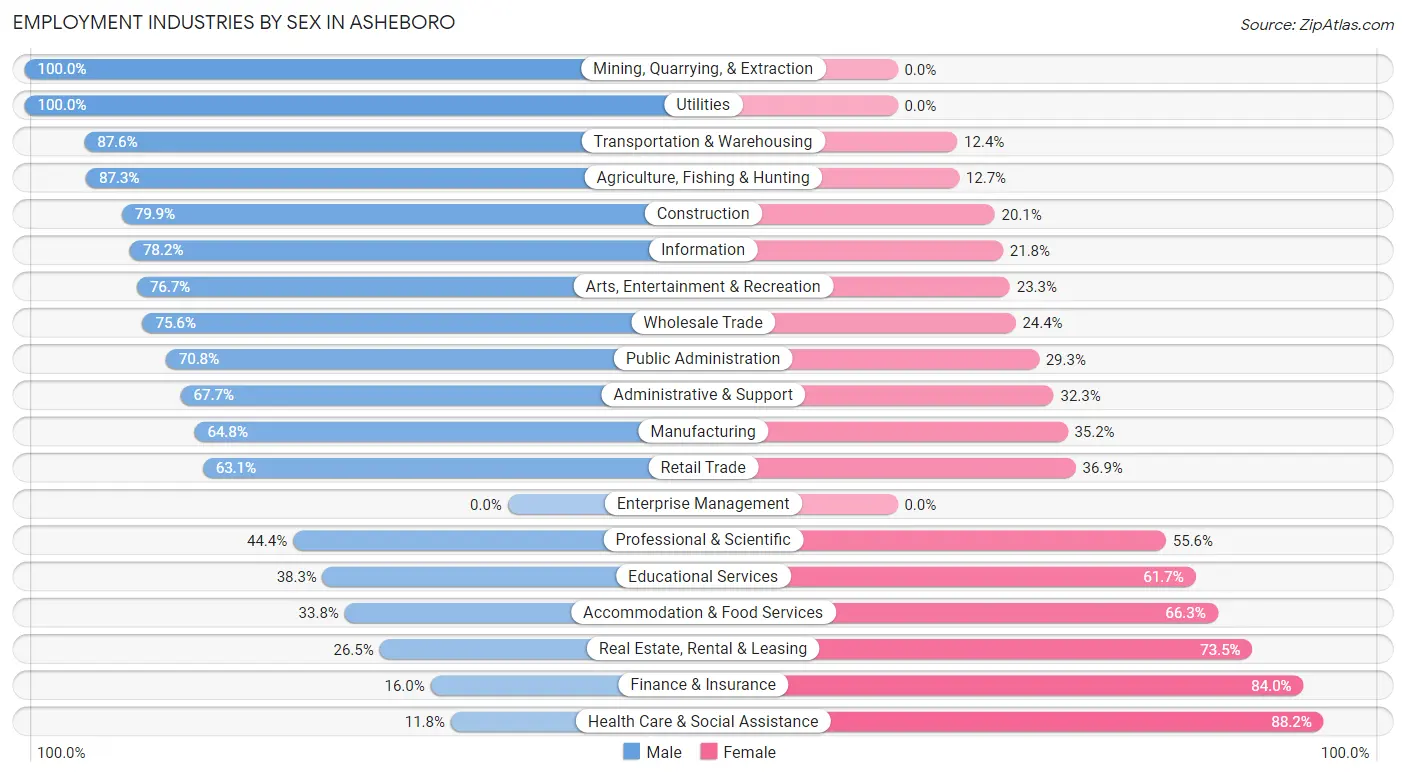
Employment Industries by Sex in Asheboro
The Asheboro industries that see more men than women are Mining, Quarrying, & Extraction (100.0%), Utilities (100.0%), and Transportation & Warehousing (87.6%), whereas the industries that tend to have a higher number of women are Health Care & Social Assistance (88.2%), Finance & Insurance (84.0%), and Real Estate, Rental & Leasing (73.5%).
| Industry | Male | Female |
| Agriculture, Fishing & Hunting | 96 (87.3%) | 14 (12.7%) |
| Mining, Quarrying, & Extraction | 30 (100.0%) | 0 (0.0%) |
| Construction | 647 (79.9%) | 163 (20.1%) |
| Manufacturing | 1,932 (64.8%) | 1,049 (35.2%) |
| Wholesale Trade | 198 (75.6%) | 64 (24.4%) |
| Retail Trade | 674 (63.1%) | 394 (36.9%) |
| Transportation & Warehousing | 539 (87.6%) | 76 (12.4%) |
| Utilities | 47 (100.0%) | 0 (0.0%) |
| Information | 43 (78.2%) | 12 (21.8%) |
| Finance & Insurance | 73 (16.0%) | 384 (84.0%) |
| Real Estate, Rental & Leasing | 52 (26.5%) | 144 (73.5%) |
| Professional & Scientific | 164 (44.4%) | 205 (55.6%) |
| Enterprise Management | 0 (0.0%) | 0 (0.0%) |
| Administrative & Support | 199 (67.7%) | 95 (32.3%) |
| Educational Services | 365 (38.3%) | 588 (61.7%) |
| Health Care & Social Assistance | 133 (11.8%) | 995 (88.2%) |
| Arts, Entertainment & Recreation | 132 (76.7%) | 40 (23.3%) |
| Accommodation & Food Services | 295 (33.8%) | 579 (66.2%) |
| Public Administration | 312 (70.8%) | 129 (29.2%) |
| Total | 6,290 (54.9%) | 5,165 (45.1%) |
Education in Asheboro
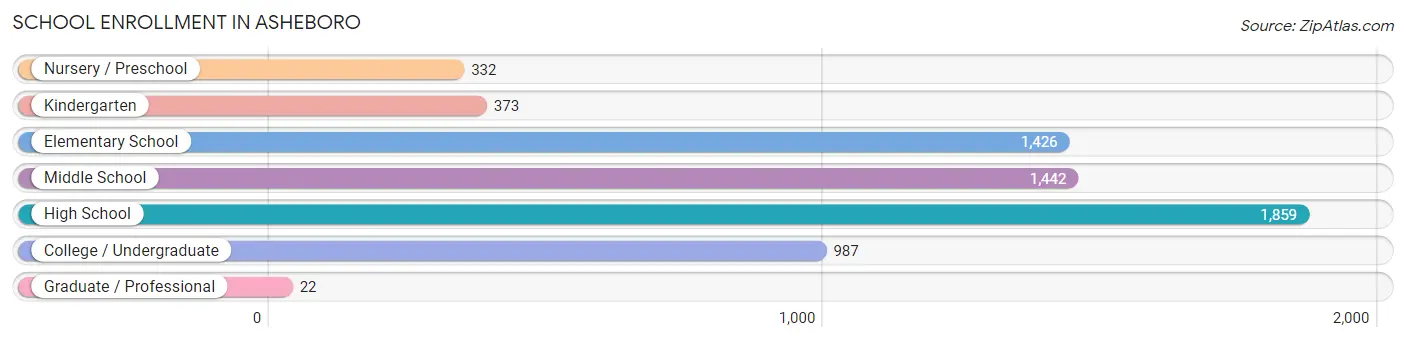
School Enrollment in Asheboro
The most common levels of schooling among the 6,441 students in Asheboro are high school (1,859 | 28.9%), middle school (1,442 | 22.4%), and elementary school (1,426 | 22.1%).
| School Level | # Students | % Students |
| Nursery / Preschool | 332 | 5.1% |
| Kindergarten | 373 | 5.8% |
| Elementary School | 1,426 | 22.1% |
| Middle School | 1,442 | 22.4% |
| High School | 1,859 | 28.9% |
| College / Undergraduate | 987 | 15.3% |
| Graduate / Professional | 22 | 0.3% |
| Total | 6,441 | 100.0% |
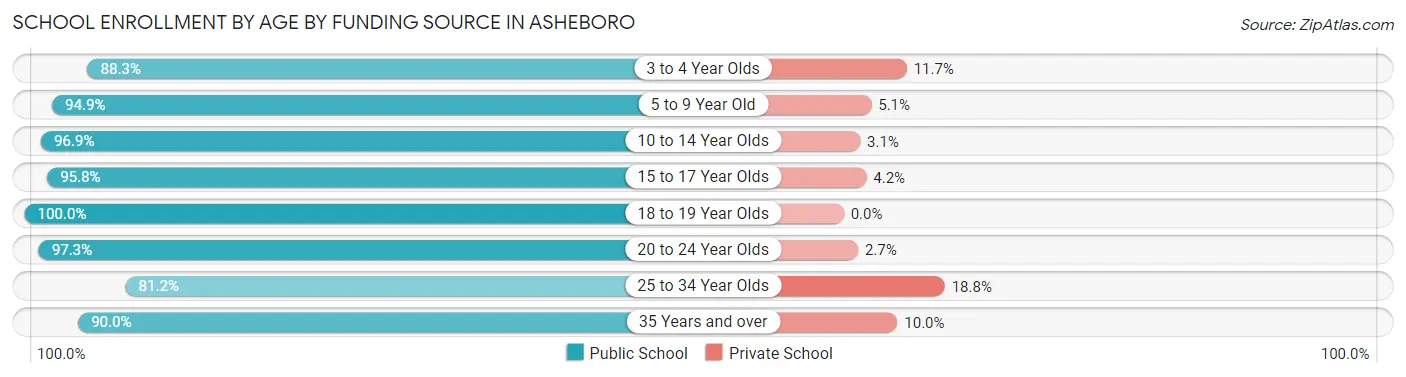
School Enrollment by Age by Funding Source in Asheboro
Out of a total of 6,441 students who are enrolled in schools in Asheboro, 316 (4.9%) attend a private institution, while the remaining 6,125 (95.1%) are enrolled in public schools. The age group of 25 to 34 year olds has the highest likelihood of being enrolled in private schools, with 42 (18.8% in the age bracket) enrolled. Conversely, the age group of 18 to 19 year olds has the lowest likelihood of being enrolled in a private school, with 208 (100.0% in the age bracket) attending a public institution.
| Age Bracket | Public School | Private School |
| 3 to 4 Year Olds | 188 (88.3%) | 25 (11.7%) |
| 5 to 9 Year Old | 1,697 (94.9%) | 92 (5.1%) |
| 10 to 14 Year Olds | 1,935 (96.9%) | 61 (3.1%) |
| 15 to 17 Year Olds | 1,090 (95.8%) | 48 (4.2%) |
| 18 to 19 Year Olds | 208 (100.0%) | 0 (0.0%) |
| 20 to 24 Year Olds | 549 (97.3%) | 15 (2.7%) |
| 25 to 34 Year Olds | 181 (81.2%) | 42 (18.8%) |
| 35 Years and over | 279 (90.0%) | 31 (10.0%) |
| Total | 6,125 (95.1%) | 316 (4.9%) |
Educational Attainment by Field of Study in Asheboro
Education (658 | 18.5%), business (632 | 17.8%), science & technology (385 | 10.8%), arts & humanities (367 | 10.3%), and literature & languages (251 | 7.1%) are the most common fields of study among 3,553 individuals in Asheboro who have obtained a bachelor's degree or higher.
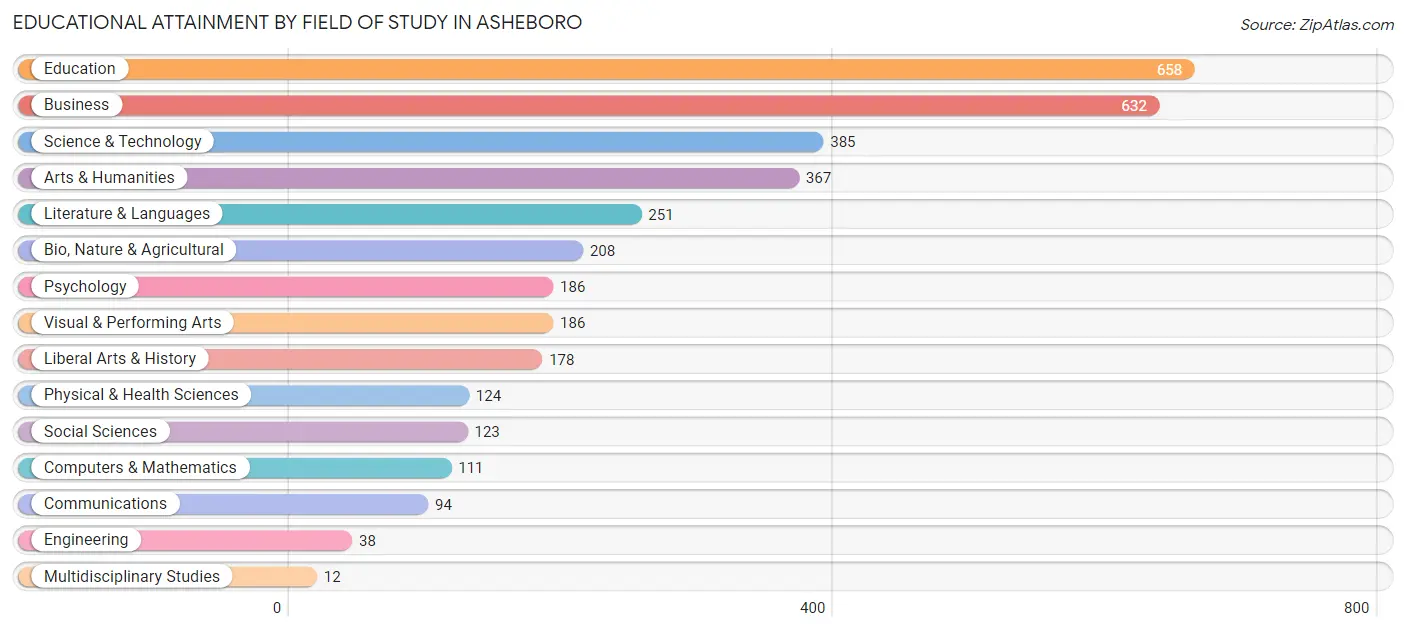
| Field of Study | # Graduates | % Graduates |
| Computers & Mathematics | 111 | 3.1% |
| Bio, Nature & Agricultural | 208 | 5.9% |
| Physical & Health Sciences | 124 | 3.5% |
| Psychology | 186 | 5.2% |
| Social Sciences | 123 | 3.5% |
| Engineering | 38 | 1.1% |
| Multidisciplinary Studies | 12 | 0.3% |
| Science & Technology | 385 | 10.8% |
| Business | 632 | 17.8% |
| Education | 658 | 18.5% |
| Literature & Languages | 251 | 7.1% |
| Liberal Arts & History | 178 | 5.0% |
| Visual & Performing Arts | 186 | 5.2% |
| Communications | 94 | 2.6% |
| Arts & Humanities | 367 | 10.3% |
| Total | 3,553 | 100.0% |
Transportation & Commute in Asheboro
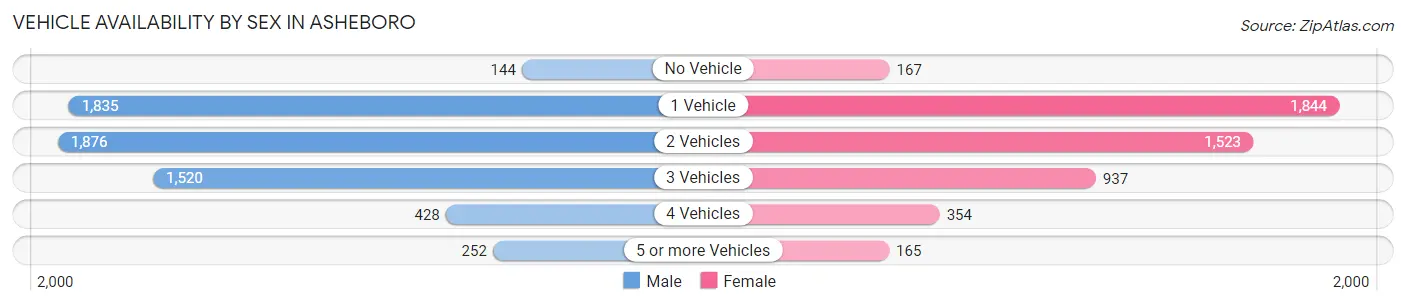
Vehicle Availability by Sex in Asheboro
The most prevalent vehicle ownership categories in Asheboro are males with 2 vehicles (1,876, accounting for 31.0%) and females with 2 vehicles (1,523, making up 37.6%).
| Vehicles Available | Male | Female |
| No Vehicle | 144 (2.4%) | 167 (3.4%) |
| 1 Vehicle | 1,835 (30.3%) | 1,844 (36.9%) |
| 2 Vehicles | 1,876 (31.0%) | 1,523 (30.5%) |
| 3 Vehicles | 1,520 (25.1%) | 937 (18.8%) |
| 4 Vehicles | 428 (7.1%) | 354 (7.1%) |
| 5 or more Vehicles | 252 (4.2%) | 165 (3.3%) |
| Total | 6,055 (100.0%) | 4,990 (100.0%) |
Commute Time in Asheboro
The most frequently occuring commute durations in Asheboro are 5 to 9 minutes (2,133 commuters, 20.2%), 10 to 14 minutes (2,006 commuters, 19.0%), and 15 to 19 minutes (1,644 commuters, 15.5%).
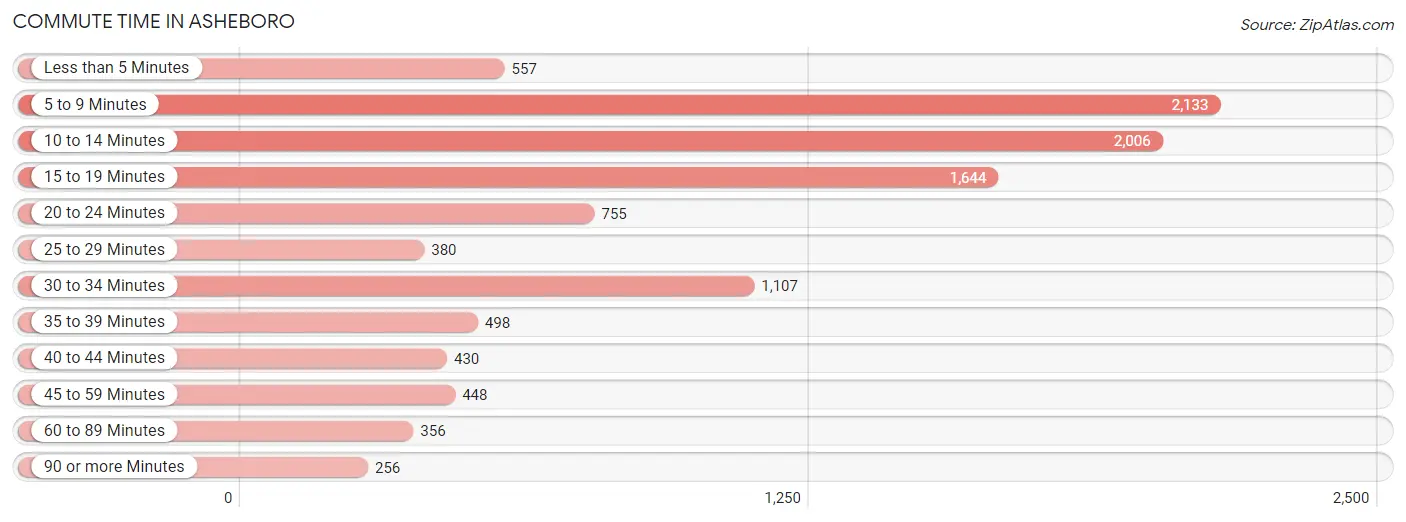
| Commute Time | # Commuters | % Commuters |
| Less than 5 Minutes | 557 | 5.3% |
| 5 to 9 Minutes | 2,133 | 20.2% |
| 10 to 14 Minutes | 2,006 | 19.0% |
| 15 to 19 Minutes | 1,644 | 15.5% |
| 20 to 24 Minutes | 755 | 7.1% |
| 25 to 29 Minutes | 380 | 3.6% |
| 30 to 34 Minutes | 1,107 | 10.5% |
| 35 to 39 Minutes | 498 | 4.7% |
| 40 to 44 Minutes | 430 | 4.1% |
| 45 to 59 Minutes | 448 | 4.2% |
| 60 to 89 Minutes | 356 | 3.4% |
| 90 or more Minutes | 256 | 2.4% |
Commute Time by Sex in Asheboro
The most common commute times in Asheboro are 5 to 9 minutes (1,198 commuters, 20.8%) for males and 10 to 14 minutes (992 commuters, 20.7%) for females.
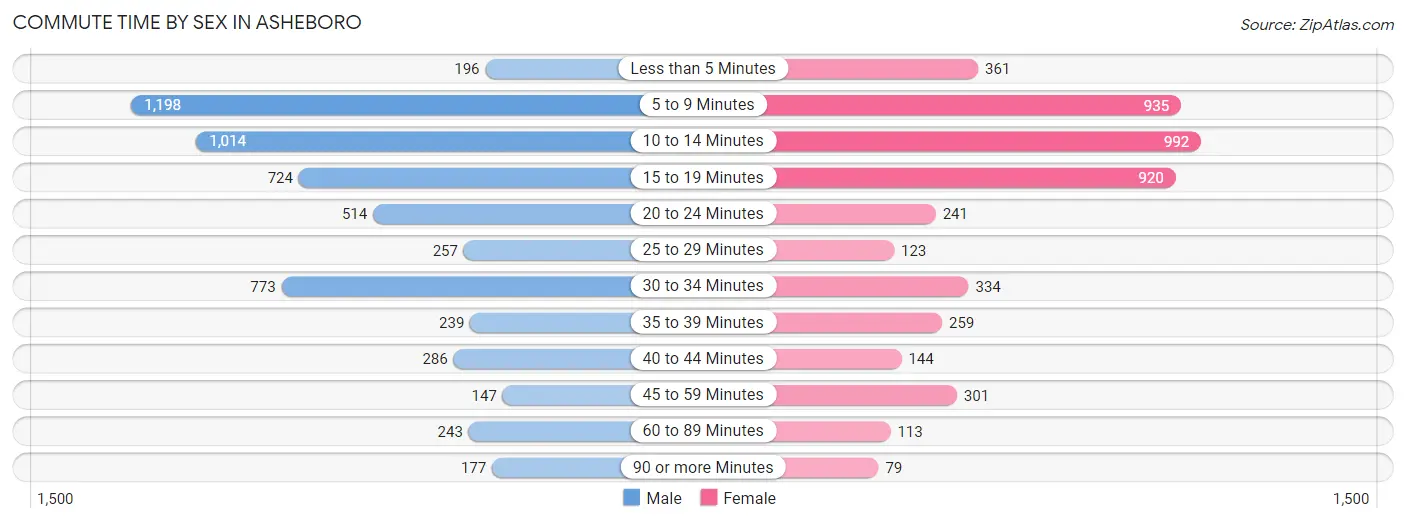
| Commute Time | Male | Female |
| Less than 5 Minutes | 196 (3.4%) | 361 (7.5%) |
| 5 to 9 Minutes | 1,198 (20.8%) | 935 (19.5%) |
| 10 to 14 Minutes | 1,014 (17.6%) | 992 (20.7%) |
| 15 to 19 Minutes | 724 (12.6%) | 920 (19.2%) |
| 20 to 24 Minutes | 514 (8.9%) | 241 (5.0%) |
| 25 to 29 Minutes | 257 (4.5%) | 123 (2.6%) |
| 30 to 34 Minutes | 773 (13.4%) | 334 (7.0%) |
| 35 to 39 Minutes | 239 (4.1%) | 259 (5.4%) |
| 40 to 44 Minutes | 286 (5.0%) | 144 (3.0%) |
| 45 to 59 Minutes | 147 (2.5%) | 301 (6.3%) |
| 60 to 89 Minutes | 243 (4.2%) | 113 (2.4%) |
| 90 or more Minutes | 177 (3.1%) | 79 (1.7%) |
Time of Departure to Work by Sex in Asheboro
The most frequent times of departure to work in Asheboro are 6:30 AM to 6:59 AM (1,051, 18.2%) for males and 7:00 AM to 7:29 AM (848, 17.7%) for females.
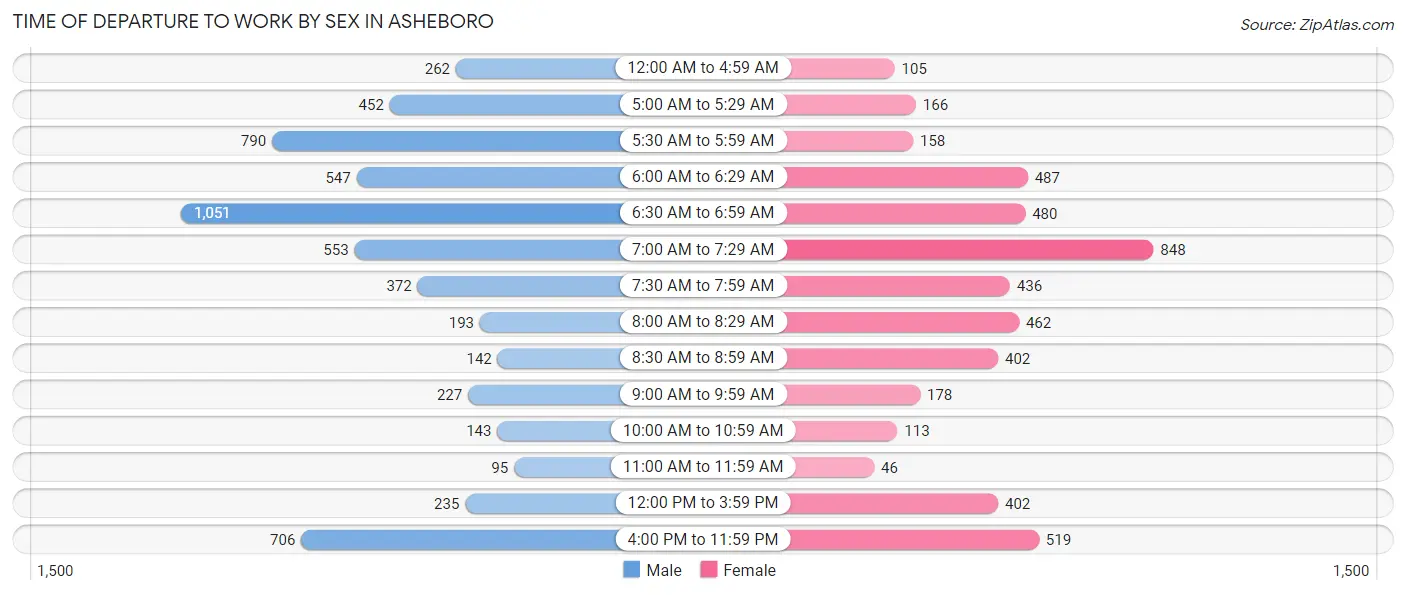
| Time of Departure | Male | Female |
| 12:00 AM to 4:59 AM | 262 (4.5%) | 105 (2.2%) |
| 5:00 AM to 5:29 AM | 452 (7.8%) | 166 (3.5%) |
| 5:30 AM to 5:59 AM | 790 (13.7%) | 158 (3.3%) |
| 6:00 AM to 6:29 AM | 547 (9.5%) | 487 (10.1%) |
| 6:30 AM to 6:59 AM | 1,051 (18.2%) | 480 (10.0%) |
| 7:00 AM to 7:29 AM | 553 (9.6%) | 848 (17.7%) |
| 7:30 AM to 7:59 AM | 372 (6.5%) | 436 (9.1%) |
| 8:00 AM to 8:29 AM | 193 (3.4%) | 462 (9.6%) |
| 8:30 AM to 8:59 AM | 142 (2.5%) | 402 (8.4%) |
| 9:00 AM to 9:59 AM | 227 (3.9%) | 178 (3.7%) |
| 10:00 AM to 10:59 AM | 143 (2.5%) | 113 (2.4%) |
| 11:00 AM to 11:59 AM | 95 (1.7%) | 46 (1.0%) |
| 12:00 PM to 3:59 PM | 235 (4.1%) | 402 (8.4%) |
| 4:00 PM to 11:59 PM | 706 (12.2%) | 519 (10.8%) |
| Total | 5,768 (100.0%) | 4,802 (100.0%) |
Housing Occupancy in Asheboro
Occupancy by Ownership in Asheboro
Of the total 11,084 dwellings in Asheboro, owner-occupied units account for 5,341 (48.2%), while renter-occupied units make up 5,743 (51.8%).
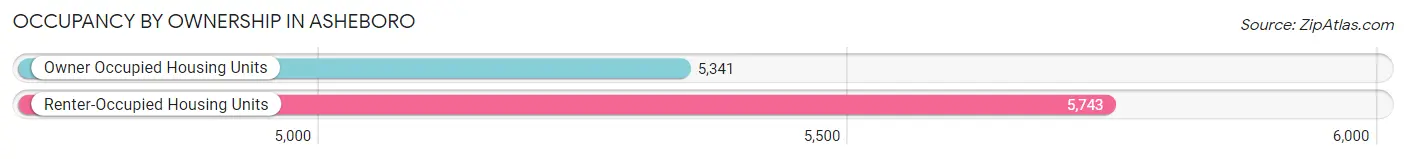
| Occupancy | # Housing Units | % Housing Units |
| Owner Occupied Housing Units | 5,341 | 48.2% |
| Renter-Occupied Housing Units | 5,743 | 51.8% |
| Total Occupied Housing Units | 11,084 | 100.0% |
Occupancy by Household Size in Asheboro
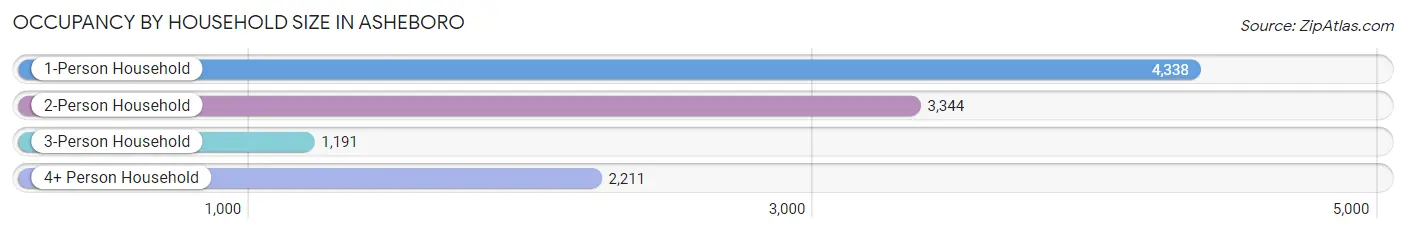
| Household Size | # Housing Units | % Housing Units |
| 1-Person Household | 4,338 | 39.1% |
| 2-Person Household | 3,344 | 30.2% |
| 3-Person Household | 1,191 | 10.7% |
| 4+ Person Household | 2,211 | 20.0% |
| Total Housing Units | 11,084 | 100.0% |
Occupancy by Ownership by Household Size in Asheboro
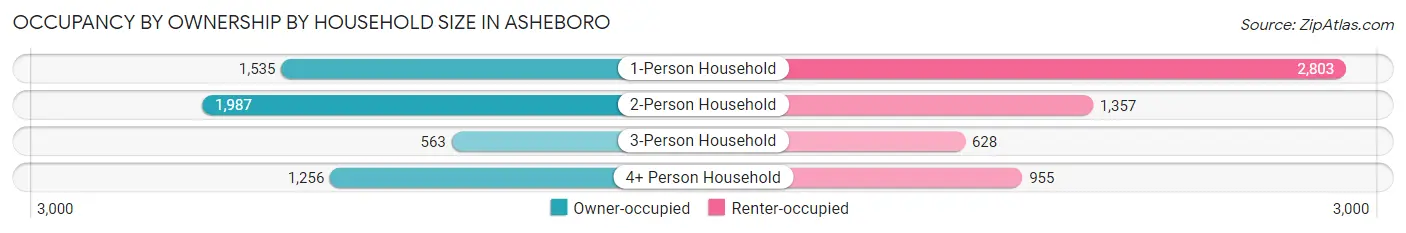
| Household Size | Owner-occupied | Renter-occupied |
| 1-Person Household | 1,535 (35.4%) | 2,803 (64.6%) |
| 2-Person Household | 1,987 (59.4%) | 1,357 (40.6%) |
| 3-Person Household | 563 (47.3%) | 628 (52.7%) |
| 4+ Person Household | 1,256 (56.8%) | 955 (43.2%) |
| Total Housing Units | 5,341 (48.2%) | 5,743 (51.8%) |
Occupancy by Educational Attainment in Asheboro
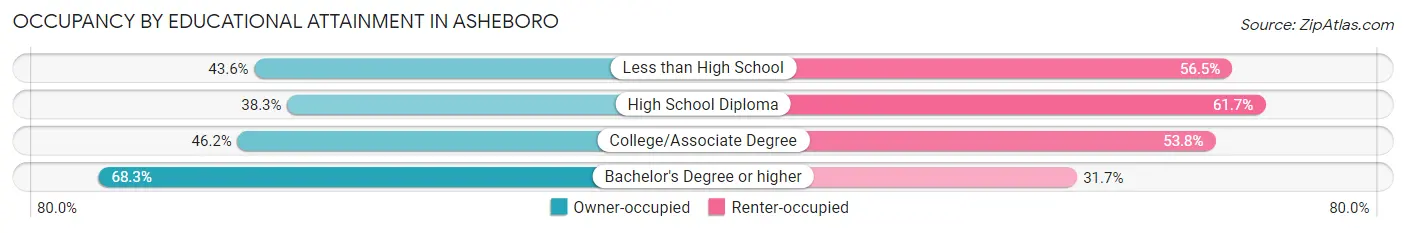
| Household Size | Owner-occupied | Renter-occupied |
| Less than High School | 682 (43.5%) | 884 (56.5%) |
| High School Diploma | 1,187 (38.3%) | 1,911 (61.7%) |
| College/Associate Degree | 1,908 (46.2%) | 2,221 (53.8%) |
| Bachelor's Degree or higher | 1,564 (68.3%) | 727 (31.7%) |
Occupancy by Age of Householder in Asheboro
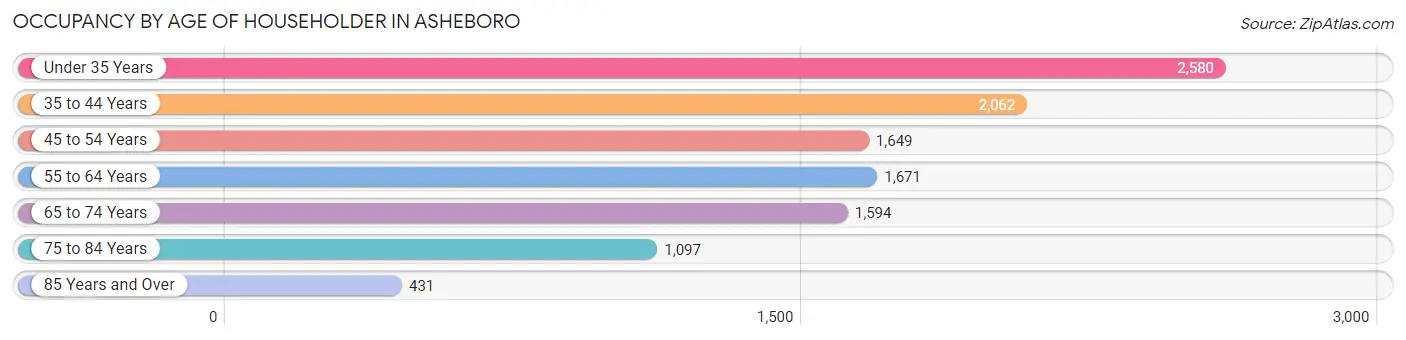
| Age Bracket | # Households | % Households |
| Under 35 Years | 2,580 | 23.3% |
| 35 to 44 Years | 2,062 | 18.6% |
| 45 to 54 Years | 1,649 | 14.9% |
| 55 to 64 Years | 1,671 | 15.1% |
| 65 to 74 Years | 1,594 | 14.4% |
| 75 to 84 Years | 1,097 | 9.9% |
| 85 Years and Over | 431 | 3.9% |
| Total | 11,084 | 100.0% |
Housing Finances in Asheboro
Median Income by Occupancy in Asheboro
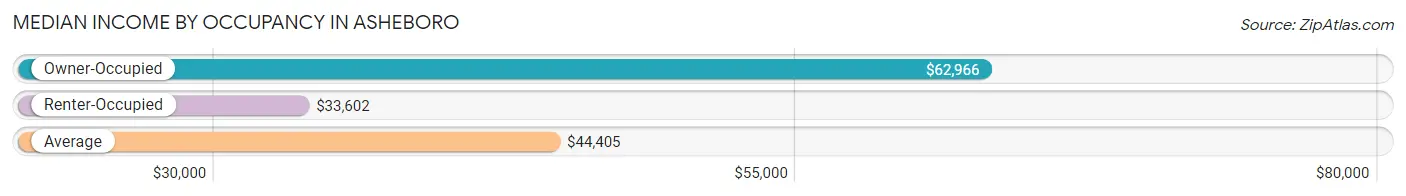
| Occupancy Type | # Households | Median Income |
| Owner-Occupied | 5,341 (48.2%) | $62,966 |
| Renter-Occupied | 5,743 (51.8%) | $33,602 |
| Average | 11,084 (100.0%) | $44,405 |
Occupancy by Householder Income Bracket in Asheboro
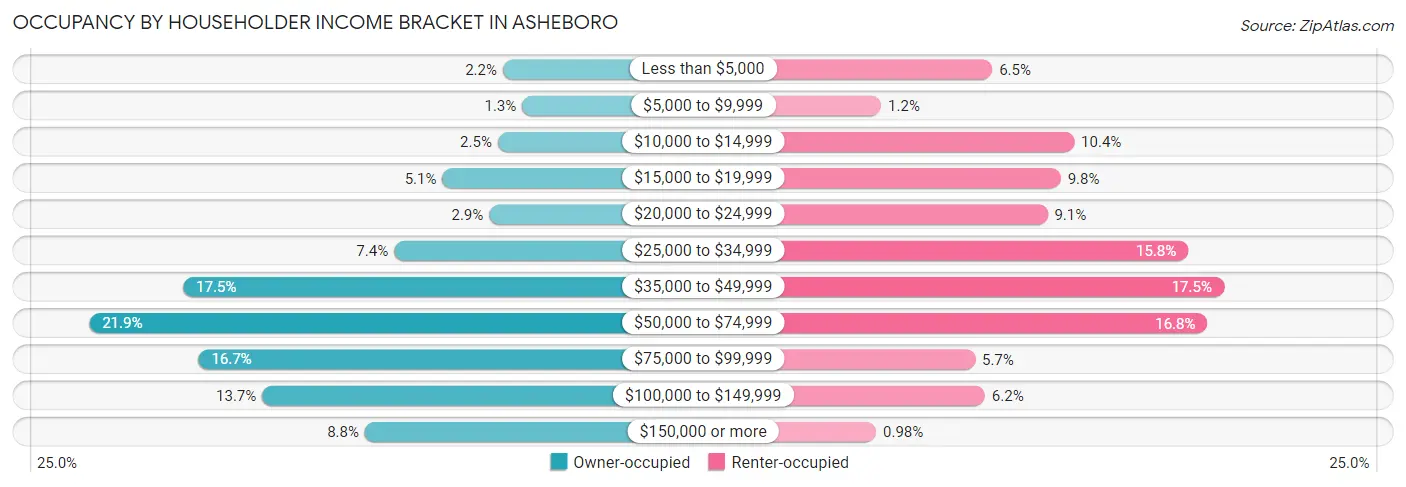
| Income Bracket | Owner-occupied | Renter-occupied |
| Less than $5,000 | 119 (2.2%) | 374 (6.5%) |
| $5,000 to $9,999 | 70 (1.3%) | 70 (1.2%) |
| $10,000 to $14,999 | 132 (2.5%) | 598 (10.4%) |
| $15,000 to $19,999 | 273 (5.1%) | 561 (9.8%) |
| $20,000 to $24,999 | 154 (2.9%) | 525 (9.1%) |
| $25,000 to $34,999 | 396 (7.4%) | 909 (15.8%) |
| $35,000 to $49,999 | 932 (17.4%) | 1,007 (17.5%) |
| $50,000 to $74,999 | 1,171 (21.9%) | 962 (16.8%) |
| $75,000 to $99,999 | 893 (16.7%) | 327 (5.7%) |
| $100,000 to $149,999 | 731 (13.7%) | 354 (6.2%) |
| $150,000 or more | 470 (8.8%) | 56 (1.0%) |
| Total | 5,341 (100.0%) | 5,743 (100.0%) |
Monthly Housing Cost Tiers in Asheboro
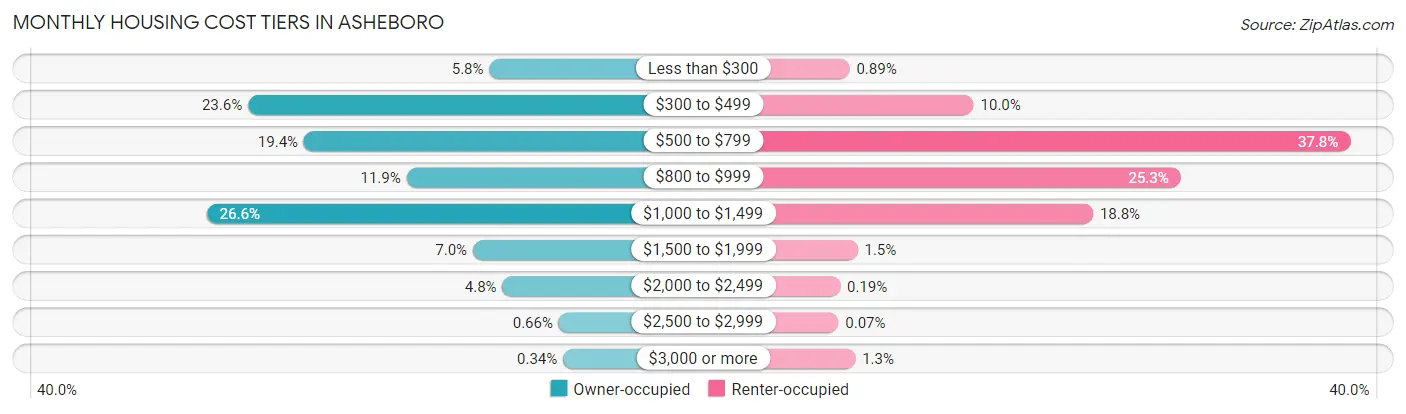
| Monthly Cost | Owner-occupied | Renter-occupied |
| Less than $300 | 308 (5.8%) | 51 (0.9%) |
| $300 to $499 | 1,258 (23.5%) | 576 (10.0%) |
| $500 to $799 | 1,038 (19.4%) | 2,168 (37.8%) |
| $800 to $999 | 634 (11.9%) | 1,451 (25.3%) |
| $1,000 to $1,499 | 1,420 (26.6%) | 1,081 (18.8%) |
| $1,500 to $1,999 | 373 (7.0%) | 85 (1.5%) |
| $2,000 to $2,499 | 257 (4.8%) | 11 (0.2%) |
| $2,500 to $2,999 | 35 (0.7%) | 4 (0.1%) |
| $3,000 or more | 18 (0.3%) | 75 (1.3%) |
| Total | 5,341 (100.0%) | 5,743 (100.0%) |
Physical Housing Characteristics in Asheboro
Housing Structures in Asheboro
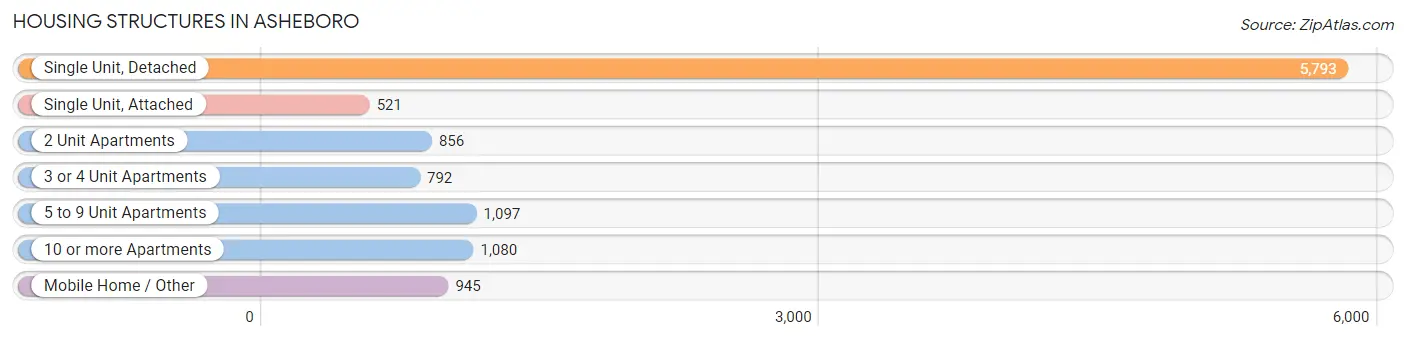
| Structure Type | # Housing Units | % Housing Units |
| Single Unit, Detached | 5,793 | 52.3% |
| Single Unit, Attached | 521 | 4.7% |
| 2 Unit Apartments | 856 | 7.7% |
| 3 or 4 Unit Apartments | 792 | 7.1% |
| 5 to 9 Unit Apartments | 1,097 | 9.9% |
| 10 or more Apartments | 1,080 | 9.7% |
| Mobile Home / Other | 945 | 8.5% |
| Total | 11,084 | 100.0% |
Housing Structures by Occupancy in Asheboro
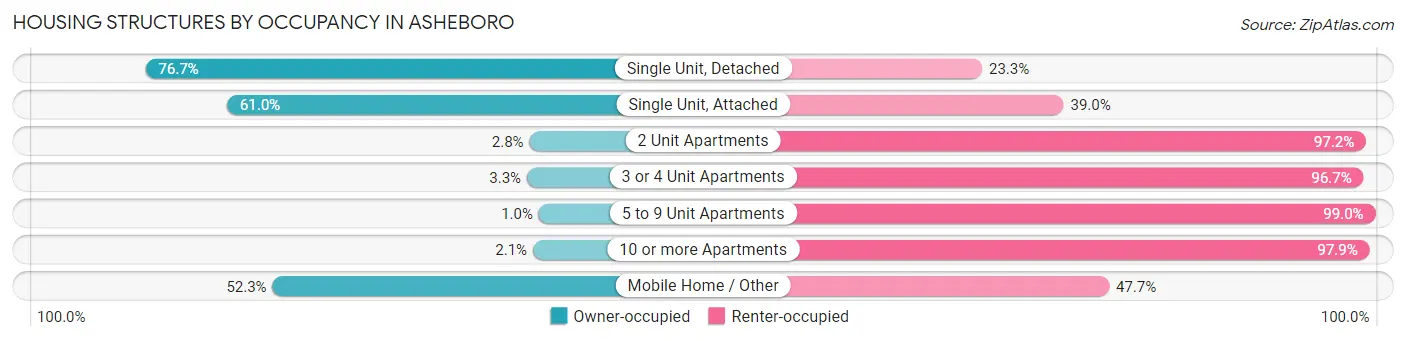
| Structure Type | Owner-occupied | Renter-occupied |
| Single Unit, Detached | 4,445 (76.7%) | 1,348 (23.3%) |
| Single Unit, Attached | 318 (61.0%) | 203 (39.0%) |
| 2 Unit Apartments | 24 (2.8%) | 832 (97.2%) |
| 3 or 4 Unit Apartments | 26 (3.3%) | 766 (96.7%) |
| 5 to 9 Unit Apartments | 11 (1.0%) | 1,086 (99.0%) |
| 10 or more Apartments | 23 (2.1%) | 1,057 (97.9%) |
| Mobile Home / Other | 494 (52.3%) | 451 (47.7%) |
| Total | 5,341 (48.2%) | 5,743 (51.8%) |
Housing Structures by Number of Rooms in Asheboro
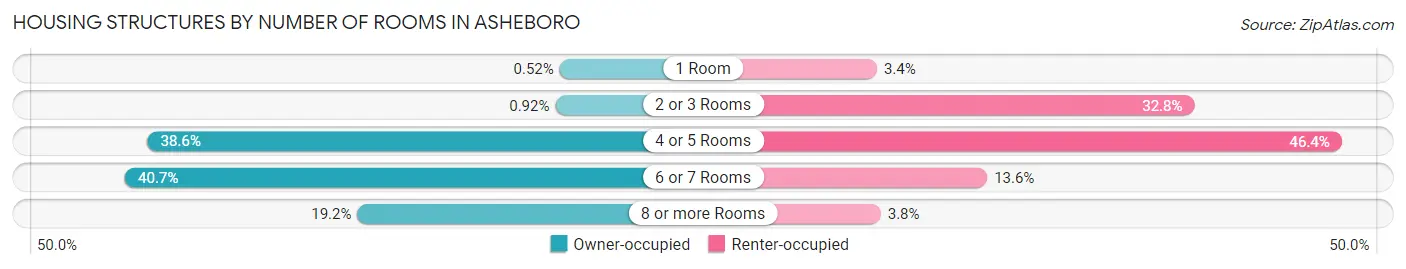
| Number of Rooms | Owner-occupied | Renter-occupied |
| 1 Room | 28 (0.5%) | 197 (3.4%) |
| 2 or 3 Rooms | 49 (0.9%) | 1,882 (32.8%) |
| 4 or 5 Rooms | 2,063 (38.6%) | 2,665 (46.4%) |
| 6 or 7 Rooms | 2,174 (40.7%) | 782 (13.6%) |
| 8 or more Rooms | 1,027 (19.2%) | 217 (3.8%) |
| Total | 5,341 (100.0%) | 5,743 (100.0%) |
Housing Structure by Heating Type in Asheboro
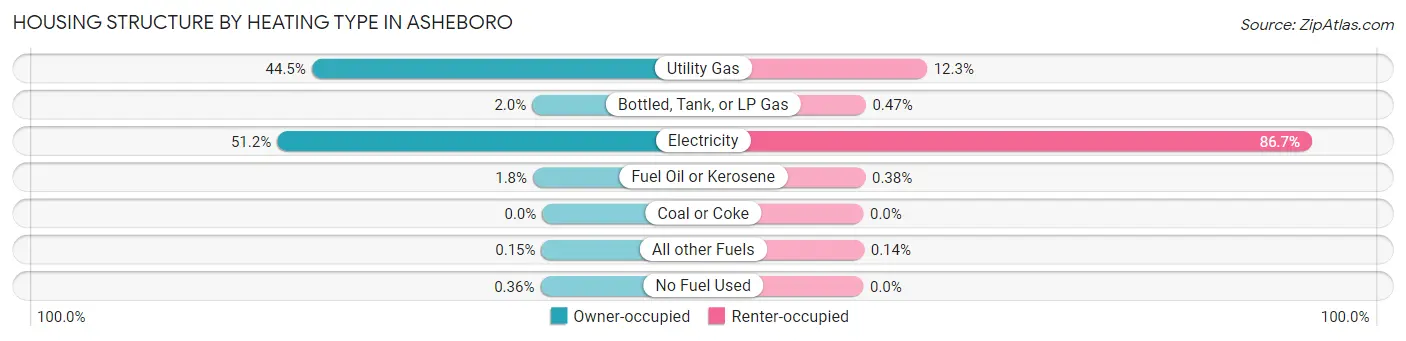
| Heating Type | Owner-occupied | Renter-occupied |
| Utility Gas | 2,379 (44.5%) | 707 (12.3%) |
| Bottled, Tank, or LP Gas | 104 (1.9%) | 27 (0.5%) |
| Electricity | 2,736 (51.2%) | 4,979 (86.7%) |
| Fuel Oil or Kerosene | 95 (1.8%) | 22 (0.4%) |
| Coal or Coke | 0 (0.0%) | 0 (0.0%) |
| All other Fuels | 8 (0.2%) | 8 (0.1%) |
| No Fuel Used | 19 (0.4%) | 0 (0.0%) |
| Total | 5,341 (100.0%) | 5,743 (100.0%) |
Household Vehicle Usage in Asheboro
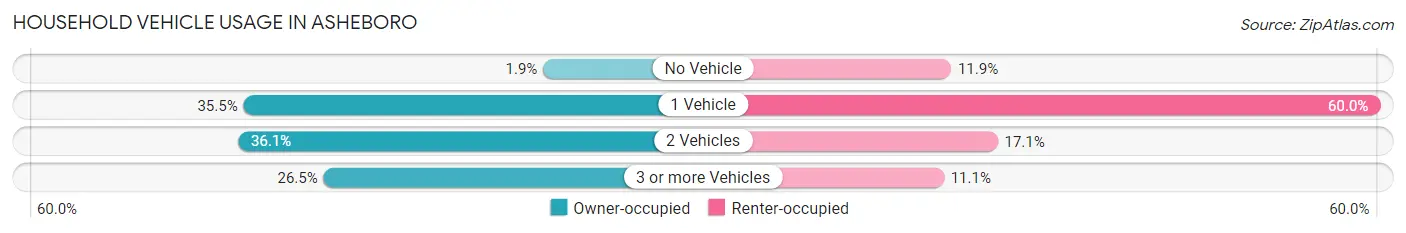
| Vehicles per Household | Owner-occupied | Renter-occupied |
| No Vehicle | 102 (1.9%) | 682 (11.9%) |
| 1 Vehicle | 1,895 (35.5%) | 3,443 (60.0%) |
| 2 Vehicles | 1,928 (36.1%) | 982 (17.1%) |
| 3 or more Vehicles | 1,416 (26.5%) | 636 (11.1%) |
| Total | 5,341 (100.0%) | 5,743 (100.0%) |
Real Estate & Mortgages in Asheboro
Real Estate and Mortgage Overview in Asheboro
| Characteristic | Without Mortgage | With Mortgage |
| Housing Units | 2,532 | 2,809 |
| Median Property Value | $125,000 | $166,800 |
| Median Household Income | $49,213 | $294 |
| Monthly Housing Costs | $464 | $18 |
| Real Estate Taxes | $1,628 | $43 |
Property Value by Mortgage Status in Asheboro
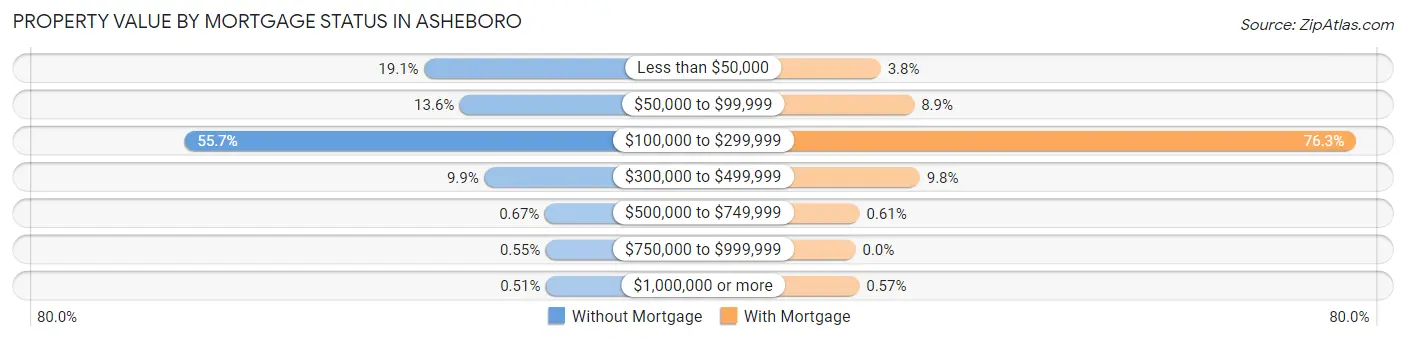
| Property Value | Without Mortgage | With Mortgage |
| Less than $50,000 | 483 (19.1%) | 108 (3.8%) |
| $50,000 to $99,999 | 345 (13.6%) | 251 (8.9%) |
| $100,000 to $299,999 | 1,409 (55.6%) | 2,142 (76.2%) |
| $300,000 to $499,999 | 251 (9.9%) | 275 (9.8%) |
| $500,000 to $749,999 | 17 (0.7%) | 17 (0.6%) |
| $750,000 to $999,999 | 14 (0.5%) | 0 (0.0%) |
| $1,000,000 or more | 13 (0.5%) | 16 (0.6%) |
| Total | 2,532 (100.0%) | 2,809 (100.0%) |
Household Income by Mortgage Status in Asheboro
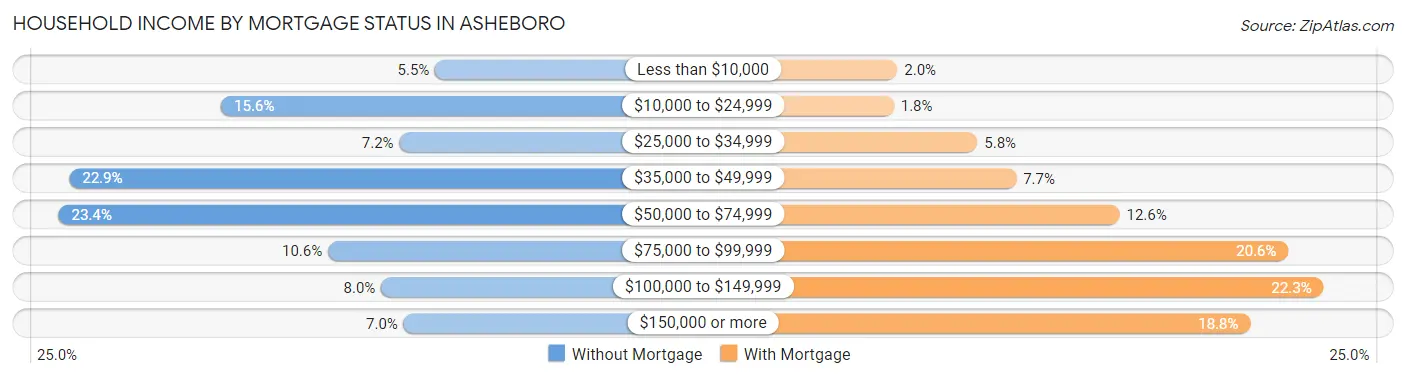
| Household Income | Without Mortgage | With Mortgage |
| Less than $10,000 | 138 (5.4%) | 56 (2.0%) |
| $10,000 to $24,999 | 396 (15.6%) | 51 (1.8%) |
| $25,000 to $34,999 | 181 (7.1%) | 163 (5.8%) |
| $35,000 to $49,999 | 579 (22.9%) | 215 (7.6%) |
| $50,000 to $74,999 | 592 (23.4%) | 353 (12.6%) |
| $75,000 to $99,999 | 267 (10.5%) | 579 (20.6%) |
| $100,000 to $149,999 | 203 (8.0%) | 626 (22.3%) |
| $150,000 or more | 176 (7.0%) | 528 (18.8%) |
| Total | 2,532 (100.0%) | 2,809 (100.0%) |
Property Value to Household Income Ratio in Asheboro
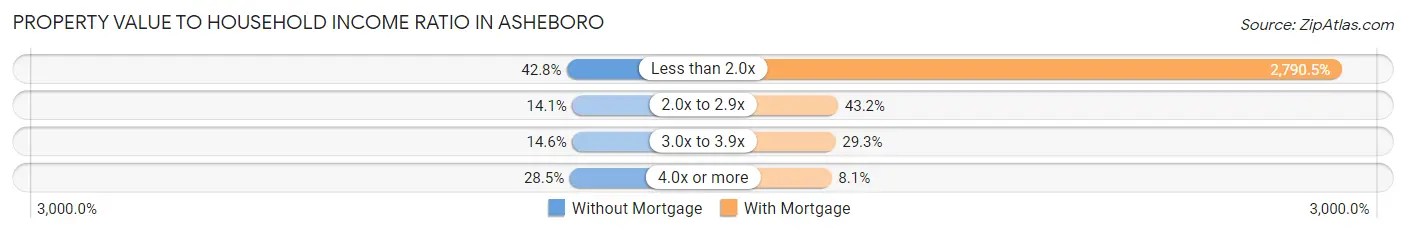
| Value-to-Income Ratio | Without Mortgage | With Mortgage |
| Less than 2.0x | 1,084 (42.8%) | 78,384 (2,790.5%) |
| 2.0x to 2.9x | 356 (14.1%) | 1,213 (43.2%) |
| 3.0x to 3.9x | 370 (14.6%) | 823 (29.3%) |
| 4.0x or more | 722 (28.5%) | 228 (8.1%) |
| Total | 2,532 (100.0%) | 2,809 (100.0%) |
Real Estate Taxes by Mortgage Status in Asheboro
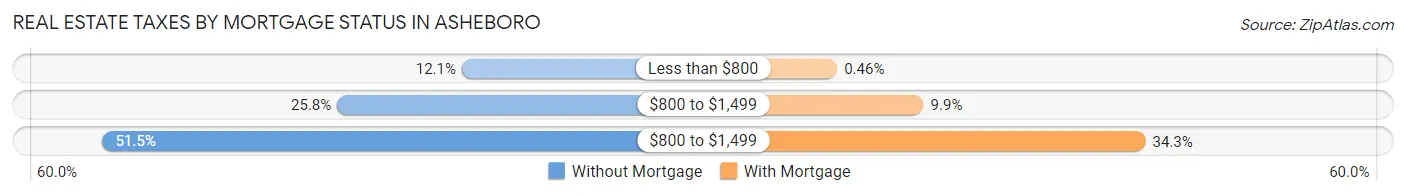
| Property Taxes | Without Mortgage | With Mortgage |
| Less than $800 | 306 (12.1%) | 13 (0.5%) |
| $800 to $1,499 | 652 (25.8%) | 279 (9.9%) |
| $800 to $1,499 | 1,303 (51.5%) | 962 (34.3%) |
| Total | 2,532 (100.0%) | 2,809 (100.0%) |
Health & Disability in Asheboro
Health Insurance Coverage by Age in Asheboro
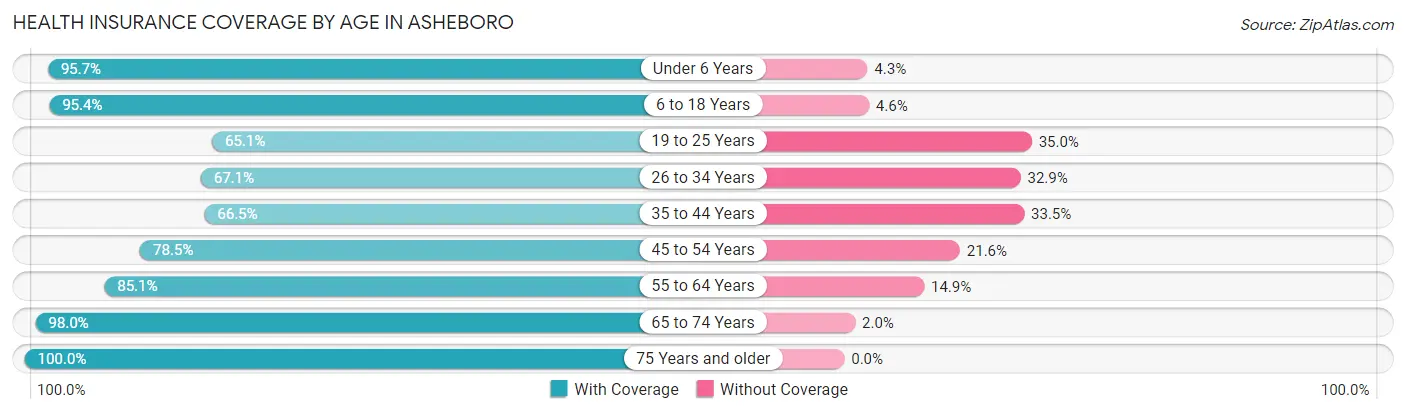
| Age Bracket | With Coverage | Without Coverage |
| Under 6 Years | 2,111 (95.7%) | 95 (4.3%) |
| 6 to 18 Years | 4,963 (95.4%) | 239 (4.6%) |
| 19 to 25 Years | 1,541 (65.0%) | 828 (34.9%) |
| 26 to 34 Years | 2,145 (67.1%) | 1,050 (32.9%) |
| 35 to 44 Years | 2,623 (66.5%) | 1,323 (33.5%) |
| 45 to 54 Years | 2,009 (78.4%) | 552 (21.5%) |
| 55 to 64 Years | 2,209 (85.1%) | 386 (14.9%) |
| 65 to 74 Years | 2,226 (98.0%) | 46 (2.0%) |
| 75 Years and older | 2,148 (100.0%) | 0 (0.0%) |
| Total | 21,975 (82.9%) | 4,519 (17.1%) |
Health Insurance Coverage by Citizenship Status in Asheboro
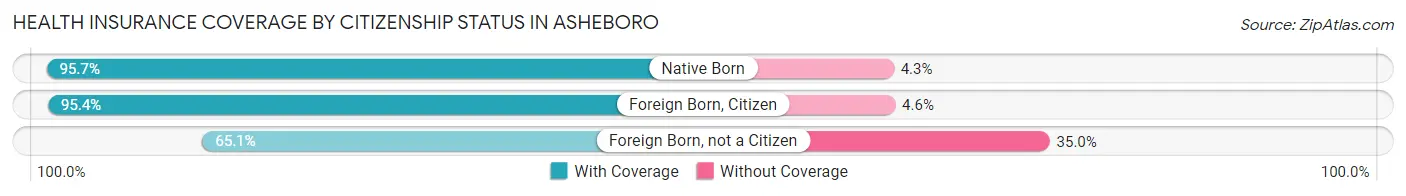
| Citizenship Status | With Coverage | Without Coverage |
| Native Born | 2,111 (95.7%) | 95 (4.3%) |
| Foreign Born, Citizen | 4,963 (95.4%) | 239 (4.6%) |
| Foreign Born, not a Citizen | 1,541 (65.0%) | 828 (34.9%) |
Health Insurance Coverage by Household Income in Asheboro
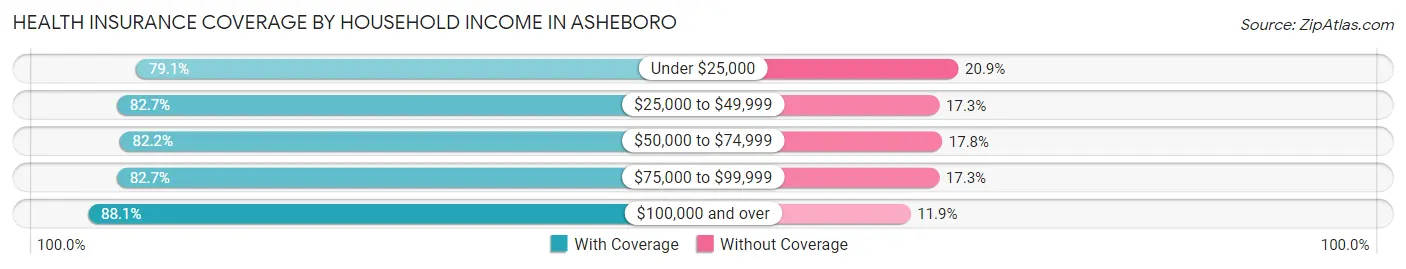
| Household Income | With Coverage | Without Coverage |
| Under $25,000 | 4,142 (79.1%) | 1,092 (20.9%) |
| $25,000 to $49,999 | 5,970 (82.7%) | 1,249 (17.3%) |
| $50,000 to $74,999 | 4,563 (82.2%) | 989 (17.8%) |
| $75,000 to $99,999 | 2,906 (82.7%) | 606 (17.3%) |
| $100,000 and over | 4,205 (88.1%) | 568 (11.9%) |
Public vs Private Health Insurance Coverage by Age in Asheboro
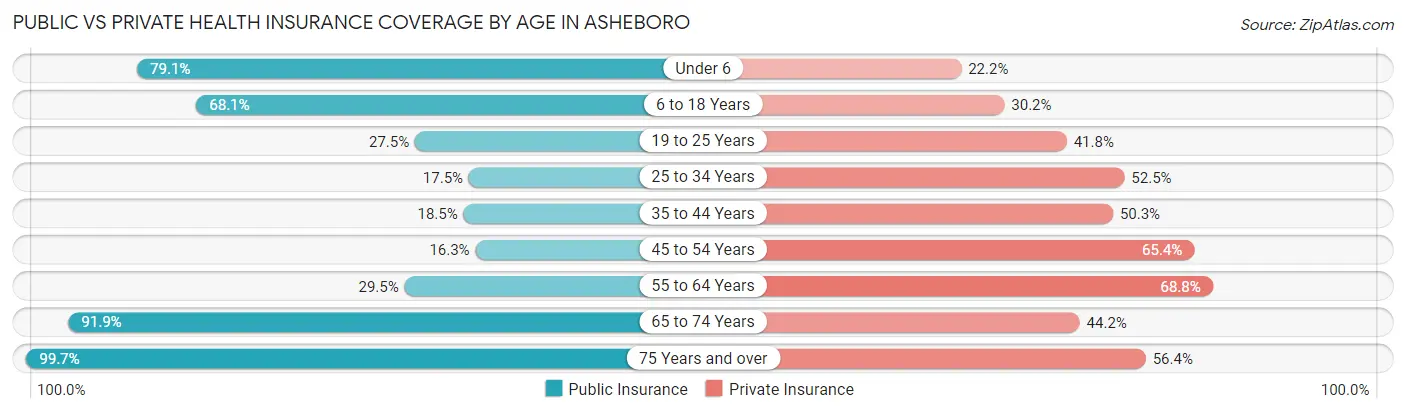
| Age Bracket | Public Insurance | Private Insurance |
| Under 6 | 1,745 (79.1%) | 489 (22.2%) |
| 6 to 18 Years | 3,543 (68.1%) | 1,570 (30.2%) |
| 19 to 25 Years | 652 (27.5%) | 989 (41.7%) |
| 25 to 34 Years | 560 (17.5%) | 1,676 (52.5%) |
| 35 to 44 Years | 731 (18.5%) | 1,986 (50.3%) |
| 45 to 54 Years | 418 (16.3%) | 1,675 (65.4%) |
| 55 to 64 Years | 765 (29.5%) | 1,786 (68.8%) |
| 65 to 74 Years | 2,087 (91.9%) | 1,003 (44.2%) |
| 75 Years and over | 2,141 (99.7%) | 1,212 (56.4%) |
| Total | 12,642 (47.7%) | 12,386 (46.8%) |
Disability Status by Sex by Age in Asheboro
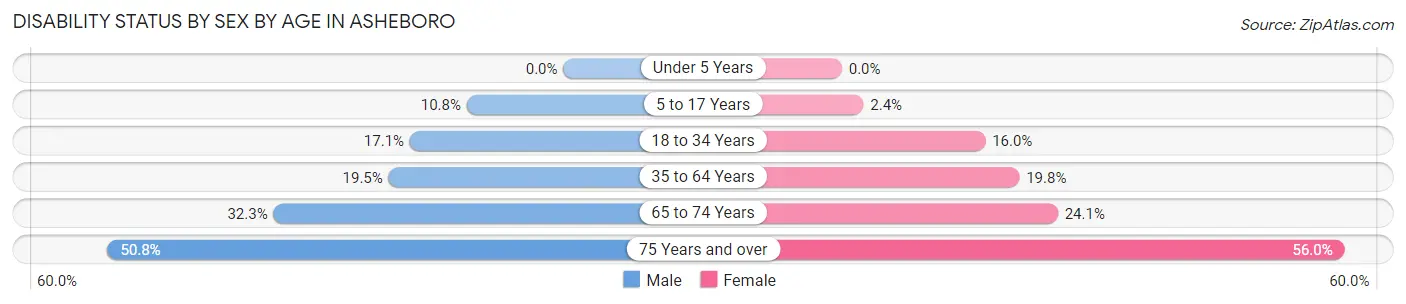
| Age Bracket | Male | Female |
| Under 5 Years | 0 (0.0%) | 0 (0.0%) |
| 5 to 17 Years | 311 (10.7%) | 55 (2.4%) |
| 18 to 34 Years | 506 (17.1%) | 479 (16.0%) |
| 35 to 64 Years | 937 (19.5%) | 847 (19.8%) |
| 65 to 74 Years | 359 (32.3%) | 279 (24.0%) |
| 75 Years and over | 463 (50.8%) | 692 (56.0%) |
Disability Class by Sex by Age in Asheboro
Disability Class: Hearing Difficulty
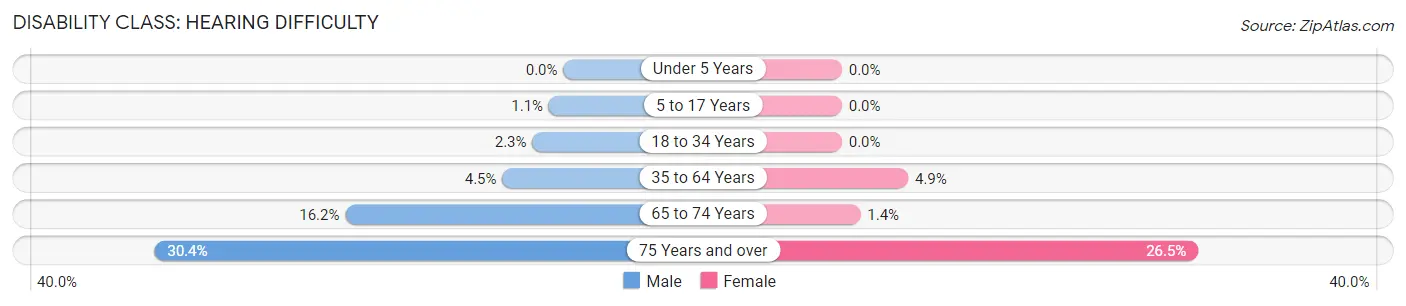
| Age Bracket | Male | Female |
| Under 5 Years | 0 (0.0%) | 0 (0.0%) |
| 5 to 17 Years | 31 (1.1%) | 0 (0.0%) |
| 18 to 34 Years | 68 (2.3%) | 0 (0.0%) |
| 35 to 64 Years | 218 (4.5%) | 211 (4.9%) |
| 65 to 74 Years | 180 (16.2%) | 16 (1.4%) |
| 75 Years and over | 277 (30.4%) | 327 (26.5%) |
Disability Class: Vision Difficulty
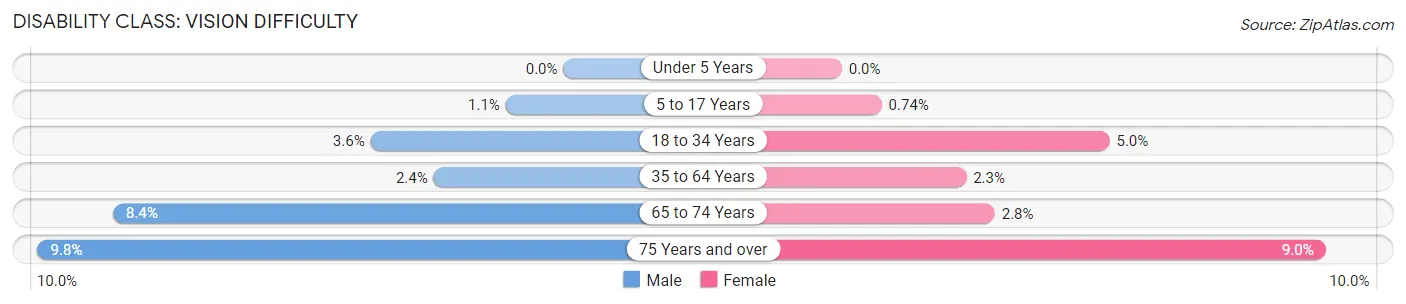
| Age Bracket | Male | Female |
| Under 5 Years | 0 (0.0%) | 0 (0.0%) |
| 5 to 17 Years | 31 (1.1%) | 17 (0.7%) |
| 18 to 34 Years | 106 (3.6%) | 149 (5.0%) |
| 35 to 64 Years | 116 (2.4%) | 99 (2.3%) |
| 65 to 74 Years | 93 (8.4%) | 33 (2.8%) |
| 75 Years and over | 89 (9.8%) | 111 (9.0%) |
Disability Class: Cognitive Difficulty
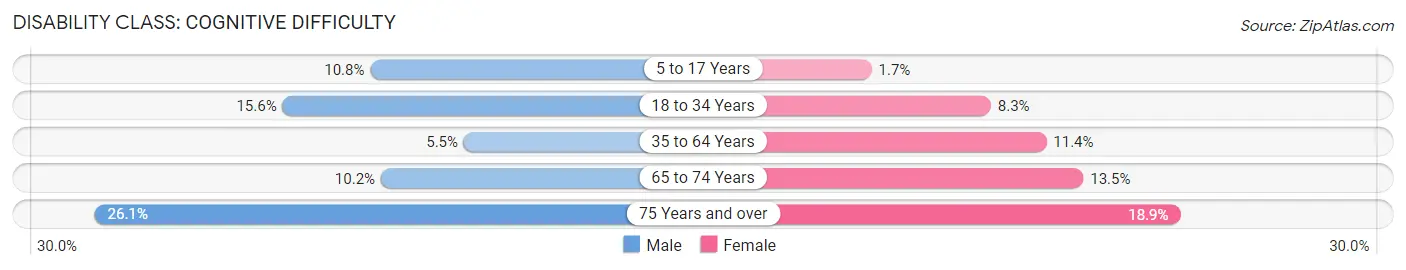
| Age Bracket | Male | Female |
| 5 to 17 Years | 311 (10.7%) | 38 (1.7%) |
| 18 to 34 Years | 463 (15.6%) | 249 (8.3%) |
| 35 to 64 Years | 267 (5.5%) | 488 (11.4%) |
| 65 to 74 Years | 113 (10.2%) | 156 (13.5%) |
| 75 Years and over | 238 (26.1%) | 233 (18.9%) |
Disability Class: Ambulatory Difficulty
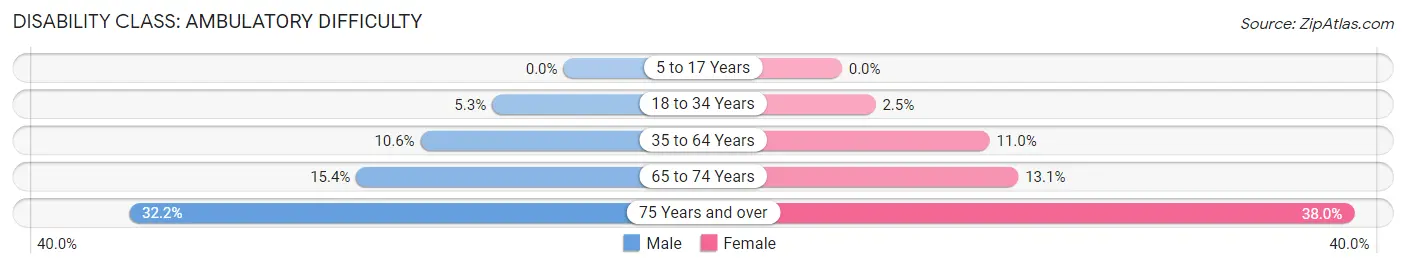
| Age Bracket | Male | Female |
| 5 to 17 Years | 0 (0.0%) | 0 (0.0%) |
| 18 to 34 Years | 157 (5.3%) | 75 (2.5%) |
| 35 to 64 Years | 511 (10.6%) | 470 (11.0%) |
| 65 to 74 Years | 171 (15.4%) | 152 (13.1%) |
| 75 Years and over | 294 (32.2%) | 470 (38.0%) |
Disability Class: Self-Care Difficulty
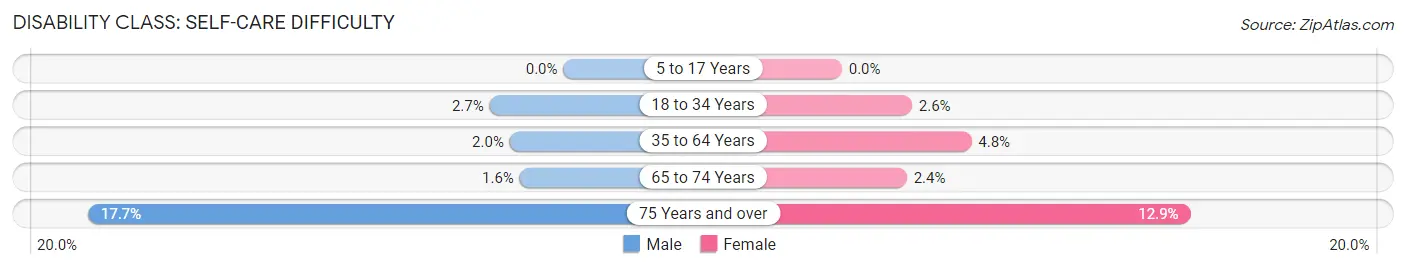
| Age Bracket | Male | Female |
| 5 to 17 Years | 0 (0.0%) | 0 (0.0%) |
| 18 to 34 Years | 81 (2.7%) | 78 (2.6%) |
| 35 to 64 Years | 96 (2.0%) | 206 (4.8%) |
| 65 to 74 Years | 18 (1.6%) | 28 (2.4%) |
| 75 Years and over | 161 (17.6%) | 160 (12.9%) |
Technology Access in Asheboro
Computing Device Access in Asheboro
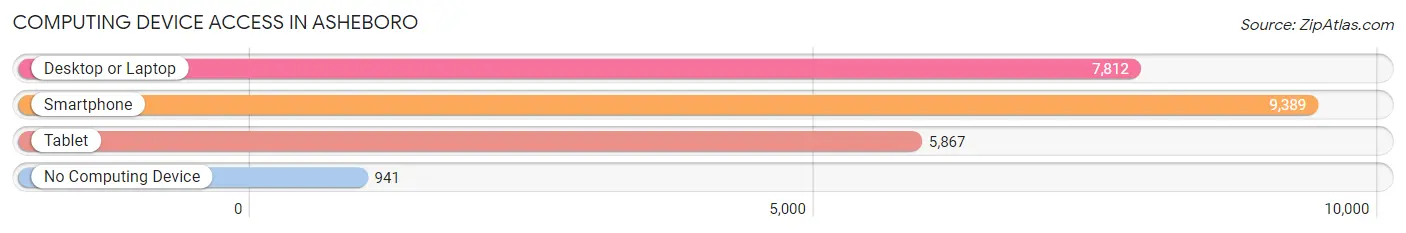
| Device Type | # Households | % Households |
| Desktop or Laptop | 7,812 | 70.5% |
| Smartphone | 9,389 | 84.7% |
| Tablet | 5,867 | 52.9% |
| No Computing Device | 941 | 8.5% |
| Total | 11,084 | 100.0% |
Internet Access in Asheboro
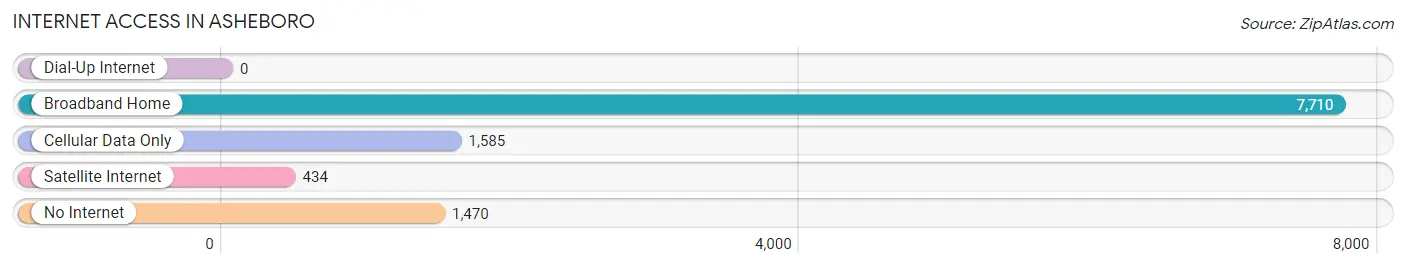
| Internet Type | # Households | % Households |
| Dial-Up Internet | 0 | 0.0% |
| Broadband Home | 7,710 | 69.6% |
| Cellular Data Only | 1,585 | 14.3% |
| Satellite Internet | 434 | 3.9% |
| No Internet | 1,470 | 13.3% |
| Total | 11,084 | 100.0% |
Asheboro Summary
Asheboro is a city located in Randolph County, North Carolina. It is the county seat of Randolph County and the home of the North Carolina Zoo. The city has a population of 25,012 as of the 2010 census.
Geography
Asheboro is located in the central part of Randolph County, in the Uwharrie Mountains region of North Carolina. It is situated at the intersection of U.S. Route 220 and U.S. Route 64. The city is located approximately 70 miles (110 km) southwest of Raleigh, the state capital, and approximately 50 miles (80 km) east of Greensboro.
The city is situated in the Piedmont region of North Carolina, which is characterized by rolling hills and flat plains. The city is located in the Uwharrie National Forest, which is home to a variety of wildlife, including deer, black bears, and wild turkeys.
Climate
Asheboro has a humid subtropical climate, with hot, humid summers and mild winters. The average annual temperature is 61°F (16°C). The average annual precipitation is 45.5 inches (115.6 cm).
Demographics
As of the 2010 census, Asheboro had a population of 25,012. The racial makeup of the city was 73.3% White, 19.2% African American, 0.4% Native American, 1.2% Asian, 0.1% Pacific Islander, 3.7% from other races, and 1.3% from two or more races. Hispanic or Latino of any race were 8.2% of the population.
Economy
Asheboro is home to a variety of industries, including manufacturing, healthcare, and retail. The city is home to several large employers, including Randolph Hospital, Asheboro Regional Airport, and the North Carolina Zoo.
The city is also home to a variety of small businesses, including restaurants, shops, and galleries. Asheboro is also home to a number of festivals and events, including the Asheboro Fall Festival, the Asheboro Christmas Parade, and the Asheboro Music Festival.
History
Asheboro was founded in 1796 by a group of settlers from Pennsylvania. The city was named after Samuel Ashe, the governor of North Carolina from 1795 to 1798.
In the early 19th century, Asheboro was a small farming community. In 1868, the city was incorporated and the first mayor was elected.
In the late 19th century, Asheboro began to grow and develop. The city was home to several industries, including a cotton mill, a furniture factory, and a tobacco warehouse.
In the early 20th century, Asheboro continued to grow and develop. The city was home to several educational institutions, including Randolph Community College and the North Carolina Zoo.
In the late 20th century, Asheboro continued to grow and develop. The city was home to several large employers, including Randolph Hospital, Asheboro Regional Airport, and the North Carolina Zoo.
Today, Asheboro is a vibrant city with a diverse economy and a variety of attractions. The city is home to a number of festivals and events, including the Asheboro Fall Festival, the Asheboro Christmas Parade, and the Asheboro Music Festival.
Common Questions
What is Per Capita Income in Asheboro?
Per Capita income in Asheboro is $24,408.
What is the Median Family Income in Asheboro?
Median Family Income in Asheboro is $53,327.
What is the Median Household income in Asheboro?
Median Household Income in Asheboro is $44,405.
What is Income or Wage Gap in Asheboro?
Income or Wage Gap in Asheboro is 18.7%.
Women in Asheboro earn 81.3 cents for every dollar earned by a man.
What is Family Income Deficit in Asheboro?
Family Income Deficit in Asheboro is $11,755.
Families that are below poverty line in Asheboro earn $11,755 less on average than the poverty threshold level.
What is Inequality or Gini Index in Asheboro?
Inequality or Gini Index in Asheboro is 0.43.
What is the Total Population of Asheboro?
Total Population of Asheboro is 27,117.
What is the Total Male Population of Asheboro?
Total Male Population of Asheboro is 13,816.
What is the Total Female Population of Asheboro?
Total Female Population of Asheboro is 13,301.
What is the Ratio of Males per 100 Females in Asheboro?
There are 103.87 Males per 100 Females in Asheboro.
What is the Ratio of Females per 100 Males in Asheboro?
There are 96.27 Females per 100 Males in Asheboro.
What is the Median Population Age in Asheboro?
Median Population Age in Asheboro is 36.0 Years.
What is the Average Family Size in Asheboro
Average Family Size in Asheboro is 3.2 People.
What is the Average Household Size in Asheboro
Average Household Size in Asheboro is 2.4 People.
How Large is the Labor Force in Asheboro?
There are 12,116 People in the Labor Forcein in Asheboro.
What is the Percentage of People in the Labor Force in Asheboro?
57.8% of People are in the Labor Force in Asheboro.
What is the Unemployment Rate in Asheboro?
Unemployment Rate in Asheboro is 5.5%.