Northlakes, NC Map & Demographics
Northlakes Map
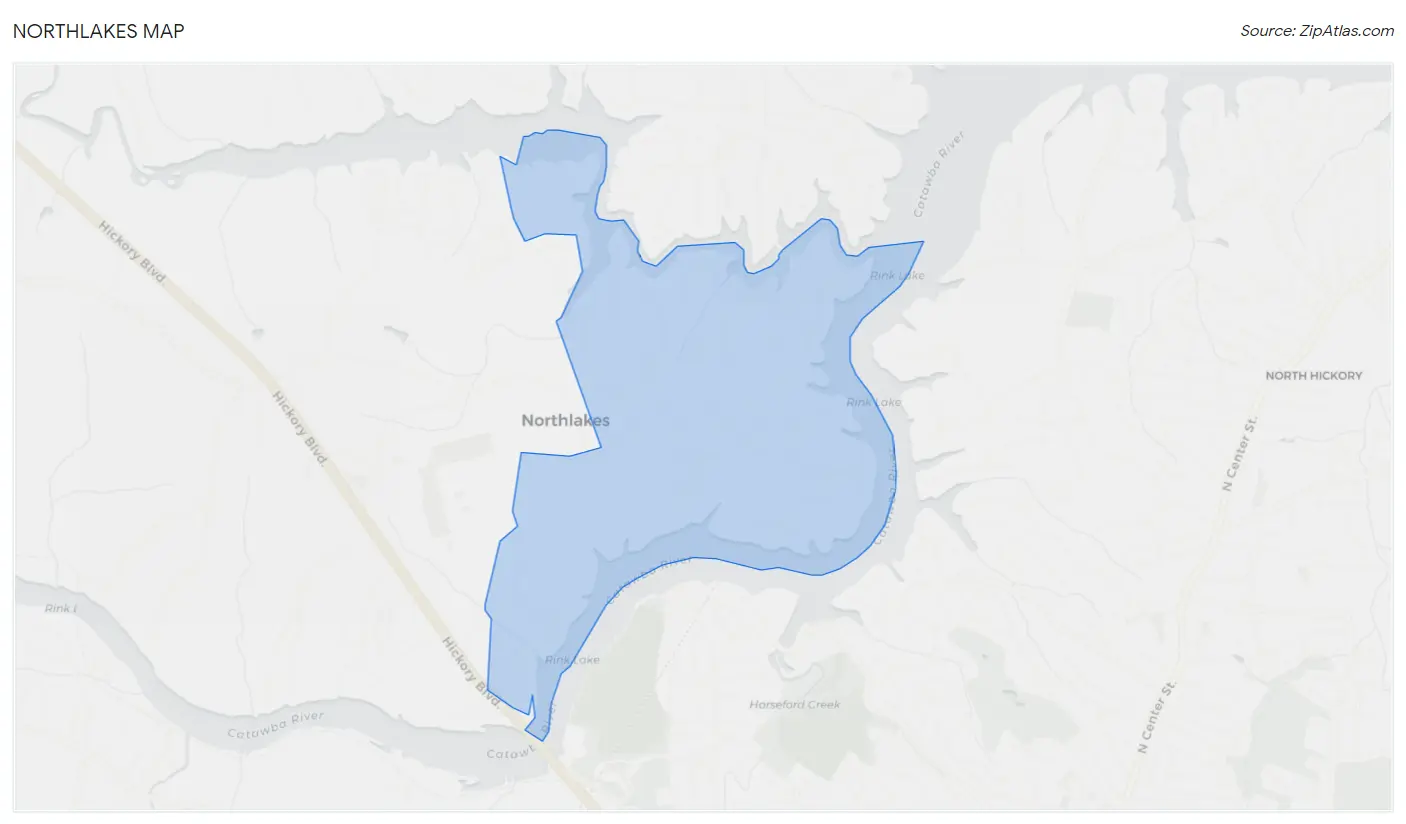
Northlakes Overview
$50,218
PER CAPITA INCOME
$108,505
AVG FAMILY INCOME
$100,577
AVG HOUSEHOLD INCOME
29.0%
WAGE / INCOME GAP [ % ]
71.0¢/ $1
WAGE / INCOME GAP [ $ ]
0.31
INEQUALITY / GINI INDEX
1,378
TOTAL POPULATION
758
MALE POPULATION
620
FEMALE POPULATION
122.26
MALES / 100 FEMALES
81.79
FEMALES / 100 MALES
46.8
MEDIAN AGE
3.0
AVG FAMILY SIZE
2.5
AVG HOUSEHOLD SIZE
767
LABOR FORCE [ PEOPLE ]
69.6%
PERCENT IN LABOR FORCE
3.1%
UNEMPLOYMENT RATE
Income in Northlakes
Income Overview in Northlakes
Per Capita Income in Northlakes is $50,218, while median incomes of families and households are $108,505 and $100,577 respectively.
| Characteristic | Number | Measure |
| Per Capita Income | 1,378 | $50,218 |
| Median Family Income | 427 | $108,505 |
| Mean Family Income | 427 | $123,815 |
| Median Household Income | 542 | $100,577 |
| Mean Household Income | 542 | $127,372 |
| Income Deficit | 427 | $0 |
| Wage / Income Gap (%) | 1,378 | 28.96% |
| Wage / Income Gap ($) | 1,378 | 71.04¢ per $1 |
| Gini / Inequality Index | 1,378 | 0.31 |
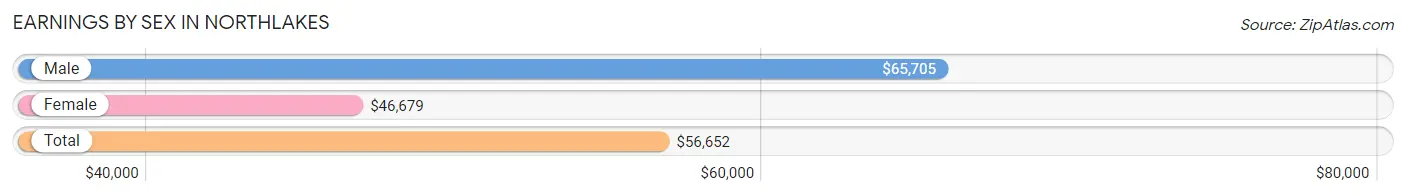
Earnings by Sex in Northlakes
Average Earnings in Northlakes are $56,652, $65,705 for men and $46,679 for women, a difference of 29.0%.
| Sex | Number | Average Earnings |
| Male | 452 (55.7%) | $65,705 |
| Female | 359 (44.3%) | $46,679 |
| Total | 811 (100.0%) | $56,652 |
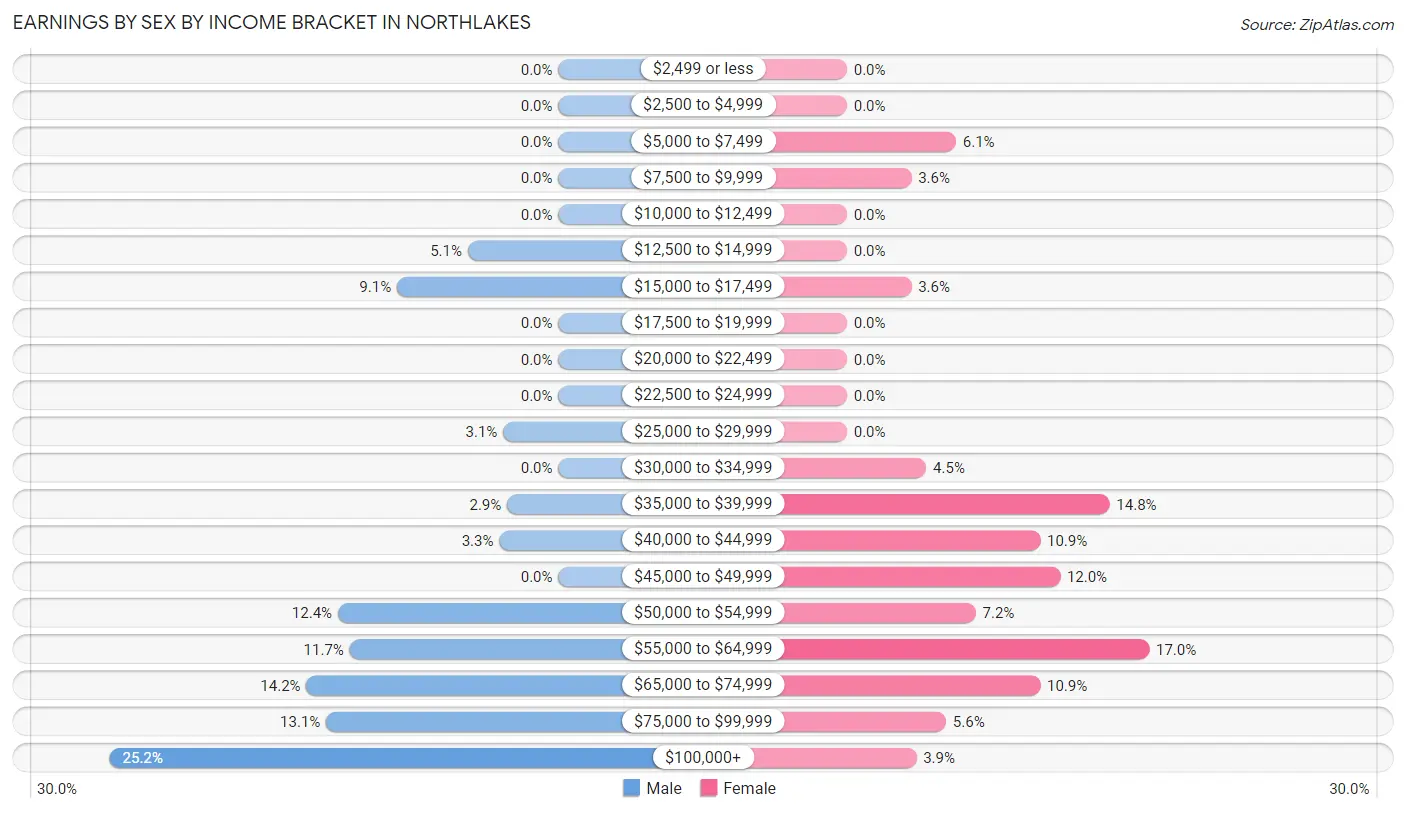
Earnings by Sex by Income Bracket in Northlakes
The most common earnings brackets in Northlakes are $100,000+ for men (114 | 25.2%) and $55,000 to $64,999 for women (61 | 17.0%).
| Income | Male | Female |
| $2,499 or less | 0 (0.0%) | 0 (0.0%) |
| $2,500 to $4,999 | 0 (0.0%) | 0 (0.0%) |
| $5,000 to $7,499 | 0 (0.0%) | 22 (6.1%) |
| $7,500 to $9,999 | 0 (0.0%) | 13 (3.6%) |
| $10,000 to $12,499 | 0 (0.0%) | 0 (0.0%) |
| $12,500 to $14,999 | 23 (5.1%) | 0 (0.0%) |
| $15,000 to $17,499 | 41 (9.1%) | 13 (3.6%) |
| $17,500 to $19,999 | 0 (0.0%) | 0 (0.0%) |
| $20,000 to $22,499 | 0 (0.0%) | 0 (0.0%) |
| $22,500 to $24,999 | 0 (0.0%) | 0 (0.0%) |
| $25,000 to $29,999 | 14 (3.1%) | 0 (0.0%) |
| $30,000 to $34,999 | 0 (0.0%) | 16 (4.5%) |
| $35,000 to $39,999 | 13 (2.9%) | 53 (14.8%) |
| $40,000 to $44,999 | 15 (3.3%) | 39 (10.9%) |
| $45,000 to $49,999 | 0 (0.0%) | 43 (12.0%) |
| $50,000 to $54,999 | 56 (12.4%) | 26 (7.2%) |
| $55,000 to $64,999 | 53 (11.7%) | 61 (17.0%) |
| $65,000 to $74,999 | 64 (14.2%) | 39 (10.9%) |
| $75,000 to $99,999 | 59 (13.1%) | 20 (5.6%) |
| $100,000+ | 114 (25.2%) | 14 (3.9%) |
| Total | 452 (100.0%) | 359 (100.0%) |
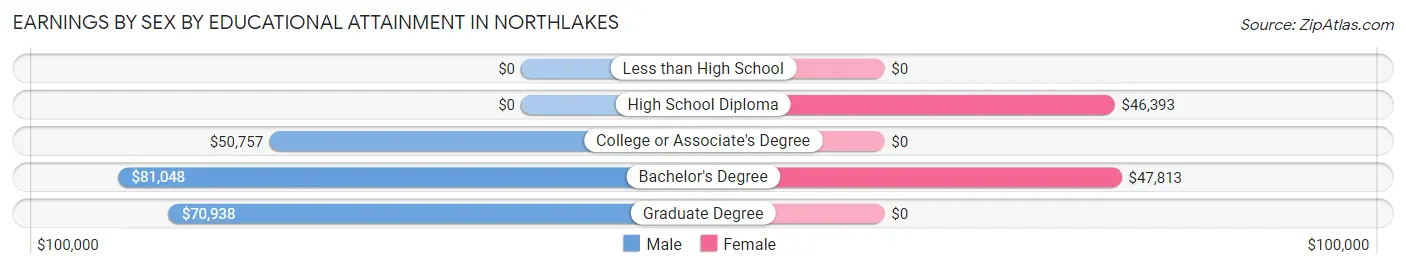
Earnings by Sex by Educational Attainment in Northlakes
Average earnings in Northlakes are $66,442 for men and $46,679 for women, a difference of 29.7%. Men with an educational attainment of bachelor's degree enjoy the highest average annual earnings of $81,048, while those with college or associate's degree education earn the least with $50,757. Women with an educational attainment of bachelor's degree earn the most with the average annual earnings of $47,813, while those with high school diploma education have the smallest earnings of $46,393.
| Educational Attainment | Male Income | Female Income |
| Less than High School | - | - |
| High School Diploma | - | - |
| College or Associate's Degree | $50,757 | $0 |
| Bachelor's Degree | $81,048 | $47,813 |
| Graduate Degree | $70,938 | $0 |
| Total | $66,442 | $46,679 |
Family Income in Northlakes
Family Income Brackets in Northlakes
According to the Northlakes family income data, there are 128 families falling into the $75,000 to $99,999 income range, which is the most common income bracket and makes up 30.0% of all families.
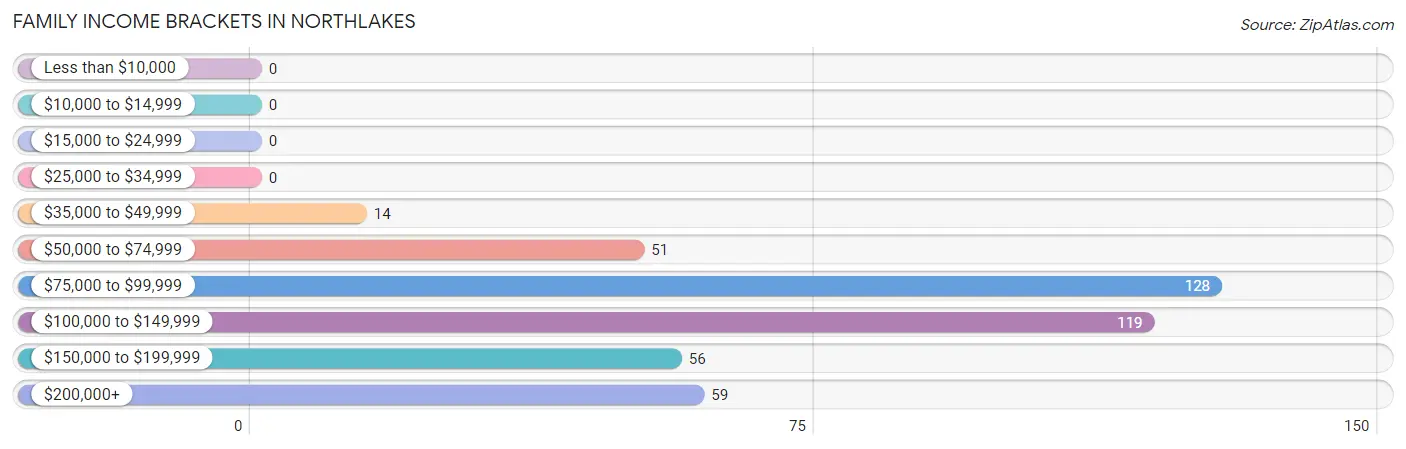
| Income Bracket | # Families | % Families |
| Less than $10,000 | 0 | 0.0% |
| $10,000 to $14,999 | 0 | 0.0% |
| $15,000 to $24,999 | 0 | 0.0% |
| $25,000 to $34,999 | 0 | 0.0% |
| $35,000 to $49,999 | 14 | 3.3% |
| $50,000 to $74,999 | 51 | 11.9% |
| $75,000 to $99,999 | 128 | 30.0% |
| $100,000 to $149,999 | 119 | 27.9% |
| $150,000 to $199,999 | 56 | 13.1% |
| $200,000+ | 59 | 13.8% |
Family Income by Famaliy Size in Northlakes
3-person families (56 | 13.1%) account for the highest median family income in Northlakes with $203,654 per family, while 3-person families (56 | 13.1%) have the highest median income of $67,885 per family member.
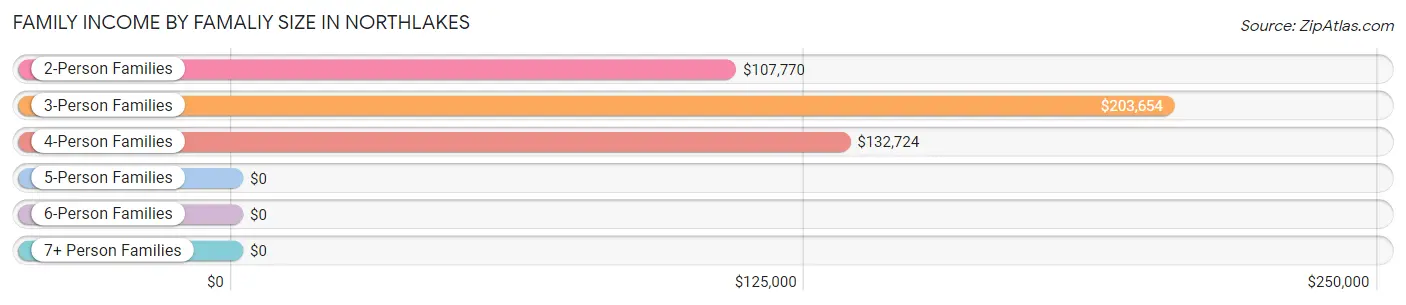
| Income Bracket | # Families | Median Income |
| 2-Person Families | 217 (50.8%) | $107,770 |
| 3-Person Families | 56 (13.1%) | $203,654 |
| 4-Person Families | 153 (35.8%) | $132,724 |
| 5-Person Families | 0 (0.0%) | $0 |
| 6-Person Families | 1 (0.2%) | $0 |
| 7+ Person Families | 0 (0.0%) | $0 |
| Total | 427 (100.0%) | $108,505 |
Family Income by Number of Earners in Northlakes
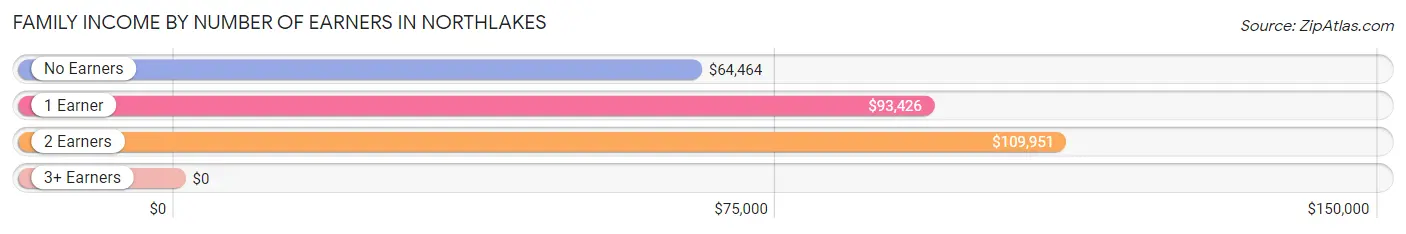
| Number of Earners | # Families | Median Income |
| No Earners | 64 (15.0%) | $64,464 |
| 1 Earner | 62 (14.5%) | $93,426 |
| 2 Earners | 262 (61.4%) | $109,951 |
| 3+ Earners | 39 (9.1%) | $0 |
| Total | 427 (100.0%) | $108,505 |
Household Income in Northlakes
Household Income Brackets in Northlakes
With 167 households falling in the category, the $75,000 to $99,999 income range is the most frequent in Northlakes, accounting for 30.8% of all households.
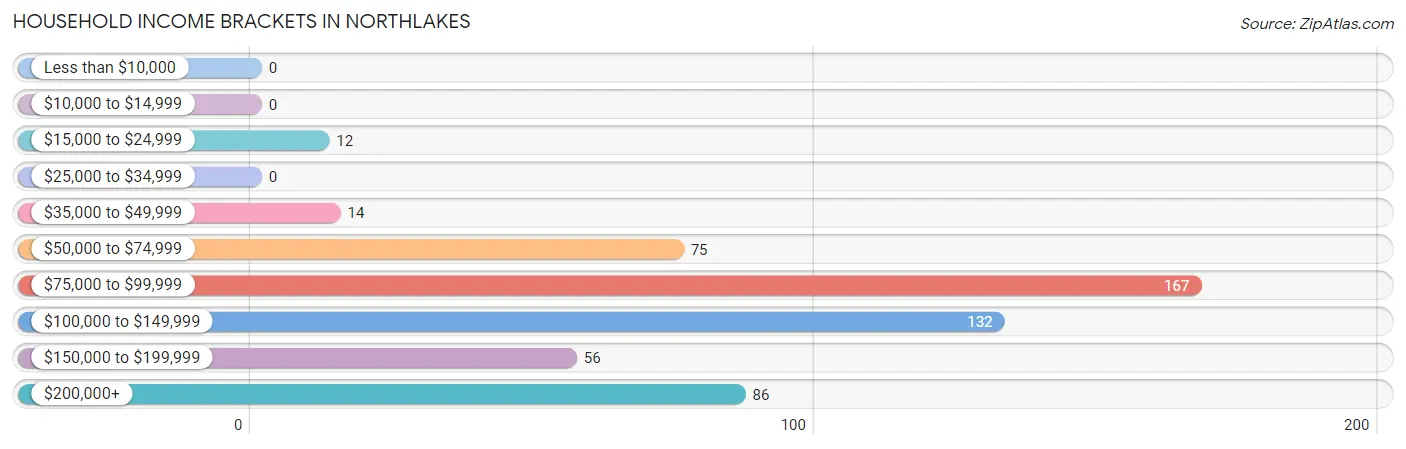
| Income Bracket | # Households | % Households |
| Less than $10,000 | 0 | 0.0% |
| $10,000 to $14,999 | 0 | 0.0% |
| $15,000 to $24,999 | 12 | 2.2% |
| $25,000 to $34,999 | 0 | 0.0% |
| $35,000 to $49,999 | 14 | 2.6% |
| $50,000 to $74,999 | 75 | 13.8% |
| $75,000 to $99,999 | 167 | 30.8% |
| $100,000 to $149,999 | 132 | 24.4% |
| $150,000 to $199,999 | 56 | 10.3% |
| $200,000+ | 86 | 15.9% |
Household Income by Householder Age in Northlakes
The median household income in Northlakes is $100,577, with the highest median household income of $119,338 found in the 25 to 44 years age bracket for the primary householder. A total of 85 households (15.7%) fall into this category.
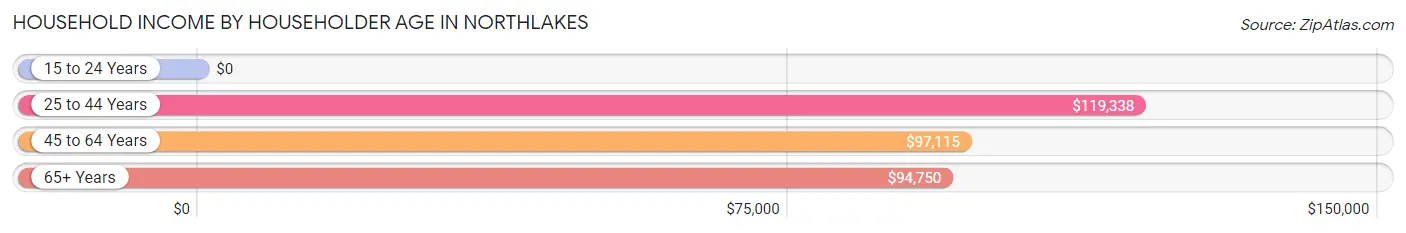
| Income Bracket | # Households | Median Income |
| 15 to 24 Years | 0 (0.0%) | $0 |
| 25 to 44 Years | 85 (15.7%) | $119,338 |
| 45 to 64 Years | 262 (48.3%) | $97,115 |
| 65+ Years | 195 (36.0%) | $94,750 |
| Total | 542 (100.0%) | $100,577 |
Poverty in Northlakes
Income Below Poverty by Sex and Age in Northlakes
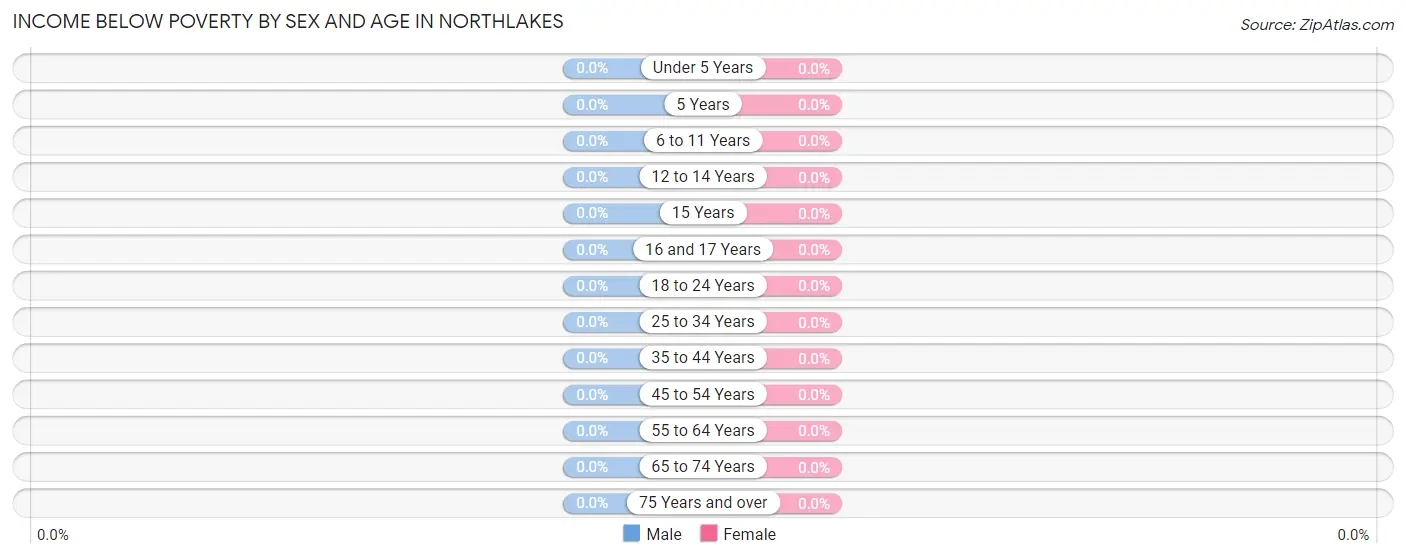
| Age Bracket | Male | Female |
| Under 5 Years | 0 (0.0%) | 0 (0.0%) |
| 5 Years | 0 (0.0%) | 0 (0.0%) |
| 6 to 11 Years | 0 (0.0%) | 0 (0.0%) |
| 12 to 14 Years | 0 (0.0%) | 0 (0.0%) |
| 15 Years | 0 (0.0%) | 0 (0.0%) |
| 16 and 17 Years | 0 (0.0%) | 0 (0.0%) |
| 18 to 24 Years | 0 (0.0%) | 0 (0.0%) |
| 25 to 34 Years | 0 (0.0%) | 0 (0.0%) |
| 35 to 44 Years | 0 (0.0%) | 0 (0.0%) |
| 45 to 54 Years | 0 (0.0%) | 0 (0.0%) |
| 55 to 64 Years | 0 (0.0%) | 0 (0.0%) |
| 65 to 74 Years | 0 (0.0%) | 0 (0.0%) |
| 75 Years and over | 0 (0.0%) | 0 (0.0%) |
| Total | 0 (0.0%) | 0 (0.0%) |
Income Above Poverty by Sex and Age in Northlakes
According to the poverty statistics in Northlakes, males aged under 5 years and females aged under 5 years are the age groups that are most secure financially, with 100.0% of males and 100.0% of females in these age groups living above the poverty line.
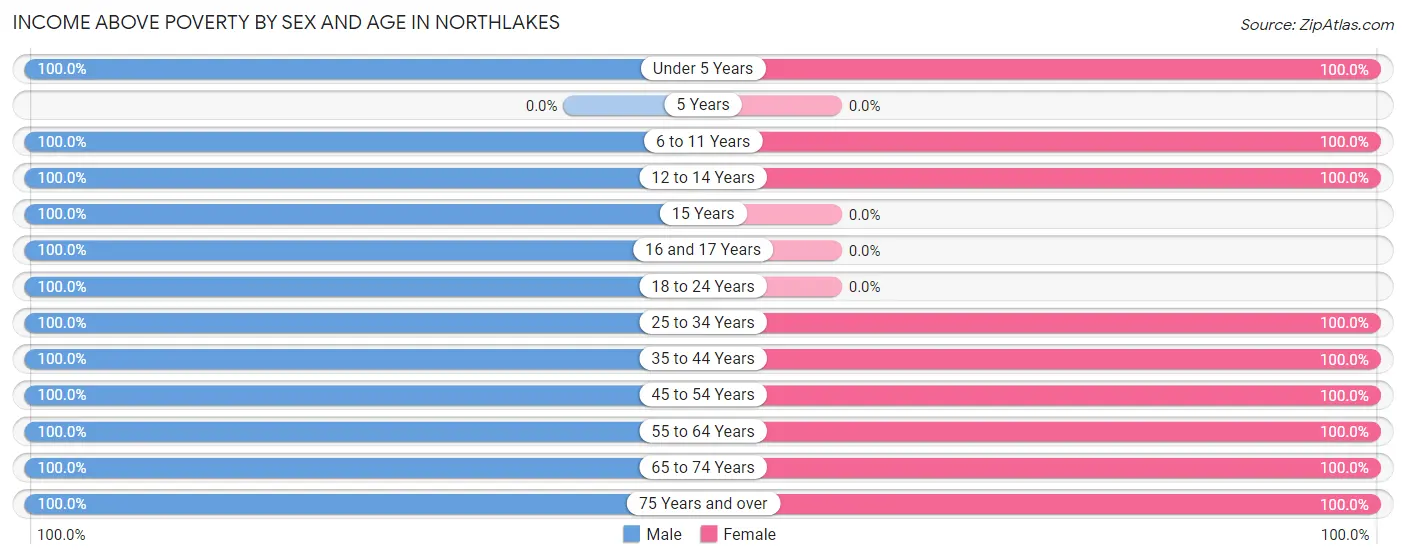
| Age Bracket | Male | Female |
| Under 5 Years | 20 (100.0%) | 29 (100.0%) |
| 5 Years | 0 (0.0%) | 0 (0.0%) |
| 6 to 11 Years | 48 (100.0%) | 35 (100.0%) |
| 12 to 14 Years | 41 (100.0%) | 50 (100.0%) |
| 15 Years | 53 (100.0%) | 0 (0.0%) |
| 16 and 17 Years | 48 (100.0%) | 0 (0.0%) |
| 18 to 24 Years | 36 (100.0%) | 0 (0.0%) |
| 25 to 34 Years | 92 (100.0%) | 74 (100.0%) |
| 35 to 44 Years | 18 (100.0%) | 87 (100.0%) |
| 45 to 54 Years | 107 (100.0%) | 88 (100.0%) |
| 55 to 64 Years | 101 (100.0%) | 130 (100.0%) |
| 65 to 74 Years | 185 (100.0%) | 65 (100.0%) |
| 75 Years and over | 9 (100.0%) | 62 (100.0%) |
| Total | 758 (100.0%) | 620 (100.0%) |
Income Below Poverty Among Married-Couple Families in Northlakes
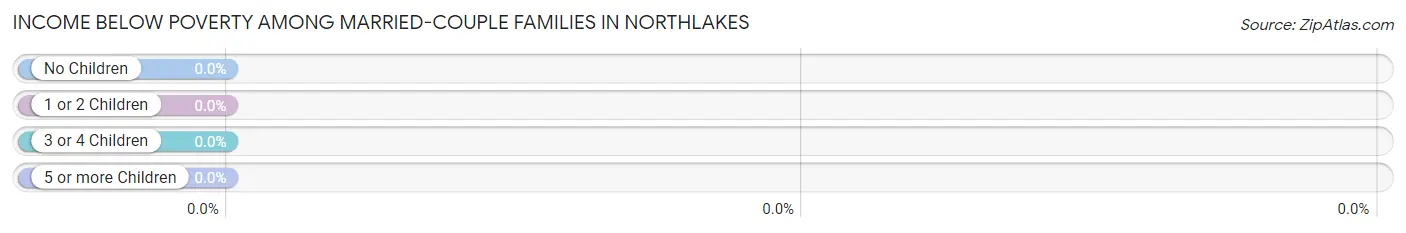
| Children | Above Poverty | Below Poverty |
| No Children | 221 (100.0%) | 0 (0.0%) |
| 1 or 2 Children | 179 (100.0%) | 0 (0.0%) |
| 3 or 4 Children | 1 (100.0%) | 0 (0.0%) |
| 5 or more Children | 0 (0.0%) | 0 (0.0%) |
| Total | 401 (100.0%) | 0 (0.0%) |
Income Below Poverty Among Single-Parent Households in Northlakes
| Children | Single Father | Single Mother |
| No Children | 0 (0.0%) | 0 (0.0%) |
| 1 or 2 Children | 0 (0.0%) | 0 (0.0%) |
| 3 or 4 Children | 0 (0.0%) | 0 (0.0%) |
| 5 or more Children | 0 (0.0%) | 0 (0.0%) |
| Total | 0 (0.0%) | 0 (0.0%) |
Income Below Poverty Among Married-Couple vs Single-Parent Households in Northlakes
| Children | Married-Couple Families | Single-Parent Households |
| No Children | 0 (0.0%) | 0 (0.0%) |
| 1 or 2 Children | 0 (0.0%) | 0 (0.0%) |
| 3 or 4 Children | 0 (0.0%) | 0 (0.0%) |
| 5 or more Children | 0 (0.0%) | 0 (0.0%) |
| Total | 0 (0.0%) | 0 (0.0%) |
Race in Northlakes
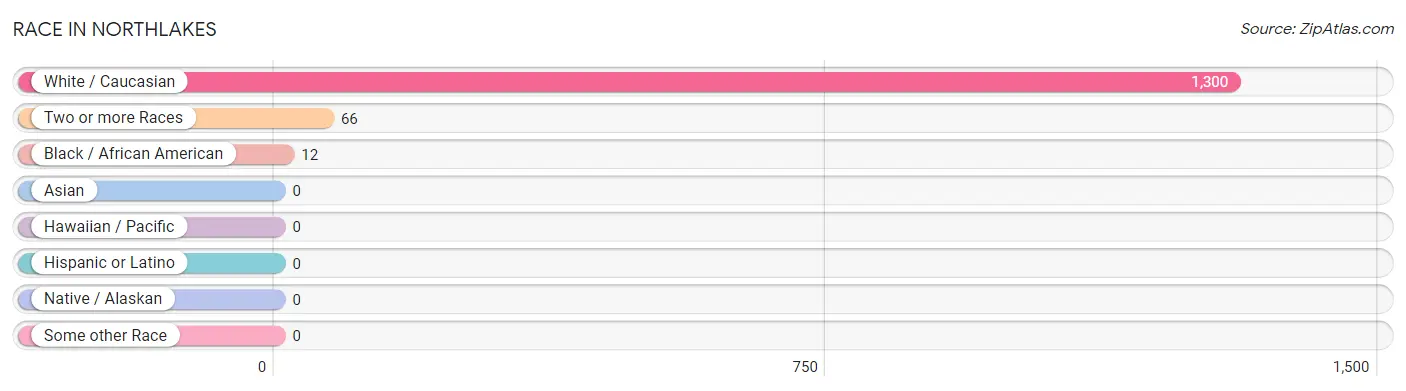
The most populous races in Northlakes are White / Caucasian (1,300 | 94.3%), Two or more Races (66 | 4.8%), and Black / African American (12 | 0.9%).
| Race | # Population | % Population |
| Asian | 0 | 0.0% |
| Black / African American | 12 | 0.9% |
| Hawaiian / Pacific | 0 | 0.0% |
| Hispanic or Latino | 0 | 0.0% |
| Native / Alaskan | 0 | 0.0% |
| White / Caucasian | 1,300 | 94.3% |
| Two or more Races | 66 | 4.8% |
| Some other Race | 0 | 0.0% |
| Total | 1,378 | 100.0% |
Ancestry in Northlakes
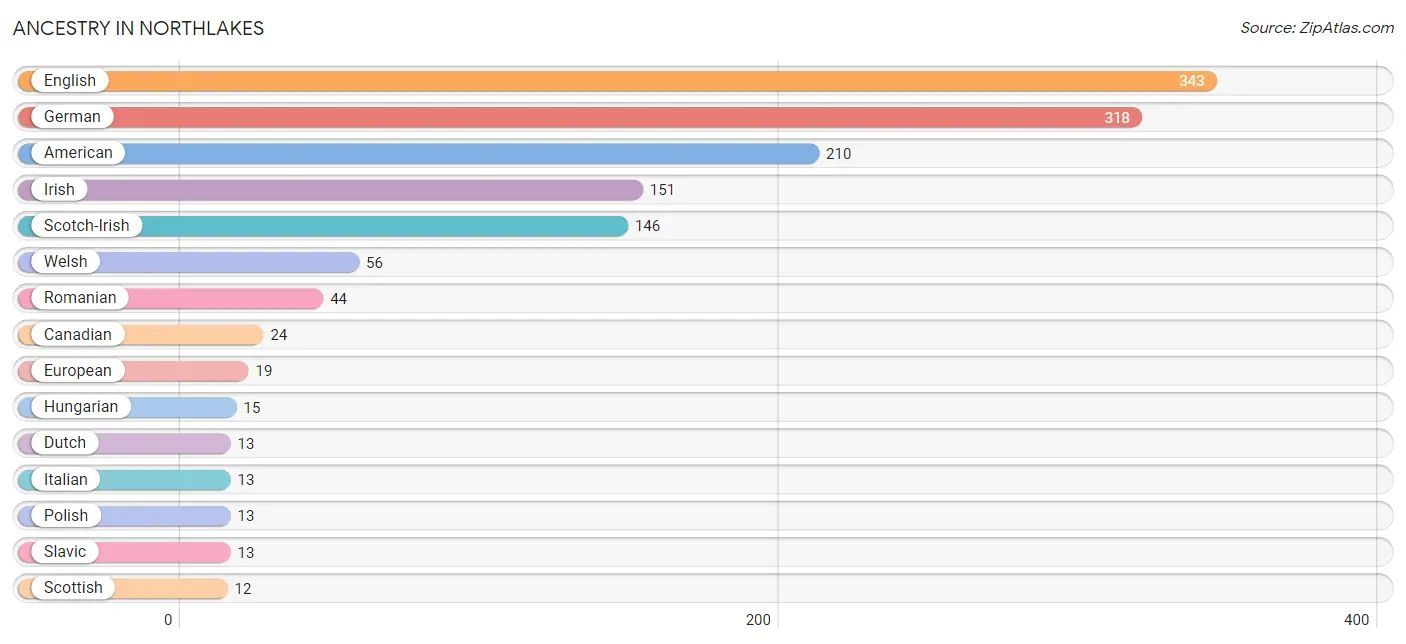
The most populous ancestries reported in Northlakes are English (343 | 24.9%), German (318 | 23.1%), American (210 | 15.2%), Irish (151 | 11.0%), and Scotch-Irish (146 | 10.6%), together accounting for 84.8% of all Northlakes residents.
| Ancestry | # Population | % Population |
| American | 210 | 15.2% |
| Canadian | 24 | 1.7% |
| Dutch | 13 | 0.9% |
| English | 343 | 24.9% |
| European | 19 | 1.4% |
| German | 318 | 23.1% |
| Hungarian | 15 | 1.1% |
| Irish | 151 | 11.0% |
| Italian | 13 | 0.9% |
| Polish | 13 | 0.9% |
| Romanian | 44 | 3.2% |
| Scotch-Irish | 146 | 10.6% |
| Scottish | 12 | 0.9% |
| Slavic | 13 | 0.9% |
| Welsh | 56 | 4.1% | View All 15 Rows |
Immigrants in Northlakes
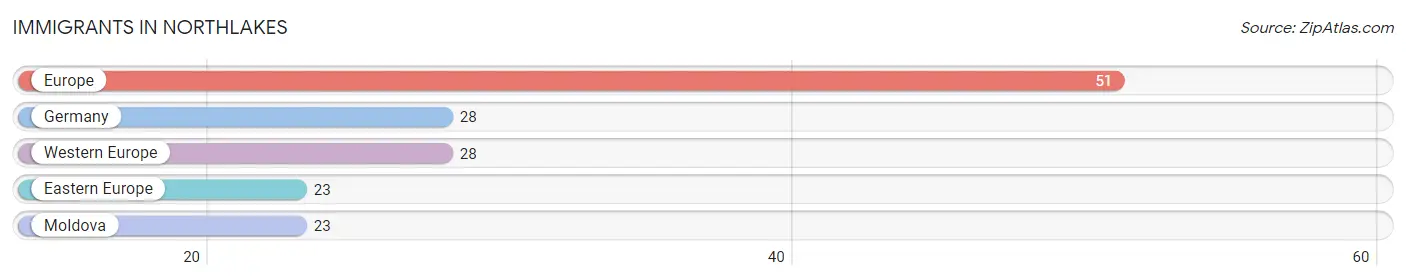
The most numerous immigrant groups reported in Northlakes came from Europe (51 | 3.7%), Germany (28 | 2.0%), Western Europe (28 | 2.0%), Eastern Europe (23 | 1.7%), and Moldova (23 | 1.7%), together accounting for 11.1% of all Northlakes residents.
| Immigration Origin | # Population | % Population |
| Eastern Europe | 23 | 1.7% |
| Europe | 51 | 3.7% |
| Germany | 28 | 2.0% |
| Moldova | 23 | 1.7% |
| Western Europe | 28 | 2.0% | View All 5 Rows |
Sex and Age in Northlakes
Sex and Age in Northlakes
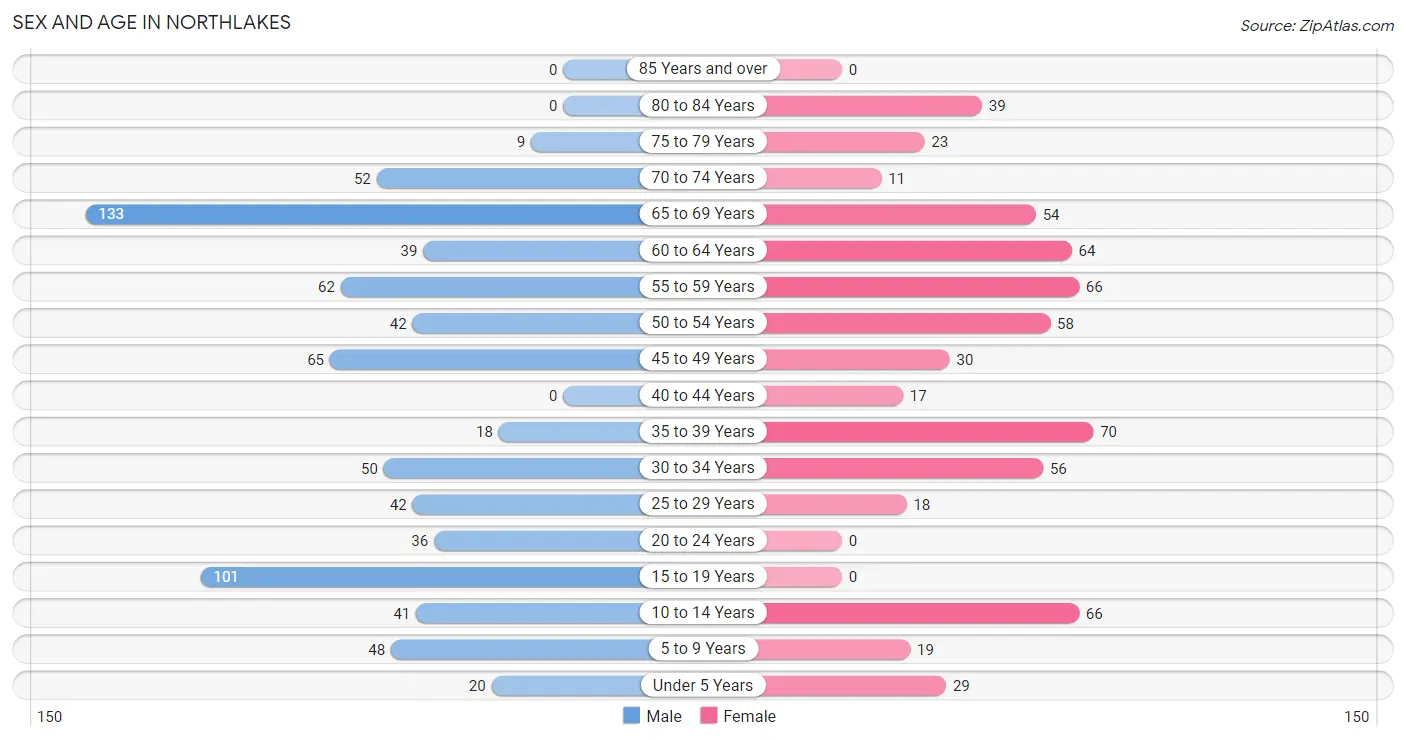
The most populous age groups in Northlakes are 65 to 69 Years (133 | 17.5%) for men and 35 to 39 Years (70 | 11.3%) for women.
| Age Bracket | Male | Female |
| Under 5 Years | 20 (2.6%) | 29 (4.7%) |
| 5 to 9 Years | 48 (6.3%) | 19 (3.1%) |
| 10 to 14 Years | 41 (5.4%) | 66 (10.6%) |
| 15 to 19 Years | 101 (13.3%) | 0 (0.0%) |
| 20 to 24 Years | 36 (4.8%) | 0 (0.0%) |
| 25 to 29 Years | 42 (5.5%) | 18 (2.9%) |
| 30 to 34 Years | 50 (6.6%) | 56 (9.0%) |
| 35 to 39 Years | 18 (2.4%) | 70 (11.3%) |
| 40 to 44 Years | 0 (0.0%) | 17 (2.7%) |
| 45 to 49 Years | 65 (8.6%) | 30 (4.8%) |
| 50 to 54 Years | 42 (5.5%) | 58 (9.3%) |
| 55 to 59 Years | 62 (8.2%) | 66 (10.6%) |
| 60 to 64 Years | 39 (5.1%) | 64 (10.3%) |
| 65 to 69 Years | 133 (17.5%) | 54 (8.7%) |
| 70 to 74 Years | 52 (6.9%) | 11 (1.8%) |
| 75 to 79 Years | 9 (1.2%) | 23 (3.7%) |
| 80 to 84 Years | 0 (0.0%) | 39 (6.3%) |
| 85 Years and over | 0 (0.0%) | 0 (0.0%) |
| Total | 758 (100.0%) | 620 (100.0%) |
Families and Households in Northlakes
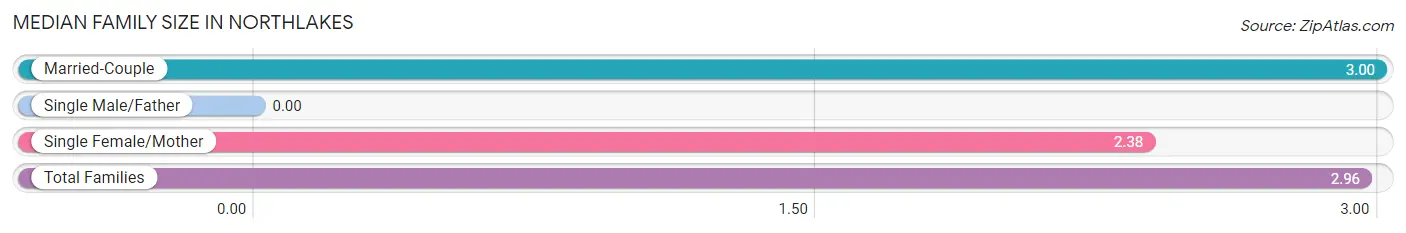
Median Family Size in Northlakes
| Family Type | # Families | Family Size |
| Married-Couple | 401 (93.9%) | 3.00 |
| Single Male/Father | 0 (0.0%) | - |
| Single Female/Mother | 26 (6.1%) | 2.38 |
| Total Families | 427 (100.0%) | 2.96 |
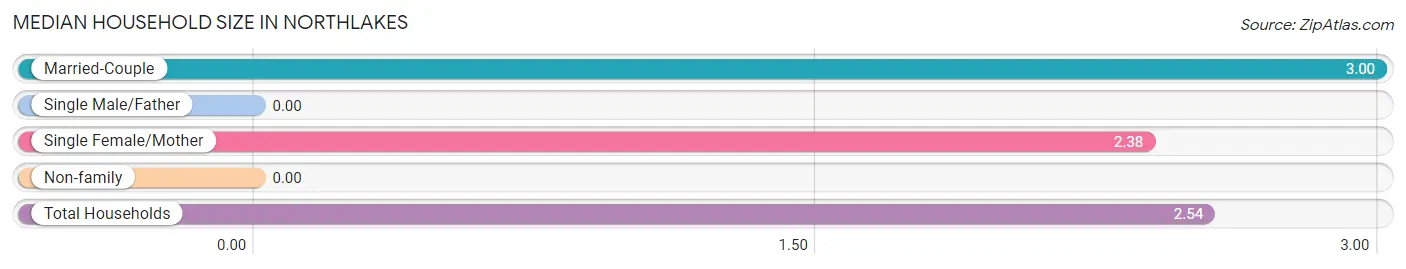
Median Household Size in Northlakes
| Household Type | # Households | Household Size |
| Married-Couple | 401 (74.0%) | 3.00 |
| Single Male/Father | 0 (0.0%) | - |
| Single Female/Mother | 26 (4.8%) | 2.38 |
| Non-family | 115 (21.2%) | - |
| Total Households | 542 (100.0%) | 2.54 |
Household Size by Marriage Status in Northlakes
Out of a total of 542 households in Northlakes, 427 (78.8%) are family households, while 115 (21.2%) are nonfamily households. The most numerous type of family households are 2-person households, comprising 217, and the most common type of nonfamily households are 1-person households, comprising 115.
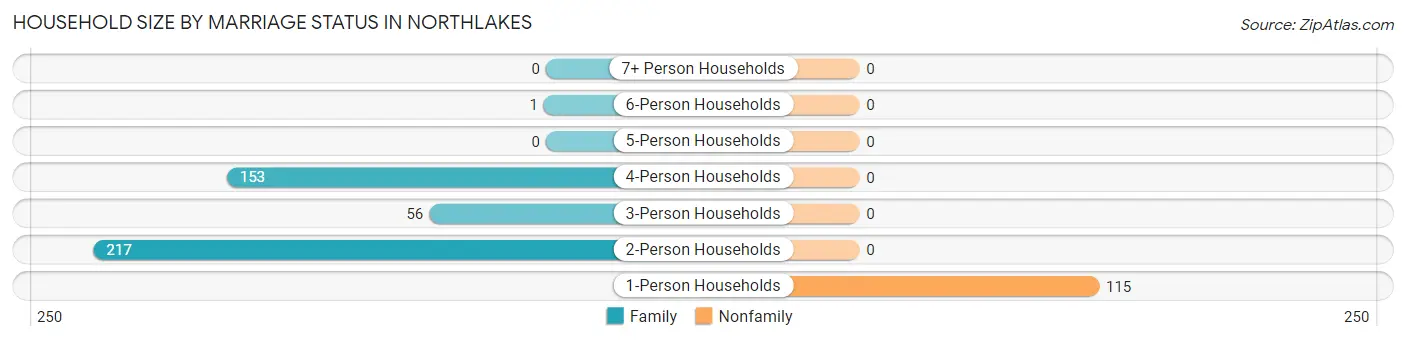
| Household Size | Family Households | Nonfamily Households |
| 1-Person Households | - | 115 (21.2%) |
| 2-Person Households | 217 (40.0%) | 0 (0.0%) |
| 3-Person Households | 56 (10.3%) | 0 (0.0%) |
| 4-Person Households | 153 (28.2%) | 0 (0.0%) |
| 5-Person Households | 0 (0.0%) | 0 (0.0%) |
| 6-Person Households | 1 (0.2%) | 0 (0.0%) |
| 7+ Person Households | 0 (0.0%) | 0 (0.0%) |
| Total | 427 (78.8%) | 115 (21.2%) |
Female Fertility in Northlakes
Fertility by Age in Northlakes
Average fertility rate in Northlakes is 228.0 births per 1,000 women. Women in the age bracket of 20 to 34 years have the highest fertility rate with 392.0 births per 1,000 women. Women in the age bracket of 20 to 34 years acount for 63.0% of all women with births.
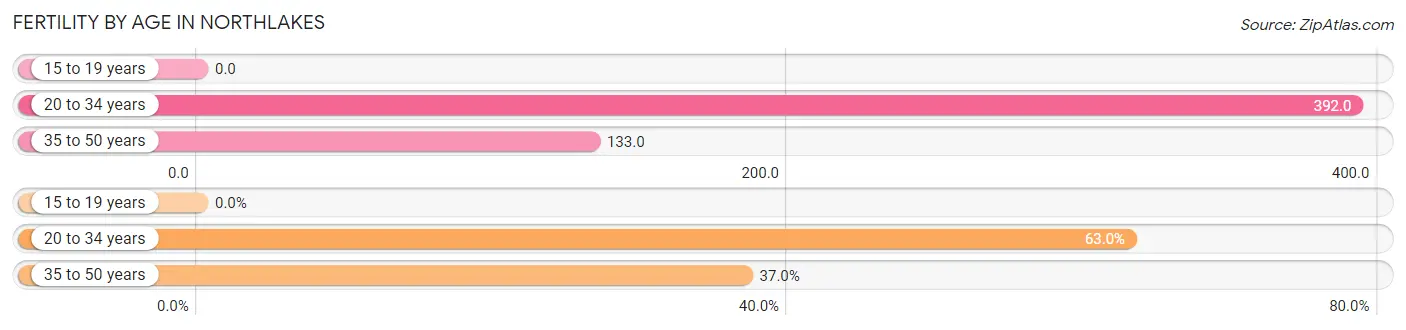
| Age Bracket | Women with Births | Births / 1,000 Women |
| 15 to 19 years | 0 (0.0%) | 0.0 |
| 20 to 34 years | 29 (63.0%) | 392.0 |
| 35 to 50 years | 17 (37.0%) | 133.0 |
| Total | 46 (100.0%) | 228.0 |
Fertility by Age by Marriage Status in Northlakes
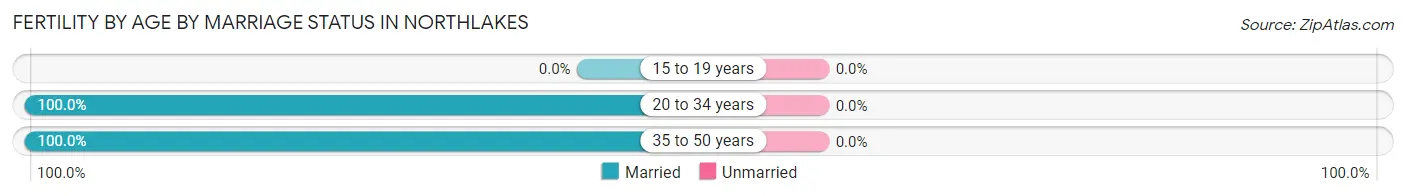
| Age Bracket | Married | Unmarried |
| 15 to 19 years | 0 (0.0%) | 0 (0.0%) |
| 20 to 34 years | 29 (100.0%) | 0 (0.0%) |
| 35 to 50 years | 17 (100.0%) | 0 (0.0%) |
| Total | 46 (100.0%) | 0 (0.0%) |
Fertility by Education in Northlakes
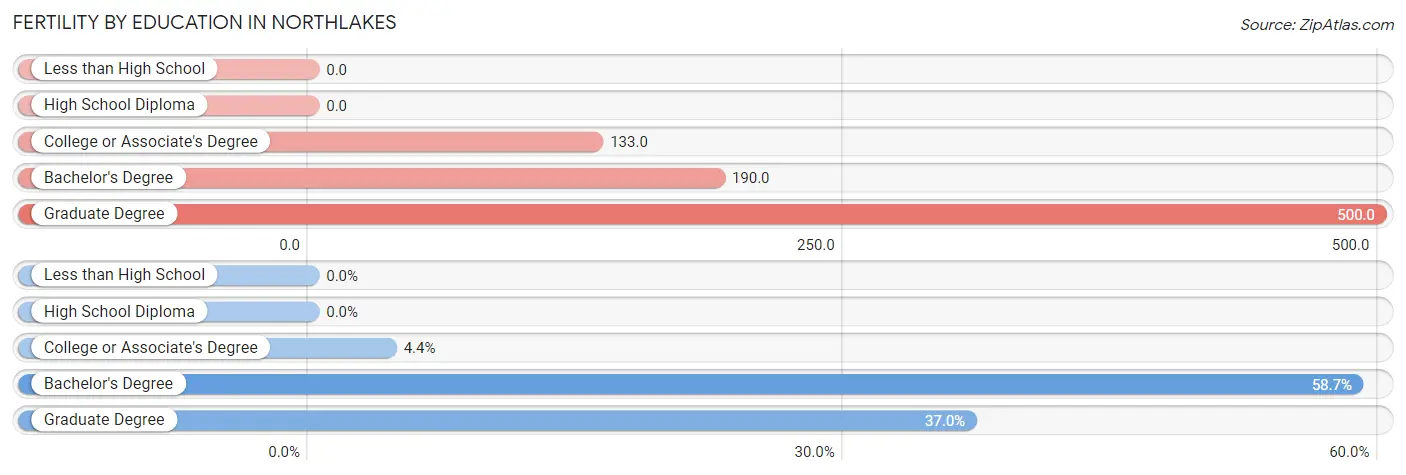
| Educational Attainment | Women with Births | Births / 1,000 Women |
| Less than High School | 0 (0.0%) | 0.0 |
| High School Diploma | 0 (0.0%) | 0.0 |
| College or Associate's Degree | 2 (4.3%) | 133.0 |
| Bachelor's Degree | 27 (58.7%) | 190.0 |
| Graduate Degree | 17 (37.0%) | 500.0 |
| Total | 46 (100.0%) | 228.0 |
Fertility by Education by Marriage Status in Northlakes
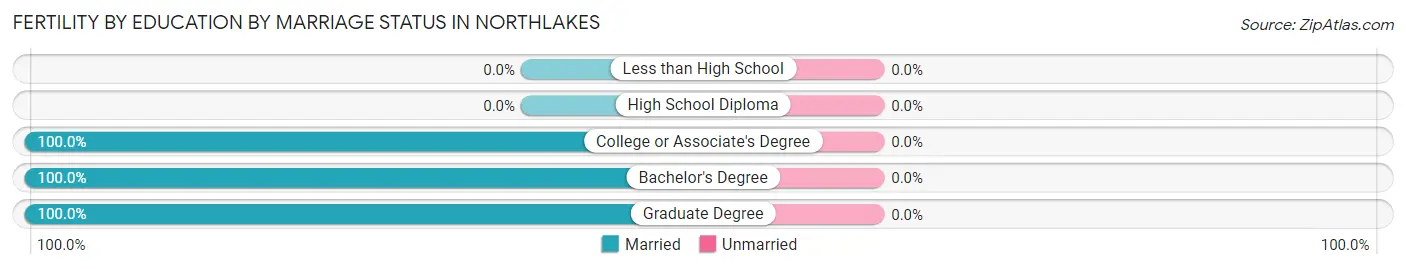
| Educational Attainment | Married | Unmarried |
| Less than High School | 0 (0.0%) | 0 (0.0%) |
| High School Diploma | 0 (0.0%) | 0 (0.0%) |
| College or Associate's Degree | 2 (100.0%) | 0 (0.0%) |
| Bachelor's Degree | 27 (100.0%) | 0 (0.0%) |
| Graduate Degree | 17 (100.0%) | 0 (0.0%) |
| Total | 46 (100.0%) | 0 (0.0%) |
Employment Characteristics in Northlakes
Employment by Class of Employer in Northlakes
Among the 716 employed individuals in Northlakes, private company employees (511 | 71.4%), self-employed (incorporated) (65 | 9.1%), and state government employees (52 | 7.3%) make up the most common classes of employment.
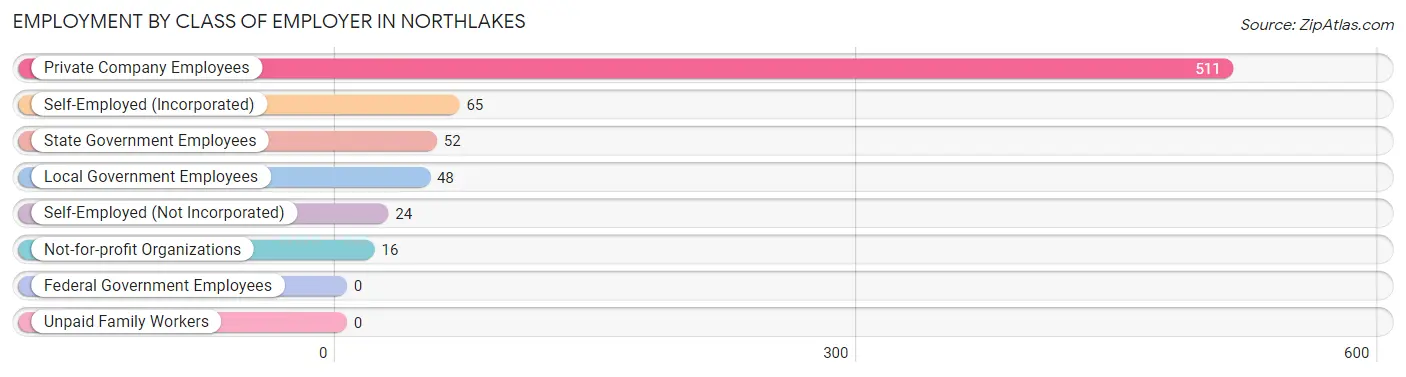
| Employer Class | # Employees | % Employees |
| Private Company Employees | 511 | 71.4% |
| Self-Employed (Incorporated) | 65 | 9.1% |
| Self-Employed (Not Incorporated) | 24 | 3.4% |
| Not-for-profit Organizations | 16 | 2.2% |
| Local Government Employees | 48 | 6.7% |
| State Government Employees | 52 | 7.3% |
| Federal Government Employees | 0 | 0.0% |
| Unpaid Family Workers | 0 | 0.0% |
| Total | 716 | 100.0% |
Employment Status by Age in Northlakes
According to the labor force statistics for Northlakes, out of the total population over 16 years of age (1,102), 69.6% or 767 individuals are in the labor force, with 3.1% or 24 of them unemployed. The age group with the highest labor force participation rate is 30 to 34 years, with 100.0% or 106 individuals in the labor force. Within the labor force, the 25 to 29 years age range has the highest percentage of unemployed individuals, with 27.6% or 16 of them being unemployed.
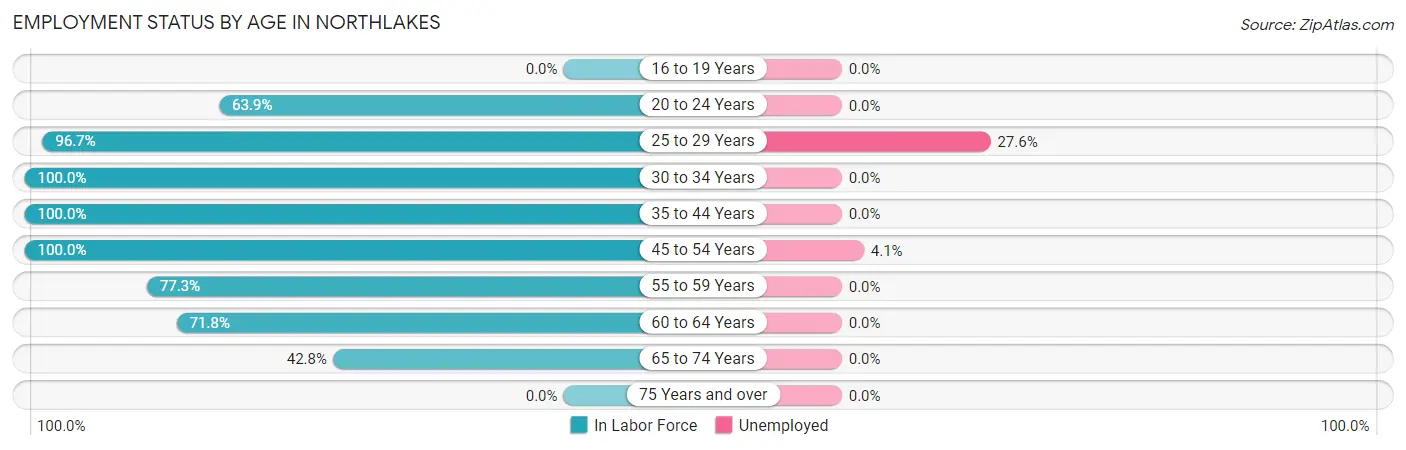
| Age Bracket | In Labor Force | Unemployed |
| 16 to 19 Years | 0 (0.0%) | 0 (0.0%) |
| 20 to 24 Years | 23 (63.9%) | 0 (0.0%) |
| 25 to 29 Years | 58 (96.7%) | 16 (27.6%) |
| 30 to 34 Years | 106 (100.0%) | 0 (0.0%) |
| 35 to 44 Years | 105 (100.0%) | 0 (0.0%) |
| 45 to 54 Years | 195 (100.0%) | 8 (4.1%) |
| 55 to 59 Years | 99 (77.3%) | 0 (0.0%) |
| 60 to 64 Years | 74 (71.8%) | 0 (0.0%) |
| 65 to 74 Years | 107 (42.8%) | 0 (0.0%) |
| 75 Years and over | 0 (0.0%) | 0 (0.0%) |
| Total | 767 (69.6%) | 24 (3.1%) |
Employment Status by Educational Attainment in Northlakes
According to labor force statistics for Northlakes, 91.4% of individuals (637) out of the total population between 25 and 64 years of age (697) are in the labor force, with 3.8% or 24 of them being unemployed. The group with the highest labor force participation rate are those with the educational attainment of high school diploma, with 100.0% or 100 individuals in the labor force. Within the labor force, individuals with college / associate degree education have the highest percentage of unemployment, with 6.6% or 8 of them being unemployed.
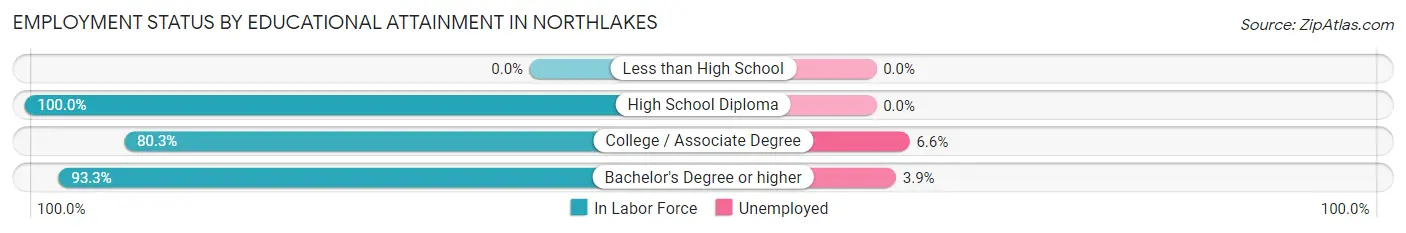
| Educational Attainment | In Labor Force | Unemployed |
| Less than High School | 0 (0.0%) | 0 (0.0%) |
| High School Diploma | 100 (100.0%) | 0 (0.0%) |
| College / Associate Degree | 122 (80.3%) | 10 (6.6%) |
| Bachelor's Degree or higher | 415 (93.3%) | 17 (3.9%) |
| Total | 637 (91.4%) | 26 (3.8%) |
Employment Occupations by Sex in Northlakes
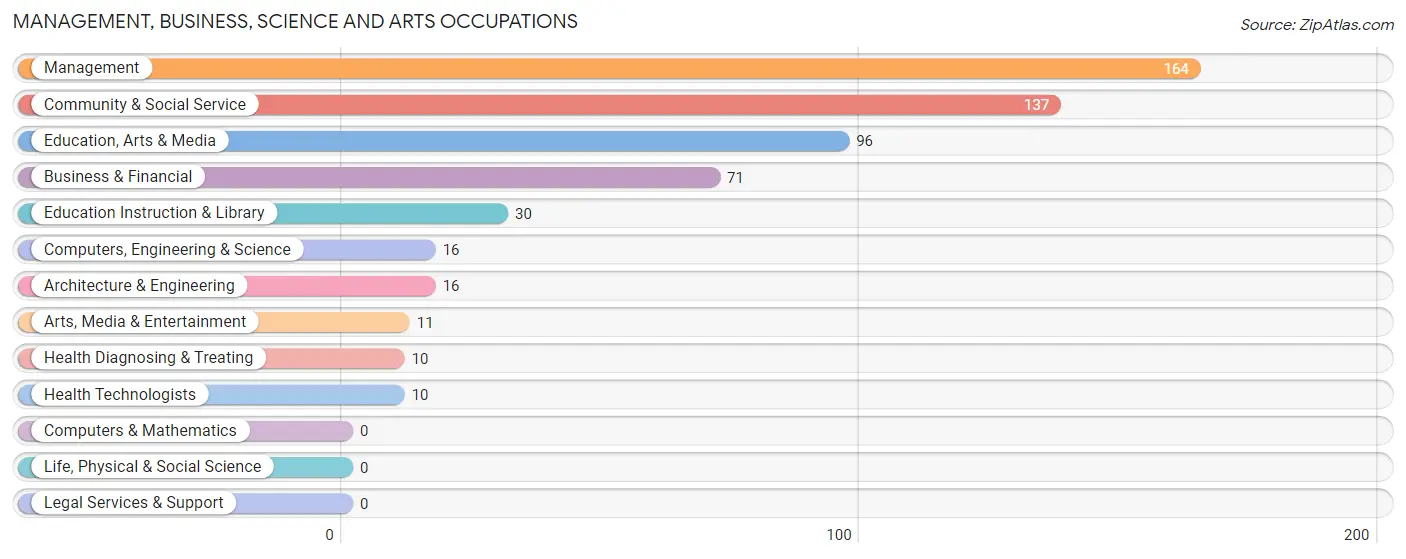
Management, Business, Science and Arts Occupations
The most common Management, Business, Science and Arts occupations in Northlakes are Management (164 | 22.1%), Community & Social Service (137 | 18.4%), Education, Arts & Media (96 | 12.9%), Business & Financial (71 | 9.6%), and Education Instruction & Library (30 | 4.0%).
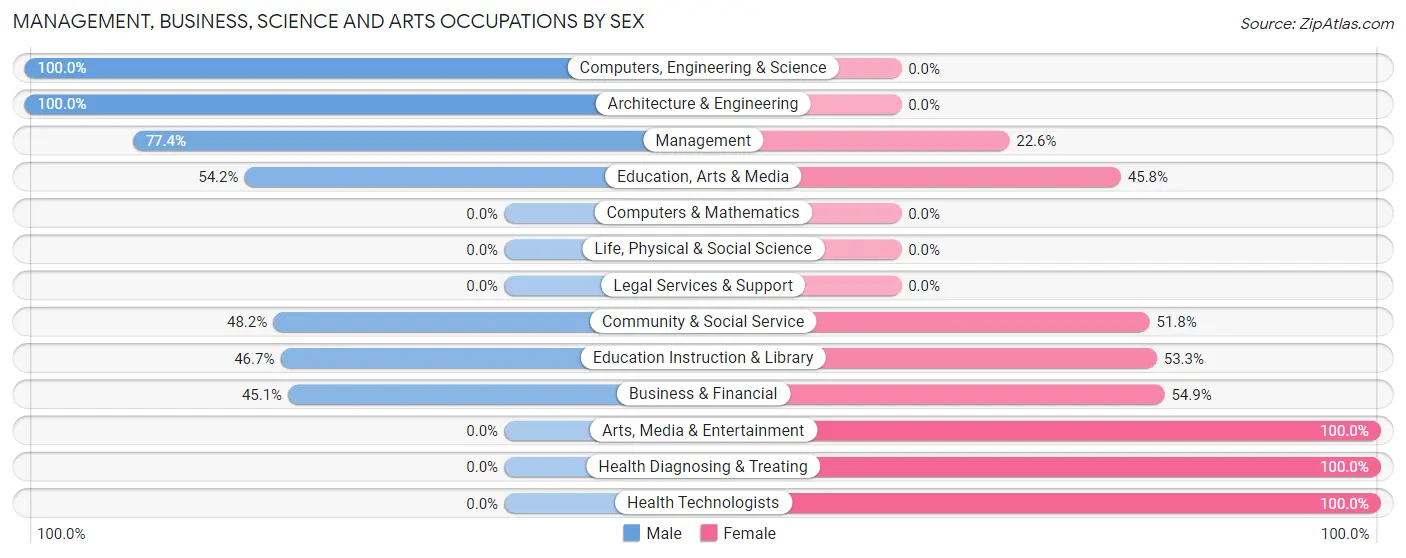
Management, Business, Science and Arts Occupations by Sex
Within the Management, Business, Science and Arts occupations in Northlakes, the most male-oriented occupations are Computers, Engineering & Science (100.0%), Architecture & Engineering (100.0%), and Management (77.4%), while the most female-oriented occupations are Arts, Media & Entertainment (100.0%), Health Diagnosing & Treating (100.0%), and Health Technologists (100.0%).
| Occupation | Male | Female |
| Management | 127 (77.4%) | 37 (22.6%) |
| Business & Financial | 32 (45.1%) | 39 (54.9%) |
| Computers, Engineering & Science | 16 (100.0%) | 0 (0.0%) |
| Computers & Mathematics | 0 (0.0%) | 0 (0.0%) |
| Architecture & Engineering | 16 (100.0%) | 0 (0.0%) |
| Life, Physical & Social Science | 0 (0.0%) | 0 (0.0%) |
| Community & Social Service | 66 (48.2%) | 71 (51.8%) |
| Education, Arts & Media | 52 (54.2%) | 44 (45.8%) |
| Legal Services & Support | 0 (0.0%) | 0 (0.0%) |
| Education Instruction & Library | 14 (46.7%) | 16 (53.3%) |
| Arts, Media & Entertainment | 0 (0.0%) | 11 (100.0%) |
| Health Diagnosing & Treating | 0 (0.0%) | 10 (100.0%) |
| Health Technologists | 0 (0.0%) | 10 (100.0%) |
| Total (Category) | 241 (60.6%) | 157 (39.5%) |
| Total (Overall) | 421 (56.7%) | 322 (43.3%) |
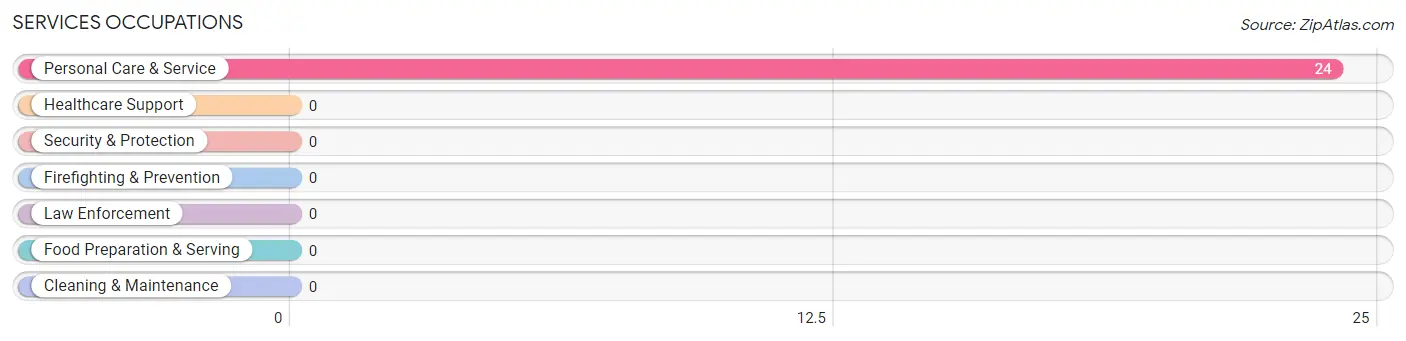
Services Occupations
The most common Services occupations in Northlakes are , and Personal Care & Service (24 | 3.2%).
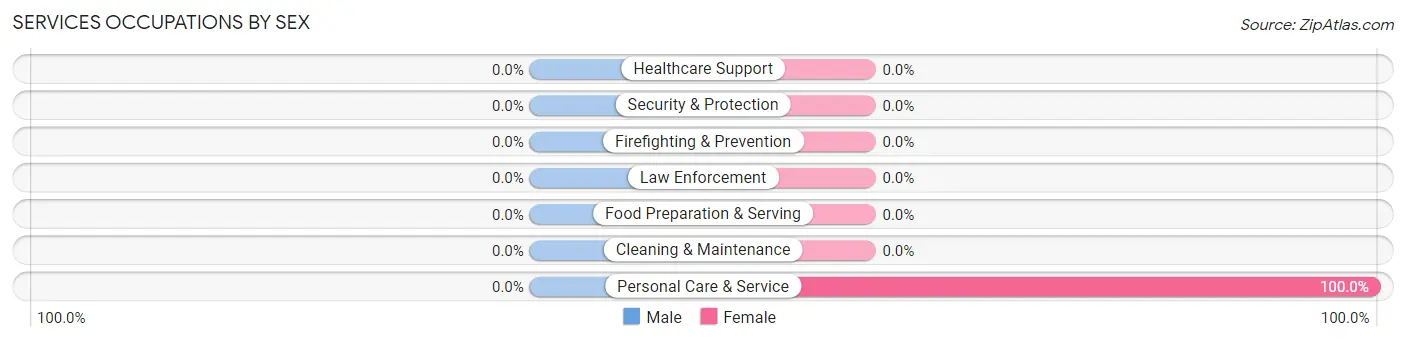
Services Occupations by Sex
| Occupation | Male | Female |
| Healthcare Support | 0 (0.0%) | 0 (0.0%) |
| Security & Protection | 0 (0.0%) | 0 (0.0%) |
| Firefighting & Prevention | 0 (0.0%) | 0 (0.0%) |
| Law Enforcement | 0 (0.0%) | 0 (0.0%) |
| Food Preparation & Serving | 0 (0.0%) | 0 (0.0%) |
| Cleaning & Maintenance | 0 (0.0%) | 0 (0.0%) |
| Personal Care & Service | 0 (0.0%) | 24 (100.0%) |
| Total (Category) | 0 (0.0%) | 24 (100.0%) |
| Total (Overall) | 421 (56.7%) | 322 (43.3%) |
Sales and Office Occupations
The most common Sales and Office occupations in Northlakes are Sales & Related (152 | 20.5%), and Office & Administration (13 | 1.8%).
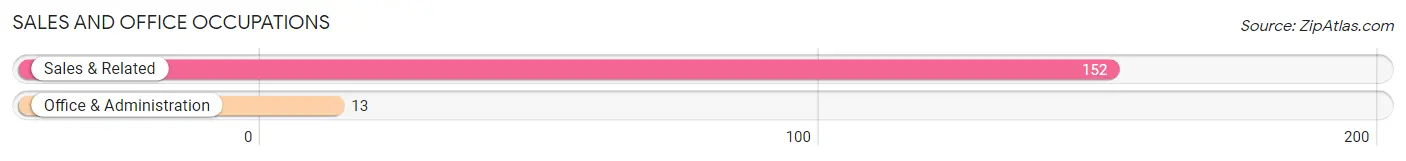
Sales and Office Occupations by Sex
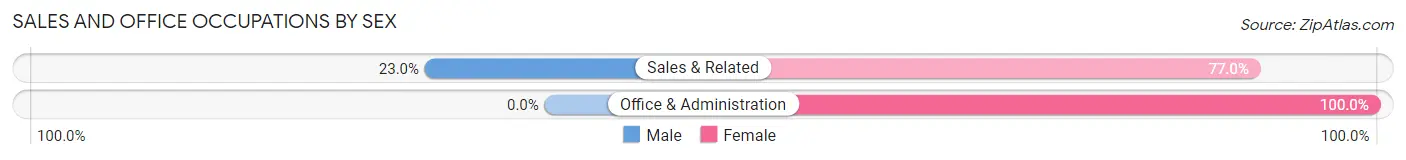
| Occupation | Male | Female |
| Sales & Related | 35 (23.0%) | 117 (77.0%) |
| Office & Administration | 0 (0.0%) | 13 (100.0%) |
| Total (Category) | 35 (21.2%) | 130 (78.8%) |
| Total (Overall) | 421 (56.7%) | 322 (43.3%) |
Natural Resources, Construction and Maintenance Occupations
The most common Natural Resources, Construction and Maintenance occupations in Northlakes are , and Installation, Maintenance & Repair (13 | 1.8%).
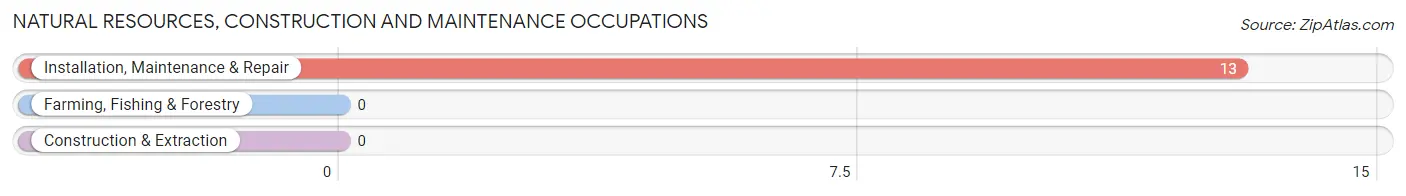
Natural Resources, Construction and Maintenance Occupations by Sex
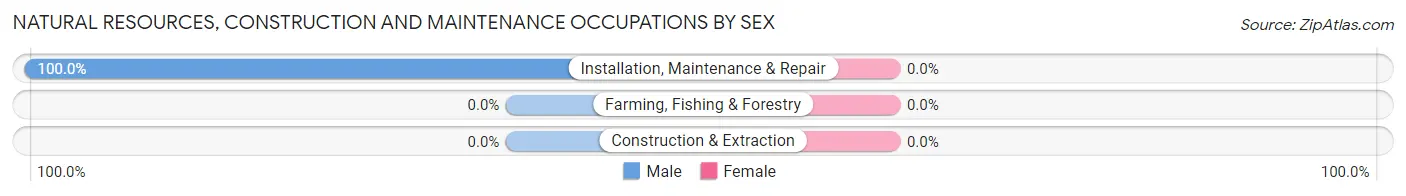
| Occupation | Male | Female |
| Farming, Fishing & Forestry | 0 (0.0%) | 0 (0.0%) |
| Construction & Extraction | 0 (0.0%) | 0 (0.0%) |
| Installation, Maintenance & Repair | 13 (100.0%) | 0 (0.0%) |
| Total (Category) | 13 (100.0%) | 0 (0.0%) |
| Total (Overall) | 421 (56.7%) | 322 (43.3%) |
Production, Transportation and Moving Occupations
The most common Production, Transportation and Moving occupations in Northlakes are Transportation (90 | 12.1%), Material Moving (42 | 5.7%), and Production (11 | 1.5%).
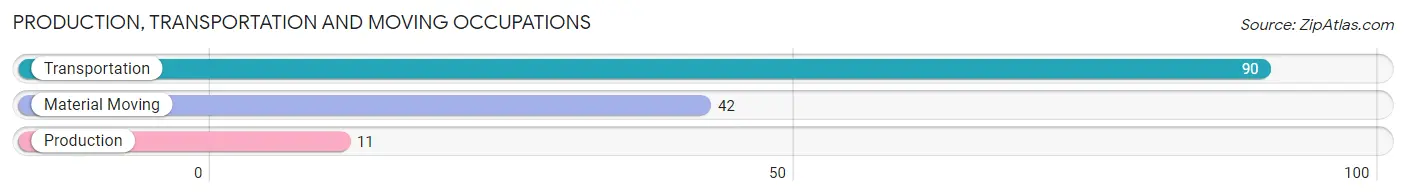
Production, Transportation and Moving Occupations by Sex
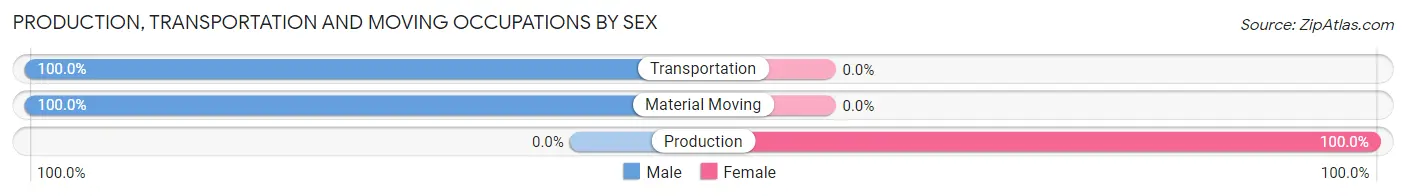
| Occupation | Male | Female |
| Production | 0 (0.0%) | 11 (100.0%) |
| Transportation | 90 (100.0%) | 0 (0.0%) |
| Material Moving | 42 (100.0%) | 0 (0.0%) |
| Total (Category) | 132 (92.3%) | 11 (7.7%) |
| Total (Overall) | 421 (56.7%) | 322 (43.3%) |
Employment Industries by Sex in Northlakes
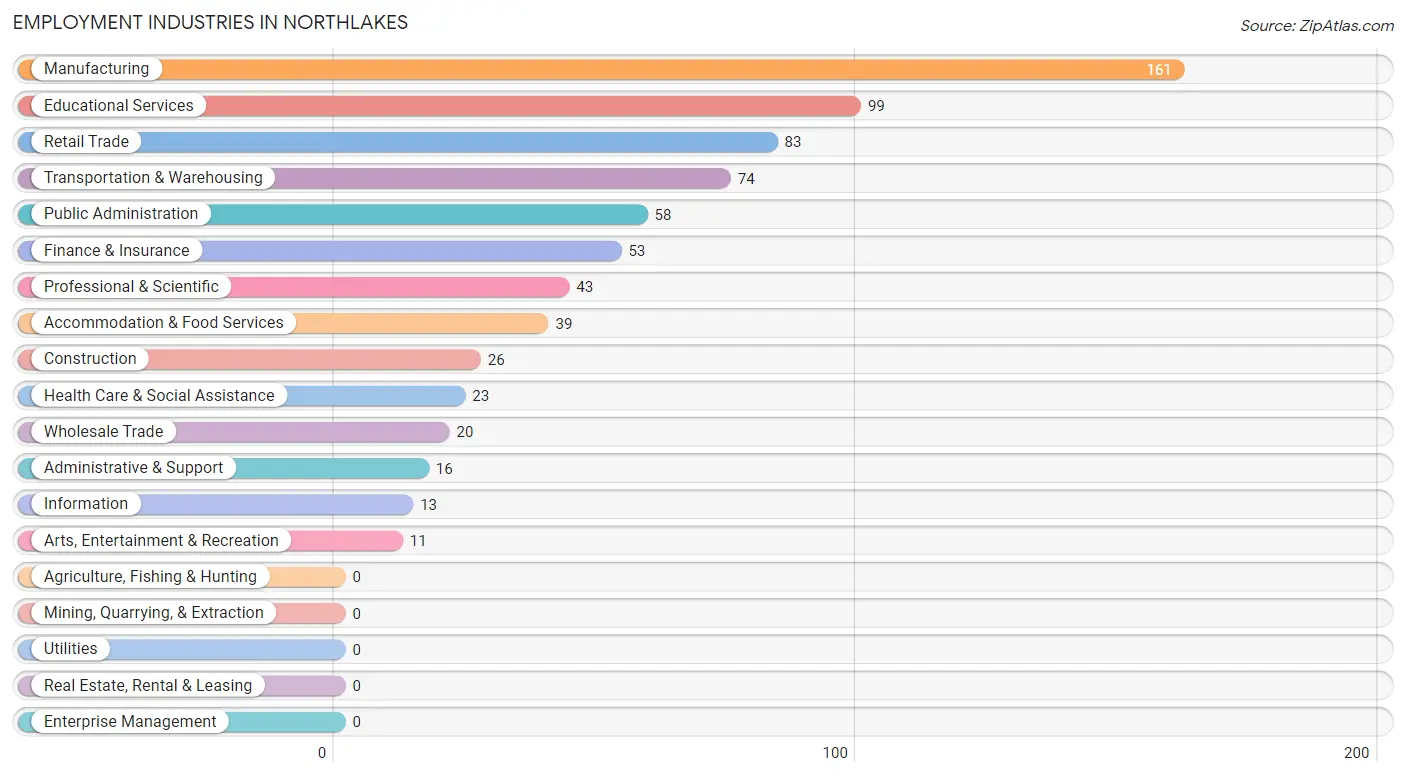
Employment Industries in Northlakes
The major employment industries in Northlakes include Manufacturing (161 | 21.7%), Educational Services (99 | 13.3%), Retail Trade (83 | 11.2%), Transportation & Warehousing (74 | 10.0%), and Public Administration (58 | 7.8%).
Employment Industries by Sex in Northlakes
The Northlakes industries that see more men than women are Construction (100.0%), Information (100.0%), and Accommodation & Food Services (100.0%), whereas the industries that tend to have a higher number of women are Finance & Insurance (100.0%), Administrative & Support (100.0%), and Health Care & Social Assistance (100.0%).
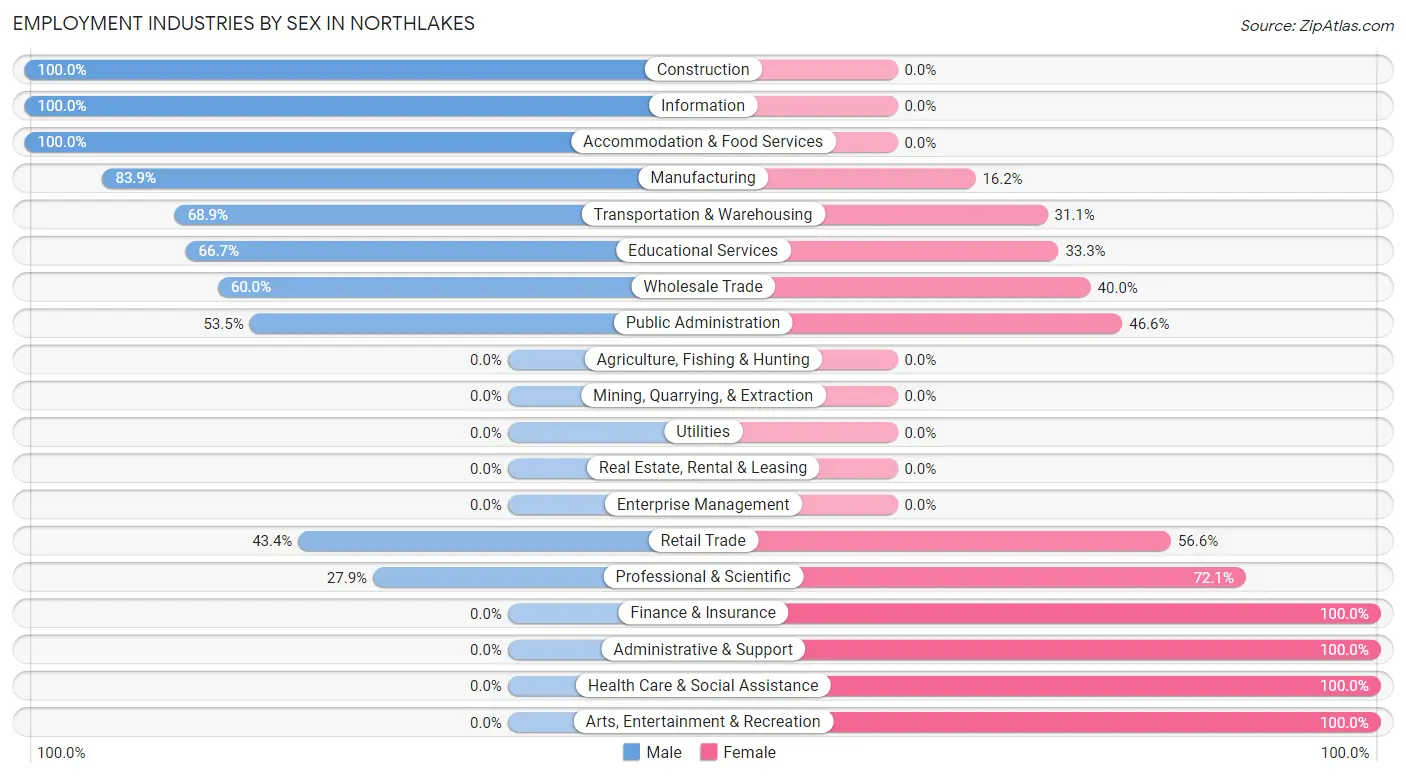
| Industry | Male | Female |
| Agriculture, Fishing & Hunting | 0 (0.0%) | 0 (0.0%) |
| Mining, Quarrying, & Extraction | 0 (0.0%) | 0 (0.0%) |
| Construction | 26 (100.0%) | 0 (0.0%) |
| Manufacturing | 135 (83.9%) | 26 (16.2%) |
| Wholesale Trade | 12 (60.0%) | 8 (40.0%) |
| Retail Trade | 36 (43.4%) | 47 (56.6%) |
| Transportation & Warehousing | 51 (68.9%) | 23 (31.1%) |
| Utilities | 0 (0.0%) | 0 (0.0%) |
| Information | 13 (100.0%) | 0 (0.0%) |
| Finance & Insurance | 0 (0.0%) | 53 (100.0%) |
| Real Estate, Rental & Leasing | 0 (0.0%) | 0 (0.0%) |
| Professional & Scientific | 12 (27.9%) | 31 (72.1%) |
| Enterprise Management | 0 (0.0%) | 0 (0.0%) |
| Administrative & Support | 0 (0.0%) | 16 (100.0%) |
| Educational Services | 66 (66.7%) | 33 (33.3%) |
| Health Care & Social Assistance | 0 (0.0%) | 23 (100.0%) |
| Arts, Entertainment & Recreation | 0 (0.0%) | 11 (100.0%) |
| Accommodation & Food Services | 39 (100.0%) | 0 (0.0%) |
| Public Administration | 31 (53.4%) | 27 (46.6%) |
| Total | 421 (56.7%) | 322 (43.3%) |
Education in Northlakes
School Enrollment in Northlakes
The most common levels of schooling among the 358 students in Northlakes are high school (101 | 28.2%), middle school (91 | 25.4%), and elementary school (73 | 20.4%).
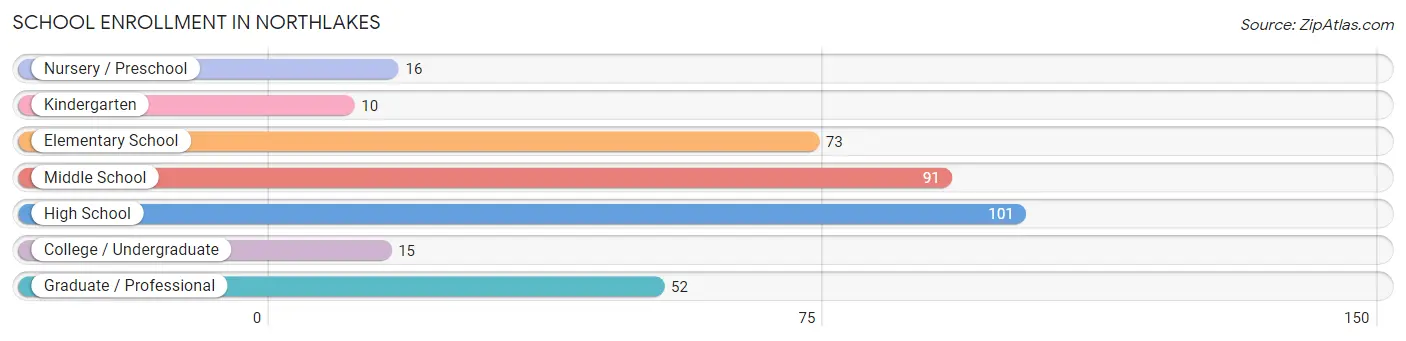
| School Level | # Students | % Students |
| Nursery / Preschool | 16 | 4.5% |
| Kindergarten | 10 | 2.8% |
| Elementary School | 73 | 20.4% |
| Middle School | 91 | 25.4% |
| High School | 101 | 28.2% |
| College / Undergraduate | 15 | 4.2% |
| Graduate / Professional | 52 | 14.5% |
| Total | 358 | 100.0% |
School Enrollment by Age by Funding Source in Northlakes
Out of a total of 358 students who are enrolled in schools in Northlakes, 97 (27.1%) attend a private institution, while the remaining 261 (72.9%) are enrolled in public schools. The age group of 35 years and over has the highest likelihood of being enrolled in private schools, with 52 (100.0% in the age bracket) enrolled. Conversely, the age group of 15 to 17 year olds has the lowest likelihood of being enrolled in a private school, with 101 (100.0% in the age bracket) attending a public institution.
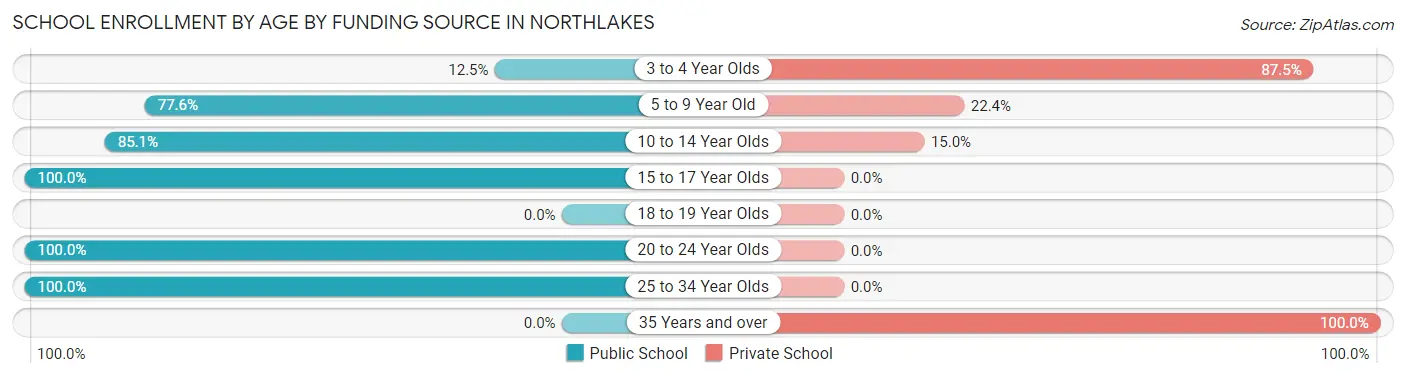
| Age Bracket | Public School | Private School |
| 3 to 4 Year Olds | 2 (12.5%) | 14 (87.5%) |
| 5 to 9 Year Old | 52 (77.6%) | 15 (22.4%) |
| 10 to 14 Year Olds | 91 (85.1%) | 16 (14.9%) |
| 15 to 17 Year Olds | 101 (100.0%) | 0 (0.0%) |
| 18 to 19 Year Olds | 0 (0.0%) | 0 (0.0%) |
| 20 to 24 Year Olds | 13 (100.0%) | 0 (0.0%) |
| 25 to 34 Year Olds | 2 (100.0%) | 0 (0.0%) |
| 35 Years and over | 0 (0.0%) | 52 (100.0%) |
| Total | 261 (72.9%) | 97 (27.1%) |
Educational Attainment by Field of Study in Northlakes
Business (188 | 28.4%), education (81 | 12.2%), social sciences (80 | 12.1%), engineering (55 | 8.3%), and arts & humanities (44 | 6.7%) are the most common fields of study among 662 individuals in Northlakes who have obtained a bachelor's degree or higher.
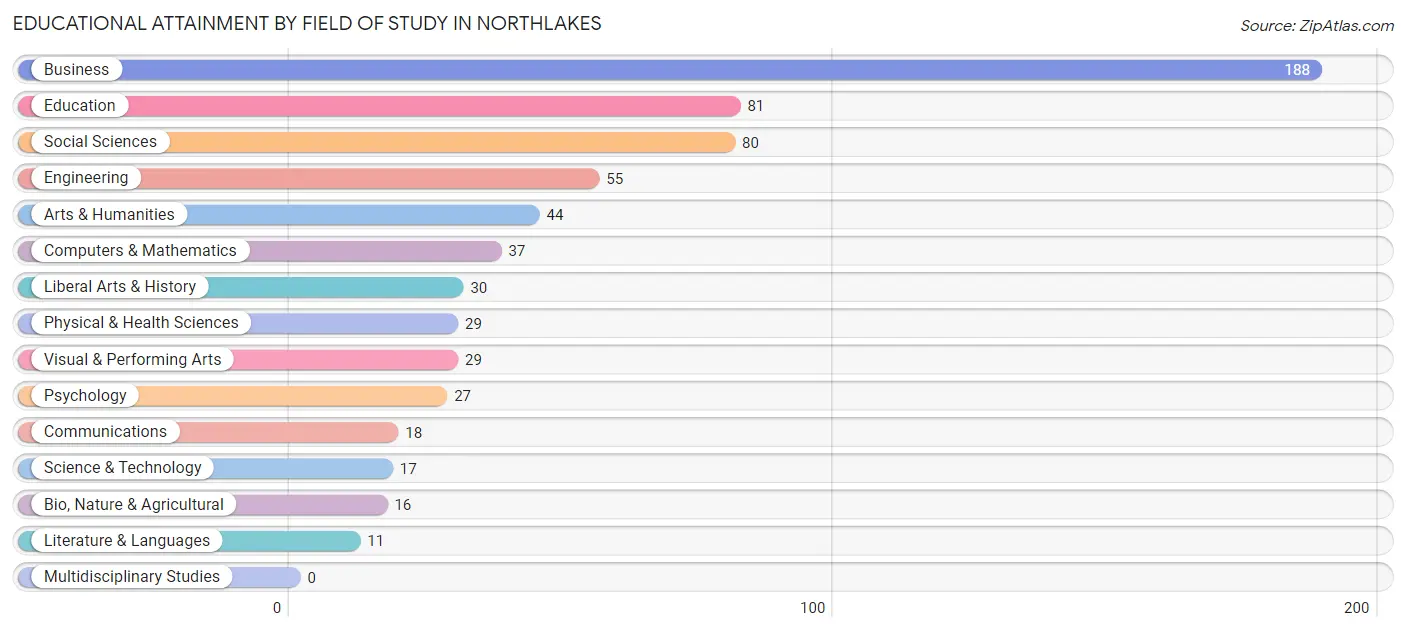
| Field of Study | # Graduates | % Graduates |
| Computers & Mathematics | 37 | 5.6% |
| Bio, Nature & Agricultural | 16 | 2.4% |
| Physical & Health Sciences | 29 | 4.4% |
| Psychology | 27 | 4.1% |
| Social Sciences | 80 | 12.1% |
| Engineering | 55 | 8.3% |
| Multidisciplinary Studies | 0 | 0.0% |
| Science & Technology | 17 | 2.6% |
| Business | 188 | 28.4% |
| Education | 81 | 12.2% |
| Literature & Languages | 11 | 1.7% |
| Liberal Arts & History | 30 | 4.5% |
| Visual & Performing Arts | 29 | 4.4% |
| Communications | 18 | 2.7% |
| Arts & Humanities | 44 | 6.7% |
| Total | 662 | 100.0% |
Transportation & Commute in Northlakes
Vehicle Availability by Sex in Northlakes
The most prevalent vehicle ownership categories in Northlakes are males with 2 vehicles (194, accounting for 46.1%) and females with 2 vehicles (108, making up 65.8%).
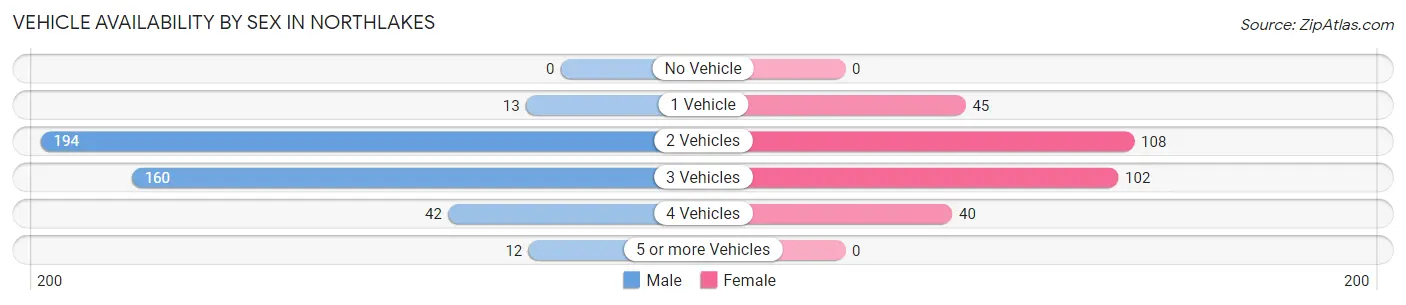
| Vehicles Available | Male | Female |
| No Vehicle | 0 (0.0%) | 0 (0.0%) |
| 1 Vehicle | 13 (3.1%) | 45 (15.2%) |
| 2 Vehicles | 194 (46.1%) | 108 (36.6%) |
| 3 Vehicles | 160 (38.0%) | 102 (34.6%) |
| 4 Vehicles | 42 (10.0%) | 40 (13.6%) |
| 5 or more Vehicles | 12 (2.9%) | 0 (0.0%) |
| Total | 421 (100.0%) | 295 (100.0%) |
Commute Time in Northlakes
The most frequently occuring commute durations in Northlakes are 15 to 19 minutes (248 commuters, 39.6%), 10 to 14 minutes (138 commuters, 22.0%), and 20 to 24 minutes (76 commuters, 12.1%).
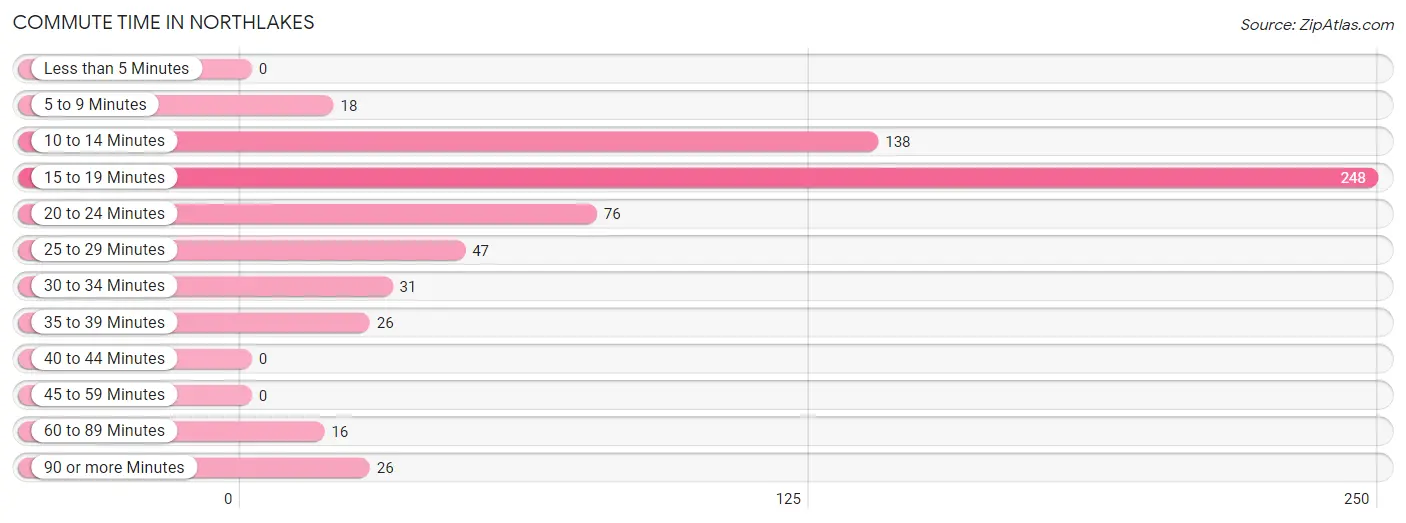
| Commute Time | # Commuters | % Commuters |
| Less than 5 Minutes | 0 | 0.0% |
| 5 to 9 Minutes | 18 | 2.9% |
| 10 to 14 Minutes | 138 | 22.0% |
| 15 to 19 Minutes | 248 | 39.6% |
| 20 to 24 Minutes | 76 | 12.1% |
| 25 to 29 Minutes | 47 | 7.5% |
| 30 to 34 Minutes | 31 | 5.0% |
| 35 to 39 Minutes | 26 | 4.2% |
| 40 to 44 Minutes | 0 | 0.0% |
| 45 to 59 Minutes | 0 | 0.0% |
| 60 to 89 Minutes | 16 | 2.6% |
| 90 or more Minutes | 26 | 4.2% |
Commute Time by Sex in Northlakes
The most common commute times in Northlakes are 10 to 14 minutes (138 commuters, 37.0%) for males and 15 to 19 minutes (122 commuters, 48.2%) for females.
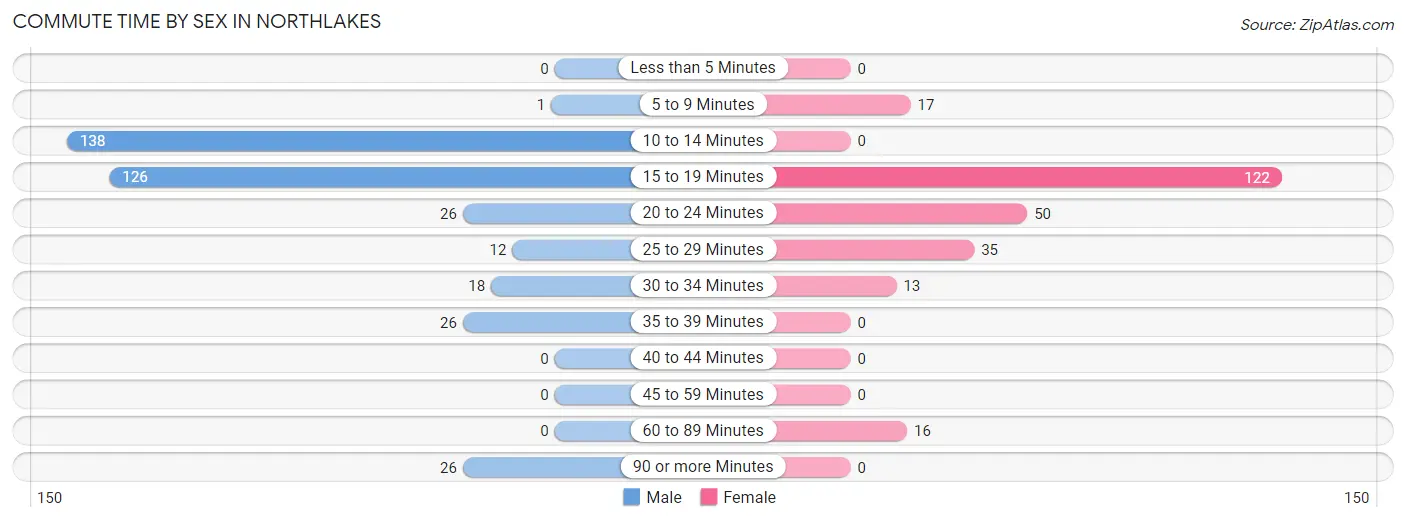
| Commute Time | Male | Female |
| Less than 5 Minutes | 0 (0.0%) | 0 (0.0%) |
| 5 to 9 Minutes | 1 (0.3%) | 17 (6.7%) |
| 10 to 14 Minutes | 138 (37.0%) | 0 (0.0%) |
| 15 to 19 Minutes | 126 (33.8%) | 122 (48.2%) |
| 20 to 24 Minutes | 26 (7.0%) | 50 (19.8%) |
| 25 to 29 Minutes | 12 (3.2%) | 35 (13.8%) |
| 30 to 34 Minutes | 18 (4.8%) | 13 (5.1%) |
| 35 to 39 Minutes | 26 (7.0%) | 0 (0.0%) |
| 40 to 44 Minutes | 0 (0.0%) | 0 (0.0%) |
| 45 to 59 Minutes | 0 (0.0%) | 0 (0.0%) |
| 60 to 89 Minutes | 0 (0.0%) | 16 (6.3%) |
| 90 or more Minutes | 26 (7.0%) | 0 (0.0%) |
Time of Departure to Work by Sex in Northlakes
The most frequent times of departure to work in Northlakes are 6:30 AM to 6:59 AM (65, 17.4%) for males and 7:30 AM to 7:59 AM (113, 44.7%) for females.
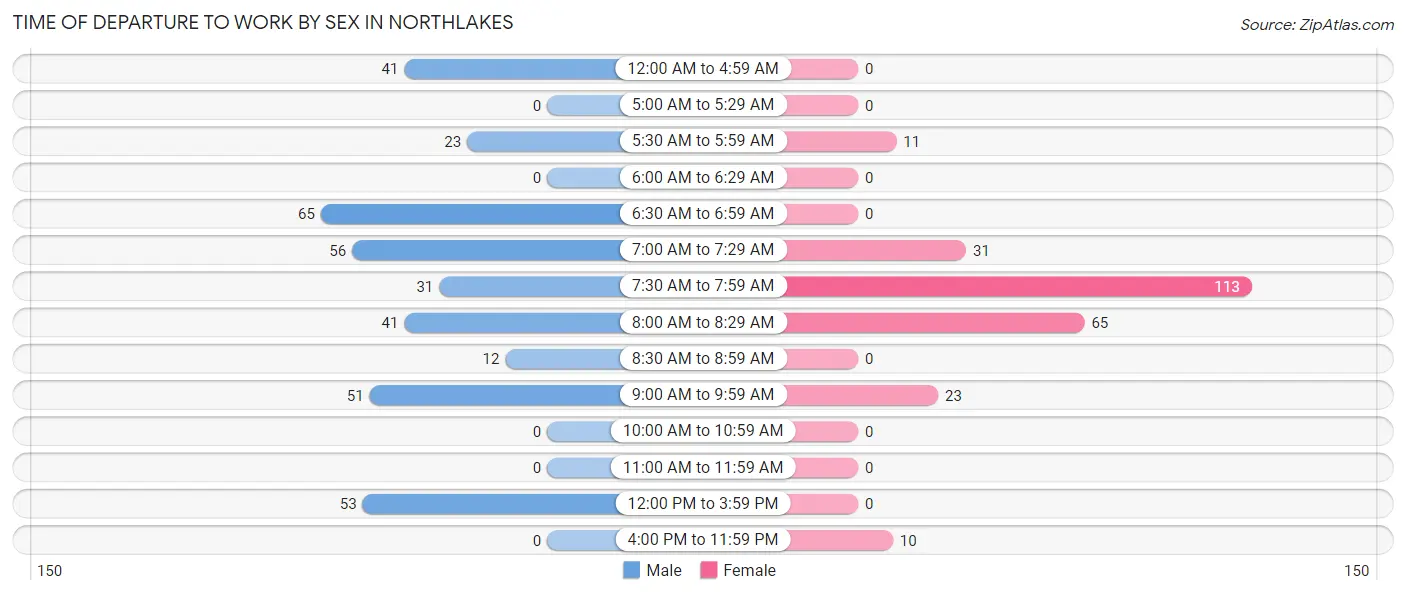
| Time of Departure | Male | Female |
| 12:00 AM to 4:59 AM | 41 (11.0%) | 0 (0.0%) |
| 5:00 AM to 5:29 AM | 0 (0.0%) | 0 (0.0%) |
| 5:30 AM to 5:59 AM | 23 (6.2%) | 11 (4.3%) |
| 6:00 AM to 6:29 AM | 0 (0.0%) | 0 (0.0%) |
| 6:30 AM to 6:59 AM | 65 (17.4%) | 0 (0.0%) |
| 7:00 AM to 7:29 AM | 56 (15.0%) | 31 (12.2%) |
| 7:30 AM to 7:59 AM | 31 (8.3%) | 113 (44.7%) |
| 8:00 AM to 8:29 AM | 41 (11.0%) | 65 (25.7%) |
| 8:30 AM to 8:59 AM | 12 (3.2%) | 0 (0.0%) |
| 9:00 AM to 9:59 AM | 51 (13.7%) | 23 (9.1%) |
| 10:00 AM to 10:59 AM | 0 (0.0%) | 0 (0.0%) |
| 11:00 AM to 11:59 AM | 0 (0.0%) | 0 (0.0%) |
| 12:00 PM to 3:59 PM | 53 (14.2%) | 0 (0.0%) |
| 4:00 PM to 11:59 PM | 0 (0.0%) | 10 (4.0%) |
| Total | 373 (100.0%) | 253 (100.0%) |
Housing Occupancy in Northlakes
Occupancy by Ownership in Northlakes
Of the total 542 dwellings in Northlakes, owner-occupied units account for 490 (90.4%), while renter-occupied units make up 52 (9.6%).
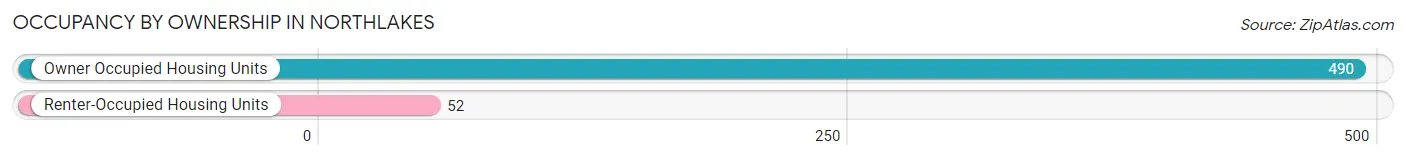
| Occupancy | # Housing Units | % Housing Units |
| Owner Occupied Housing Units | 490 | 90.4% |
| Renter-Occupied Housing Units | 52 | 9.6% |
| Total Occupied Housing Units | 542 | 100.0% |
Occupancy by Household Size in Northlakes
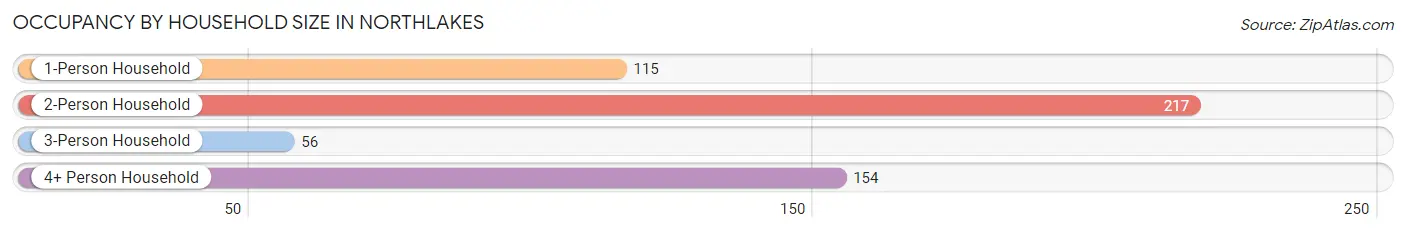
| Household Size | # Housing Units | % Housing Units |
| 1-Person Household | 115 | 21.2% |
| 2-Person Household | 217 | 40.0% |
| 3-Person Household | 56 | 10.3% |
| 4+ Person Household | 154 | 28.4% |
| Total Housing Units | 542 | 100.0% |
Occupancy by Ownership by Household Size in Northlakes
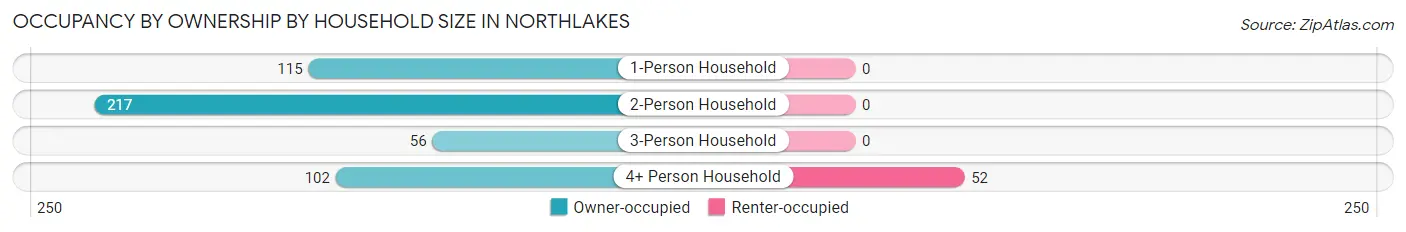
| Household Size | Owner-occupied | Renter-occupied |
| 1-Person Household | 115 (100.0%) | 0 (0.0%) |
| 2-Person Household | 217 (100.0%) | 0 (0.0%) |
| 3-Person Household | 56 (100.0%) | 0 (0.0%) |
| 4+ Person Household | 102 (66.2%) | 52 (33.8%) |
| Total Housing Units | 490 (90.4%) | 52 (9.6%) |
Occupancy by Educational Attainment in Northlakes
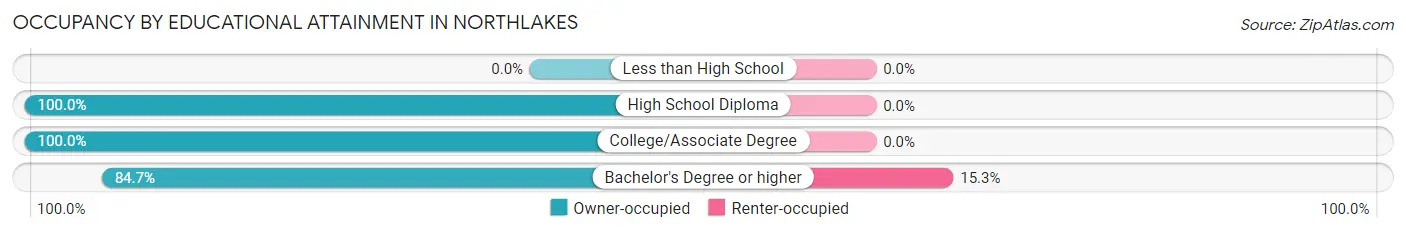
| Household Size | Owner-occupied | Renter-occupied |
| Less than High School | 0 (0.0%) | 0 (0.0%) |
| High School Diploma | 60 (100.0%) | 0 (0.0%) |
| College/Associate Degree | 142 (100.0%) | 0 (0.0%) |
| Bachelor's Degree or higher | 288 (84.7%) | 52 (15.3%) |
Occupancy by Age of Householder in Northlakes
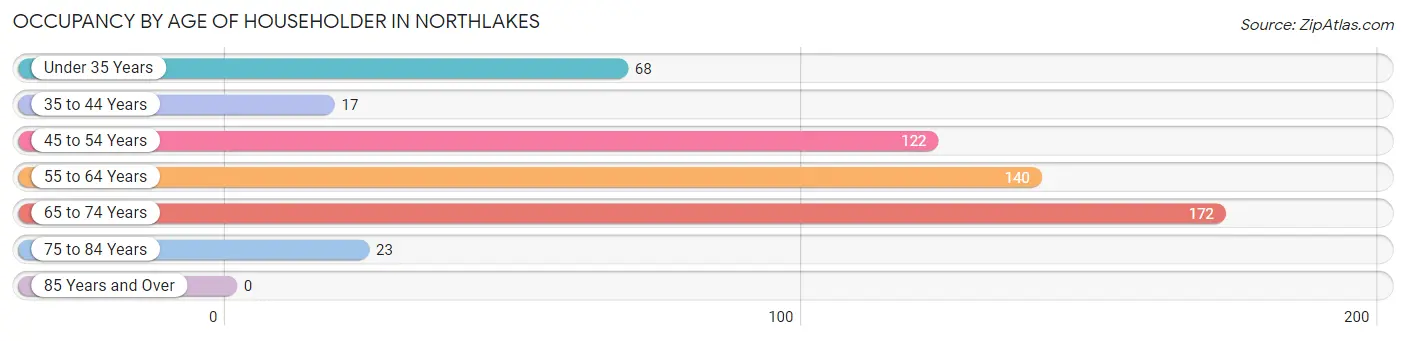
| Age Bracket | # Households | % Households |
| Under 35 Years | 68 | 12.6% |
| 35 to 44 Years | 17 | 3.1% |
| 45 to 54 Years | 122 | 22.5% |
| 55 to 64 Years | 140 | 25.8% |
| 65 to 74 Years | 172 | 31.7% |
| 75 to 84 Years | 23 | 4.2% |
| 85 Years and Over | 0 | 0.0% |
| Total | 542 | 100.0% |
Housing Finances in Northlakes
Median Income by Occupancy in Northlakes
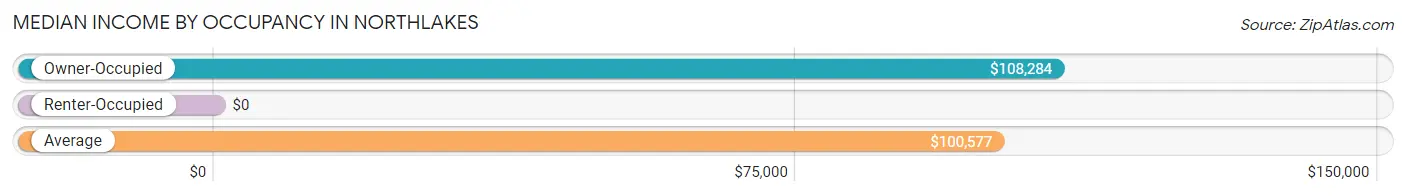
| Occupancy Type | # Households | Median Income |
| Owner-Occupied | 490 (90.4%) | $108,284 |
| Renter-Occupied | 52 (9.6%) | $0 |
| Average | 542 (100.0%) | $100,577 |
Occupancy by Householder Income Bracket in Northlakes
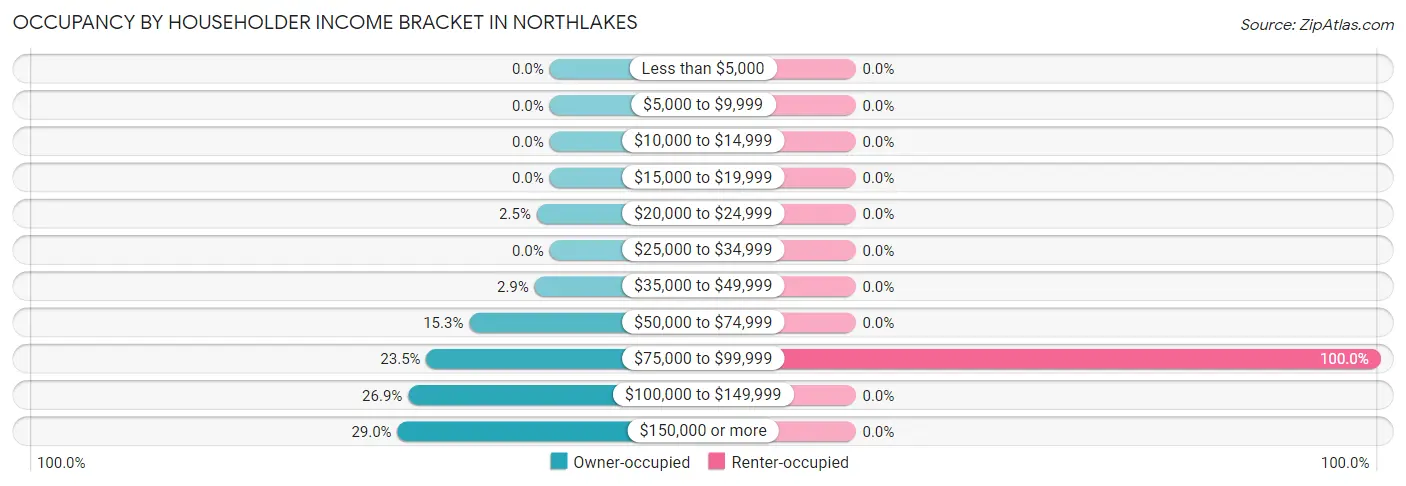
| Income Bracket | Owner-occupied | Renter-occupied |
| Less than $5,000 | 0 (0.0%) | 0 (0.0%) |
| $5,000 to $9,999 | 0 (0.0%) | 0 (0.0%) |
| $10,000 to $14,999 | 0 (0.0%) | 0 (0.0%) |
| $15,000 to $19,999 | 0 (0.0%) | 0 (0.0%) |
| $20,000 to $24,999 | 12 (2.5%) | 0 (0.0%) |
| $25,000 to $34,999 | 0 (0.0%) | 0 (0.0%) |
| $35,000 to $49,999 | 14 (2.9%) | 0 (0.0%) |
| $50,000 to $74,999 | 75 (15.3%) | 0 (0.0%) |
| $75,000 to $99,999 | 115 (23.5%) | 52 (100.0%) |
| $100,000 to $149,999 | 132 (26.9%) | 0 (0.0%) |
| $150,000 or more | 142 (29.0%) | 0 (0.0%) |
| Total | 490 (100.0%) | 52 (100.0%) |
Monthly Housing Cost Tiers in Northlakes
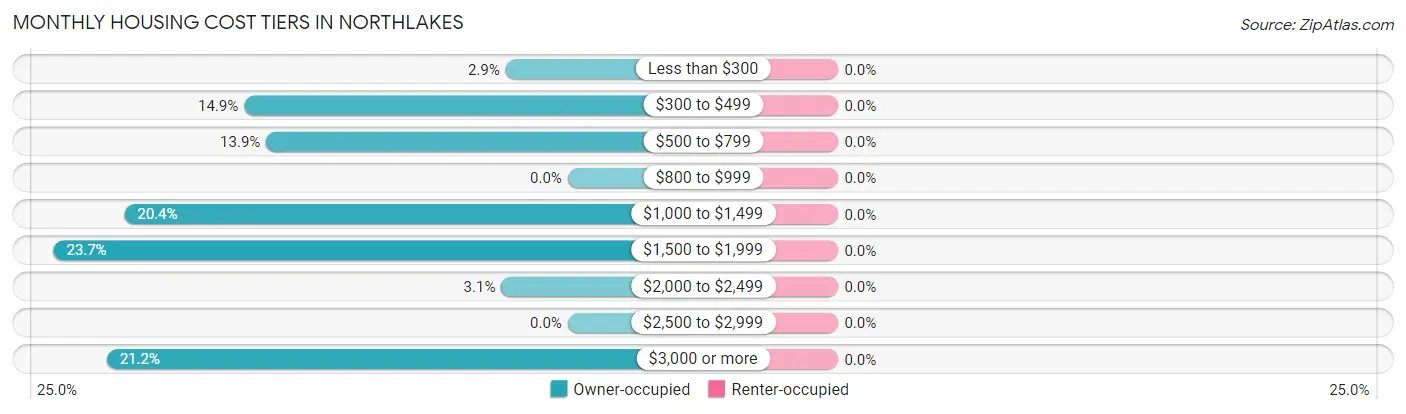
| Monthly Cost | Owner-occupied | Renter-occupied |
| Less than $300 | 14 (2.9%) | 0 (0.0%) |
| $300 to $499 | 73 (14.9%) | 0 (0.0%) |
| $500 to $799 | 68 (13.9%) | 0 (0.0%) |
| $800 to $999 | 0 (0.0%) | 0 (0.0%) |
| $1,000 to $1,499 | 100 (20.4%) | 0 (0.0%) |
| $1,500 to $1,999 | 116 (23.7%) | 0 (0.0%) |
| $2,000 to $2,499 | 15 (3.1%) | 0 (0.0%) |
| $2,500 to $2,999 | 0 (0.0%) | 0 (0.0%) |
| $3,000 or more | 104 (21.2%) | 0 (0.0%) |
| Total | 490 (100.0%) | 52 (100.0%) |
Physical Housing Characteristics in Northlakes
Housing Structures in Northlakes
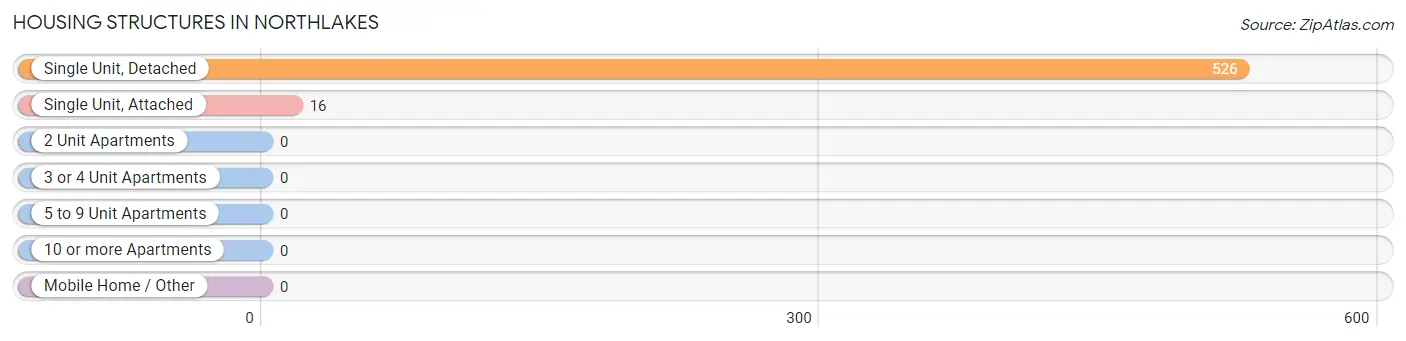
| Structure Type | # Housing Units | % Housing Units |
| Single Unit, Detached | 526 | 97.1% |
| Single Unit, Attached | 16 | 2.9% |
| 2 Unit Apartments | 0 | 0.0% |
| 3 or 4 Unit Apartments | 0 | 0.0% |
| 5 to 9 Unit Apartments | 0 | 0.0% |
| 10 or more Apartments | 0 | 0.0% |
| Mobile Home / Other | 0 | 0.0% |
| Total | 542 | 100.0% |
Housing Structures by Occupancy in Northlakes
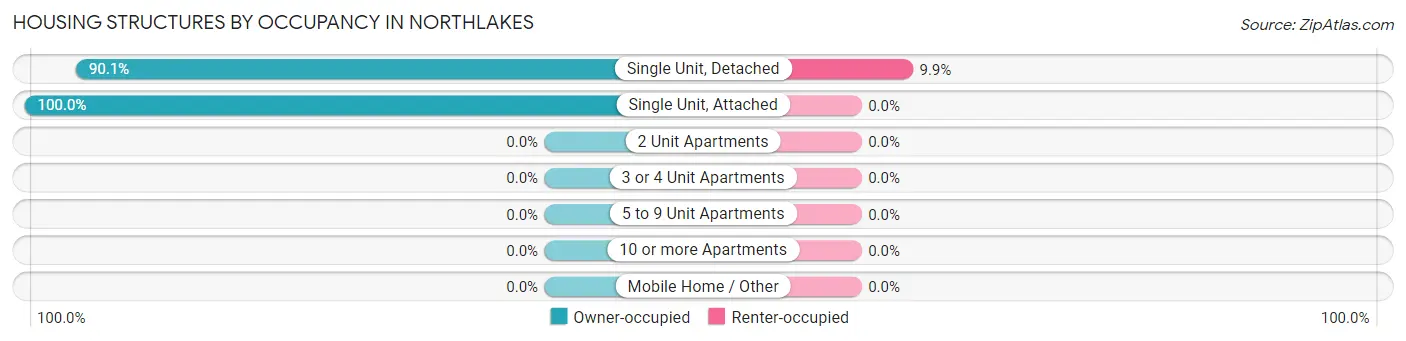
| Structure Type | Owner-occupied | Renter-occupied |
| Single Unit, Detached | 474 (90.1%) | 52 (9.9%) |
| Single Unit, Attached | 16 (100.0%) | 0 (0.0%) |
| 2 Unit Apartments | 0 (0.0%) | 0 (0.0%) |
| 3 or 4 Unit Apartments | 0 (0.0%) | 0 (0.0%) |
| 5 to 9 Unit Apartments | 0 (0.0%) | 0 (0.0%) |
| 10 or more Apartments | 0 (0.0%) | 0 (0.0%) |
| Mobile Home / Other | 0 (0.0%) | 0 (0.0%) |
| Total | 490 (90.4%) | 52 (9.6%) |
Housing Structures by Number of Rooms in Northlakes
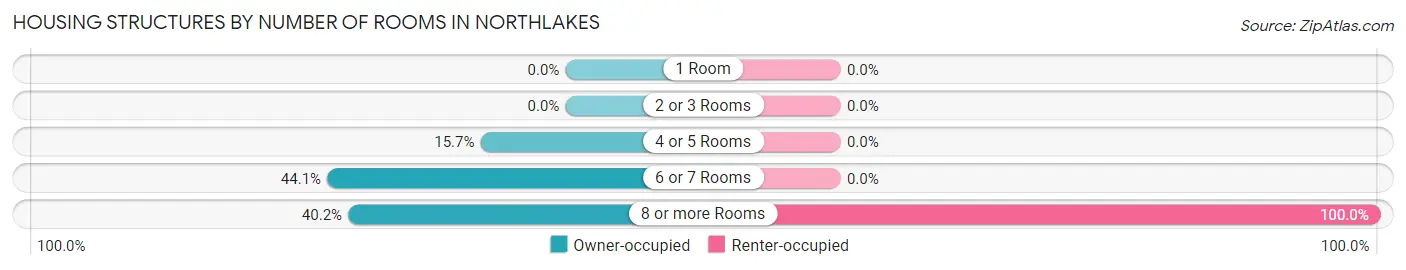
| Number of Rooms | Owner-occupied | Renter-occupied |
| 1 Room | 0 (0.0%) | 0 (0.0%) |
| 2 or 3 Rooms | 0 (0.0%) | 0 (0.0%) |
| 4 or 5 Rooms | 77 (15.7%) | 0 (0.0%) |
| 6 or 7 Rooms | 216 (44.1%) | 0 (0.0%) |
| 8 or more Rooms | 197 (40.2%) | 52 (100.0%) |
| Total | 490 (100.0%) | 52 (100.0%) |
Housing Structure by Heating Type in Northlakes
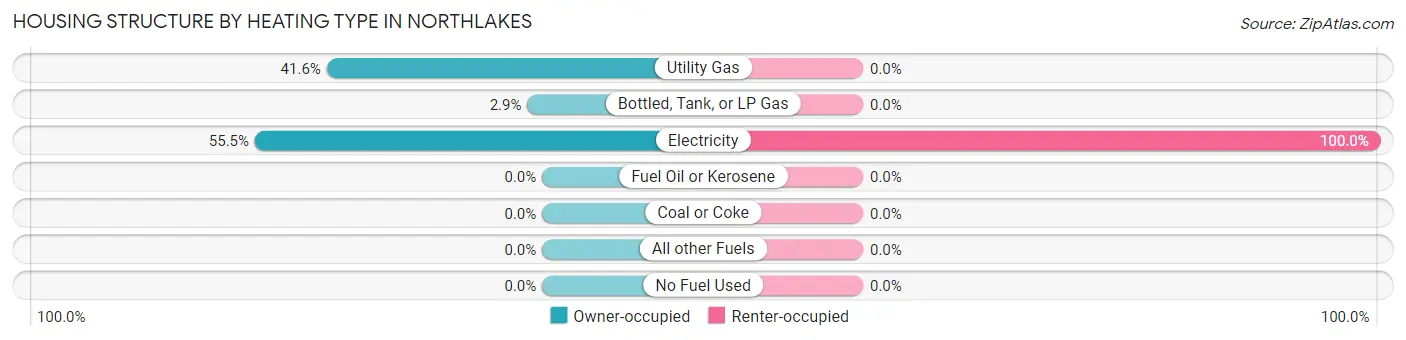
| Heating Type | Owner-occupied | Renter-occupied |
| Utility Gas | 204 (41.6%) | 0 (0.0%) |
| Bottled, Tank, or LP Gas | 14 (2.9%) | 0 (0.0%) |
| Electricity | 272 (55.5%) | 52 (100.0%) |
| Fuel Oil or Kerosene | 0 (0.0%) | 0 (0.0%) |
| Coal or Coke | 0 (0.0%) | 0 (0.0%) |
| All other Fuels | 0 (0.0%) | 0 (0.0%) |
| No Fuel Used | 0 (0.0%) | 0 (0.0%) |
| Total | 490 (100.0%) | 52 (100.0%) |
Household Vehicle Usage in Northlakes
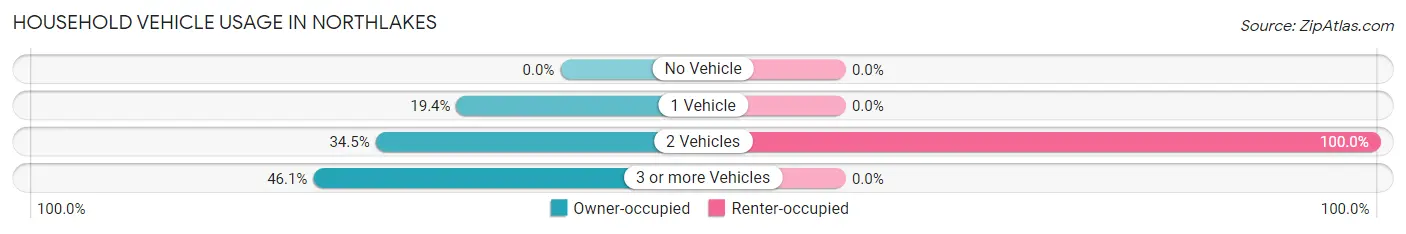
| Vehicles per Household | Owner-occupied | Renter-occupied |
| No Vehicle | 0 (0.0%) | 0 (0.0%) |
| 1 Vehicle | 95 (19.4%) | 0 (0.0%) |
| 2 Vehicles | 169 (34.5%) | 52 (100.0%) |
| 3 or more Vehicles | 226 (46.1%) | 0 (0.0%) |
| Total | 490 (100.0%) | 52 (100.0%) |
Real Estate & Mortgages in Northlakes
Real Estate and Mortgage Overview in Northlakes
| Characteristic | Without Mortgage | With Mortgage |
| Housing Units | 158 | 332 |
| Median Property Value | $255,000 | $307,100 |
| Median Household Income | $76,563 | $97 |
| Monthly Housing Costs | $482 | $104 |
| Real Estate Taxes | $1,643 | $0 |
Property Value by Mortgage Status in Northlakes
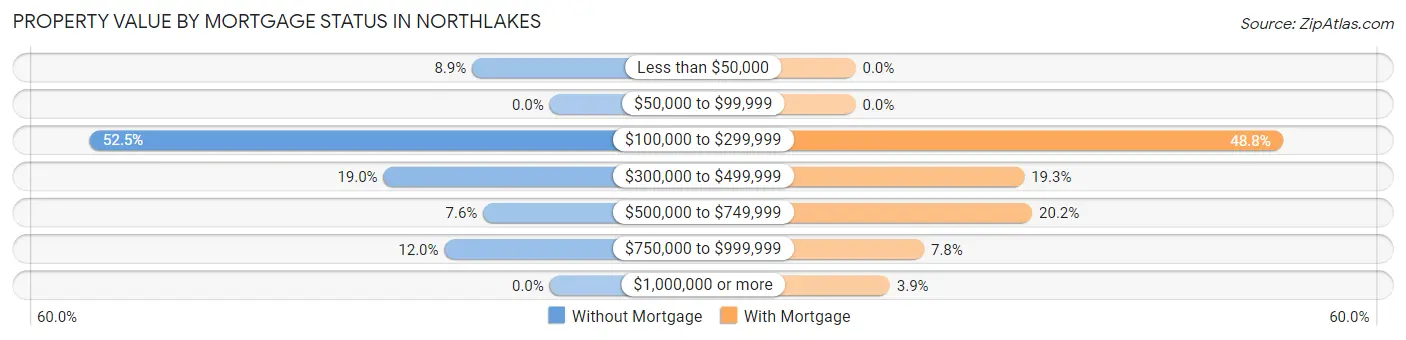
| Property Value | Without Mortgage | With Mortgage |
| Less than $50,000 | 14 (8.9%) | 0 (0.0%) |
| $50,000 to $99,999 | 0 (0.0%) | 0 (0.0%) |
| $100,000 to $299,999 | 83 (52.5%) | 162 (48.8%) |
| $300,000 to $499,999 | 30 (19.0%) | 64 (19.3%) |
| $500,000 to $749,999 | 12 (7.6%) | 67 (20.2%) |
| $750,000 to $999,999 | 19 (12.0%) | 26 (7.8%) |
| $1,000,000 or more | 0 (0.0%) | 13 (3.9%) |
| Total | 158 (100.0%) | 332 (100.0%) |
Household Income by Mortgage Status in Northlakes
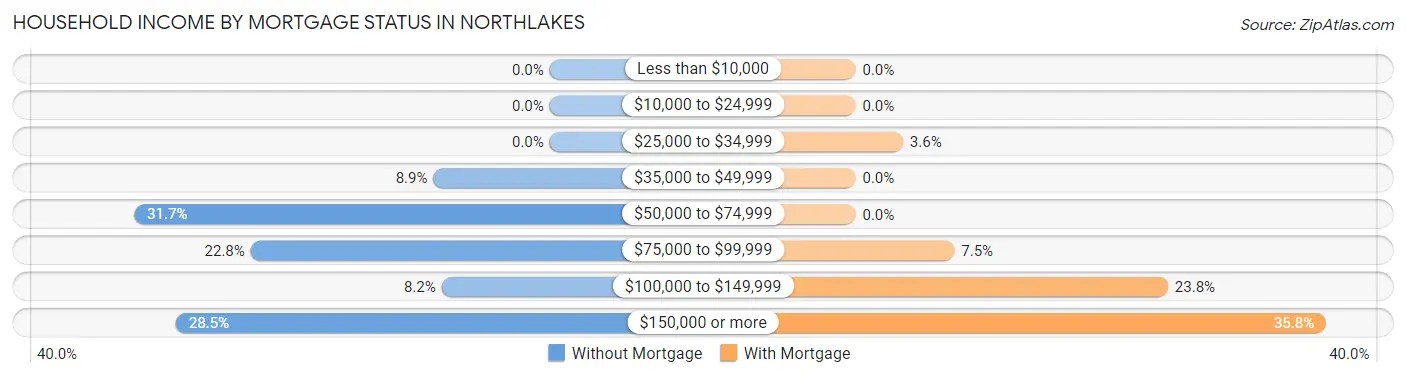
| Household Income | Without Mortgage | With Mortgage |
| Less than $10,000 | 0 (0.0%) | 0 (0.0%) |
| $10,000 to $24,999 | 0 (0.0%) | 0 (0.0%) |
| $25,000 to $34,999 | 0 (0.0%) | 12 (3.6%) |
| $35,000 to $49,999 | 14 (8.9%) | 0 (0.0%) |
| $50,000 to $74,999 | 50 (31.7%) | 0 (0.0%) |
| $75,000 to $99,999 | 36 (22.8%) | 25 (7.5%) |
| $100,000 to $149,999 | 13 (8.2%) | 79 (23.8%) |
| $150,000 or more | 45 (28.5%) | 119 (35.8%) |
| Total | 158 (100.0%) | 332 (100.0%) |
Property Value to Household Income Ratio in Northlakes
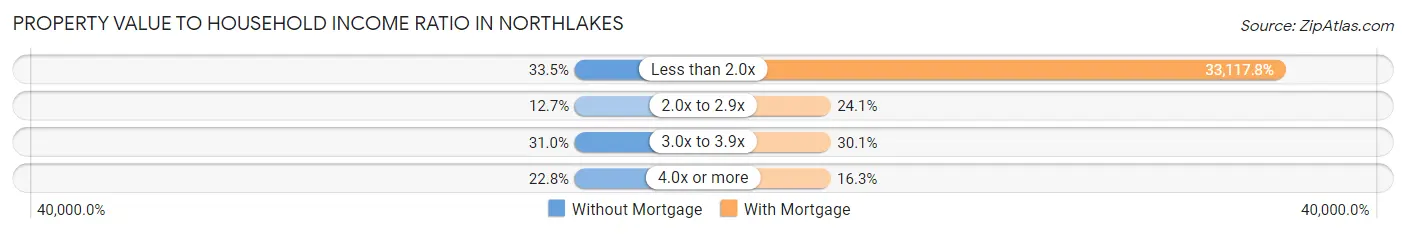
| Value-to-Income Ratio | Without Mortgage | With Mortgage |
| Less than 2.0x | 53 (33.5%) | 109,951 (33,117.8%) |
| 2.0x to 2.9x | 20 (12.7%) | 80 (24.1%) |
| 3.0x to 3.9x | 49 (31.0%) | 100 (30.1%) |
| 4.0x or more | 36 (22.8%) | 54 (16.3%) |
| Total | 158 (100.0%) | 332 (100.0%) |
Real Estate Taxes by Mortgage Status in Northlakes
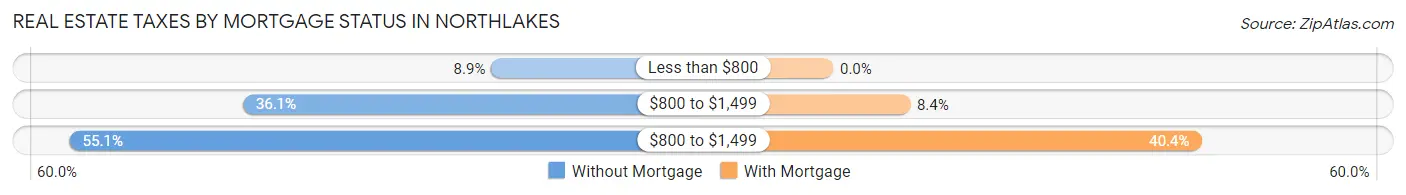
| Property Taxes | Without Mortgage | With Mortgage |
| Less than $800 | 14 (8.9%) | 0 (0.0%) |
| $800 to $1,499 | 57 (36.1%) | 28 (8.4%) |
| $800 to $1,499 | 87 (55.1%) | 134 (40.4%) |
| Total | 158 (100.0%) | 332 (100.0%) |
Health & Disability in Northlakes
Health Insurance Coverage by Age in Northlakes
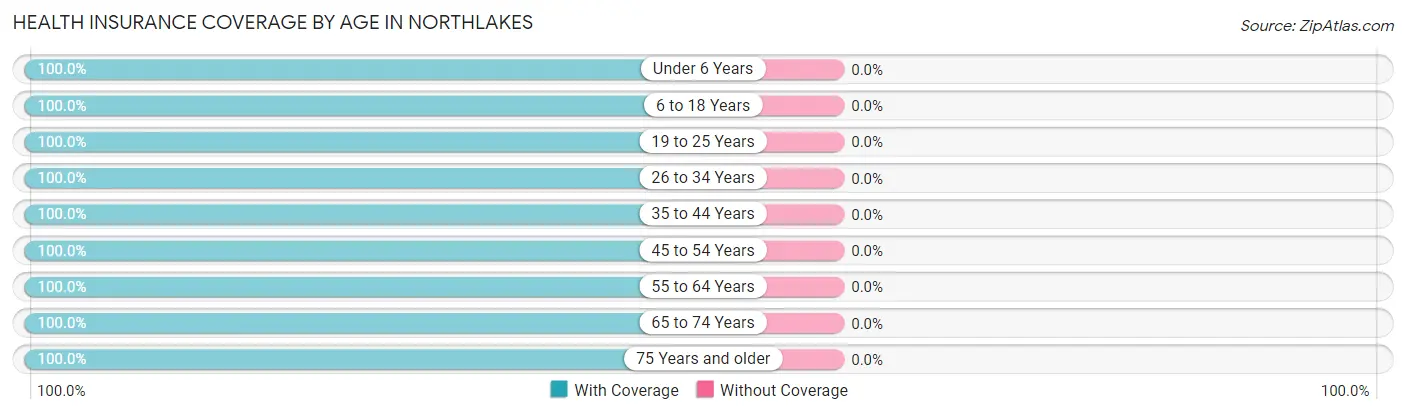
| Age Bracket | With Coverage | Without Coverage |
| Under 6 Years | 49 (100.0%) | 0 (0.0%) |
| 6 to 18 Years | 275 (100.0%) | 0 (0.0%) |
| 19 to 25 Years | 36 (100.0%) | 0 (0.0%) |
| 26 to 34 Years | 166 (100.0%) | 0 (0.0%) |
| 35 to 44 Years | 105 (100.0%) | 0 (0.0%) |
| 45 to 54 Years | 195 (100.0%) | 0 (0.0%) |
| 55 to 64 Years | 231 (100.0%) | 0 (0.0%) |
| 65 to 74 Years | 250 (100.0%) | 0 (0.0%) |
| 75 Years and older | 71 (100.0%) | 0 (0.0%) |
| Total | 1,378 (100.0%) | 0 (0.0%) |
Health Insurance Coverage by Citizenship Status in Northlakes
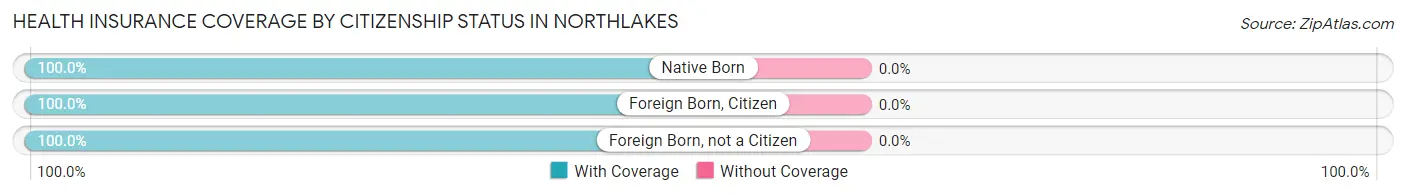
| Citizenship Status | With Coverage | Without Coverage |
| Native Born | 49 (100.0%) | 0 (0.0%) |
| Foreign Born, Citizen | 275 (100.0%) | 0 (0.0%) |
| Foreign Born, not a Citizen | 36 (100.0%) | 0 (0.0%) |
Health Insurance Coverage by Household Income in Northlakes
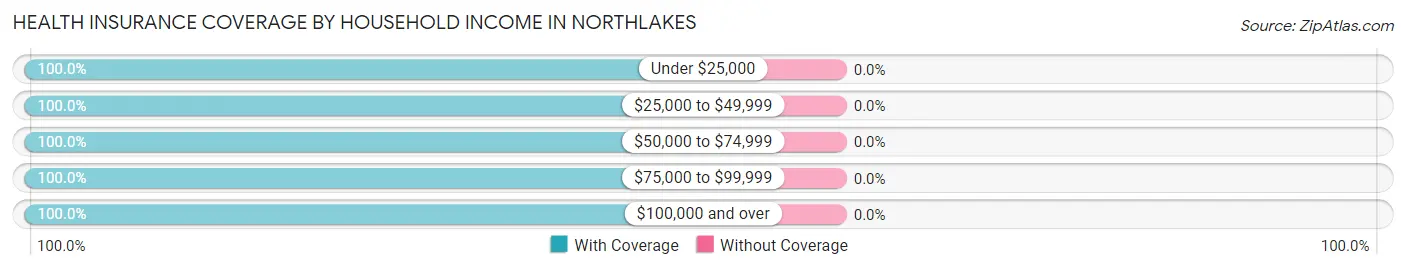
| Household Income | With Coverage | Without Coverage |
| Under $25,000 | 12 (100.0%) | 0 (0.0%) |
| $25,000 to $49,999 | 34 (100.0%) | 0 (0.0%) |
| $50,000 to $74,999 | 159 (100.0%) | 0 (0.0%) |
| $75,000 to $99,999 | 468 (100.0%) | 0 (0.0%) |
| $100,000 and over | 705 (100.0%) | 0 (0.0%) |
Public vs Private Health Insurance Coverage by Age in Northlakes
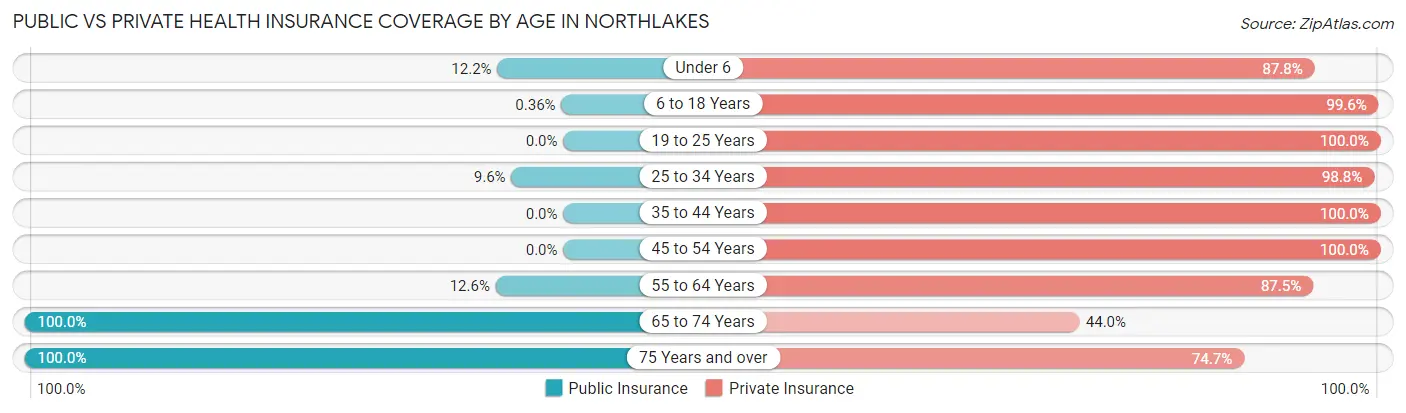
| Age Bracket | Public Insurance | Private Insurance |
| Under 6 | 6 (12.2%) | 43 (87.8%) |
| 6 to 18 Years | 1 (0.4%) | 274 (99.6%) |
| 19 to 25 Years | 0 (0.0%) | 36 (100.0%) |
| 25 to 34 Years | 16 (9.6%) | 164 (98.8%) |
| 35 to 44 Years | 0 (0.0%) | 105 (100.0%) |
| 45 to 54 Years | 0 (0.0%) | 195 (100.0%) |
| 55 to 64 Years | 29 (12.6%) | 202 (87.5%) |
| 65 to 74 Years | 250 (100.0%) | 110 (44.0%) |
| 75 Years and over | 71 (100.0%) | 53 (74.7%) |
| Total | 373 (27.1%) | 1,182 (85.8%) |
Disability Status by Sex by Age in Northlakes
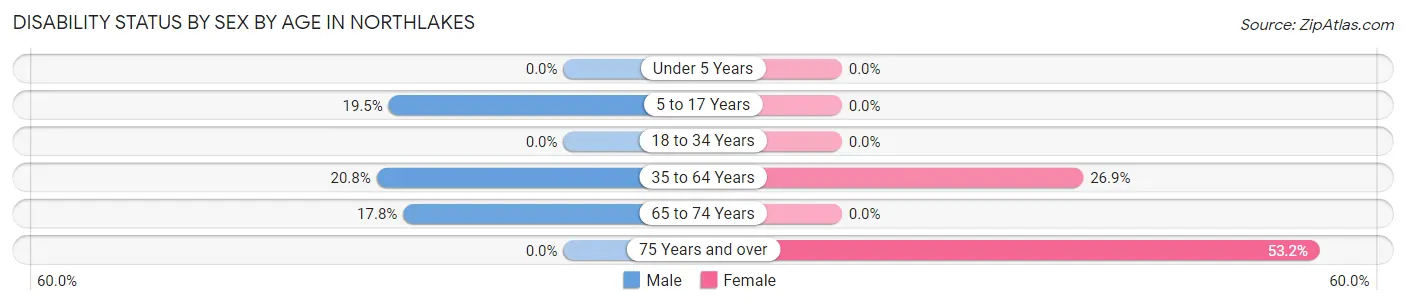
| Age Bracket | Male | Female |
| Under 5 Years | 0 (0.0%) | 0 (0.0%) |
| 5 to 17 Years | 37 (19.5%) | 0 (0.0%) |
| 18 to 34 Years | 0 (0.0%) | 0 (0.0%) |
| 35 to 64 Years | 47 (20.8%) | 82 (26.9%) |
| 65 to 74 Years | 33 (17.8%) | 0 (0.0%) |
| 75 Years and over | 0 (0.0%) | 33 (53.2%) |
Disability Class by Sex by Age in Northlakes
Disability Class: Hearing Difficulty
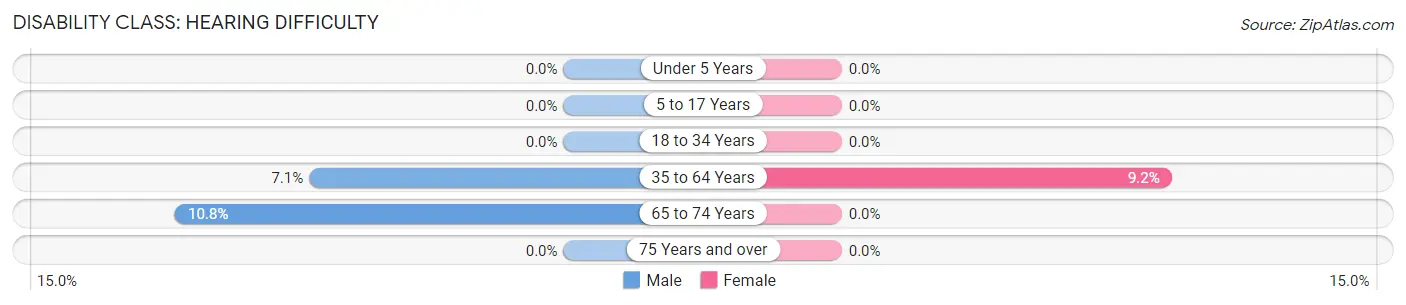
| Age Bracket | Male | Female |
| Under 5 Years | 0 (0.0%) | 0 (0.0%) |
| 5 to 17 Years | 0 (0.0%) | 0 (0.0%) |
| 18 to 34 Years | 0 (0.0%) | 0 (0.0%) |
| 35 to 64 Years | 16 (7.1%) | 28 (9.2%) |
| 65 to 74 Years | 20 (10.8%) | 0 (0.0%) |
| 75 Years and over | 0 (0.0%) | 0 (0.0%) |
Disability Class: Vision Difficulty
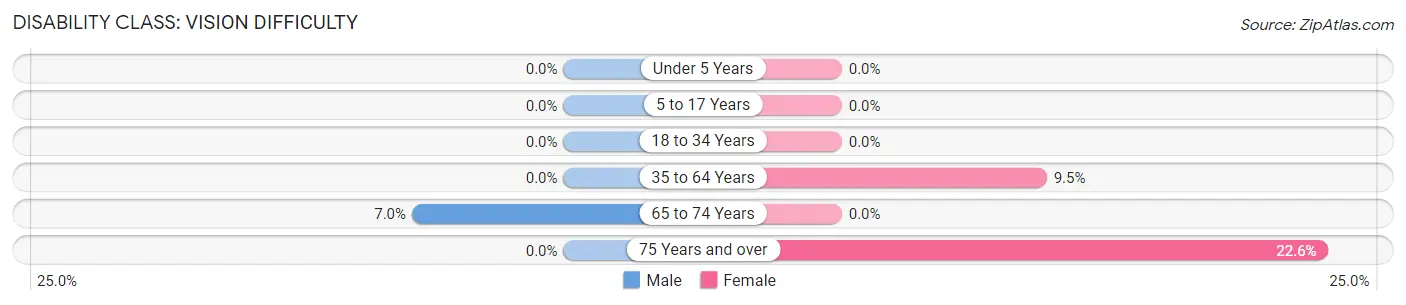
| Age Bracket | Male | Female |
| Under 5 Years | 0 (0.0%) | 0 (0.0%) |
| 5 to 17 Years | 0 (0.0%) | 0 (0.0%) |
| 18 to 34 Years | 0 (0.0%) | 0 (0.0%) |
| 35 to 64 Years | 0 (0.0%) | 29 (9.5%) |
| 65 to 74 Years | 13 (7.0%) | 0 (0.0%) |
| 75 Years and over | 0 (0.0%) | 14 (22.6%) |
Disability Class: Cognitive Difficulty
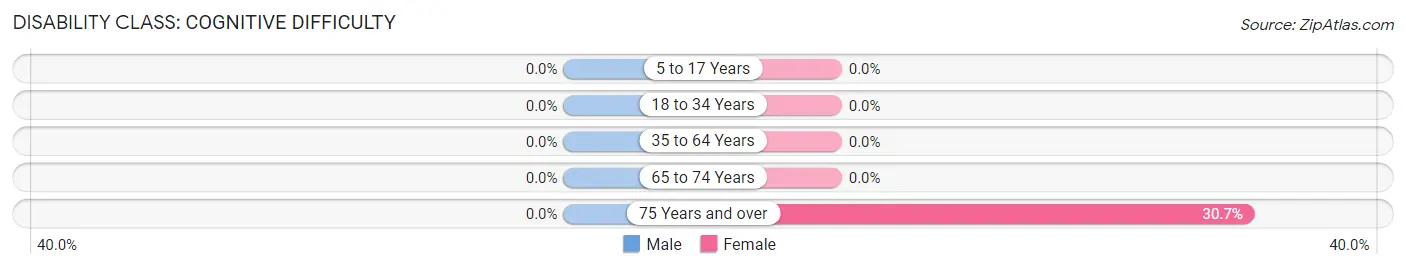
| Age Bracket | Male | Female |
| 5 to 17 Years | 0 (0.0%) | 0 (0.0%) |
| 18 to 34 Years | 0 (0.0%) | 0 (0.0%) |
| 35 to 64 Years | 0 (0.0%) | 0 (0.0%) |
| 65 to 74 Years | 0 (0.0%) | 0 (0.0%) |
| 75 Years and over | 0 (0.0%) | 19 (30.6%) |
Disability Class: Ambulatory Difficulty
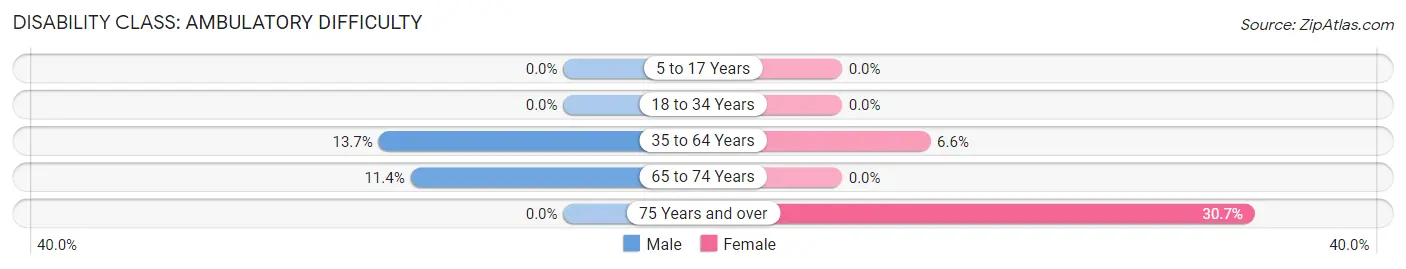
| Age Bracket | Male | Female |
| 5 to 17 Years | 0 (0.0%) | 0 (0.0%) |
| 18 to 34 Years | 0 (0.0%) | 0 (0.0%) |
| 35 to 64 Years | 31 (13.7%) | 20 (6.6%) |
| 65 to 74 Years | 21 (11.4%) | 0 (0.0%) |
| 75 Years and over | 0 (0.0%) | 19 (30.6%) |
Disability Class: Self-Care Difficulty
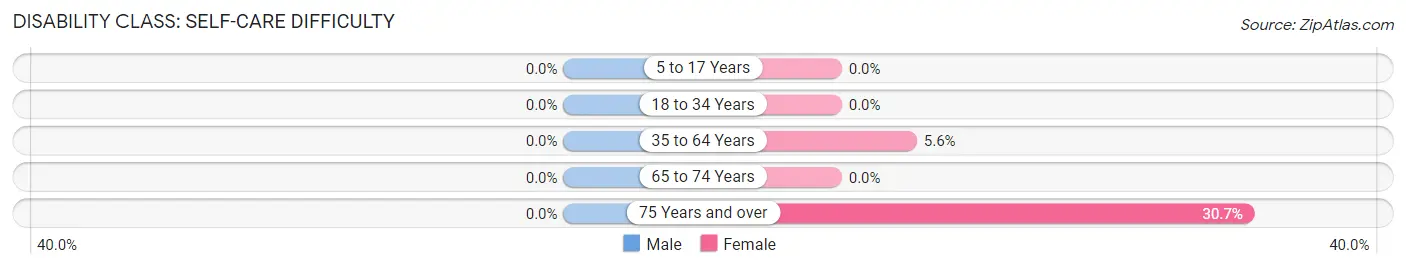
| Age Bracket | Male | Female |
| 5 to 17 Years | 0 (0.0%) | 0 (0.0%) |
| 18 to 34 Years | 0 (0.0%) | 0 (0.0%) |
| 35 to 64 Years | 0 (0.0%) | 17 (5.6%) |
| 65 to 74 Years | 0 (0.0%) | 0 (0.0%) |
| 75 Years and over | 0 (0.0%) | 19 (30.6%) |
Technology Access in Northlakes
Computing Device Access in Northlakes
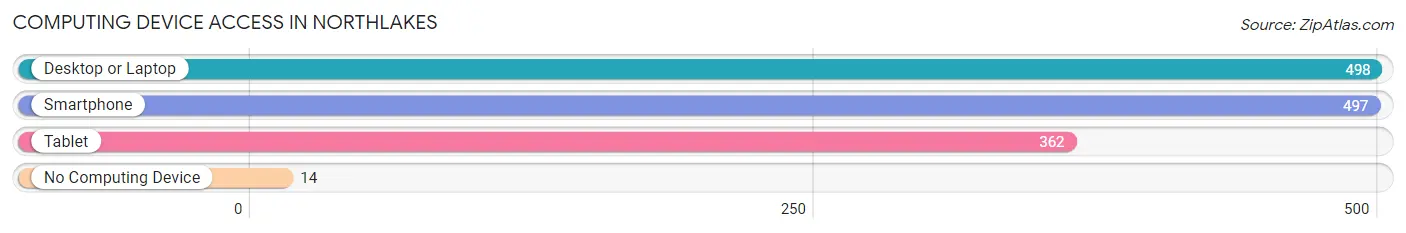
| Device Type | # Households | % Households |
| Desktop or Laptop | 498 | 91.9% |
| Smartphone | 497 | 91.7% |
| Tablet | 362 | 66.8% |
| No Computing Device | 14 | 2.6% |
| Total | 542 | 100.0% |
Internet Access in Northlakes
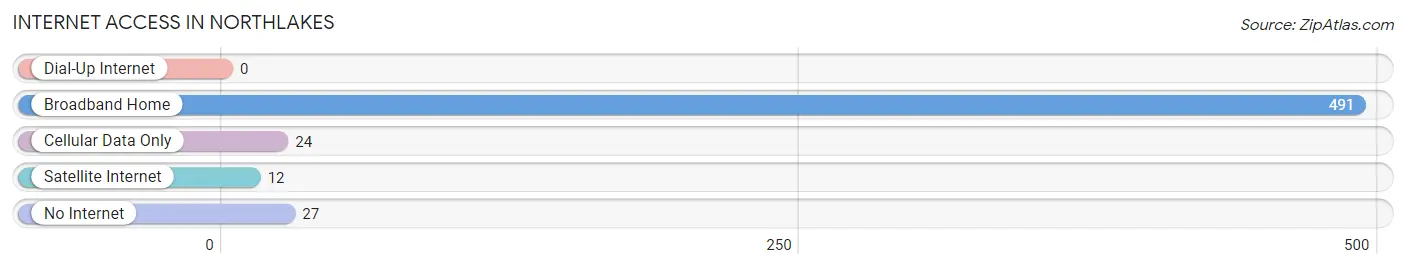
| Internet Type | # Households | % Households |
| Dial-Up Internet | 0 | 0.0% |
| Broadband Home | 491 | 90.6% |
| Cellular Data Only | 24 | 4.4% |
| Satellite Internet | 12 | 2.2% |
| No Internet | 27 | 5.0% |
| Total | 542 | 100.0% |
Northlakes Summary
Northlakes is a small town located in North Carolina, United States. It is situated in the foothills of the Blue Ridge Mountains, about 30 miles northwest of Charlotte. The town has a population of approximately 1,500 people and is part of the Hickory-Lenoir-Morganton Metropolitan Statistical Area.
History
Northlakes was founded in 1887 by a group of settlers from the nearby town of Lenoir. The town was originally known as “Lenoir’s Lake”, but the name was changed to Northlakes in 1895. The town was incorporated in 1901 and has remained a small, rural community ever since.
The town was originally a farming community, but in the early 20th century, the economy shifted to focus on the production of furniture. The furniture industry was the main source of employment for the town until the late 1970s, when the industry began to decline.
Geography
Northlakes is located in the foothills of the Blue Ridge Mountains, about 30 miles northwest of Charlotte. The town is situated in a valley, surrounded by rolling hills and forests. The Catawba River runs through the town, providing a source of water for the local population.
The climate in Northlakes is mild, with hot summers and cold winters. The average temperature in the summer is around 80 degrees Fahrenheit, while the average temperature in the winter is around 40 degrees Fahrenheit.
Economy
The economy of Northlakes is largely based on tourism and agriculture. The town is home to several tourist attractions, including the Hickory Motor Speedway, the Hickory Museum of Art, and the Catawba River.
Agriculture is also an important part of the local economy. The town is home to several farms, which produce a variety of crops, including corn, soybeans, and tobacco.
Demographics
As of the 2010 census, the population of Northlakes was 1,500. The racial makeup of the town was 95.2% White, 2.7% African American, 0.7% Native American, 0.3% Asian, and 0.2% from other races.
The median household income in Northlakes was $37,500, and the median family income was $45,000. The per capita income was $19,000. The town has a poverty rate of 17.3%.
Conclusion
Northlakes is a small town located in North Carolina, United States. It is situated in the foothills of the Blue Ridge Mountains, about 30 miles northwest of Charlotte. The town has a population of approximately 1,500 people and is part of the Hickory-Lenoir-Morganton Metropolitan Statistical Area. The economy of Northlakes is largely based on tourism and agriculture, and the town is home to several tourist attractions and farms. The racial makeup of the town is 95.2% White, 2.7% African American, 0.7% Native American, 0.3% Asian, and 0.2% from other races. The median household income in Northlakes was $37,500, and the median family income was $45,000. The per capita income was $19,000. The town has a poverty rate of 17.3%.
Common Questions
What is Per Capita Income in Northlakes?
Per Capita income in Northlakes is $50,218.
What is the Median Family Income in Northlakes?
Median Family Income in Northlakes is $108,505.
What is the Median Household income in Northlakes?
Median Household Income in Northlakes is $100,577.
What is Income or Wage Gap in Northlakes?
Income or Wage Gap in Northlakes is 29.0%.
Women in Northlakes earn 71.0 cents for every dollar earned by a man.
What is Inequality or Gini Index in Northlakes?
Inequality or Gini Index in Northlakes is 0.31.
What is the Total Population of Northlakes?
Total Population of Northlakes is 1,378.
What is the Total Male Population of Northlakes?
Total Male Population of Northlakes is 758.
What is the Total Female Population of Northlakes?
Total Female Population of Northlakes is 620.
What is the Ratio of Males per 100 Females in Northlakes?
There are 122.26 Males per 100 Females in Northlakes.
What is the Ratio of Females per 100 Males in Northlakes?
There are 81.79 Females per 100 Males in Northlakes.
What is the Median Population Age in Northlakes?
Median Population Age in Northlakes is 46.8 Years.
What is the Average Family Size in Northlakes
Average Family Size in Northlakes is 3.0 People.
What is the Average Household Size in Northlakes
Average Household Size in Northlakes is 2.5 People.
How Large is the Labor Force in Northlakes?
There are 767 People in the Labor Forcein in Northlakes.
What is the Percentage of People in the Labor Force in Northlakes?
69.6% of People are in the Labor Force in Northlakes.
What is the Unemployment Rate in Northlakes?
Unemployment Rate in Northlakes is 3.1%.