Nicholson, MS Map & Demographics
Nicholson Map
Nicholson Overview
$24,512
PER CAPITA INCOME
$48,772
AVG FAMILY INCOME
$42,738
AVG HOUSEHOLD INCOME
15.7%
WAGE / INCOME GAP [ % ]
84.3¢/ $1
WAGE / INCOME GAP [ $ ]
0.40
INEQUALITY / GINI INDEX
2,229
TOTAL POPULATION
1,164
MALE POPULATION
1,065
FEMALE POPULATION
109.30
MALES / 100 FEMALES
91.49
FEMALES / 100 MALES
48.0
MEDIAN AGE
2.6
AVG FAMILY SIZE
2.1
AVG HOUSEHOLD SIZE
1,178
LABOR FORCE [ PEOPLE ]
61.7%
PERCENT IN LABOR FORCE
3.2%
UNEMPLOYMENT RATE
Nicholson Area Codes
Income in Nicholson
Income Overview in Nicholson
Per Capita Income in Nicholson is $24,512, while median incomes of families and households are $48,772 and $42,738 respectively.
| Characteristic | Number | Measure |
| Per Capita Income | 2,229 | $24,512 |
| Median Family Income | 641 | $48,772 |
| Mean Family Income | 641 | $60,625 |
| Median Household Income | 1,072 | $42,738 |
| Mean Household Income | 1,072 | $50,201 |
| Income Deficit | 641 | $0 |
| Wage / Income Gap (%) | 2,229 | 15.72% |
| Wage / Income Gap ($) | 2,229 | 84.28¢ per $1 |
| Gini / Inequality Index | 2,229 | 0.40 |
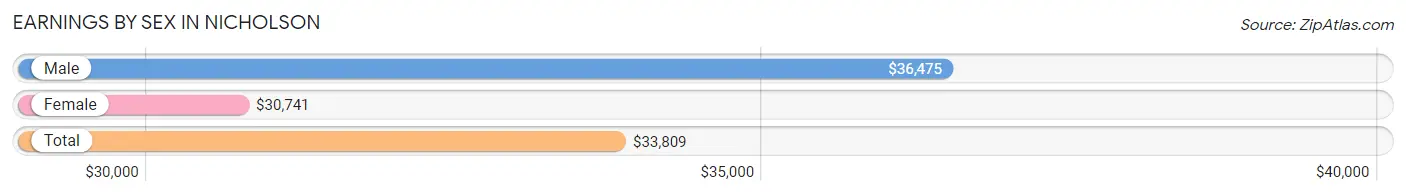
Earnings by Sex in Nicholson
Average Earnings in Nicholson are $33,809, $36,475 for men and $30,741 for women, a difference of 15.7%.
| Sex | Number | Average Earnings |
| Male | 719 (62.0%) | $36,475 |
| Female | 440 (38.0%) | $30,741 |
| Total | 1,159 (100.0%) | $33,809 |
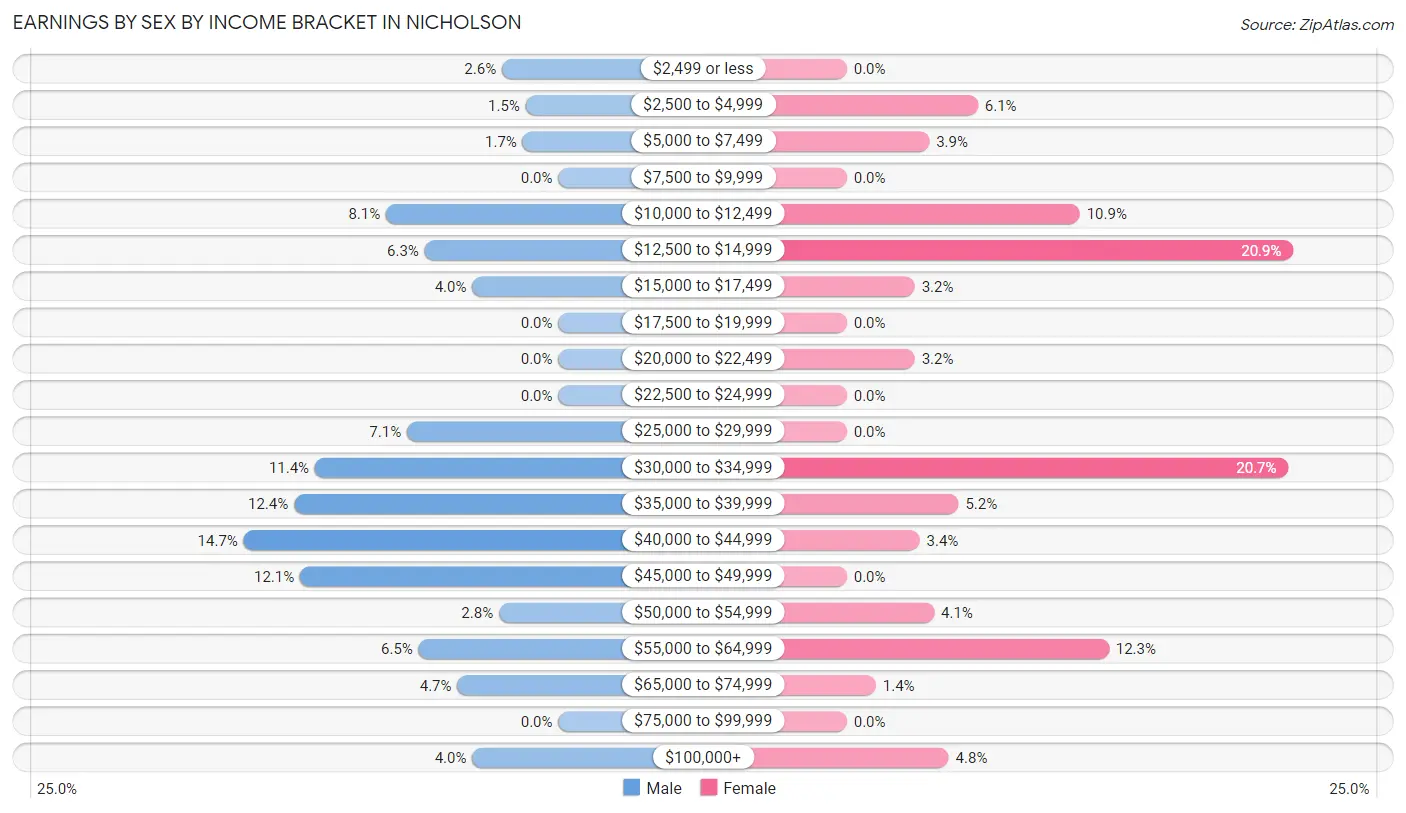
Earnings by Sex by Income Bracket in Nicholson
The most common earnings brackets in Nicholson are $40,000 to $44,999 for men (106 | 14.7%) and $12,500 to $14,999 for women (92 | 20.9%).
| Income | Male | Female |
| $2,499 or less | 19 (2.6%) | 0 (0.0%) |
| $2,500 to $4,999 | 11 (1.5%) | 27 (6.1%) |
| $5,000 to $7,499 | 12 (1.7%) | 17 (3.9%) |
| $7,500 to $9,999 | 0 (0.0%) | 0 (0.0%) |
| $10,000 to $12,499 | 58 (8.1%) | 48 (10.9%) |
| $12,500 to $14,999 | 45 (6.3%) | 92 (20.9%) |
| $15,000 to $17,499 | 29 (4.0%) | 14 (3.2%) |
| $17,500 to $19,999 | 0 (0.0%) | 0 (0.0%) |
| $20,000 to $22,499 | 0 (0.0%) | 14 (3.2%) |
| $22,500 to $24,999 | 0 (0.0%) | 0 (0.0%) |
| $25,000 to $29,999 | 51 (7.1%) | 0 (0.0%) |
| $30,000 to $34,999 | 82 (11.4%) | 91 (20.7%) |
| $35,000 to $39,999 | 89 (12.4%) | 23 (5.2%) |
| $40,000 to $44,999 | 106 (14.7%) | 15 (3.4%) |
| $45,000 to $49,999 | 87 (12.1%) | 0 (0.0%) |
| $50,000 to $54,999 | 20 (2.8%) | 18 (4.1%) |
| $55,000 to $64,999 | 47 (6.5%) | 54 (12.3%) |
| $65,000 to $74,999 | 34 (4.7%) | 6 (1.4%) |
| $75,000 to $99,999 | 0 (0.0%) | 0 (0.0%) |
| $100,000+ | 29 (4.0%) | 21 (4.8%) |
| Total | 719 (100.0%) | 440 (100.0%) |
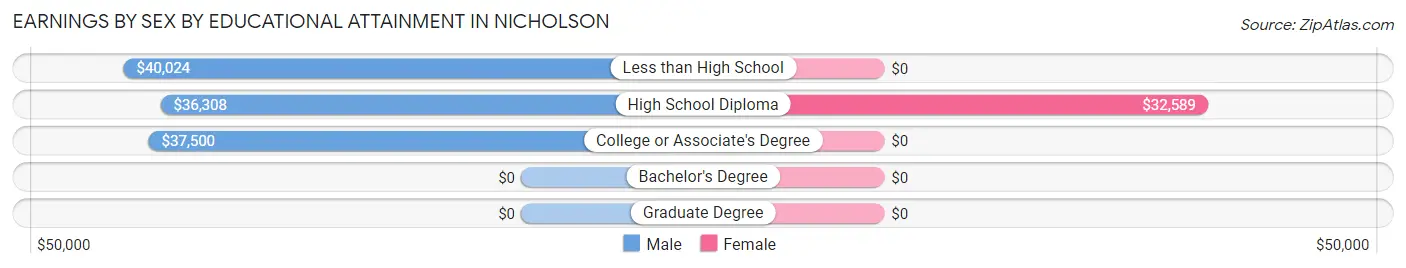
Earnings by Sex by Educational Attainment in Nicholson
Average earnings in Nicholson are $37,289 for men and $33,862 for women, a difference of 9.2%. Men with an educational attainment of less than high school enjoy the highest average annual earnings of $40,024, while those with high school diploma education earn the least with $36,308. Women with an educational attainment of high school diploma earn the most with the average annual earnings of $32,589, while those with high school diploma education have the smallest earnings of $32,589.
| Educational Attainment | Male Income | Female Income |
| Less than High School | $40,024 | $0 |
| High School Diploma | $36,308 | $32,589 |
| College or Associate's Degree | $37,500 | $0 |
| Bachelor's Degree | - | - |
| Graduate Degree | - | - |
| Total | $37,289 | $33,862 |
Family Income in Nicholson
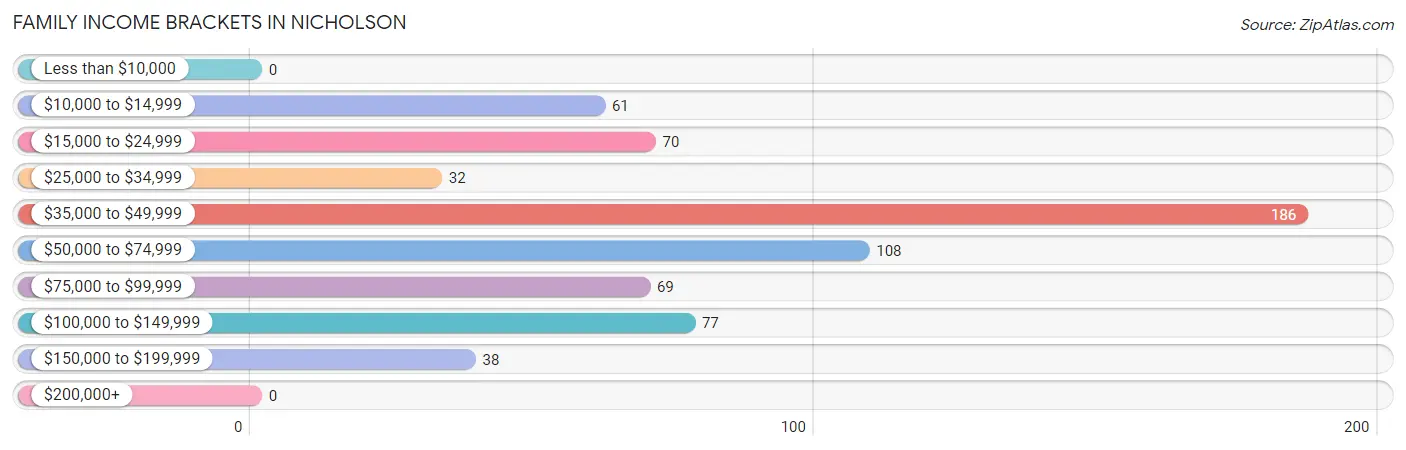
Family Income Brackets in Nicholson
According to the Nicholson family income data, there are 186 families falling into the $35,000 to $49,999 income range, which is the most common income bracket and makes up 29.0% of all families.
| Income Bracket | # Families | % Families |
| Less than $10,000 | 0 | 0.0% |
| $10,000 to $14,999 | 61 | 9.5% |
| $15,000 to $24,999 | 70 | 10.9% |
| $25,000 to $34,999 | 32 | 5.0% |
| $35,000 to $49,999 | 186 | 29.0% |
| $50,000 to $74,999 | 108 | 16.8% |
| $75,000 to $99,999 | 69 | 10.8% |
| $100,000 to $149,999 | 77 | 12.0% |
| $150,000 to $199,999 | 38 | 5.9% |
| $200,000+ | 0 | 0.0% |
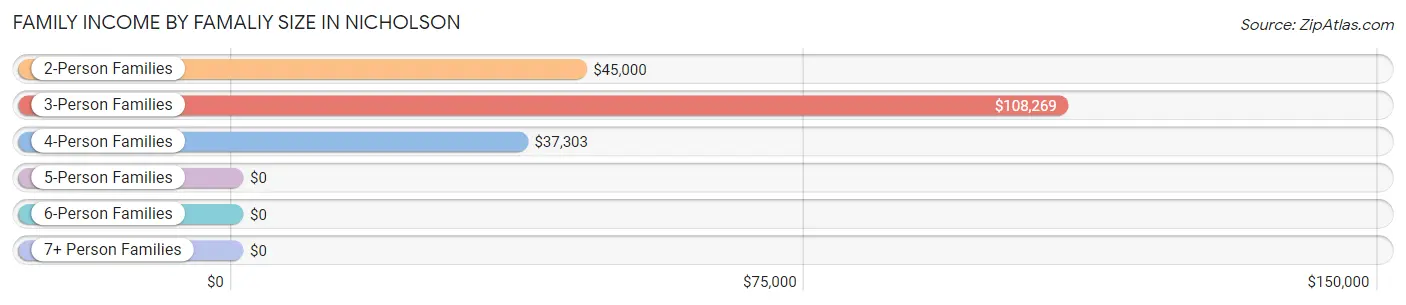
Family Income by Famaliy Size in Nicholson
3-person families (128 | 20.0%) account for the highest median family income in Nicholson with $108,269 per family, while 3-person families (128 | 20.0%) have the highest median income of $36,090 per family member.
| Income Bracket | # Families | Median Income |
| 2-Person Families | 418 (65.2%) | $45,000 |
| 3-Person Families | 128 (20.0%) | $108,269 |
| 4-Person Families | 86 (13.4%) | $37,303 |
| 5-Person Families | 9 (1.4%) | $0 |
| 6-Person Families | 0 (0.0%) | $0 |
| 7+ Person Families | 0 (0.0%) | $0 |
| Total | 641 (100.0%) | $48,772 |
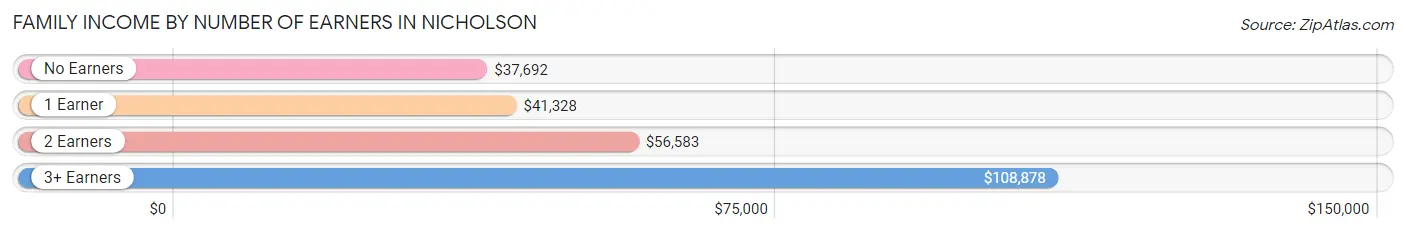
Family Income by Number of Earners in Nicholson
The median family income in Nicholson is $48,772, with families comprising 3+ earners (69) having the highest median family income of $108,878, while families with no earners (130) have the lowest median family income of $37,692, accounting for 10.8% and 20.3% of families, respectively.
| Number of Earners | # Families | Median Income |
| No Earners | 130 (20.3%) | $37,692 |
| 1 Earner | 293 (45.7%) | $41,328 |
| 2 Earners | 149 (23.2%) | $56,583 |
| 3+ Earners | 69 (10.8%) | $108,878 |
| Total | 641 (100.0%) | $48,772 |
Household Income in Nicholson
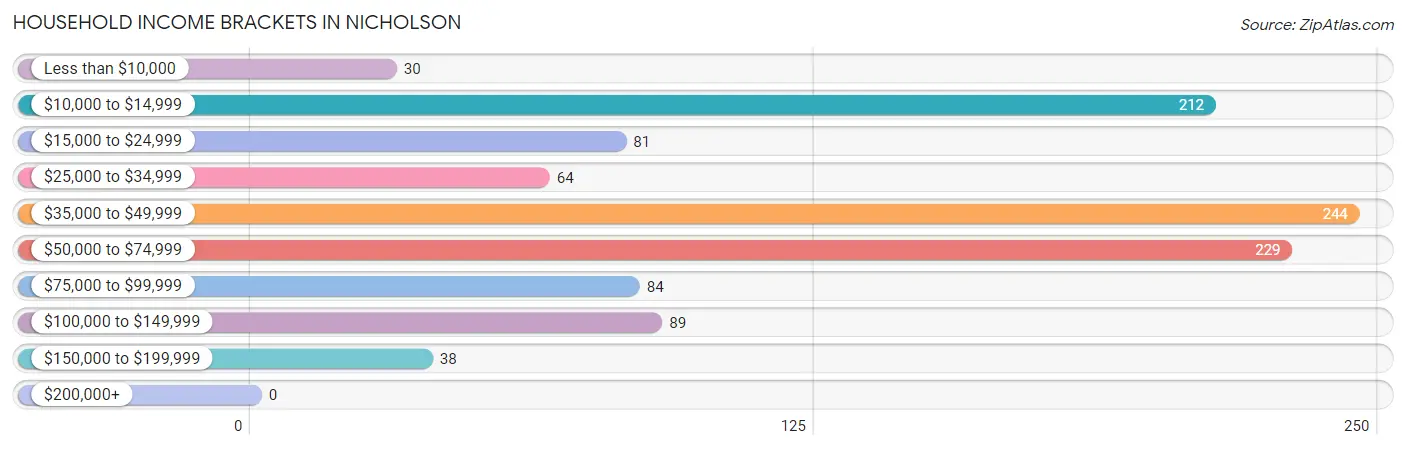
Household Income Brackets in Nicholson
With 244 households falling in the category, the $35,000 to $49,999 income range is the most frequent in Nicholson, accounting for 22.8% of all households.
| Income Bracket | # Households | % Households |
| Less than $10,000 | 30 | 2.8% |
| $10,000 to $14,999 | 212 | 19.8% |
| $15,000 to $24,999 | 81 | 7.6% |
| $25,000 to $34,999 | 64 | 6.0% |
| $35,000 to $49,999 | 244 | 22.8% |
| $50,000 to $74,999 | 229 | 21.4% |
| $75,000 to $99,999 | 84 | 7.8% |
| $100,000 to $149,999 | 89 | 8.3% |
| $150,000 to $199,999 | 38 | 3.5% |
| $200,000+ | 0 | 0.0% |
Household Income by Householder Age in Nicholson
The median household income in Nicholson is $42,738, with the highest median household income of $48,664 found in the 45 to 64 years age bracket for the primary householder. A total of 532 households (49.6%) fall into this category. Meanwhile, the 15 to 24 years age bracket for the primary householder has the lowest median household income of $0, with 31 households (2.9%) in this group.
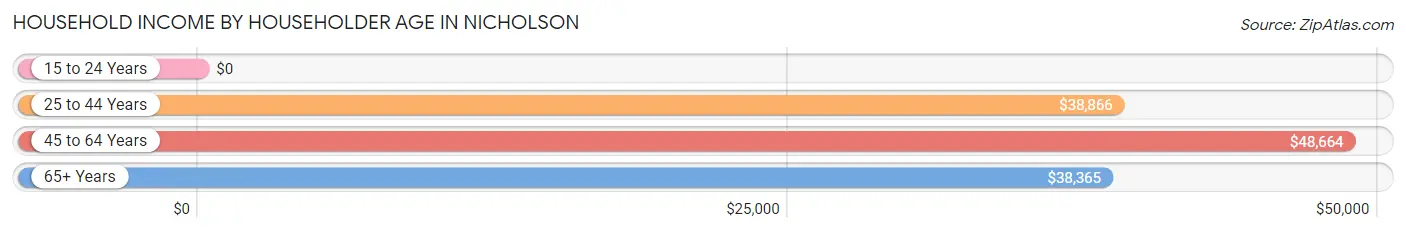
| Income Bracket | # Households | Median Income |
| 15 to 24 Years | 31 (2.9%) | $0 |
| 25 to 44 Years | 191 (17.8%) | $38,866 |
| 45 to 64 Years | 532 (49.6%) | $48,664 |
| 65+ Years | 318 (29.7%) | $38,365 |
| Total | 1,072 (100.0%) | $42,738 |
Poverty in Nicholson
Income Below Poverty by Sex and Age in Nicholson
With 15.9% poverty level for males and 17.2% for females among the residents of Nicholson, 6 to 11 year old males and 16 and 17 year old females are the most vulnerable to poverty, with 23 males (100.0%) and 12 females (100.0%) in their respective age groups living below the poverty level.
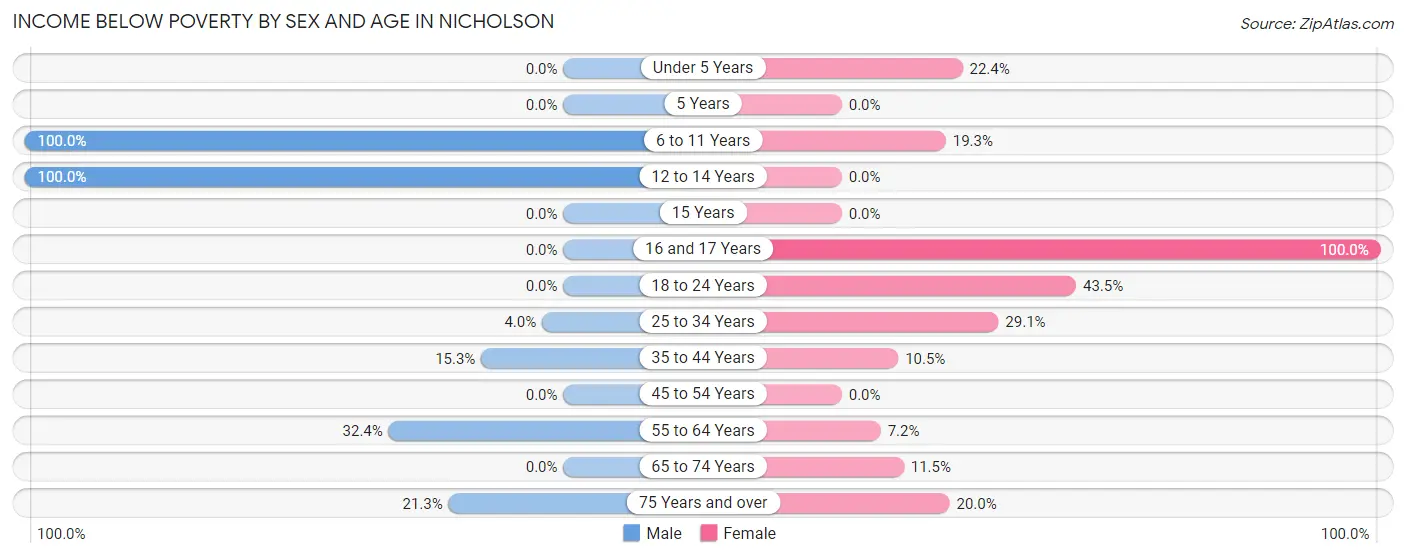
| Age Bracket | Male | Female |
| Under 5 Years | 0 (0.0%) | 13 (22.4%) |
| 5 Years | 0 (0.0%) | 0 (0.0%) |
| 6 to 11 Years | 23 (100.0%) | 22 (19.3%) |
| 12 to 14 Years | 13 (100.0%) | 0 (0.0%) |
| 15 Years | 0 (0.0%) | 0 (0.0%) |
| 16 and 17 Years | 0 (0.0%) | 12 (100.0%) |
| 18 to 24 Years | 0 (0.0%) | 50 (43.5%) |
| 25 to 34 Years | 10 (4.0%) | 25 (29.1%) |
| 35 to 44 Years | 18 (15.2%) | 9 (10.5%) |
| 45 to 54 Years | 0 (0.0%) | 0 (0.0%) |
| 55 to 64 Years | 108 (32.4%) | 14 (7.2%) |
| 65 to 74 Years | 0 (0.0%) | 16 (11.5%) |
| 75 Years and over | 13 (21.3%) | 22 (20.0%) |
| Total | 185 (15.9%) | 183 (17.2%) |
Income Above Poverty by Sex and Age in Nicholson
According to the poverty statistics in Nicholson, males aged under 5 years and females aged 45 to 54 years are the age groups that are most secure financially, with 100.0% of males and 100.0% of females in these age groups living above the poverty line.
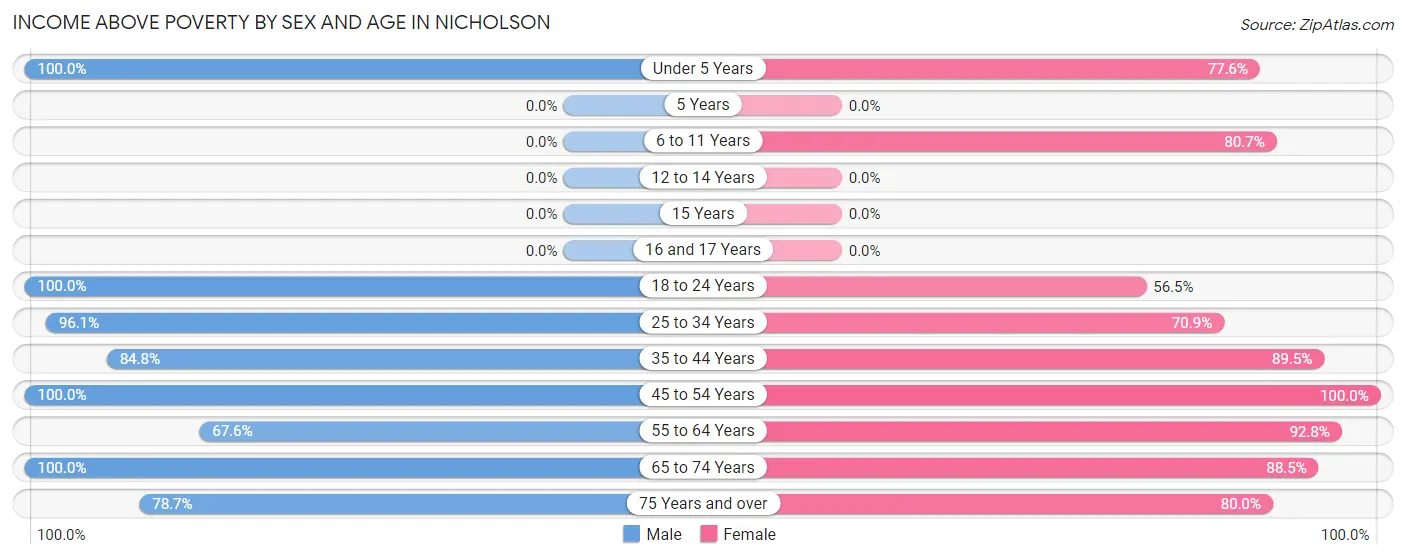
| Age Bracket | Male | Female |
| Under 5 Years | 111 (100.0%) | 45 (77.6%) |
| 5 Years | 0 (0.0%) | 0 (0.0%) |
| 6 to 11 Years | 0 (0.0%) | 92 (80.7%) |
| 12 to 14 Years | 0 (0.0%) | 0 (0.0%) |
| 15 Years | 0 (0.0%) | 0 (0.0%) |
| 16 and 17 Years | 0 (0.0%) | 0 (0.0%) |
| 18 to 24 Years | 58 (100.0%) | 65 (56.5%) |
| 25 to 34 Years | 243 (96.1%) | 61 (70.9%) |
| 35 to 44 Years | 100 (84.8%) | 77 (89.5%) |
| 45 to 54 Years | 96 (100.0%) | 151 (100.0%) |
| 55 to 64 Years | 225 (67.6%) | 180 (92.8%) |
| 65 to 74 Years | 98 (100.0%) | 123 (88.5%) |
| 75 Years and over | 48 (78.7%) | 88 (80.0%) |
| Total | 979 (84.1%) | 882 (82.8%) |
Income Below Poverty Among Married-Couple Families in Nicholson
The poverty statistics for married-couple families in Nicholson show that 4.7% or 22 of the total 471 families live below the poverty line. Families with 3 or 4 children have the highest poverty rate of 100.0%, comprising of 9 families. On the other hand, families with 1 or 2 children have the lowest poverty rate of 0.0%, which includes 0 families.
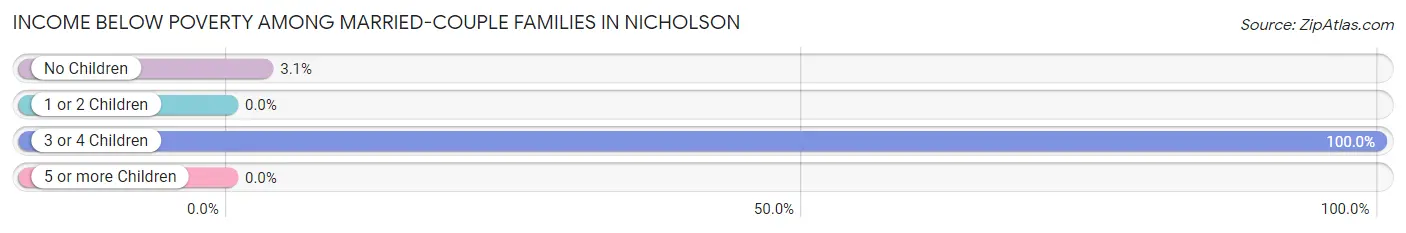
| Children | Above Poverty | Below Poverty |
| No Children | 411 (96.9%) | 13 (3.1%) |
| 1 or 2 Children | 38 (100.0%) | 0 (0.0%) |
| 3 or 4 Children | 0 (0.0%) | 9 (100.0%) |
| 5 or more Children | 0 (0.0%) | 0 (0.0%) |
| Total | 449 (95.3%) | 22 (4.7%) |
Income Below Poverty Among Single-Parent Households in Nicholson
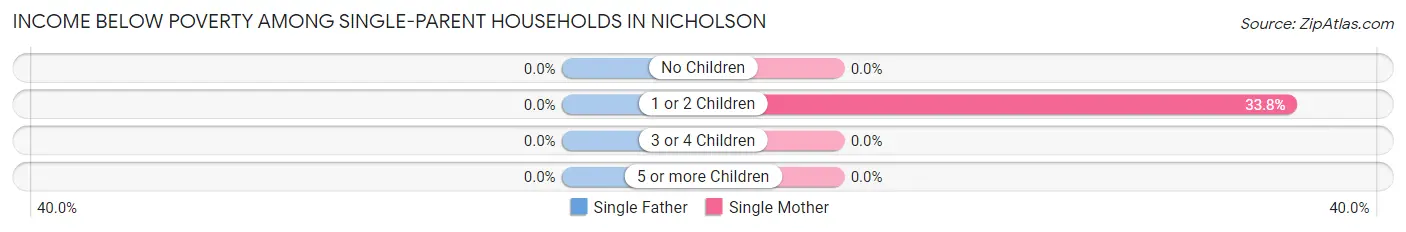
| Children | Single Father | Single Mother |
| No Children | 0 (0.0%) | 0 (0.0%) |
| 1 or 2 Children | 0 (0.0%) | 48 (33.8%) |
| 3 or 4 Children | 0 (0.0%) | 0 (0.0%) |
| 5 or more Children | 0 (0.0%) | 0 (0.0%) |
| Total | 0 (0.0%) | 48 (32.0%) |
Income Below Poverty Among Married-Couple vs Single-Parent Households in Nicholson
The poverty data for Nicholson shows that 22 of the married-couple family households (4.7%) and 48 of the single-parent households (28.2%) are living below the poverty level. Within the married-couple family households, those with 3 or 4 children have the highest poverty rate, with 9 households (100.0%) falling below the poverty line. Among the single-parent households, those with 1 or 2 children have the highest poverty rate, with 48 household (33.8%) living below poverty.
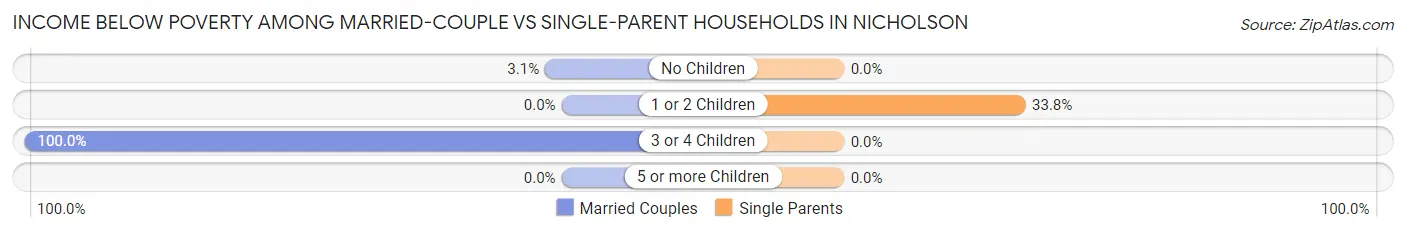
| Children | Married-Couple Families | Single-Parent Households |
| No Children | 13 (3.1%) | 0 (0.0%) |
| 1 or 2 Children | 0 (0.0%) | 48 (33.8%) |
| 3 or 4 Children | 9 (100.0%) | 0 (0.0%) |
| 5 or more Children | 0 (0.0%) | 0 (0.0%) |
| Total | 22 (4.7%) | 48 (28.2%) |
Race in Nicholson
The most populous races in Nicholson are White / Caucasian (1,695 | 76.0%), Black / African American (277 | 12.4%), and Hispanic or Latino (168 | 7.5%).
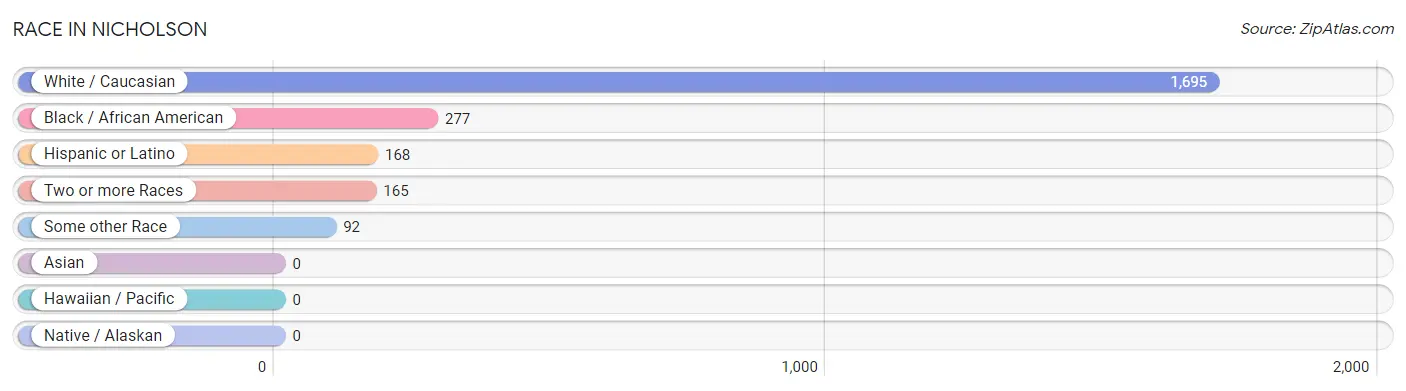
| Race | # Population | % Population |
| Asian | 0 | 0.0% |
| Black / African American | 277 | 12.4% |
| Hawaiian / Pacific | 0 | 0.0% |
| Hispanic or Latino | 168 | 7.5% |
| Native / Alaskan | 0 | 0.0% |
| White / Caucasian | 1,695 | 76.0% |
| Two or more Races | 165 | 7.4% |
| Some other Race | 92 | 4.1% |
| Total | 2,229 | 100.0% |
Ancestry in Nicholson
The most populous ancestries reported in Nicholson are English (306 | 13.7%), French (220 | 9.9%), German (142 | 6.4%), Central American (138 | 6.2%), and Italian (136 | 6.1%), together accounting for 42.3% of all Nicholson residents.
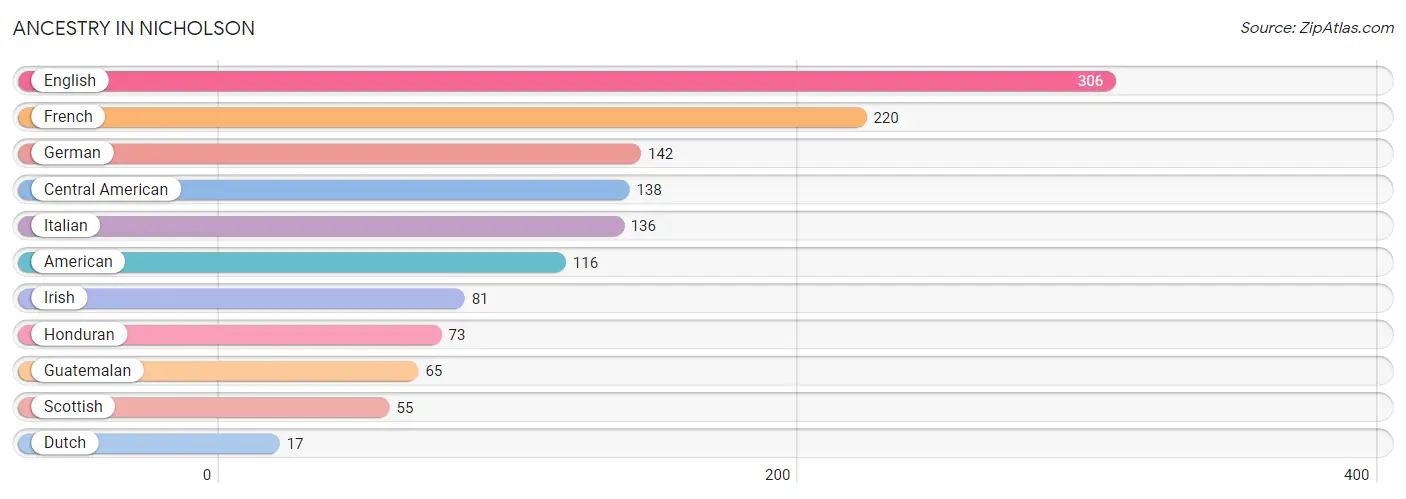
| Ancestry | # Population | % Population |
| American | 116 | 5.2% |
| Central American | 138 | 6.2% |
| Dutch | 17 | 0.8% |
| English | 306 | 13.7% |
| French | 220 | 9.9% |
| German | 142 | 6.4% |
| Guatemalan | 65 | 2.9% |
| Honduran | 73 | 3.3% |
| Irish | 81 | 3.6% |
| Italian | 136 | 6.1% |
| Scottish | 55 | 2.5% | View All 11 Rows |
Immigrants in Nicholson
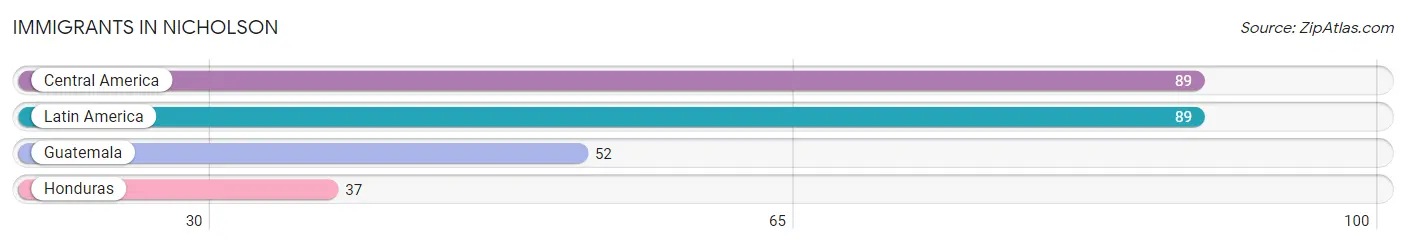
The most numerous immigrant groups reported in Nicholson came from Central America (89 | 4.0%), Latin America (89 | 4.0%), Guatemala (52 | 2.3%), and Honduras (37 | 1.7%), together accounting for 12.0% of all Nicholson residents.
| Immigration Origin | # Population | % Population |
| Central America | 89 | 4.0% |
| Guatemala | 52 | 2.3% |
| Honduras | 37 | 1.7% |
| Latin America | 89 | 4.0% | View All 4 Rows |
Sex and Age in Nicholson
Sex and Age in Nicholson
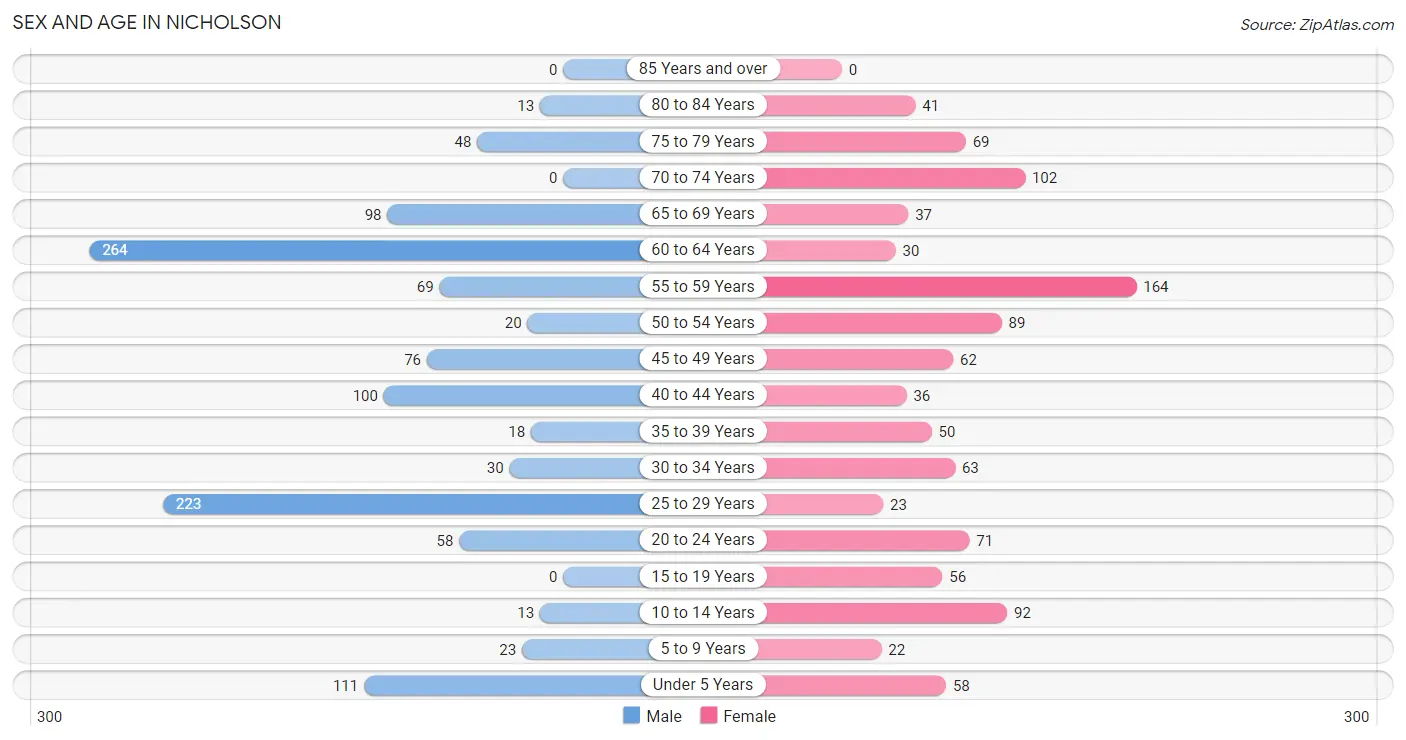
The most populous age groups in Nicholson are 60 to 64 Years (264 | 22.7%) for men and 55 to 59 Years (164 | 15.4%) for women.
| Age Bracket | Male | Female |
| Under 5 Years | 111 (9.5%) | 58 (5.4%) |
| 5 to 9 Years | 23 (2.0%) | 22 (2.1%) |
| 10 to 14 Years | 13 (1.1%) | 92 (8.6%) |
| 15 to 19 Years | 0 (0.0%) | 56 (5.3%) |
| 20 to 24 Years | 58 (5.0%) | 71 (6.7%) |
| 25 to 29 Years | 223 (19.2%) | 23 (2.2%) |
| 30 to 34 Years | 30 (2.6%) | 63 (5.9%) |
| 35 to 39 Years | 18 (1.5%) | 50 (4.7%) |
| 40 to 44 Years | 100 (8.6%) | 36 (3.4%) |
| 45 to 49 Years | 76 (6.5%) | 62 (5.8%) |
| 50 to 54 Years | 20 (1.7%) | 89 (8.4%) |
| 55 to 59 Years | 69 (5.9%) | 164 (15.4%) |
| 60 to 64 Years | 264 (22.7%) | 30 (2.8%) |
| 65 to 69 Years | 98 (8.4%) | 37 (3.5%) |
| 70 to 74 Years | 0 (0.0%) | 102 (9.6%) |
| 75 to 79 Years | 48 (4.1%) | 69 (6.5%) |
| 80 to 84 Years | 13 (1.1%) | 41 (3.8%) |
| 85 Years and over | 0 (0.0%) | 0 (0.0%) |
| Total | 1,164 (100.0%) | 1,065 (100.0%) |
Families and Households in Nicholson
Median Family Size in Nicholson
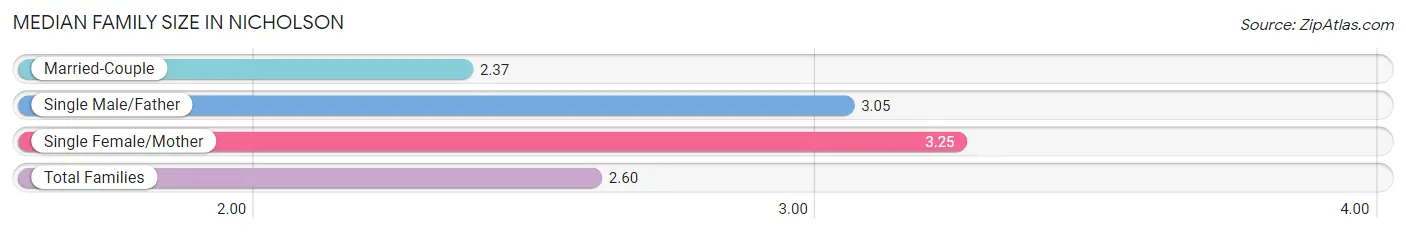
The median family size in Nicholson is 2.60 persons per family, with single female/mother families (150 | 23.4%) accounting for the largest median family size of 3.25 persons per family. On the other hand, married-couple families (471 | 73.5%) represent the smallest median family size with 2.37 persons per family.
| Family Type | # Families | Family Size |
| Married-Couple | 471 (73.5%) | 2.37 |
| Single Male/Father | 20 (3.1%) | 3.05 |
| Single Female/Mother | 150 (23.4%) | 3.25 |
| Total Families | 641 (100.0%) | 2.60 |
Median Household Size in Nicholson
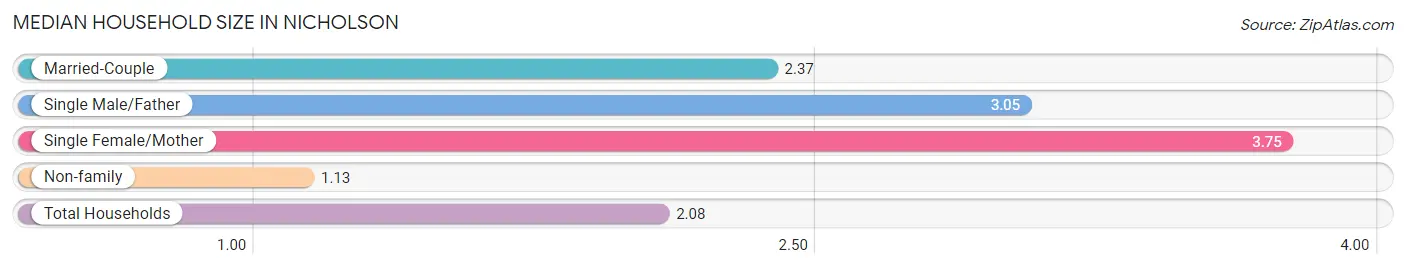
The median household size in Nicholson is 2.08 persons per household, with single female/mother households (150 | 14.0%) accounting for the largest median household size of 3.75 persons per household. non-family households (431 | 40.2%) represent the smallest median household size with 1.13 persons per household.
| Household Type | # Households | Household Size |
| Married-Couple | 471 (43.9%) | 2.37 |
| Single Male/Father | 20 (1.9%) | 3.05 |
| Single Female/Mother | 150 (14.0%) | 3.75 |
| Non-family | 431 (40.2%) | 1.13 |
| Total Households | 1,072 (100.0%) | 2.08 |
Household Size by Marriage Status in Nicholson
Out of a total of 1,072 households in Nicholson, 641 (59.8%) are family households, while 431 (40.2%) are nonfamily households. The most numerous type of family households are 2-person households, comprising 403, and the most common type of nonfamily households are 1-person households, comprising 361.
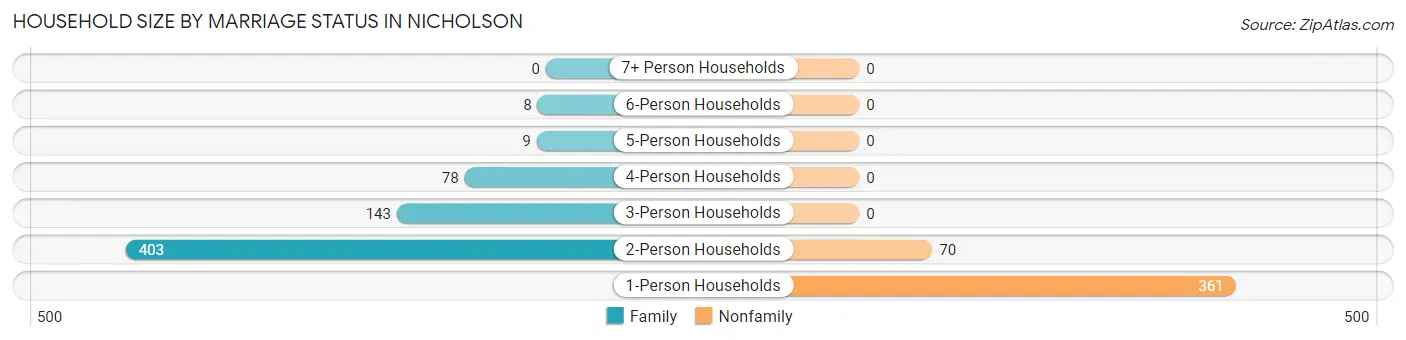
| Household Size | Family Households | Nonfamily Households |
| 1-Person Households | - | 361 (33.7%) |
| 2-Person Households | 403 (37.6%) | 70 (6.5%) |
| 3-Person Households | 143 (13.3%) | 0 (0.0%) |
| 4-Person Households | 78 (7.3%) | 0 (0.0%) |
| 5-Person Households | 9 (0.8%) | 0 (0.0%) |
| 6-Person Households | 8 (0.7%) | 0 (0.0%) |
| 7+ Person Households | 0 (0.0%) | 0 (0.0%) |
| Total | 641 (59.8%) | 431 (40.2%) |
Female Fertility in Nicholson
Fertility by Age in Nicholson
Average fertility rate in Nicholson is 45.0 births per 1,000 women. Women in the age bracket of 35 to 50 years have the highest fertility rate with 56.0 births per 1,000 women. Women in the age bracket of 35 to 50 years acount for 52.9% of all women with births.
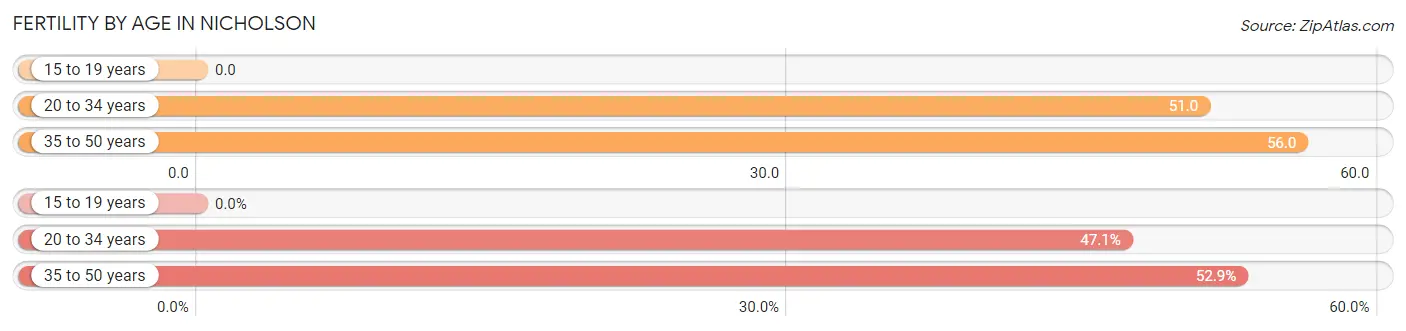
| Age Bracket | Women with Births | Births / 1,000 Women |
| 15 to 19 years | 0 (0.0%) | 0.0 |
| 20 to 34 years | 8 (47.1%) | 51.0 |
| 35 to 50 years | 9 (52.9%) | 56.0 |
| Total | 17 (100.0%) | 45.0 |
Fertility by Age by Marriage Status in Nicholson
52.9% of women with births (17) in Nicholson are married. The highest percentage of unmarried women with births falls into 20 to 34 years age bracket with 100.0% of them unmarried at the time of birth, while the lowest percentage of unmarried women with births belong to 35 to 50 years age bracket with 0.0% of them unmarried.
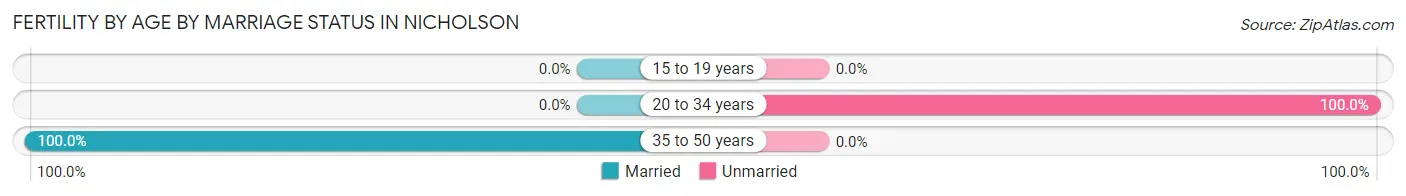
| Age Bracket | Married | Unmarried |
| 15 to 19 years | 0 (0.0%) | 0 (0.0%) |
| 20 to 34 years | 0 (0.0%) | 8 (100.0%) |
| 35 to 50 years | 9 (100.0%) | 0 (0.0%) |
| Total | 9 (52.9%) | 8 (47.1%) |
Fertility by Education in Nicholson
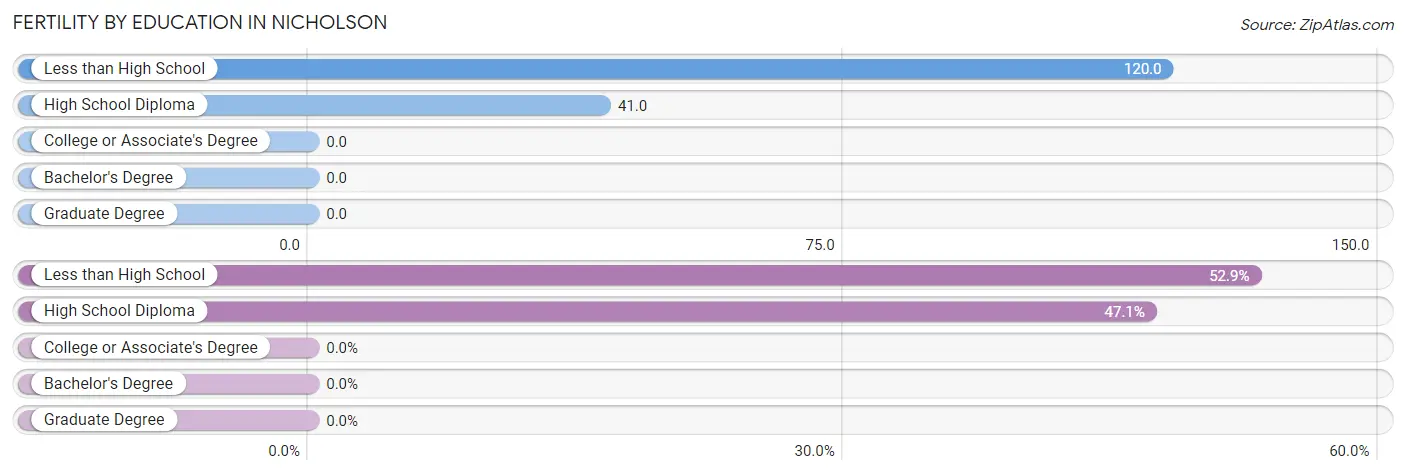
| Educational Attainment | Women with Births | Births / 1,000 Women |
| Less than High School | 9 (52.9%) | 120.0 |
| High School Diploma | 8 (47.1%) | 41.0 |
| College or Associate's Degree | 0 (0.0%) | 0.0 |
| Bachelor's Degree | 0 (0.0%) | 0.0 |
| Graduate Degree | 0 (0.0%) | 0.0 |
| Total | 17 (100.0%) | 45.0 |
Fertility by Education by Marriage Status in Nicholson
47.1% of women with births in Nicholson are unmarried. Women with the educational attainment of less than high school are most likely to be married with 100.0% of them married at childbirth, while women with the educational attainment of high school diploma are least likely to be married with 100.0% of them unmarried at childbirth.
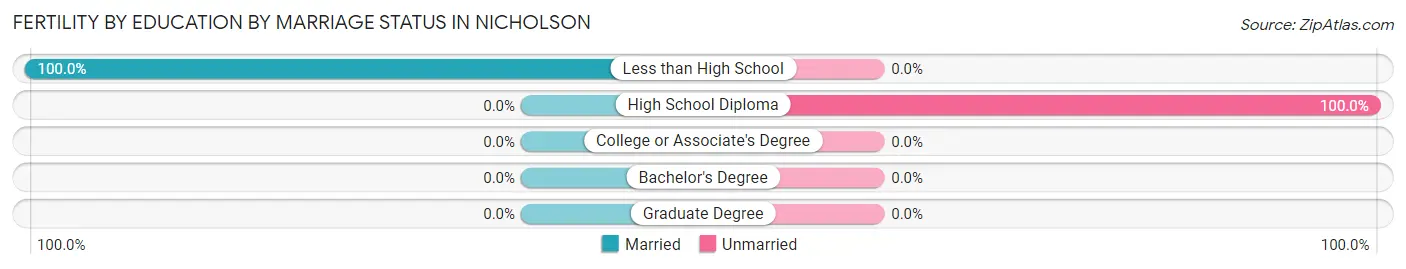
| Educational Attainment | Married | Unmarried |
| Less than High School | 9 (100.0%) | 0 (0.0%) |
| High School Diploma | 0 (0.0%) | 8 (100.0%) |
| College or Associate's Degree | 0 (0.0%) | 0 (0.0%) |
| Bachelor's Degree | 0 (0.0%) | 0 (0.0%) |
| Graduate Degree | 0 (0.0%) | 0 (0.0%) |
| Total | 9 (52.9%) | 8 (47.1%) |
Employment Characteristics in Nicholson
Employment by Class of Employer in Nicholson
Among the 1,141 employed individuals in Nicholson, private company employees (767 | 67.2%), self-employed (not incorporated) (150 | 13.2%), and local government employees (119 | 10.4%) make up the most common classes of employment.
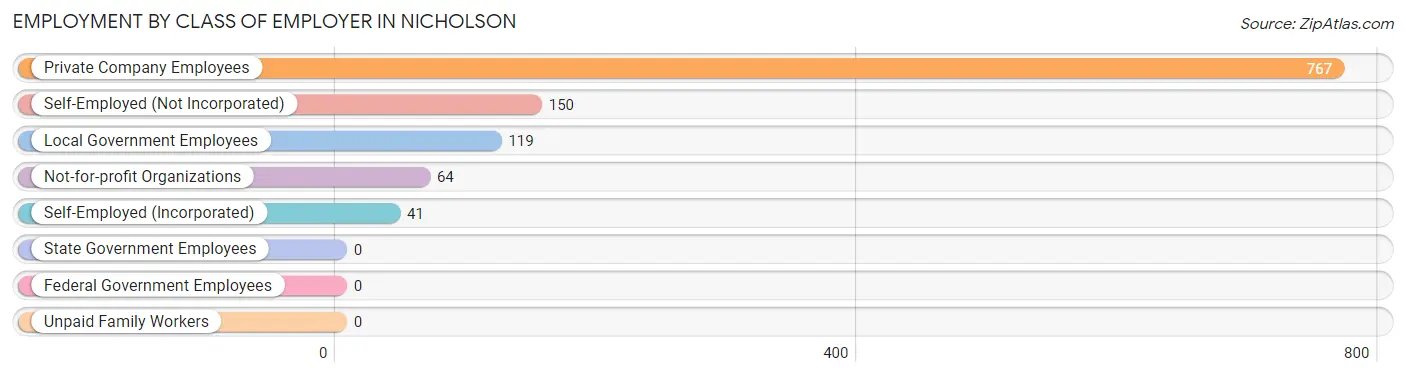
| Employer Class | # Employees | % Employees |
| Private Company Employees | 767 | 67.2% |
| Self-Employed (Incorporated) | 41 | 3.6% |
| Self-Employed (Not Incorporated) | 150 | 13.2% |
| Not-for-profit Organizations | 64 | 5.6% |
| Local Government Employees | 119 | 10.4% |
| State Government Employees | 0 | 0.0% |
| Federal Government Employees | 0 | 0.0% |
| Unpaid Family Workers | 0 | 0.0% |
| Total | 1,141 | 100.0% |
Employment Status by Age in Nicholson
According to the labor force statistics for Nicholson, out of the total population over 16 years of age (1,910), 61.7% or 1,178 individuals are in the labor force, with 3.2% or 38 of them unemployed. The age group with the highest labor force participation rate is 20 to 24 years, with 100.0% or 129 individuals in the labor force. Within the labor force, the 30 to 34 years age range has the highest percentage of unemployed individuals, with 45.8% or 38 of them being unemployed.
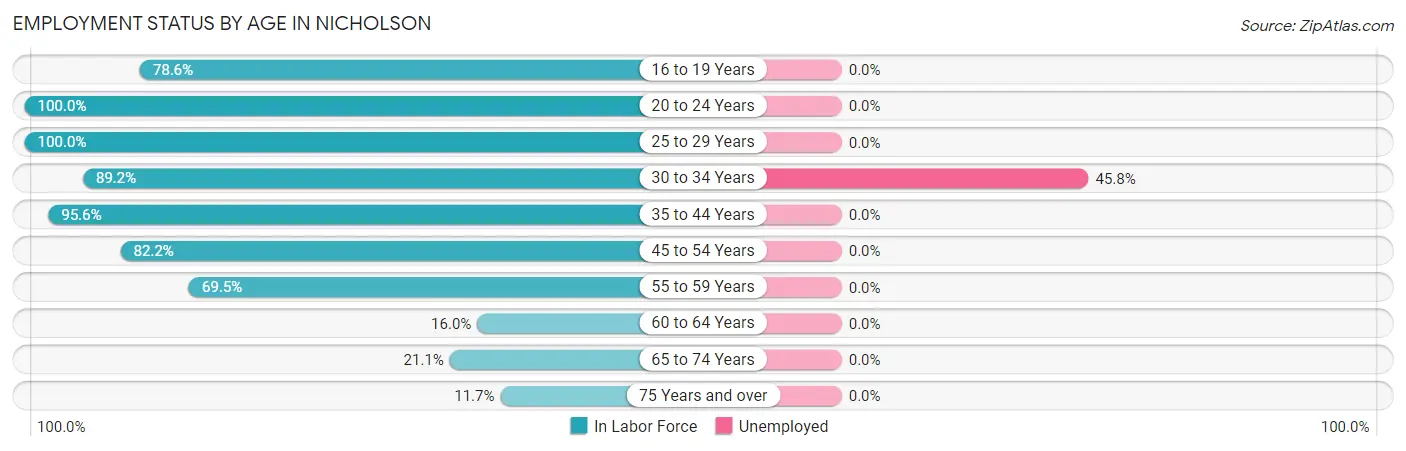
| Age Bracket | In Labor Force | Unemployed |
| 16 to 19 Years | 44 (78.6%) | 0 (0.0%) |
| 20 to 24 Years | 129 (100.0%) | 0 (0.0%) |
| 25 to 29 Years | 246 (100.0%) | 0 (0.0%) |
| 30 to 34 Years | 83 (89.2%) | 38 (45.8%) |
| 35 to 44 Years | 195 (95.6%) | 0 (0.0%) |
| 45 to 54 Years | 203 (82.2%) | 0 (0.0%) |
| 55 to 59 Years | 162 (69.5%) | 0 (0.0%) |
| 60 to 64 Years | 47 (16.0%) | 0 (0.0%) |
| 65 to 74 Years | 50 (21.1%) | 0 (0.0%) |
| 75 Years and over | 20 (11.7%) | 0 (0.0%) |
| Total | 1,178 (61.7%) | 38 (3.2%) |
Employment Status by Educational Attainment in Nicholson
According to labor force statistics for Nicholson, 71.1% of individuals (936) out of the total population between 25 and 64 years of age (1,317) are in the labor force, with 4.1% or 38 of them being unemployed. The group with the highest labor force participation rate are those with the educational attainment of bachelor's degree or higher, with 100.0% or 118 individuals in the labor force. Within the labor force, individuals with college / associate degree education have the highest percentage of unemployment, with 17.0% or 38 of them being unemployed.
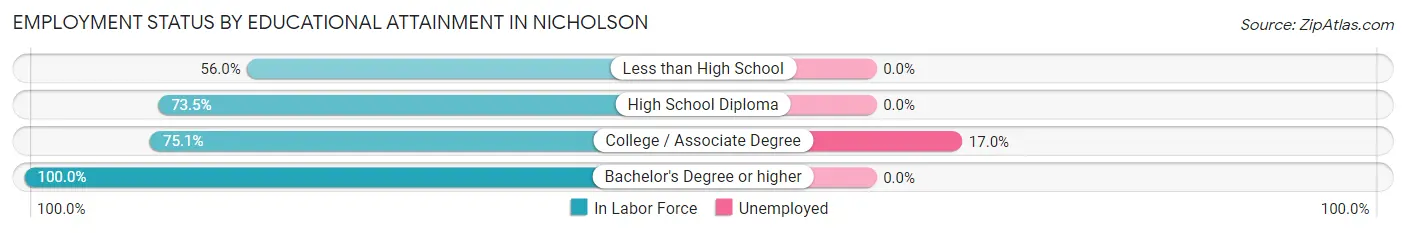
| Educational Attainment | In Labor Force | Unemployed |
| Less than High School | 218 (56.0%) | 0 (0.0%) |
| High School Diploma | 377 (73.5%) | 0 (0.0%) |
| College / Associate Degree | 223 (75.1%) | 50 (17.0%) |
| Bachelor's Degree or higher | 118 (100.0%) | 0 (0.0%) |
| Total | 936 (71.1%) | 54 (4.1%) |
Employment Occupations by Sex in Nicholson
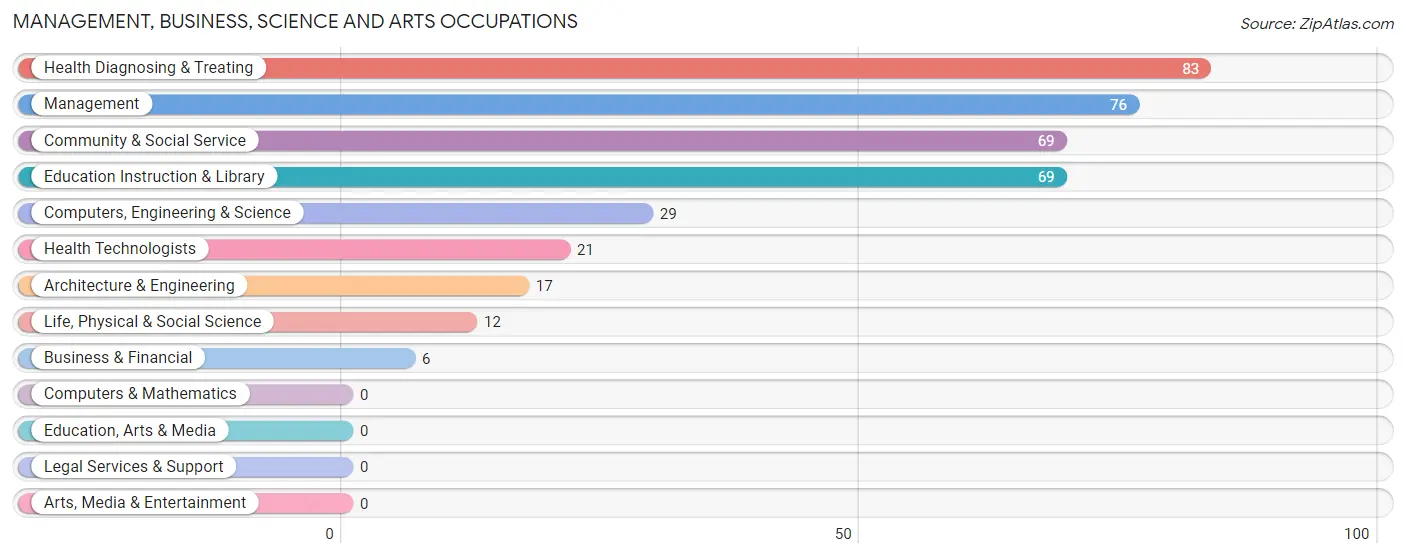
Management, Business, Science and Arts Occupations
The most common Management, Business, Science and Arts occupations in Nicholson are Health Diagnosing & Treating (83 | 7.3%), Management (76 | 6.7%), Community & Social Service (69 | 6.0%), Education Instruction & Library (69 | 6.0%), and Computers, Engineering & Science (29 | 2.5%).
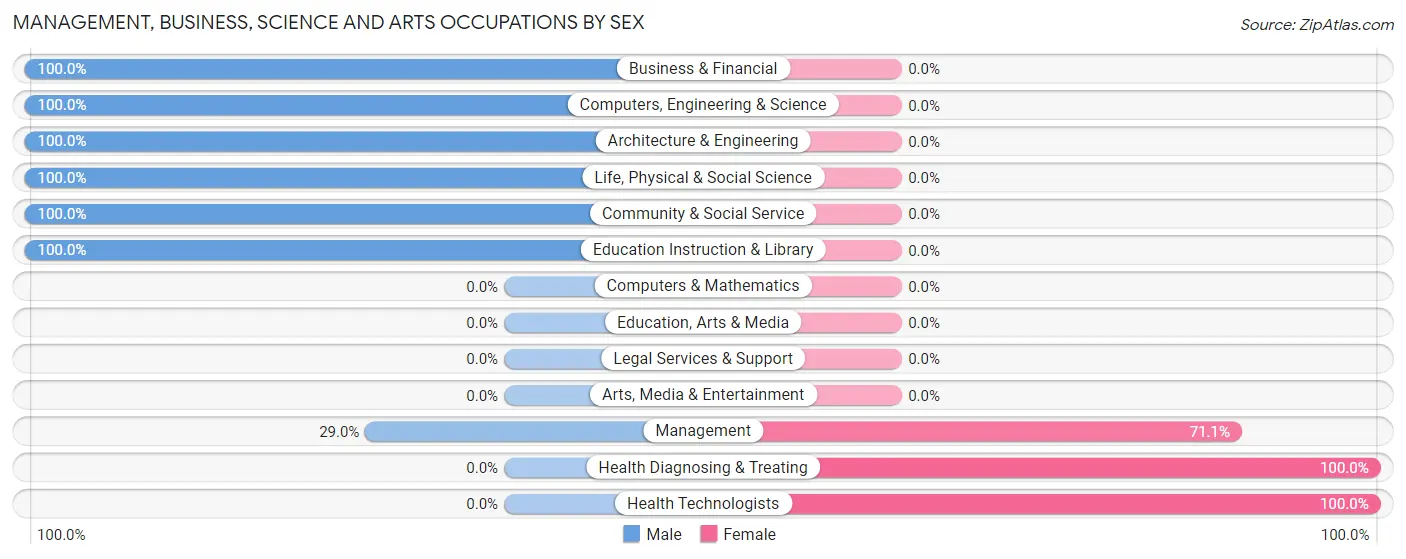
Management, Business, Science and Arts Occupations by Sex
Within the Management, Business, Science and Arts occupations in Nicholson, the most male-oriented occupations are Business & Financial (100.0%), Computers, Engineering & Science (100.0%), and Architecture & Engineering (100.0%), while the most female-oriented occupations are Health Diagnosing & Treating (100.0%), Health Technologists (100.0%), and Management (71.1%).
| Occupation | Male | Female |
| Management | 22 (28.9%) | 54 (71.1%) |
| Business & Financial | 6 (100.0%) | 0 (0.0%) |
| Computers, Engineering & Science | 29 (100.0%) | 0 (0.0%) |
| Computers & Mathematics | 0 (0.0%) | 0 (0.0%) |
| Architecture & Engineering | 17 (100.0%) | 0 (0.0%) |
| Life, Physical & Social Science | 12 (100.0%) | 0 (0.0%) |
| Community & Social Service | 69 (100.0%) | 0 (0.0%) |
| Education, Arts & Media | 0 (0.0%) | 0 (0.0%) |
| Legal Services & Support | 0 (0.0%) | 0 (0.0%) |
| Education Instruction & Library | 69 (100.0%) | 0 (0.0%) |
| Arts, Media & Entertainment | 0 (0.0%) | 0 (0.0%) |
| Health Diagnosing & Treating | 0 (0.0%) | 83 (100.0%) |
| Health Technologists | 0 (0.0%) | 21 (100.0%) |
| Total (Category) | 126 (47.9%) | 137 (52.1%) |
| Total (Overall) | 701 (61.4%) | 440 (38.6%) |
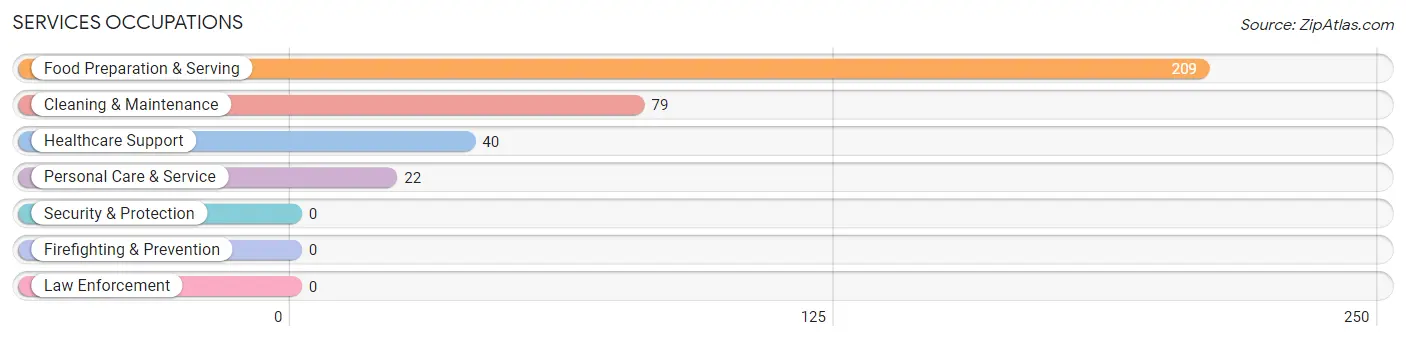
Services Occupations
The most common Services occupations in Nicholson are Food Preparation & Serving (209 | 18.3%), Cleaning & Maintenance (79 | 6.9%), Healthcare Support (40 | 3.5%), and Personal Care & Service (22 | 1.9%).
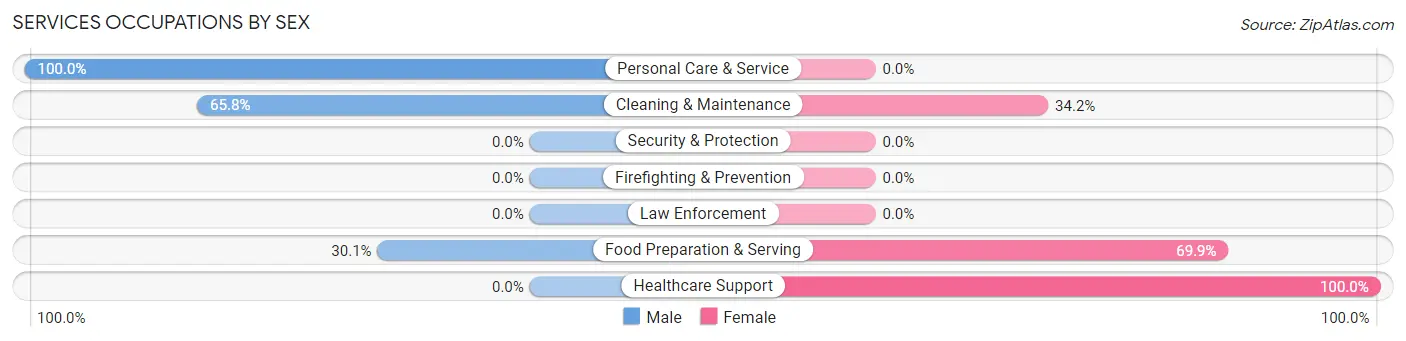
Services Occupations by Sex
Within the Services occupations in Nicholson, the most male-oriented occupations are Personal Care & Service (100.0%), Cleaning & Maintenance (65.8%), and Food Preparation & Serving (30.1%), while the most female-oriented occupations are Healthcare Support (100.0%), Food Preparation & Serving (69.9%), and Cleaning & Maintenance (34.2%).
| Occupation | Male | Female |
| Healthcare Support | 0 (0.0%) | 40 (100.0%) |
| Security & Protection | 0 (0.0%) | 0 (0.0%) |
| Firefighting & Prevention | 0 (0.0%) | 0 (0.0%) |
| Law Enforcement | 0 (0.0%) | 0 (0.0%) |
| Food Preparation & Serving | 63 (30.1%) | 146 (69.9%) |
| Cleaning & Maintenance | 52 (65.8%) | 27 (34.2%) |
| Personal Care & Service | 22 (100.0%) | 0 (0.0%) |
| Total (Category) | 137 (39.1%) | 213 (60.9%) |
| Total (Overall) | 701 (61.4%) | 440 (38.6%) |
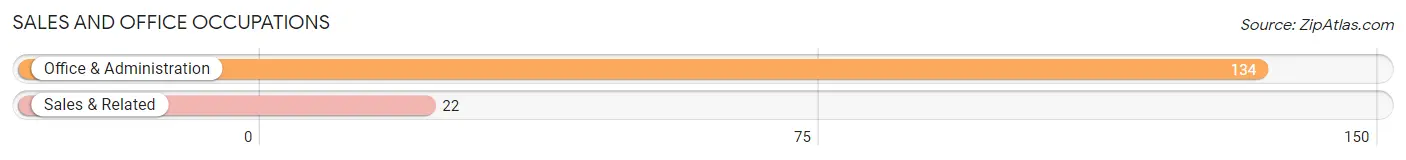
Sales and Office Occupations
The most common Sales and Office occupations in Nicholson are Office & Administration (134 | 11.7%), and Sales & Related (22 | 1.9%).
Sales and Office Occupations by Sex
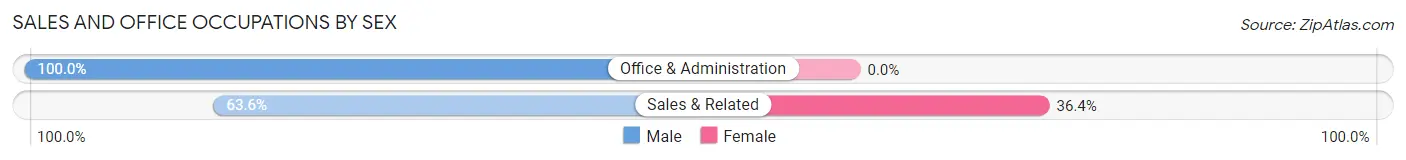
| Occupation | Male | Female |
| Sales & Related | 14 (63.6%) | 8 (36.4%) |
| Office & Administration | 134 (100.0%) | 0 (0.0%) |
| Total (Category) | 148 (94.9%) | 8 (5.1%) |
| Total (Overall) | 701 (61.4%) | 440 (38.6%) |
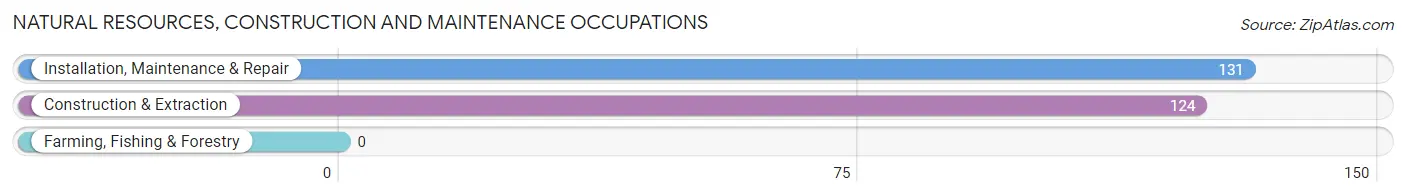
Natural Resources, Construction and Maintenance Occupations
The most common Natural Resources, Construction and Maintenance occupations in Nicholson are Installation, Maintenance & Repair (131 | 11.5%), and Construction & Extraction (124 | 10.9%).
Natural Resources, Construction and Maintenance Occupations by Sex
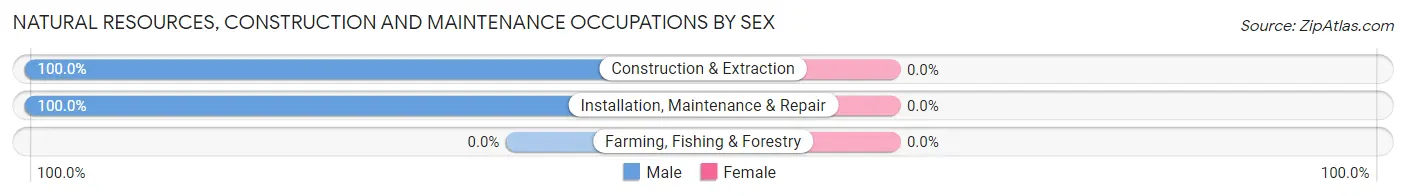
| Occupation | Male | Female |
| Farming, Fishing & Forestry | 0 (0.0%) | 0 (0.0%) |
| Construction & Extraction | 124 (100.0%) | 0 (0.0%) |
| Installation, Maintenance & Repair | 131 (100.0%) | 0 (0.0%) |
| Total (Category) | 255 (100.0%) | 0 (0.0%) |
| Total (Overall) | 701 (61.4%) | 440 (38.6%) |
Production, Transportation and Moving Occupations
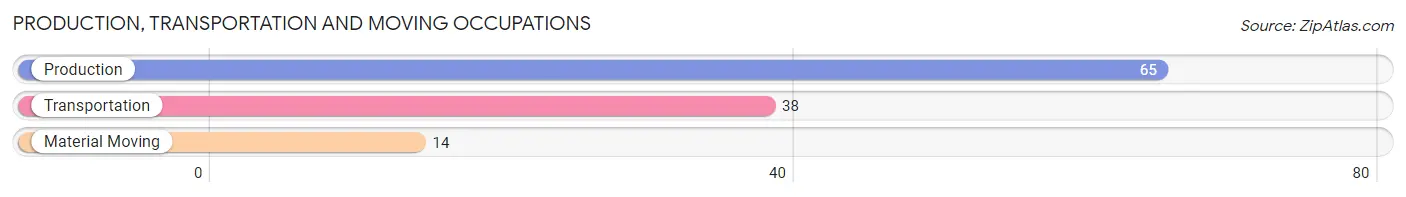
The most common Production, Transportation and Moving occupations in Nicholson are Production (65 | 5.7%), Transportation (38 | 3.3%), and Material Moving (14 | 1.2%).
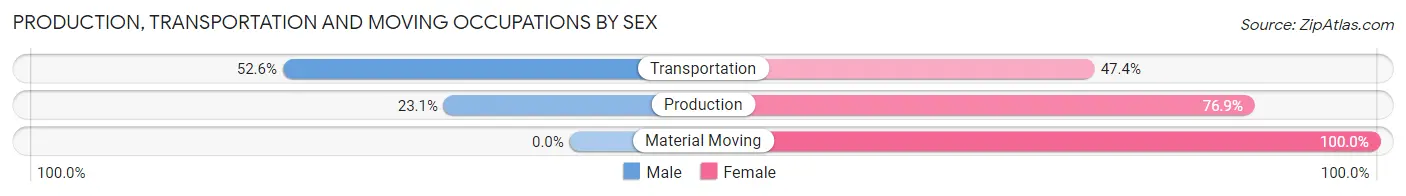
Production, Transportation and Moving Occupations by Sex
| Occupation | Male | Female |
| Production | 15 (23.1%) | 50 (76.9%) |
| Transportation | 20 (52.6%) | 18 (47.4%) |
| Material Moving | 0 (0.0%) | 14 (100.0%) |
| Total (Category) | 35 (29.9%) | 82 (70.1%) |
| Total (Overall) | 701 (61.4%) | 440 (38.6%) |
Employment Industries by Sex in Nicholson
Employment Industries in Nicholson
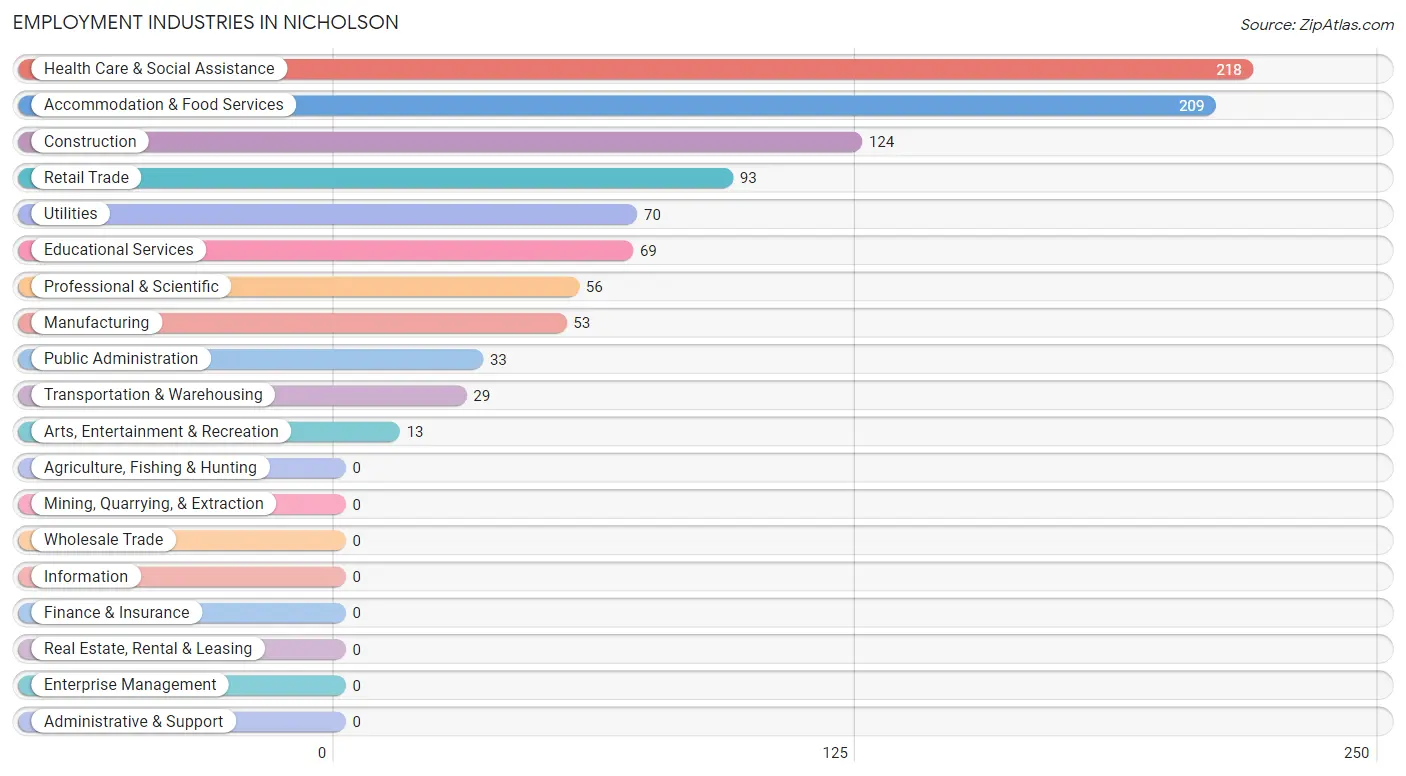
The major employment industries in Nicholson include Health Care & Social Assistance (218 | 19.1%), Accommodation & Food Services (209 | 18.3%), Construction (124 | 10.9%), Retail Trade (93 | 8.2%), and Utilities (70 | 6.1%).
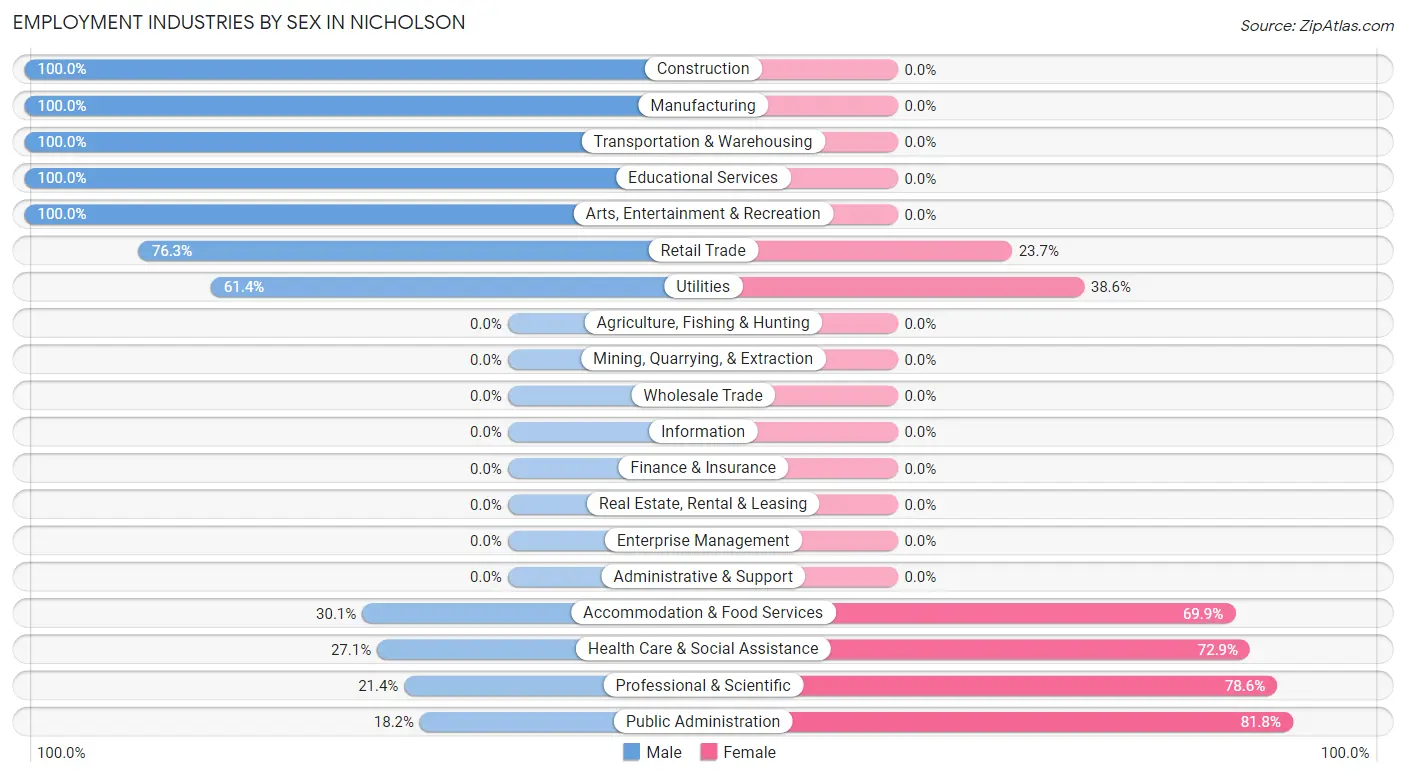
Employment Industries by Sex in Nicholson
The Nicholson industries that see more men than women are Construction (100.0%), Manufacturing (100.0%), and Transportation & Warehousing (100.0%), whereas the industries that tend to have a higher number of women are Public Administration (81.8%), Professional & Scientific (78.6%), and Health Care & Social Assistance (72.9%).
| Industry | Male | Female |
| Agriculture, Fishing & Hunting | 0 (0.0%) | 0 (0.0%) |
| Mining, Quarrying, & Extraction | 0 (0.0%) | 0 (0.0%) |
| Construction | 124 (100.0%) | 0 (0.0%) |
| Manufacturing | 53 (100.0%) | 0 (0.0%) |
| Wholesale Trade | 0 (0.0%) | 0 (0.0%) |
| Retail Trade | 71 (76.3%) | 22 (23.7%) |
| Transportation & Warehousing | 29 (100.0%) | 0 (0.0%) |
| Utilities | 43 (61.4%) | 27 (38.6%) |
| Information | 0 (0.0%) | 0 (0.0%) |
| Finance & Insurance | 0 (0.0%) | 0 (0.0%) |
| Real Estate, Rental & Leasing | 0 (0.0%) | 0 (0.0%) |
| Professional & Scientific | 12 (21.4%) | 44 (78.6%) |
| Enterprise Management | 0 (0.0%) | 0 (0.0%) |
| Administrative & Support | 0 (0.0%) | 0 (0.0%) |
| Educational Services | 69 (100.0%) | 0 (0.0%) |
| Health Care & Social Assistance | 59 (27.1%) | 159 (72.9%) |
| Arts, Entertainment & Recreation | 13 (100.0%) | 0 (0.0%) |
| Accommodation & Food Services | 63 (30.1%) | 146 (69.9%) |
| Public Administration | 6 (18.2%) | 27 (81.8%) |
| Total | 701 (61.4%) | 440 (38.6%) |
Education in Nicholson
School Enrollment in Nicholson
The most common levels of schooling among the 249 students in Nicholson are middle school (92 | 36.9%), elementary school (45 | 18.1%), and college / undergraduate (45 | 18.1%).
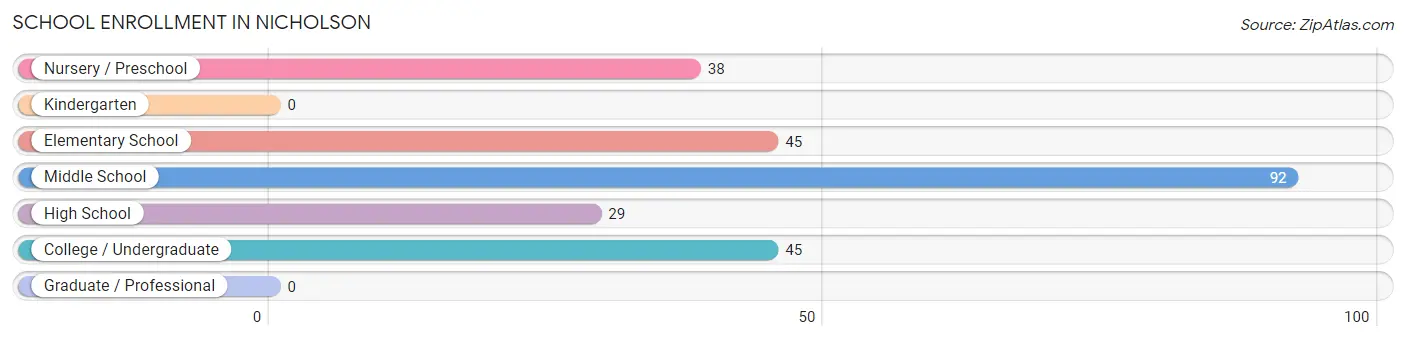
| School Level | # Students | % Students |
| Nursery / Preschool | 38 | 15.3% |
| Kindergarten | 0 | 0.0% |
| Elementary School | 45 | 18.1% |
| Middle School | 92 | 36.9% |
| High School | 29 | 11.7% |
| College / Undergraduate | 45 | 18.1% |
| Graduate / Professional | 0 | 0.0% |
| Total | 249 | 100.0% |
School Enrollment by Age by Funding Source in Nicholson
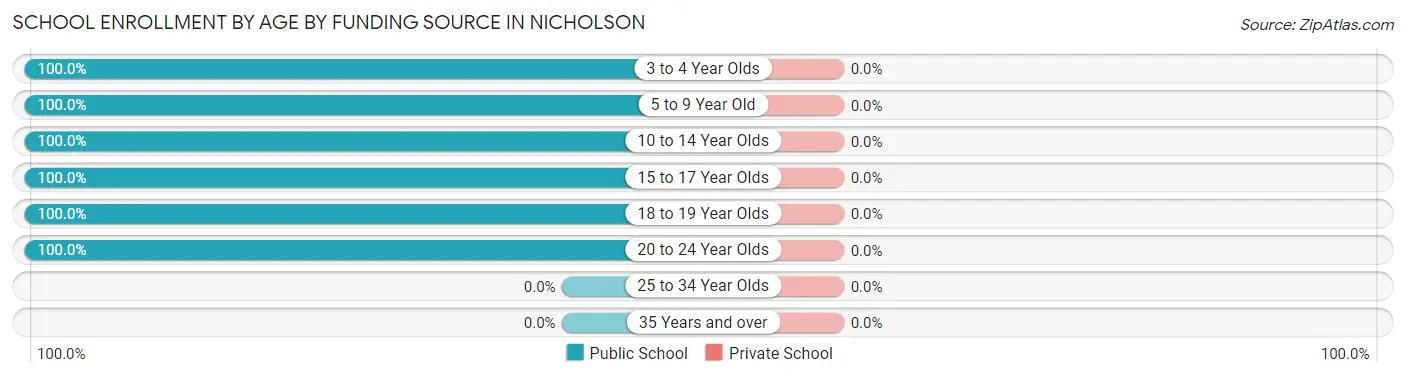
| Age Bracket | Public School | Private School |
| 3 to 4 Year Olds | 38 (100.0%) | 0 (0.0%) |
| 5 to 9 Year Old | 45 (100.0%) | 0 (0.0%) |
| 10 to 14 Year Olds | 92 (100.0%) | 0 (0.0%) |
| 15 to 17 Year Olds | 12 (100.0%) | 0 (0.0%) |
| 18 to 19 Year Olds | 17 (100.0%) | 0 (0.0%) |
| 20 to 24 Year Olds | 45 (100.0%) | 0 (0.0%) |
| 25 to 34 Year Olds | 0 (0.0%) | 0 (0.0%) |
| 35 Years and over | 0 (0.0%) | 0 (0.0%) |
| Total | 249 (100.0%) | 0 (0.0%) |
Educational Attainment by Field of Study in Nicholson
Science & technology (75 | 48.4%), arts & humanities (31 | 20.0%), literature & languages (19 | 12.3%), education (18 | 11.6%), and bio, nature & agricultural (12 | 7.7%) are the most common fields of study among 155 individuals in Nicholson who have obtained a bachelor's degree or higher.
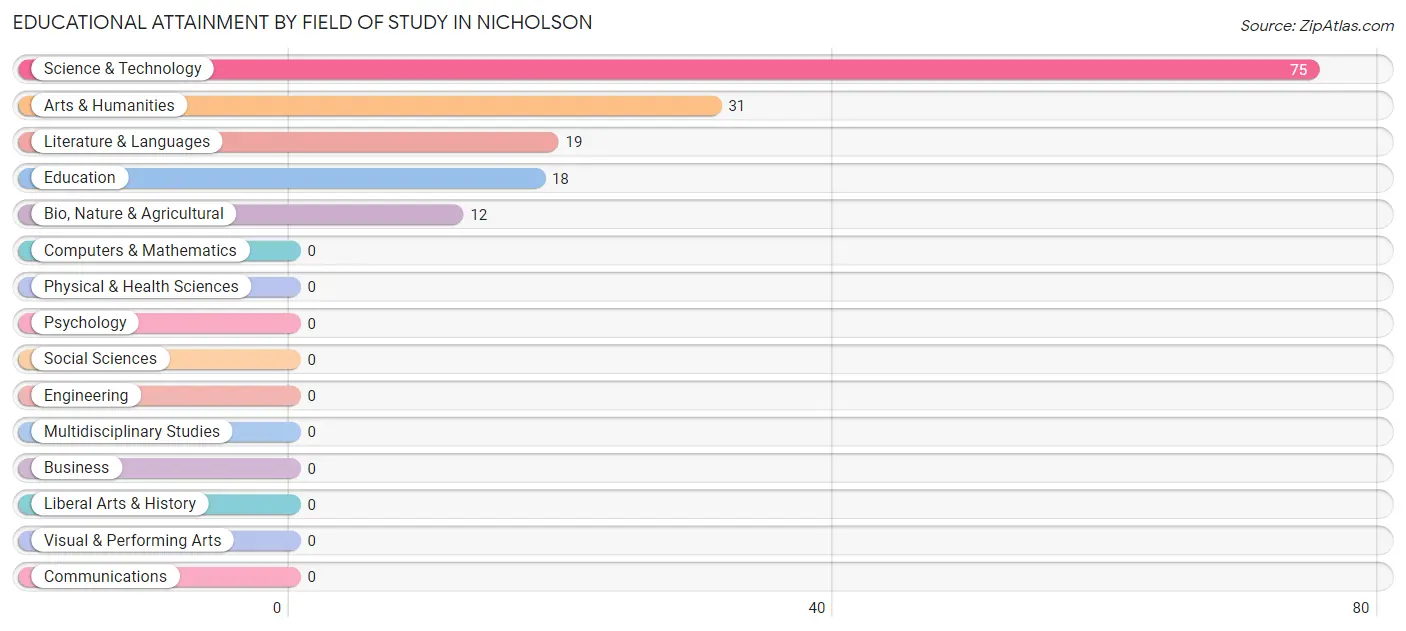
| Field of Study | # Graduates | % Graduates |
| Computers & Mathematics | 0 | 0.0% |
| Bio, Nature & Agricultural | 12 | 7.7% |
| Physical & Health Sciences | 0 | 0.0% |
| Psychology | 0 | 0.0% |
| Social Sciences | 0 | 0.0% |
| Engineering | 0 | 0.0% |
| Multidisciplinary Studies | 0 | 0.0% |
| Science & Technology | 75 | 48.4% |
| Business | 0 | 0.0% |
| Education | 18 | 11.6% |
| Literature & Languages | 19 | 12.3% |
| Liberal Arts & History | 0 | 0.0% |
| Visual & Performing Arts | 0 | 0.0% |
| Communications | 0 | 0.0% |
| Arts & Humanities | 31 | 20.0% |
| Total | 155 | 100.0% |
Transportation & Commute in Nicholson
Vehicle Availability by Sex in Nicholson
The most prevalent vehicle ownership categories in Nicholson are males with 2 vehicles (404, accounting for 57.6%) and females with 2 vehicles (211, making up 91.8%).
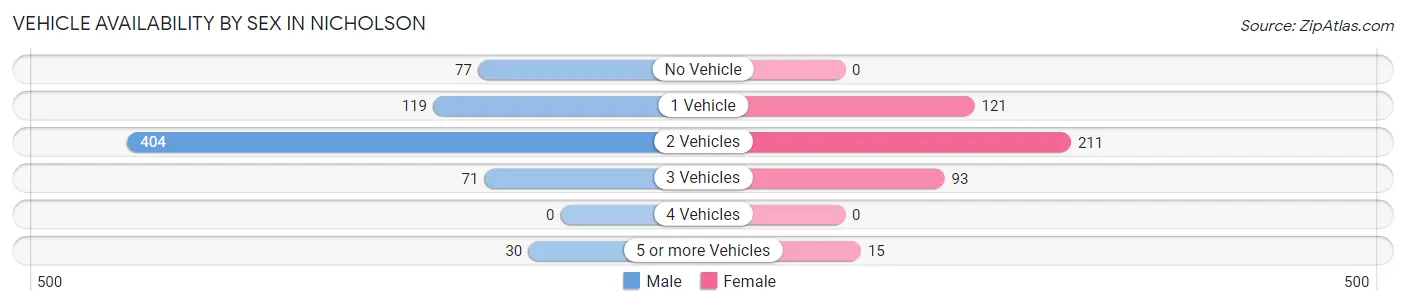
| Vehicles Available | Male | Female |
| No Vehicle | 77 (11.0%) | 0 (0.0%) |
| 1 Vehicle | 119 (17.0%) | 121 (27.5%) |
| 2 Vehicles | 404 (57.6%) | 211 (47.9%) |
| 3 Vehicles | 71 (10.1%) | 93 (21.1%) |
| 4 Vehicles | 0 (0.0%) | 0 (0.0%) |
| 5 or more Vehicles | 30 (4.3%) | 15 (3.4%) |
| Total | 701 (100.0%) | 440 (100.0%) |
Commute Time in Nicholson
The most frequently occuring commute durations in Nicholson are 15 to 19 minutes (225 commuters, 21.1%), 10 to 14 minutes (222 commuters, 20.8%), and 45 to 59 minutes (182 commuters, 17.1%).
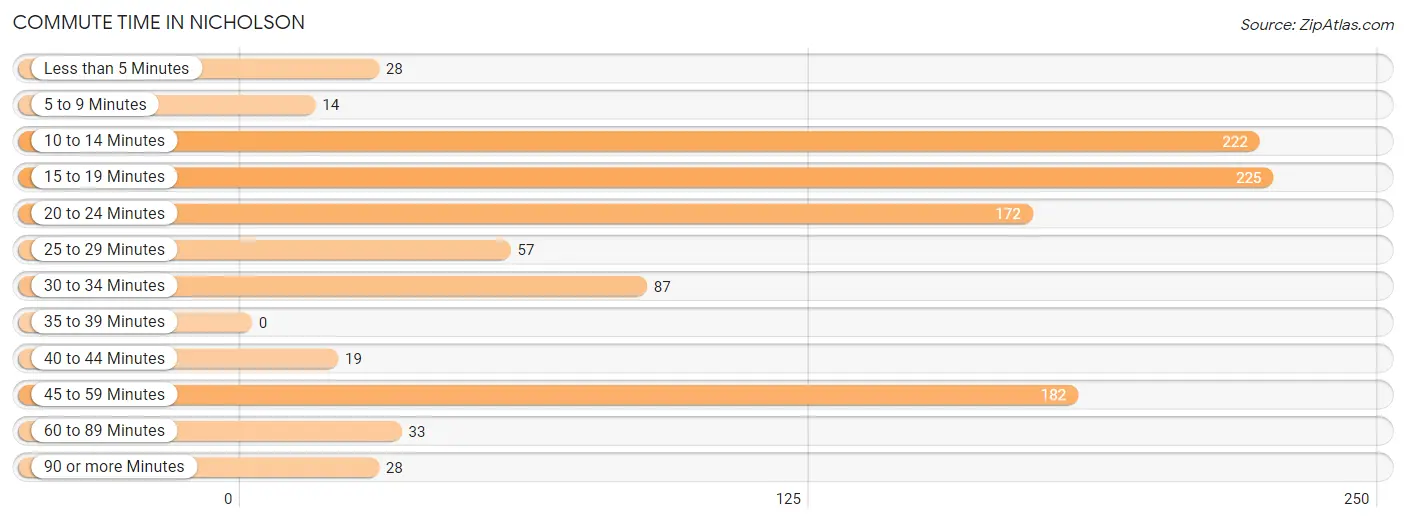
| Commute Time | # Commuters | % Commuters |
| Less than 5 Minutes | 28 | 2.6% |
| 5 to 9 Minutes | 14 | 1.3% |
| 10 to 14 Minutes | 222 | 20.8% |
| 15 to 19 Minutes | 225 | 21.1% |
| 20 to 24 Minutes | 172 | 16.1% |
| 25 to 29 Minutes | 57 | 5.3% |
| 30 to 34 Minutes | 87 | 8.2% |
| 35 to 39 Minutes | 0 | 0.0% |
| 40 to 44 Minutes | 19 | 1.8% |
| 45 to 59 Minutes | 182 | 17.1% |
| 60 to 89 Minutes | 33 | 3.1% |
| 90 or more Minutes | 28 | 2.6% |
Commute Time by Sex in Nicholson
The most common commute times in Nicholson are 15 to 19 minutes (165 commuters, 26.1%) for males and 45 to 59 minutes (135 commuters, 31.1%) for females.
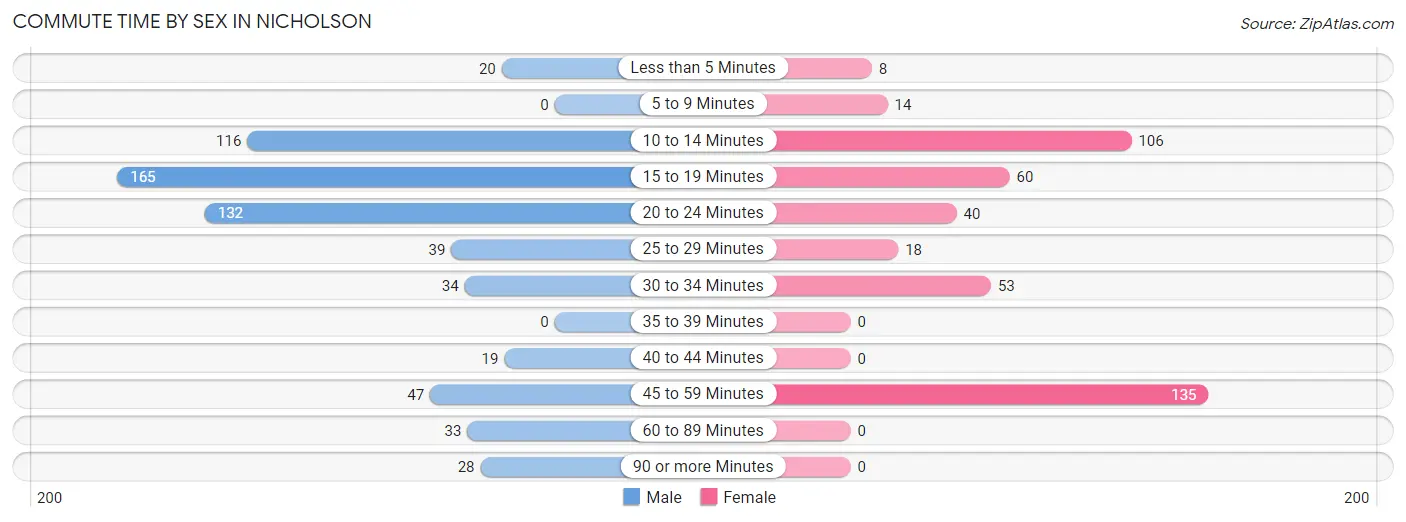
| Commute Time | Male | Female |
| Less than 5 Minutes | 20 (3.2%) | 8 (1.8%) |
| 5 to 9 Minutes | 0 (0.0%) | 14 (3.2%) |
| 10 to 14 Minutes | 116 (18.3%) | 106 (24.4%) |
| 15 to 19 Minutes | 165 (26.1%) | 60 (13.8%) |
| 20 to 24 Minutes | 132 (20.8%) | 40 (9.2%) |
| 25 to 29 Minutes | 39 (6.2%) | 18 (4.2%) |
| 30 to 34 Minutes | 34 (5.4%) | 53 (12.2%) |
| 35 to 39 Minutes | 0 (0.0%) | 0 (0.0%) |
| 40 to 44 Minutes | 19 (3.0%) | 0 (0.0%) |
| 45 to 59 Minutes | 47 (7.4%) | 135 (31.1%) |
| 60 to 89 Minutes | 33 (5.2%) | 0 (0.0%) |
| 90 or more Minutes | 28 (4.4%) | 0 (0.0%) |
Time of Departure to Work by Sex in Nicholson
The most frequent times of departure to work in Nicholson are 6:00 AM to 6:29 AM (182, 28.7%) for males and 5:00 AM to 5:29 AM (67, 15.4%) for females.
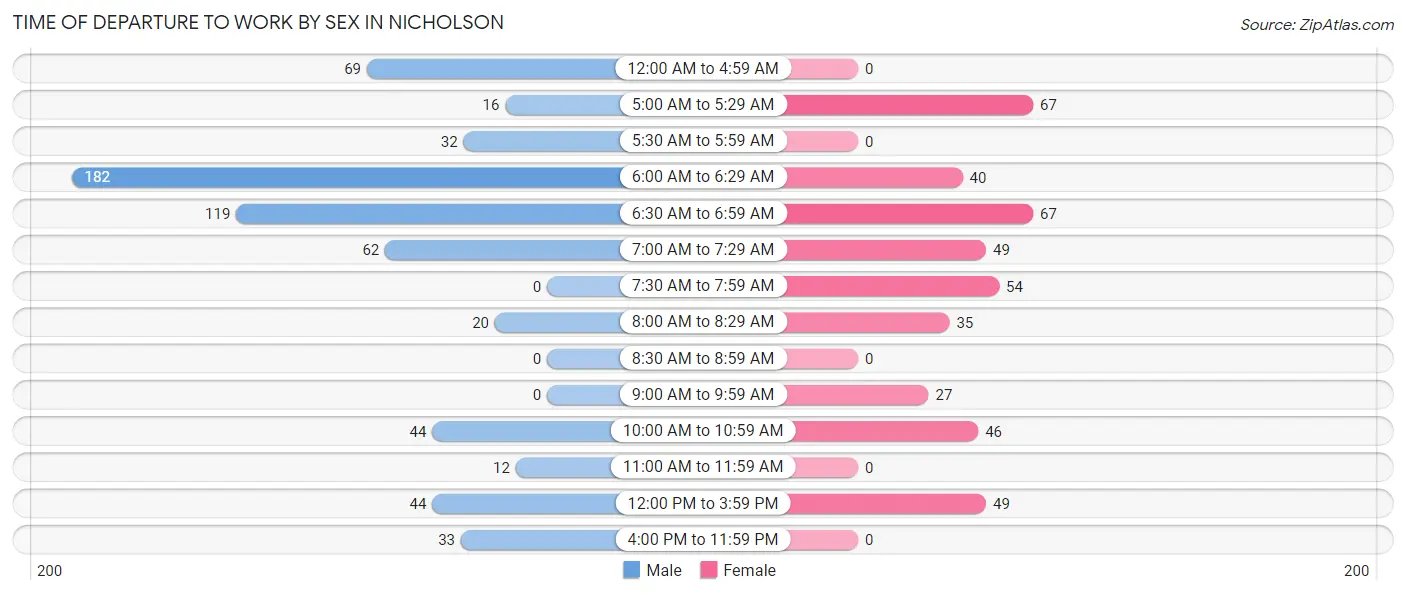
| Time of Departure | Male | Female |
| 12:00 AM to 4:59 AM | 69 (10.9%) | 0 (0.0%) |
| 5:00 AM to 5:29 AM | 16 (2.5%) | 67 (15.4%) |
| 5:30 AM to 5:59 AM | 32 (5.1%) | 0 (0.0%) |
| 6:00 AM to 6:29 AM | 182 (28.7%) | 40 (9.2%) |
| 6:30 AM to 6:59 AM | 119 (18.8%) | 67 (15.4%) |
| 7:00 AM to 7:29 AM | 62 (9.8%) | 49 (11.3%) |
| 7:30 AM to 7:59 AM | 0 (0.0%) | 54 (12.4%) |
| 8:00 AM to 8:29 AM | 20 (3.2%) | 35 (8.1%) |
| 8:30 AM to 8:59 AM | 0 (0.0%) | 0 (0.0%) |
| 9:00 AM to 9:59 AM | 0 (0.0%) | 27 (6.2%) |
| 10:00 AM to 10:59 AM | 44 (7.0%) | 46 (10.6%) |
| 11:00 AM to 11:59 AM | 12 (1.9%) | 0 (0.0%) |
| 12:00 PM to 3:59 PM | 44 (7.0%) | 49 (11.3%) |
| 4:00 PM to 11:59 PM | 33 (5.2%) | 0 (0.0%) |
| Total | 633 (100.0%) | 434 (100.0%) |
Housing Occupancy in Nicholson
Occupancy by Ownership in Nicholson
Of the total 1,072 dwellings in Nicholson, owner-occupied units account for 737 (68.8%), while renter-occupied units make up 335 (31.2%).
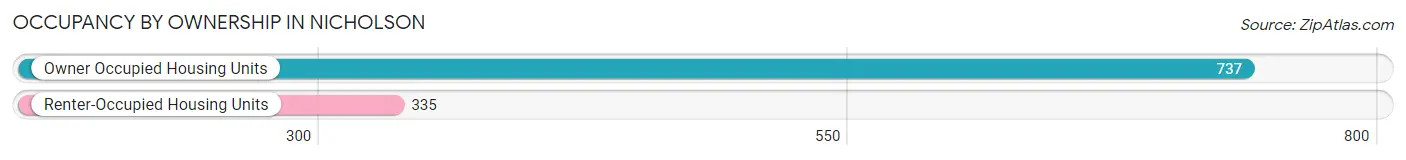
| Occupancy | # Housing Units | % Housing Units |
| Owner Occupied Housing Units | 737 | 68.8% |
| Renter-Occupied Housing Units | 335 | 31.2% |
| Total Occupied Housing Units | 1,072 | 100.0% |
Occupancy by Household Size in Nicholson
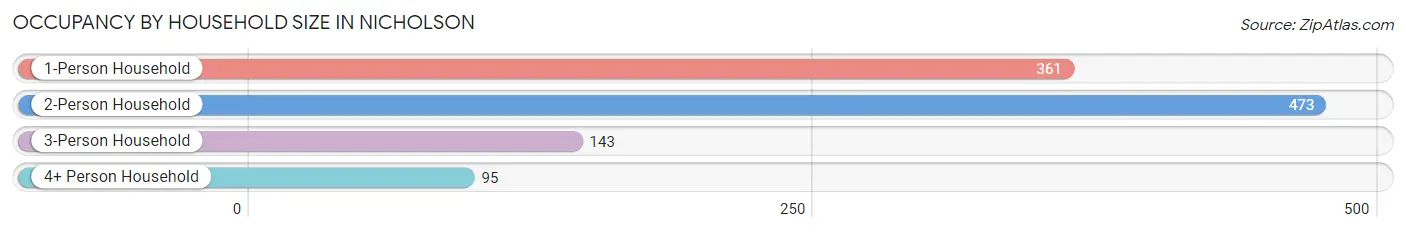
| Household Size | # Housing Units | % Housing Units |
| 1-Person Household | 361 | 33.7% |
| 2-Person Household | 473 | 44.1% |
| 3-Person Household | 143 | 13.3% |
| 4+ Person Household | 95 | 8.9% |
| Total Housing Units | 1,072 | 100.0% |
Occupancy by Ownership by Household Size in Nicholson
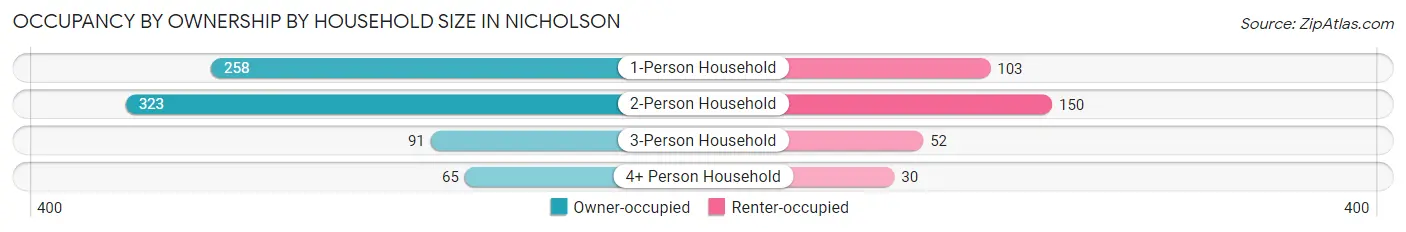
| Household Size | Owner-occupied | Renter-occupied |
| 1-Person Household | 258 (71.5%) | 103 (28.5%) |
| 2-Person Household | 323 (68.3%) | 150 (31.7%) |
| 3-Person Household | 91 (63.6%) | 52 (36.4%) |
| 4+ Person Household | 65 (68.4%) | 30 (31.6%) |
| Total Housing Units | 737 (68.8%) | 335 (31.2%) |
Occupancy by Educational Attainment in Nicholson
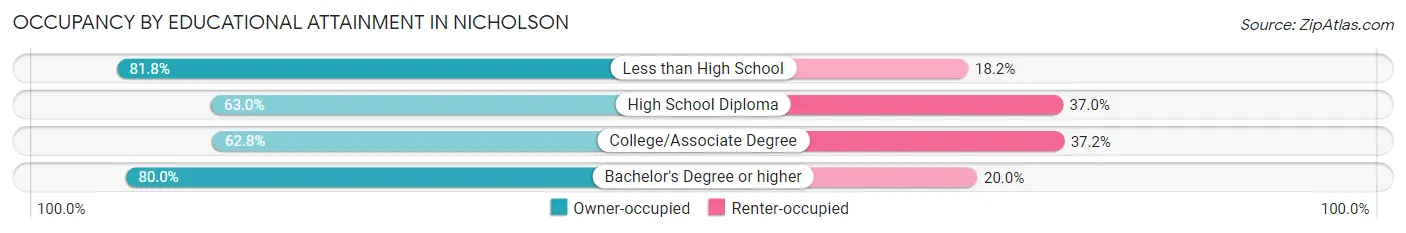
| Household Size | Owner-occupied | Renter-occupied |
| Less than High School | 193 (81.8%) | 43 (18.2%) |
| High School Diploma | 237 (63.0%) | 139 (37.0%) |
| College/Associate Degree | 223 (62.8%) | 132 (37.2%) |
| Bachelor's Degree or higher | 84 (80.0%) | 21 (20.0%) |
Occupancy by Age of Householder in Nicholson
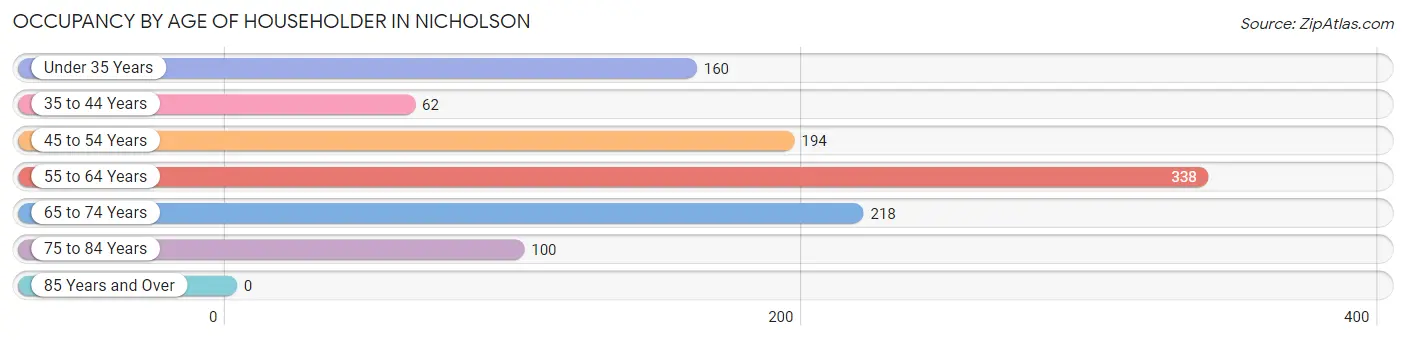
| Age Bracket | # Households | % Households |
| Under 35 Years | 160 | 14.9% |
| 35 to 44 Years | 62 | 5.8% |
| 45 to 54 Years | 194 | 18.1% |
| 55 to 64 Years | 338 | 31.5% |
| 65 to 74 Years | 218 | 20.3% |
| 75 to 84 Years | 100 | 9.3% |
| 85 Years and Over | 0 | 0.0% |
| Total | 1,072 | 100.0% |
Housing Finances in Nicholson
Median Income by Occupancy in Nicholson
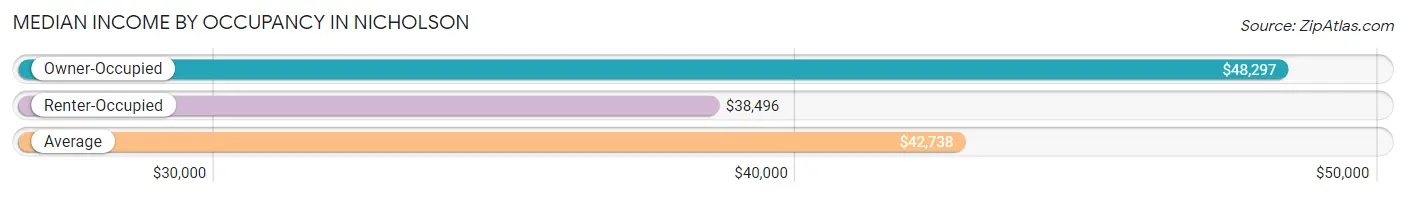
| Occupancy Type | # Households | Median Income |
| Owner-Occupied | 737 (68.8%) | $48,297 |
| Renter-Occupied | 335 (31.2%) | $38,496 |
| Average | 1,072 (100.0%) | $42,738 |
Occupancy by Householder Income Bracket in Nicholson
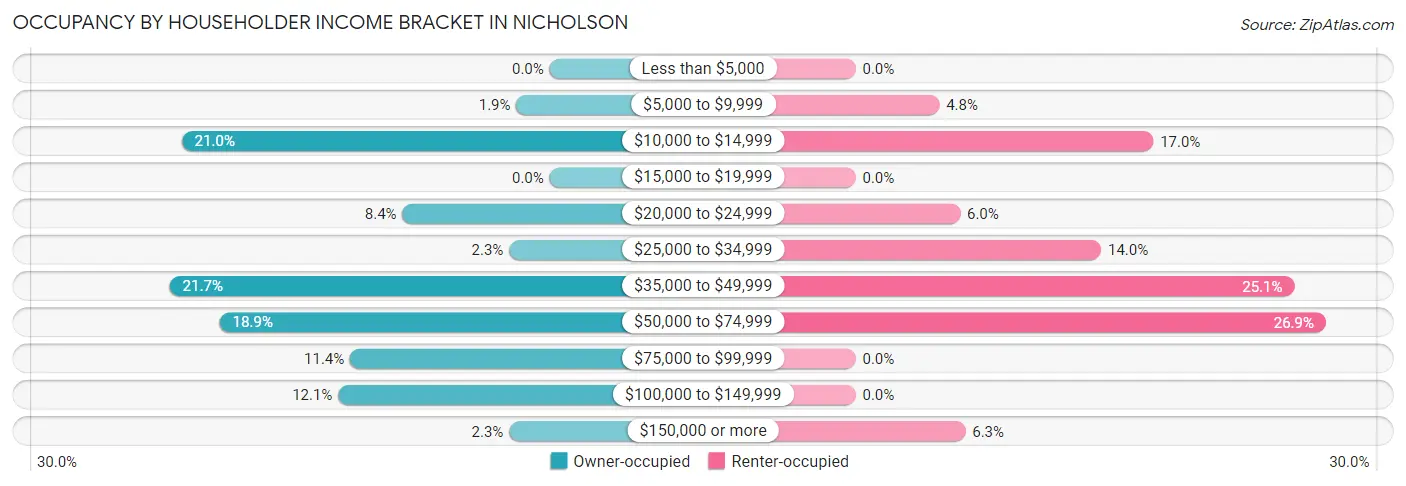
| Income Bracket | Owner-occupied | Renter-occupied |
| Less than $5,000 | 0 (0.0%) | 0 (0.0%) |
| $5,000 to $9,999 | 14 (1.9%) | 16 (4.8%) |
| $10,000 to $14,999 | 155 (21.0%) | 57 (17.0%) |
| $15,000 to $19,999 | 0 (0.0%) | 0 (0.0%) |
| $20,000 to $24,999 | 62 (8.4%) | 20 (6.0%) |
| $25,000 to $34,999 | 17 (2.3%) | 47 (14.0%) |
| $35,000 to $49,999 | 160 (21.7%) | 84 (25.1%) |
| $50,000 to $74,999 | 139 (18.9%) | 90 (26.9%) |
| $75,000 to $99,999 | 84 (11.4%) | 0 (0.0%) |
| $100,000 to $149,999 | 89 (12.1%) | 0 (0.0%) |
| $150,000 or more | 17 (2.3%) | 21 (6.3%) |
| Total | 737 (100.0%) | 335 (100.0%) |
Monthly Housing Cost Tiers in Nicholson
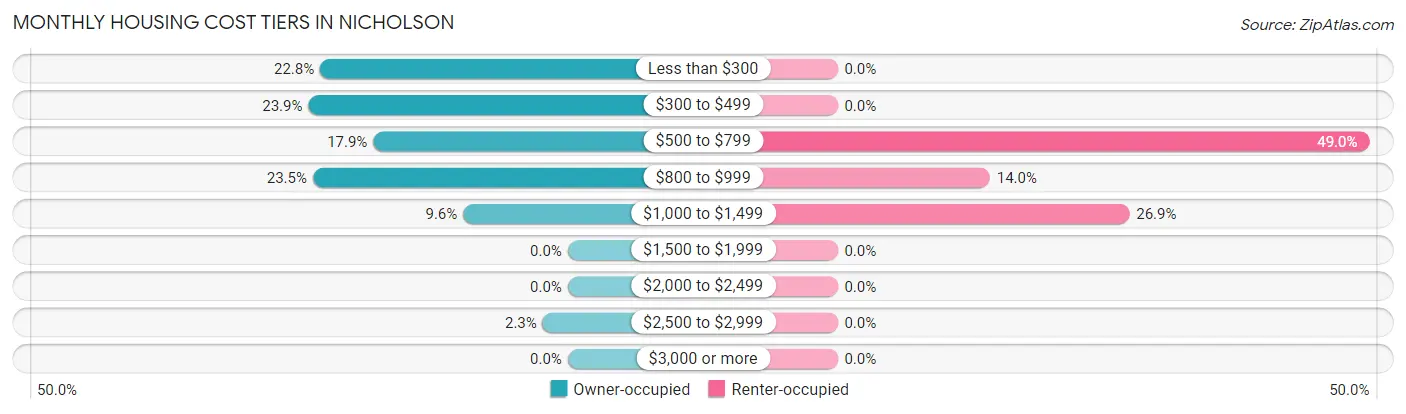
| Monthly Cost | Owner-occupied | Renter-occupied |
| Less than $300 | 168 (22.8%) | 0 (0.0%) |
| $300 to $499 | 176 (23.9%) | 0 (0.0%) |
| $500 to $799 | 132 (17.9%) | 164 (49.0%) |
| $800 to $999 | 173 (23.5%) | 47 (14.0%) |
| $1,000 to $1,499 | 71 (9.6%) | 90 (26.9%) |
| $1,500 to $1,999 | 0 (0.0%) | 0 (0.0%) |
| $2,000 to $2,499 | 0 (0.0%) | 0 (0.0%) |
| $2,500 to $2,999 | 17 (2.3%) | 0 (0.0%) |
| $3,000 or more | 0 (0.0%) | 0 (0.0%) |
| Total | 737 (100.0%) | 335 (100.0%) |
Physical Housing Characteristics in Nicholson
Housing Structures in Nicholson
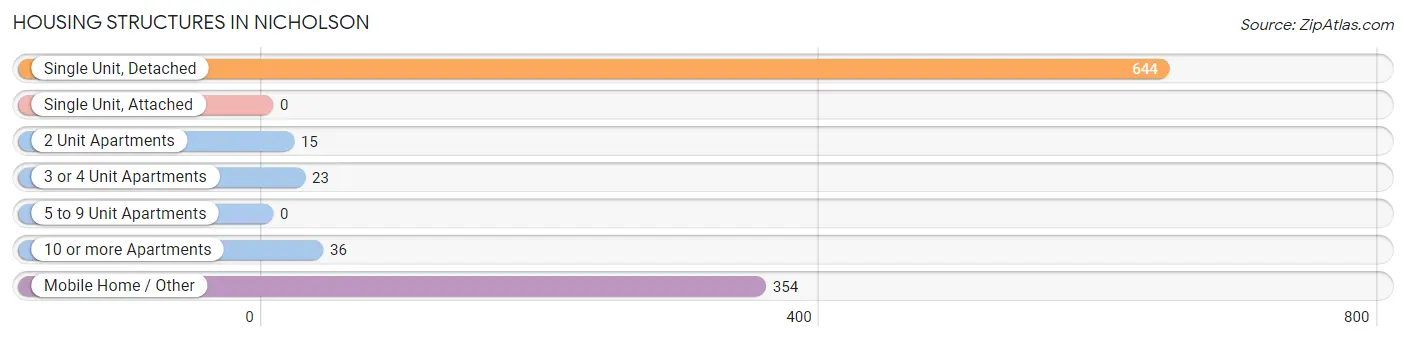
| Structure Type | # Housing Units | % Housing Units |
| Single Unit, Detached | 644 | 60.1% |
| Single Unit, Attached | 0 | 0.0% |
| 2 Unit Apartments | 15 | 1.4% |
| 3 or 4 Unit Apartments | 23 | 2.1% |
| 5 to 9 Unit Apartments | 0 | 0.0% |
| 10 or more Apartments | 36 | 3.4% |
| Mobile Home / Other | 354 | 33.0% |
| Total | 1,072 | 100.0% |
Housing Structures by Occupancy in Nicholson
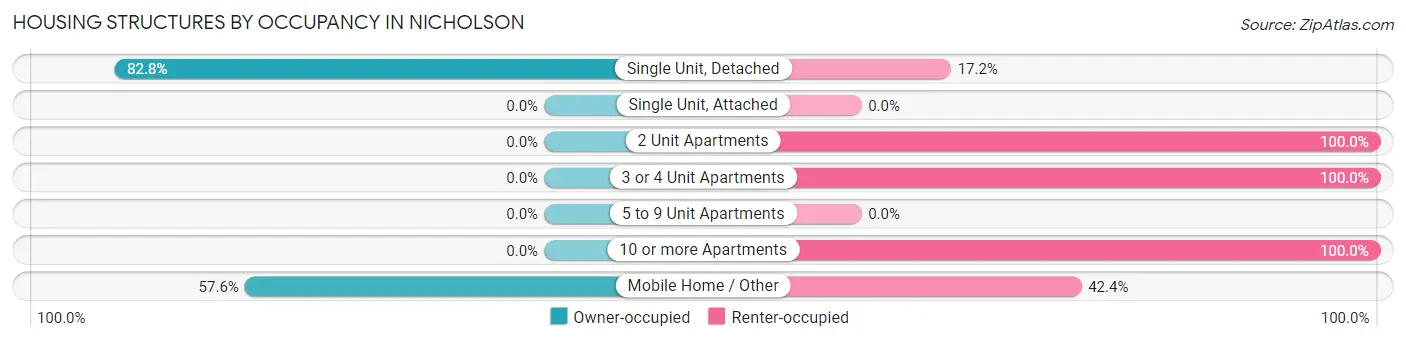
| Structure Type | Owner-occupied | Renter-occupied |
| Single Unit, Detached | 533 (82.8%) | 111 (17.2%) |
| Single Unit, Attached | 0 (0.0%) | 0 (0.0%) |
| 2 Unit Apartments | 0 (0.0%) | 15 (100.0%) |
| 3 or 4 Unit Apartments | 0 (0.0%) | 23 (100.0%) |
| 5 to 9 Unit Apartments | 0 (0.0%) | 0 (0.0%) |
| 10 or more Apartments | 0 (0.0%) | 36 (100.0%) |
| Mobile Home / Other | 204 (57.6%) | 150 (42.4%) |
| Total | 737 (68.8%) | 335 (31.2%) |
Housing Structures by Number of Rooms in Nicholson
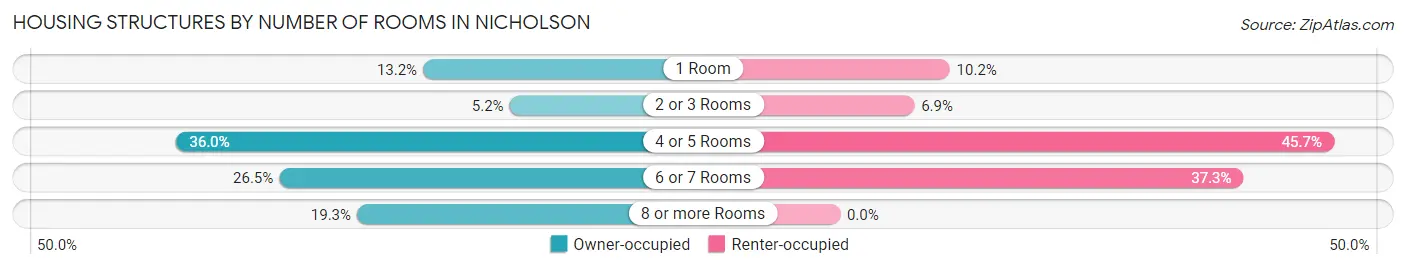
| Number of Rooms | Owner-occupied | Renter-occupied |
| 1 Room | 97 (13.2%) | 34 (10.2%) |
| 2 or 3 Rooms | 38 (5.2%) | 23 (6.9%) |
| 4 or 5 Rooms | 265 (36.0%) | 153 (45.7%) |
| 6 or 7 Rooms | 195 (26.5%) | 125 (37.3%) |
| 8 or more Rooms | 142 (19.3%) | 0 (0.0%) |
| Total | 737 (100.0%) | 335 (100.0%) |
Housing Structure by Heating Type in Nicholson
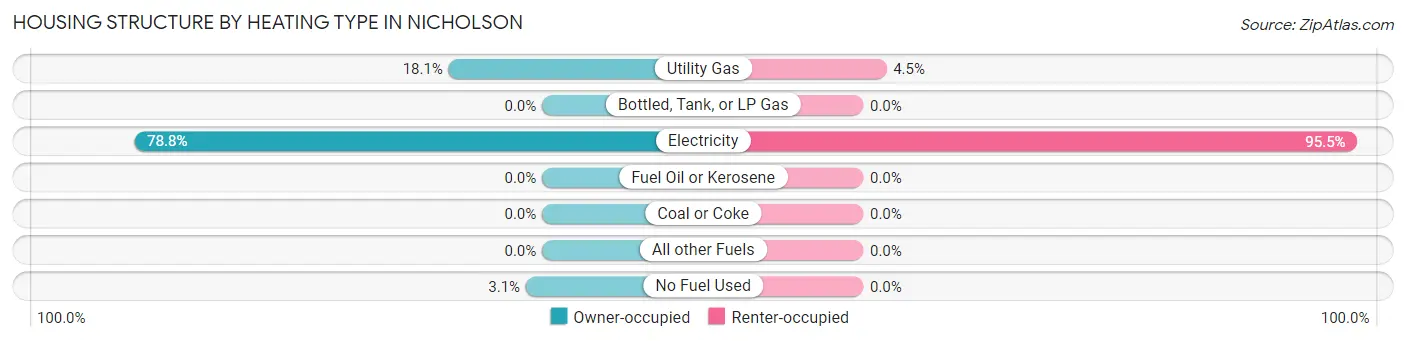
| Heating Type | Owner-occupied | Renter-occupied |
| Utility Gas | 133 (18.0%) | 15 (4.5%) |
| Bottled, Tank, or LP Gas | 0 (0.0%) | 0 (0.0%) |
| Electricity | 581 (78.8%) | 320 (95.5%) |
| Fuel Oil or Kerosene | 0 (0.0%) | 0 (0.0%) |
| Coal or Coke | 0 (0.0%) | 0 (0.0%) |
| All other Fuels | 0 (0.0%) | 0 (0.0%) |
| No Fuel Used | 23 (3.1%) | 0 (0.0%) |
| Total | 737 (100.0%) | 335 (100.0%) |
Household Vehicle Usage in Nicholson
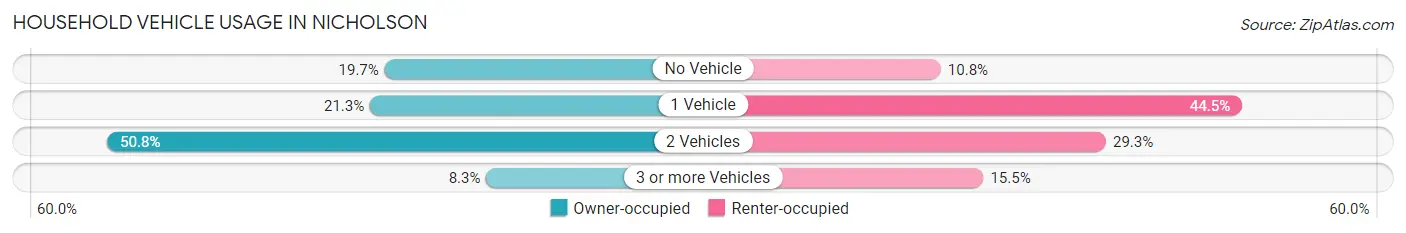
| Vehicles per Household | Owner-occupied | Renter-occupied |
| No Vehicle | 145 (19.7%) | 36 (10.7%) |
| 1 Vehicle | 157 (21.3%) | 149 (44.5%) |
| 2 Vehicles | 374 (50.7%) | 98 (29.2%) |
| 3 or more Vehicles | 61 (8.3%) | 52 (15.5%) |
| Total | 737 (100.0%) | 335 (100.0%) |
Real Estate & Mortgages in Nicholson
Real Estate and Mortgage Overview in Nicholson
| Characteristic | Without Mortgage | With Mortgage |
| Housing Units | 487 | 250 |
| Median Property Value | - | - |
| Median Household Income | $40,298 | $17 |
| Monthly Housing Costs | $397 | $0 |
| Real Estate Taxes | - | - |
Property Value by Mortgage Status in Nicholson
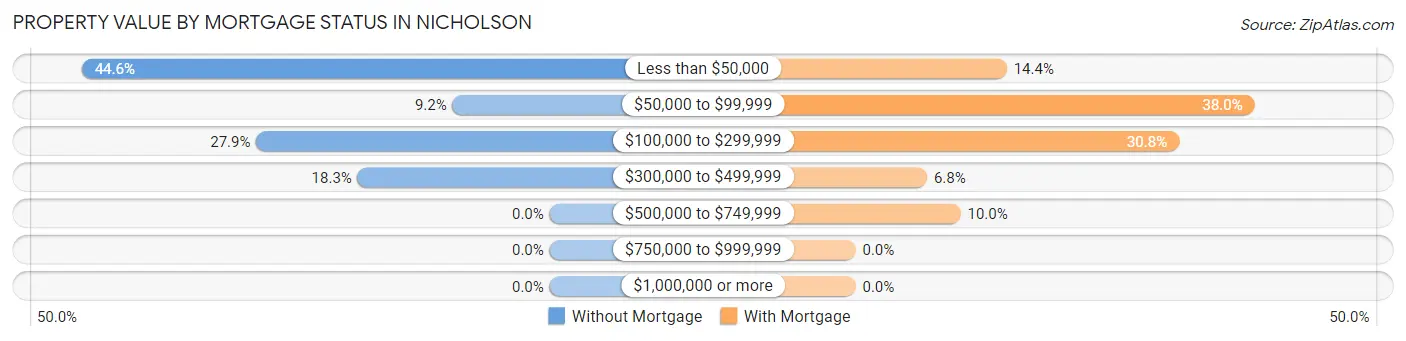
| Property Value | Without Mortgage | With Mortgage |
| Less than $50,000 | 217 (44.6%) | 36 (14.4%) |
| $50,000 to $99,999 | 45 (9.2%) | 95 (38.0%) |
| $100,000 to $299,999 | 136 (27.9%) | 77 (30.8%) |
| $300,000 to $499,999 | 89 (18.3%) | 17 (6.8%) |
| $500,000 to $749,999 | 0 (0.0%) | 25 (10.0%) |
| $750,000 to $999,999 | 0 (0.0%) | 0 (0.0%) |
| $1,000,000 or more | 0 (0.0%) | 0 (0.0%) |
| Total | 487 (100.0%) | 250 (100.0%) |
Household Income by Mortgage Status in Nicholson
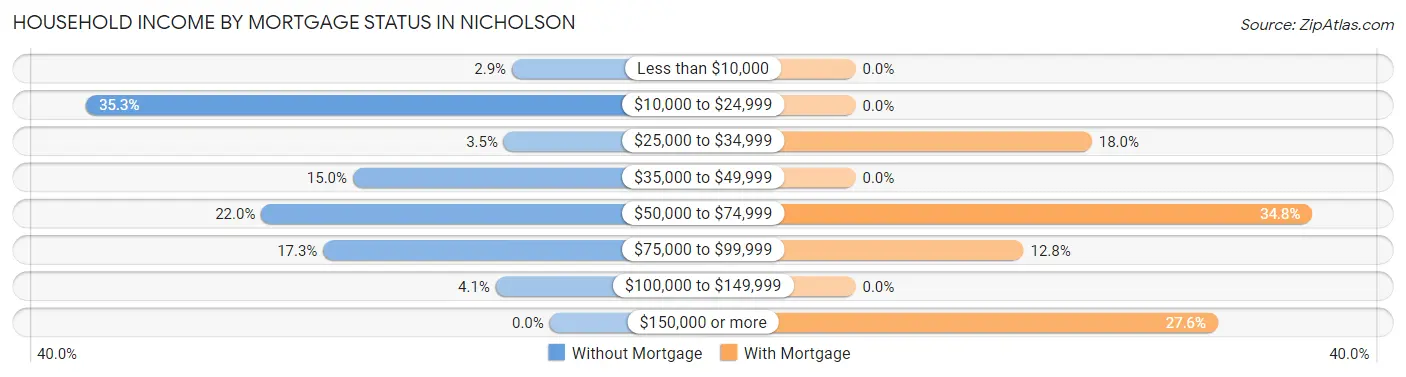
| Household Income | Without Mortgage | With Mortgage |
| Less than $10,000 | 14 (2.9%) | 0 (0.0%) |
| $10,000 to $24,999 | 172 (35.3%) | 0 (0.0%) |
| $25,000 to $34,999 | 17 (3.5%) | 45 (18.0%) |
| $35,000 to $49,999 | 73 (15.0%) | 0 (0.0%) |
| $50,000 to $74,999 | 107 (22.0%) | 87 (34.8%) |
| $75,000 to $99,999 | 84 (17.2%) | 32 (12.8%) |
| $100,000 to $149,999 | 20 (4.1%) | 0 (0.0%) |
| $150,000 or more | 0 (0.0%) | 69 (27.6%) |
| Total | 487 (100.0%) | 250 (100.0%) |
Property Value to Household Income Ratio in Nicholson
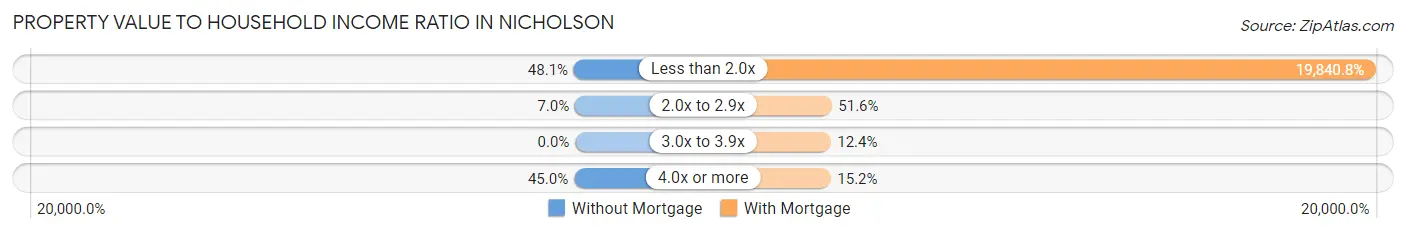
| Value-to-Income Ratio | Without Mortgage | With Mortgage |
| Less than 2.0x | 234 (48.0%) | 49,602 (19,840.8%) |
| 2.0x to 2.9x | 34 (7.0%) | 129 (51.6%) |
| 3.0x to 3.9x | 0 (0.0%) | 31 (12.4%) |
| 4.0x or more | 219 (45.0%) | 38 (15.2%) |
| Total | 487 (100.0%) | 250 (100.0%) |
Real Estate Taxes by Mortgage Status in Nicholson
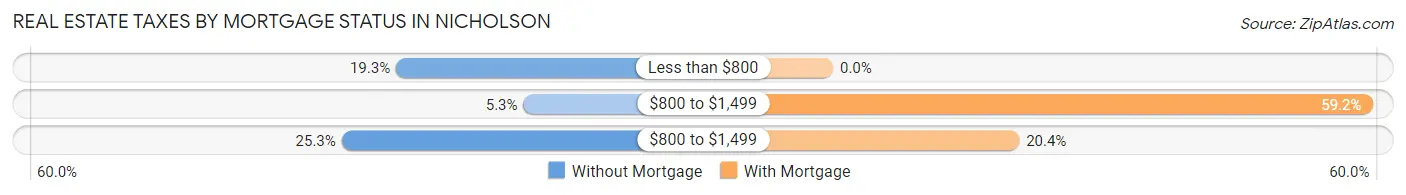
| Property Taxes | Without Mortgage | With Mortgage |
| Less than $800 | 94 (19.3%) | 0 (0.0%) |
| $800 to $1,499 | 26 (5.3%) | 148 (59.2%) |
| $800 to $1,499 | 123 (25.3%) | 51 (20.4%) |
| Total | 487 (100.0%) | 250 (100.0%) |
Health & Disability in Nicholson
Health Insurance Coverage by Age in Nicholson
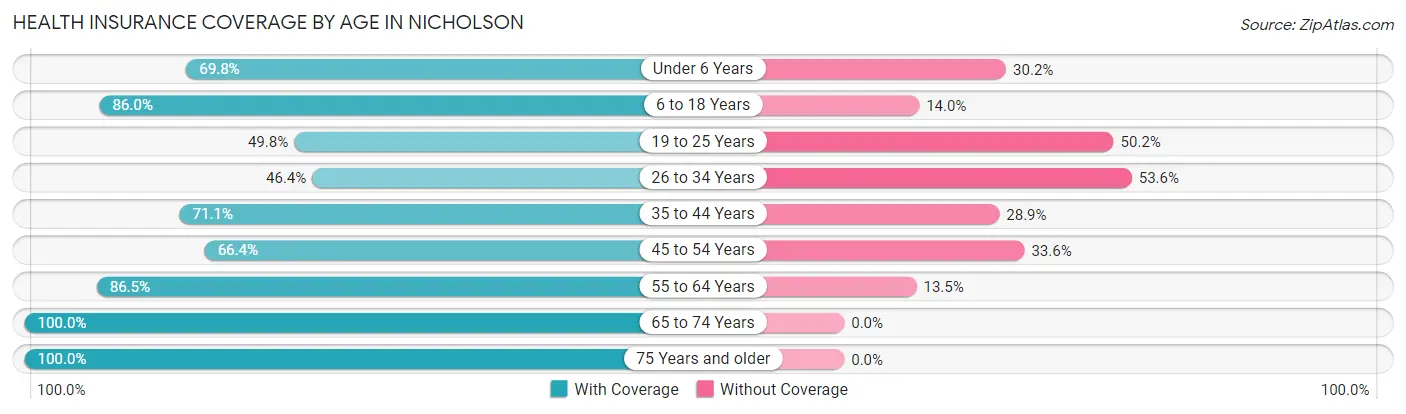
| Age Bracket | With Coverage | Without Coverage |
| Under 6 Years | 118 (69.8%) | 51 (30.2%) |
| 6 to 18 Years | 154 (86.0%) | 25 (14.0%) |
| 19 to 25 Years | 109 (49.8%) | 110 (50.2%) |
| 26 to 34 Years | 128 (46.4%) | 148 (53.6%) |
| 35 to 44 Years | 145 (71.1%) | 59 (28.9%) |
| 45 to 54 Years | 164 (66.4%) | 83 (33.6%) |
| 55 to 64 Years | 456 (86.5%) | 71 (13.5%) |
| 65 to 74 Years | 237 (100.0%) | 0 (0.0%) |
| 75 Years and older | 171 (100.0%) | 0 (0.0%) |
| Total | 1,682 (75.5%) | 547 (24.5%) |
Health Insurance Coverage by Citizenship Status in Nicholson
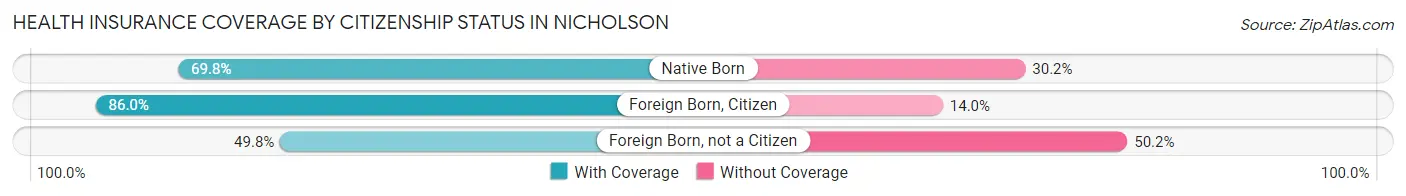
| Citizenship Status | With Coverage | Without Coverage |
| Native Born | 118 (69.8%) | 51 (30.2%) |
| Foreign Born, Citizen | 154 (86.0%) | 25 (14.0%) |
| Foreign Born, not a Citizen | 109 (49.8%) | 110 (50.2%) |
Health Insurance Coverage by Household Income in Nicholson
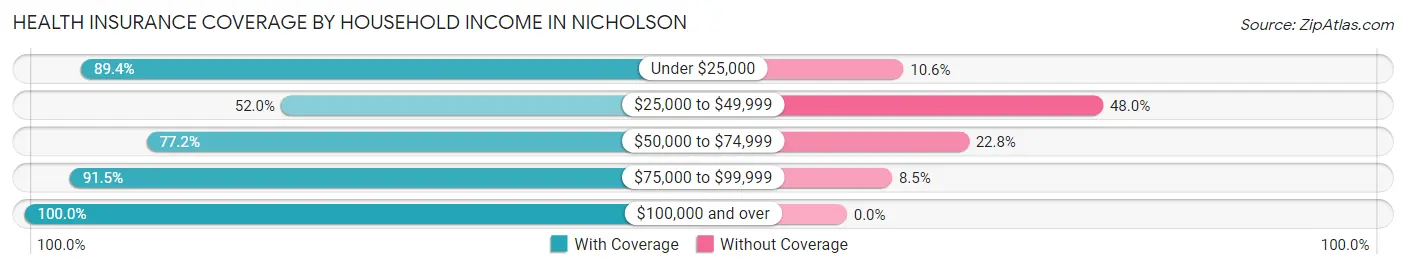
| Household Income | With Coverage | Without Coverage |
| Under $25,000 | 405 (89.4%) | 48 (10.6%) |
| $25,000 to $49,999 | 390 (52.0%) | 360 (48.0%) |
| $50,000 to $74,999 | 419 (77.2%) | 124 (22.8%) |
| $75,000 to $99,999 | 162 (91.5%) | 15 (8.5%) |
| $100,000 and over | 306 (100.0%) | 0 (0.0%) |
Public vs Private Health Insurance Coverage by Age in Nicholson
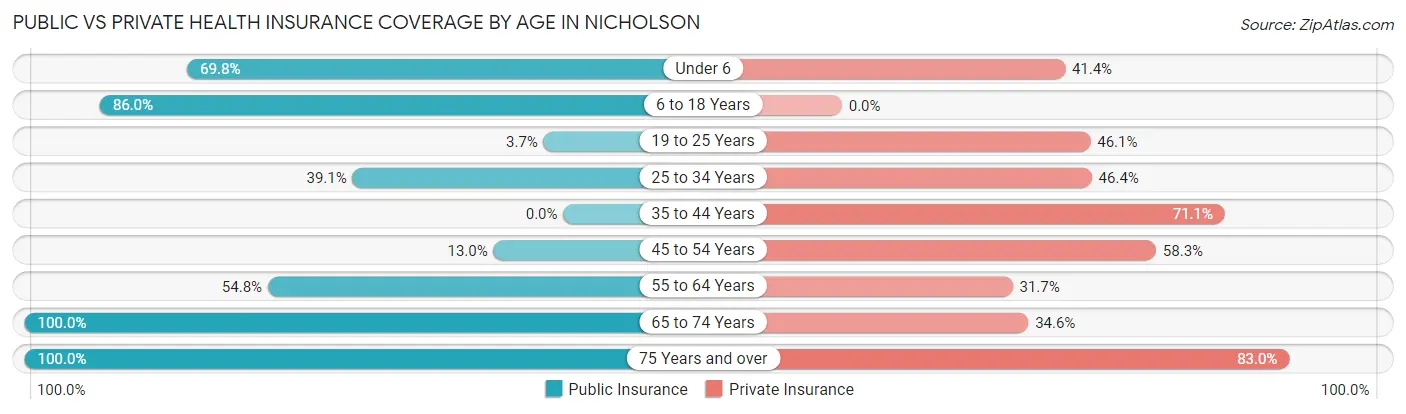
| Age Bracket | Public Insurance | Private Insurance |
| Under 6 | 118 (69.8%) | 70 (41.4%) |
| 6 to 18 Years | 154 (86.0%) | 0 (0.0%) |
| 19 to 25 Years | 8 (3.6%) | 101 (46.1%) |
| 25 to 34 Years | 108 (39.1%) | 128 (46.4%) |
| 35 to 44 Years | 0 (0.0%) | 145 (71.1%) |
| 45 to 54 Years | 32 (13.0%) | 144 (58.3%) |
| 55 to 64 Years | 289 (54.8%) | 167 (31.7%) |
| 65 to 74 Years | 237 (100.0%) | 82 (34.6%) |
| 75 Years and over | 171 (100.0%) | 142 (83.0%) |
| Total | 1,117 (50.1%) | 979 (43.9%) |
Disability Status by Sex by Age in Nicholson
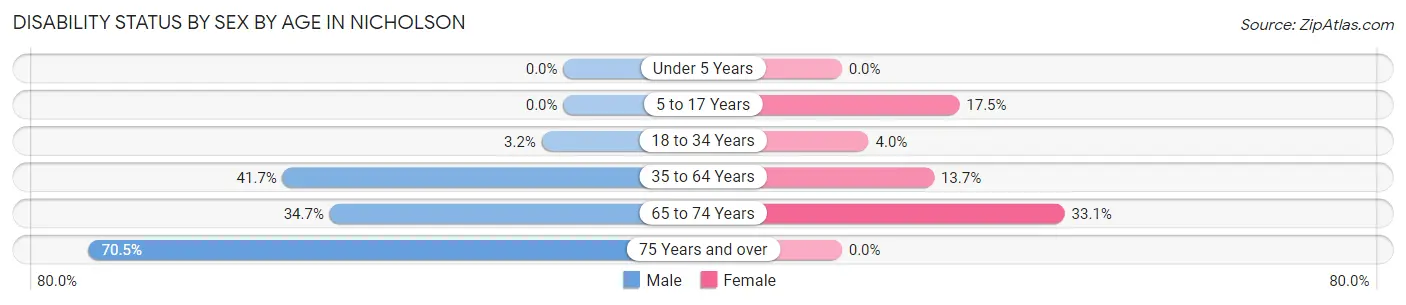
| Age Bracket | Male | Female |
| Under 5 Years | 0 (0.0%) | 0 (0.0%) |
| 5 to 17 Years | 0 (0.0%) | 22 (17.5%) |
| 18 to 34 Years | 10 (3.2%) | 8 (4.0%) |
| 35 to 64 Years | 228 (41.7%) | 59 (13.7%) |
| 65 to 74 Years | 34 (34.7%) | 46 (33.1%) |
| 75 Years and over | 43 (70.5%) | 0 (0.0%) |
Disability Class by Sex by Age in Nicholson
Disability Class: Hearing Difficulty
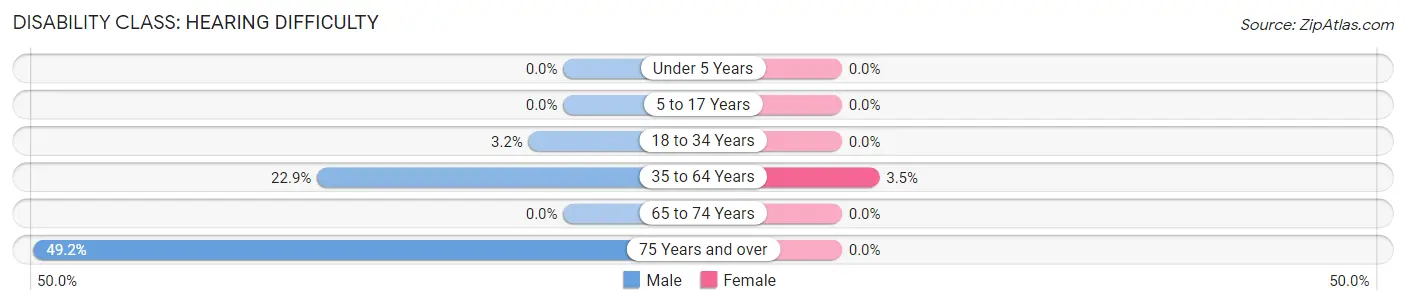
| Age Bracket | Male | Female |
| Under 5 Years | 0 (0.0%) | 0 (0.0%) |
| 5 to 17 Years | 0 (0.0%) | 0 (0.0%) |
| 18 to 34 Years | 10 (3.2%) | 0 (0.0%) |
| 35 to 64 Years | 125 (22.9%) | 15 (3.5%) |
| 65 to 74 Years | 0 (0.0%) | 0 (0.0%) |
| 75 Years and over | 30 (49.2%) | 0 (0.0%) |
Disability Class: Vision Difficulty
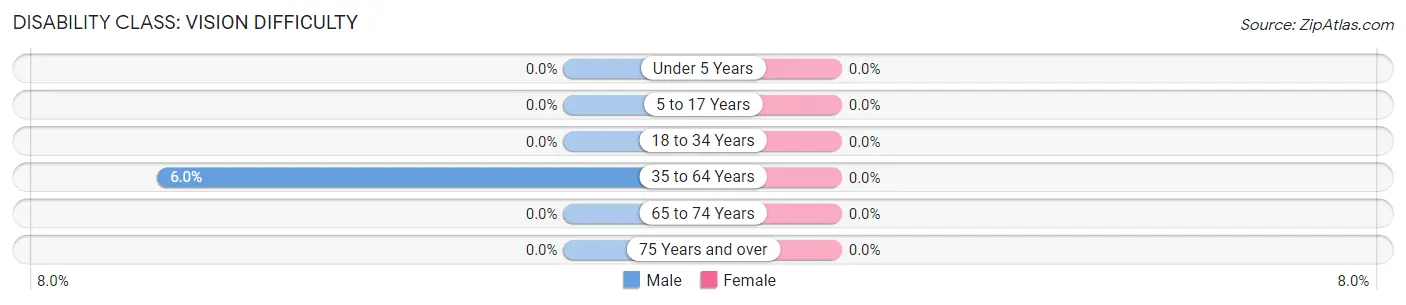
| Age Bracket | Male | Female |
| Under 5 Years | 0 (0.0%) | 0 (0.0%) |
| 5 to 17 Years | 0 (0.0%) | 0 (0.0%) |
| 18 to 34 Years | 0 (0.0%) | 0 (0.0%) |
| 35 to 64 Years | 33 (6.0%) | 0 (0.0%) |
| 65 to 74 Years | 0 (0.0%) | 0 (0.0%) |
| 75 Years and over | 0 (0.0%) | 0 (0.0%) |
Disability Class: Cognitive Difficulty
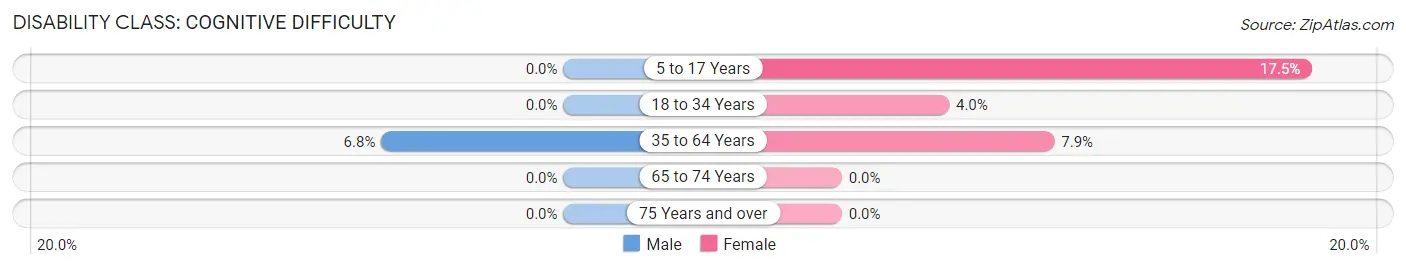
| Age Bracket | Male | Female |
| 5 to 17 Years | 0 (0.0%) | 22 (17.5%) |
| 18 to 34 Years | 0 (0.0%) | 8 (4.0%) |
| 35 to 64 Years | 37 (6.8%) | 34 (7.9%) |
| 65 to 74 Years | 0 (0.0%) | 0 (0.0%) |
| 75 Years and over | 0 (0.0%) | 0 (0.0%) |
Disability Class: Ambulatory Difficulty
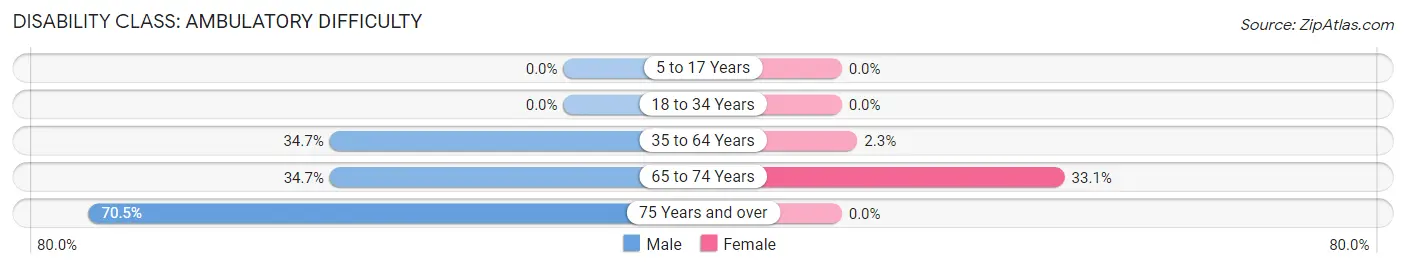
| Age Bracket | Male | Female |
| 5 to 17 Years | 0 (0.0%) | 0 (0.0%) |
| 18 to 34 Years | 0 (0.0%) | 0 (0.0%) |
| 35 to 64 Years | 190 (34.7%) | 10 (2.3%) |
| 65 to 74 Years | 34 (34.7%) | 46 (33.1%) |
| 75 Years and over | 43 (70.5%) | 0 (0.0%) |
Disability Class: Self-Care Difficulty
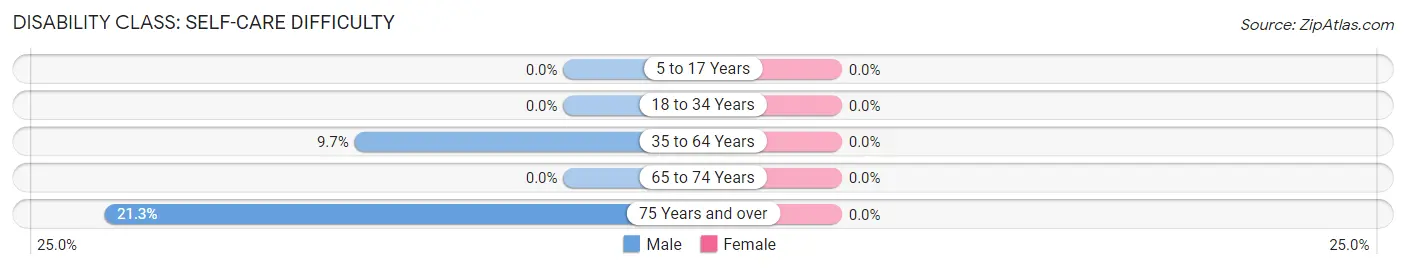
| Age Bracket | Male | Female |
| 5 to 17 Years | 0 (0.0%) | 0 (0.0%) |
| 18 to 34 Years | 0 (0.0%) | 0 (0.0%) |
| 35 to 64 Years | 53 (9.7%) | 0 (0.0%) |
| 65 to 74 Years | 0 (0.0%) | 0 (0.0%) |
| 75 Years and over | 13 (21.3%) | 0 (0.0%) |
Technology Access in Nicholson
Computing Device Access in Nicholson
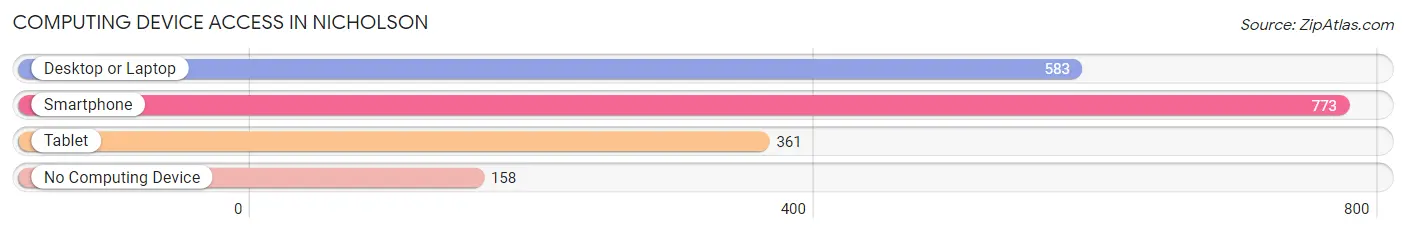
| Device Type | # Households | % Households |
| Desktop or Laptop | 583 | 54.4% |
| Smartphone | 773 | 72.1% |
| Tablet | 361 | 33.7% |
| No Computing Device | 158 | 14.7% |
| Total | 1,072 | 100.0% |
Internet Access in Nicholson
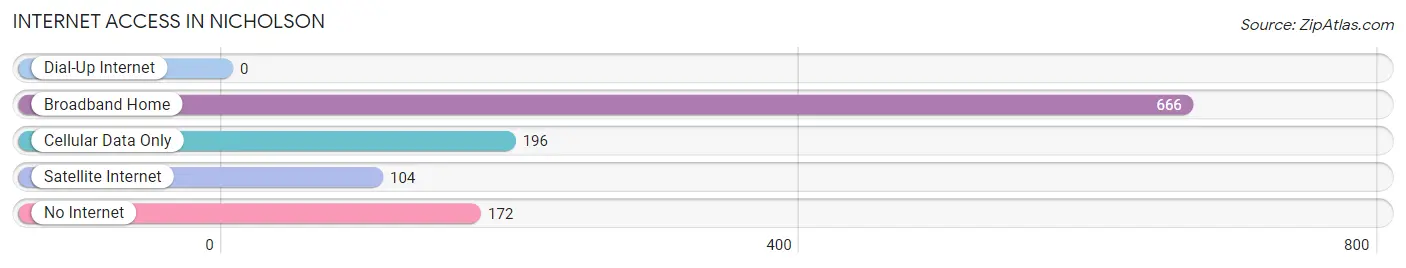
| Internet Type | # Households | % Households |
| Dial-Up Internet | 0 | 0.0% |
| Broadband Home | 666 | 62.1% |
| Cellular Data Only | 196 | 18.3% |
| Satellite Internet | 104 | 9.7% |
| No Internet | 172 | 16.0% |
| Total | 1,072 | 100.0% |
Nicholson Summary
MS History
Mississippi is a state located in the southeastern region of the United States. It is bordered by Tennessee to the north, Alabama to the east, the Gulf of Mexico to the south, and Louisiana and Arkansas to the west. Mississippi has a rich and diverse history that dates back to the early Native American tribes that inhabited the area. The first Europeans to explore the region were the Spanish, who arrived in the 16th century. The French then established a colony in the area in the 17th century, and the British took control of the region in the 18th century. Mississippi became part of the United States in 1817, and it was the 20th state to join the Union.
Mississippi has a long and complicated history of racial tension and civil rights struggles. The state was a major center of the slave trade in the antebellum period, and it was the site of some of the most violent episodes of the Civil War. After the war, Mississippi was the first state to ratify the 13th Amendment, which abolished slavery. However, the state also enacted a number of laws that were designed to keep African Americans from exercising their rights as citizens. This included the infamous Jim Crow laws, which were in effect until the mid-1960s. During this time, Mississippi was also the site of some of the most significant civil rights struggles in the nation, including the Freedom Rides and the 1964 Freedom Summer.
In the late 20th century, Mississippi began to make strides in civil rights and racial equality. The state elected its first African American governor in 1999, and it has since become a leader in civil rights legislation. Mississippi has also become a major center of the music industry, with a thriving blues and gospel scene.
Geography
Mississippi is located in the southeastern region of the United States. It is bordered by Tennessee to the north, Alabama to the east, the Gulf of Mexico to the south, and Louisiana and Arkansas to the west. Mississippi is the 32nd largest state in the country, with an area of 48,430 square miles. The state is divided into three distinct regions: the Gulf Coast, the Mississippi Delta, and the Hill Country.
The Gulf Coast region is located along the Gulf of Mexico and is home to some of the state’s most popular tourist destinations, including Biloxi, Gulfport, and Pascagoula. This region is known for its white sand beaches, seafood restaurants, and casinos. The Mississippi Delta is located in the northwestern part of the state and is known for its rich agricultural land and cotton production. The Hill Country is located in the northeastern part of the state and is home to the state capital, Jackson.
Economy
Mississippi has a diverse economy that is driven by agriculture, manufacturing, and tourism. Agriculture is the state’s largest industry, with cotton, soybeans, and rice being the main crops. Manufacturing is also an important part of the state’s economy, with the automotive, aerospace, and chemical industries being the largest employers. Tourism is also a major contributor to the state’s economy, with visitors coming to the state to enjoy its beaches, casinos, and other attractions.
Demographics
As of 2019, Mississippi had an estimated population of 2,976,149. The state is predominantly white, with African Americans making up 37.3% of the population. Other racial groups include Hispanics (3.7%), Asians (1.2%), and Native Americans (0.7%). The median household income in the state is $41,754, and the median age is 37.7 years. The state’s largest cities are Jackson, Gulfport, and Biloxi.
Common Questions
What is Per Capita Income in Nicholson?
Per Capita income in Nicholson is $24,512.
What is the Median Family Income in Nicholson?
Median Family Income in Nicholson is $48,772.
What is the Median Household income in Nicholson?
Median Household Income in Nicholson is $42,738.
What is Income or Wage Gap in Nicholson?
Income or Wage Gap in Nicholson is 15.7%.
Women in Nicholson earn 84.3 cents for every dollar earned by a man.
What is Inequality or Gini Index in Nicholson?
Inequality or Gini Index in Nicholson is 0.40.
What is the Total Population of Nicholson?
Total Population of Nicholson is 2,229.
What is the Total Male Population of Nicholson?
Total Male Population of Nicholson is 1,164.
What is the Total Female Population of Nicholson?
Total Female Population of Nicholson is 1,065.
What is the Ratio of Males per 100 Females in Nicholson?
There are 109.30 Males per 100 Females in Nicholson.
What is the Ratio of Females per 100 Males in Nicholson?
There are 91.49 Females per 100 Males in Nicholson.
What is the Median Population Age in Nicholson?
Median Population Age in Nicholson is 48.0 Years.
What is the Average Family Size in Nicholson
Average Family Size in Nicholson is 2.6 People.
What is the Average Household Size in Nicholson
Average Household Size in Nicholson is 2.1 People.
How Large is the Labor Force in Nicholson?
There are 1,178 People in the Labor Forcein in Nicholson.
What is the Percentage of People in the Labor Force in Nicholson?
61.7% of People are in the Labor Force in Nicholson.
What is the Unemployment Rate in Nicholson?
Unemployment Rate in Nicholson is 3.2%.