Zip Codes with the Highest Percentage of Population Employed in Food Preparation & Serving in Vicksburg, MS
RELATED REPORTS & OPTIONS
Food Preparation & Serving
Vicksburg
Compare Zip Codes
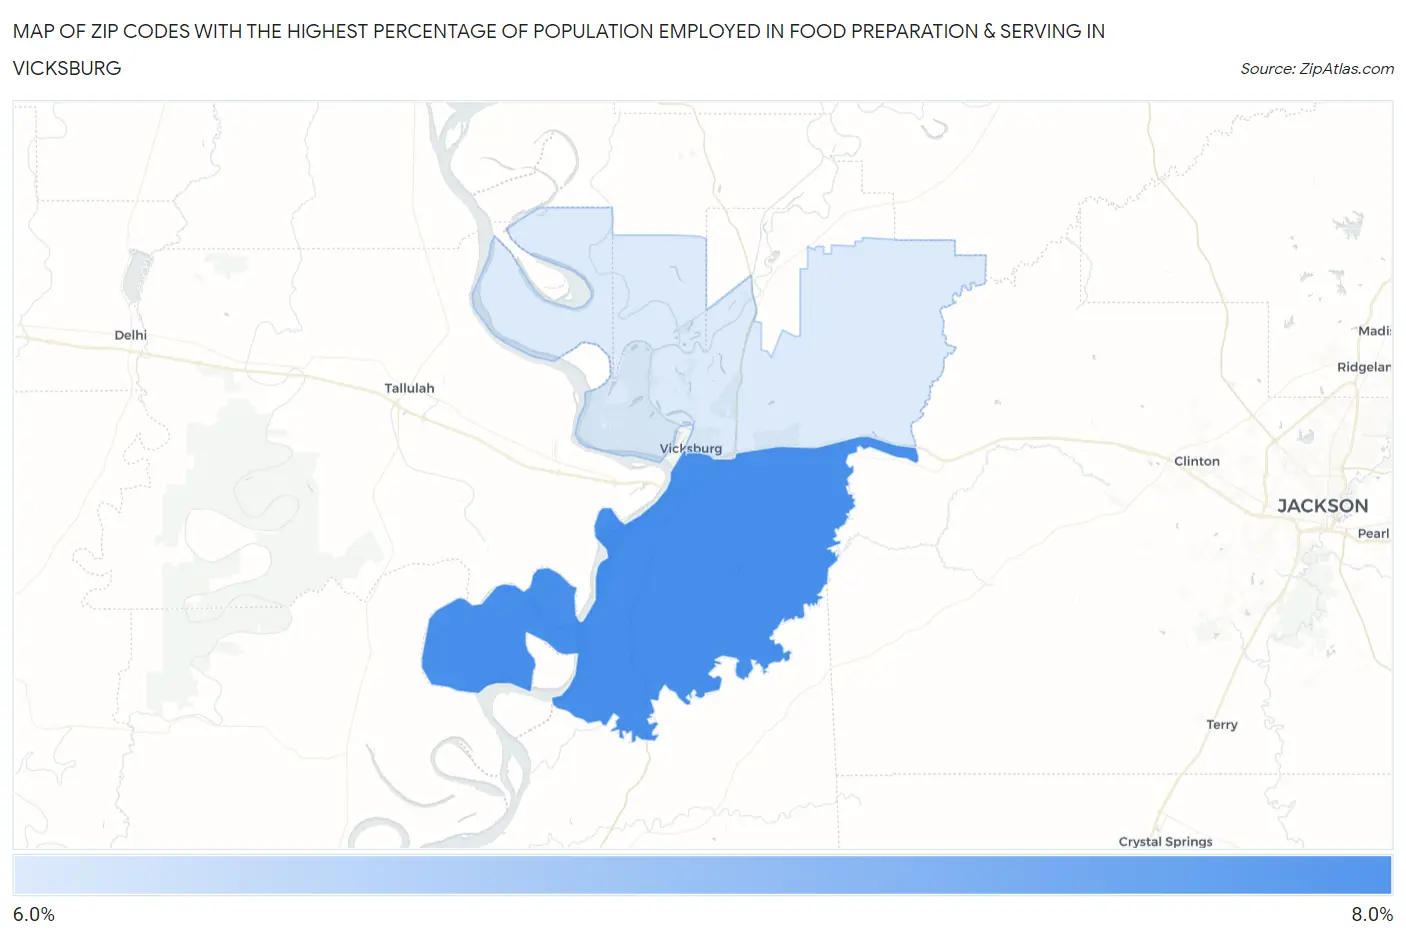
Map of Zip Codes with the Highest Percentage of Population Employed in Food Preparation & Serving in Vicksburg
6.4%
6.6%
Zip Codes with the Highest Percentage of Population Employed in Food Preparation & Serving in Vicksburg, MS
| Zip Code | % Employed | vs State | vs National | |
| 1. | 39180 | 6.6% | 5.6%(+1.00)#101 | 5.3%(+1.31)#7,616 |
| 2. | 39183 | 6.4% | 5.6%(+0.857)#106 | 5.3%(+1.16)#8,011 |
1
Common Questions
What are the Top Zip Codes with the Highest Percentage of Population Employed in Food Preparation & Serving in Vicksburg, MS?
Top Zip Codes with the Highest Percentage of Population Employed in Food Preparation & Serving in Vicksburg, MS are:
What zip code has the Highest Percentage of Population Employed in Food Preparation & Serving in Vicksburg, MS?
39180 has the Highest Percentage of Population Employed in Food Preparation & Serving in Vicksburg, MS with 6.6%.
What is the Percentage of Population Employed in Food Preparation & Serving in Vicksburg, MS?
Percentage of Population Employed in Food Preparation & Serving in Vicksburg is 7.8%.
What is the Percentage of Population Employed in Food Preparation & Serving in Mississippi?
Percentage of Population Employed in Food Preparation & Serving in Mississippi is 5.6%.
What is the Percentage of Population Employed in Food Preparation & Serving in the United States?
Percentage of Population Employed in Food Preparation & Serving in the United States is 5.3%.