Hurley, MS Map & Demographics
Hurley Map
Hurley Overview
$28,768
PER CAPITA INCOME
$64,000
AVG FAMILY INCOME
$81,083
AVG HOUSEHOLD INCOME
56.7%
WAGE / INCOME GAP [ % ]
43.3¢/ $1
WAGE / INCOME GAP [ $ ]
0.36
INEQUALITY / GINI INDEX
1,391
TOTAL POPULATION
647
MALE POPULATION
744
FEMALE POPULATION
86.96
MALES / 100 FEMALES
114.99
FEMALES / 100 MALES
36.0
MEDIAN AGE
2.7
AVG FAMILY SIZE
2.7
AVG HOUSEHOLD SIZE
709
LABOR FORCE [ PEOPLE ]
63.0%
PERCENT IN LABOR FORCE
1.3%
UNEMPLOYMENT RATE
Hurley Area Codes
Income in Hurley
Income Overview in Hurley
Per Capita Income in Hurley is $28,768, while median incomes of families and households are $64,000 and $81,083 respectively.
| Characteristic | Number | Measure |
| Per Capita Income | 1,391 | $28,768 |
| Median Family Income | 374 | $64,000 |
| Mean Family Income | 374 | $78,232 |
| Median Household Income | 509 | $81,083 |
| Mean Household Income | 509 | $79,745 |
| Income Deficit | 374 | $0 |
| Wage / Income Gap (%) | 1,391 | 56.66% |
| Wage / Income Gap ($) | 1,391 | 43.34¢ per $1 |
| Gini / Inequality Index | 1,391 | 0.36 |
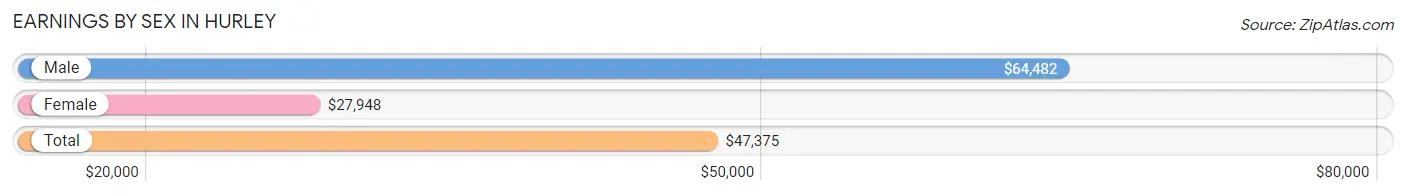
Earnings by Sex in Hurley
Average Earnings in Hurley are $47,375, $64,482 for men and $27,948 for women, a difference of 56.7%.
| Sex | Number | Average Earnings |
| Male | 357 (45.1%) | $64,482 |
| Female | 435 (54.9%) | $27,948 |
| Total | 792 (100.0%) | $47,375 |
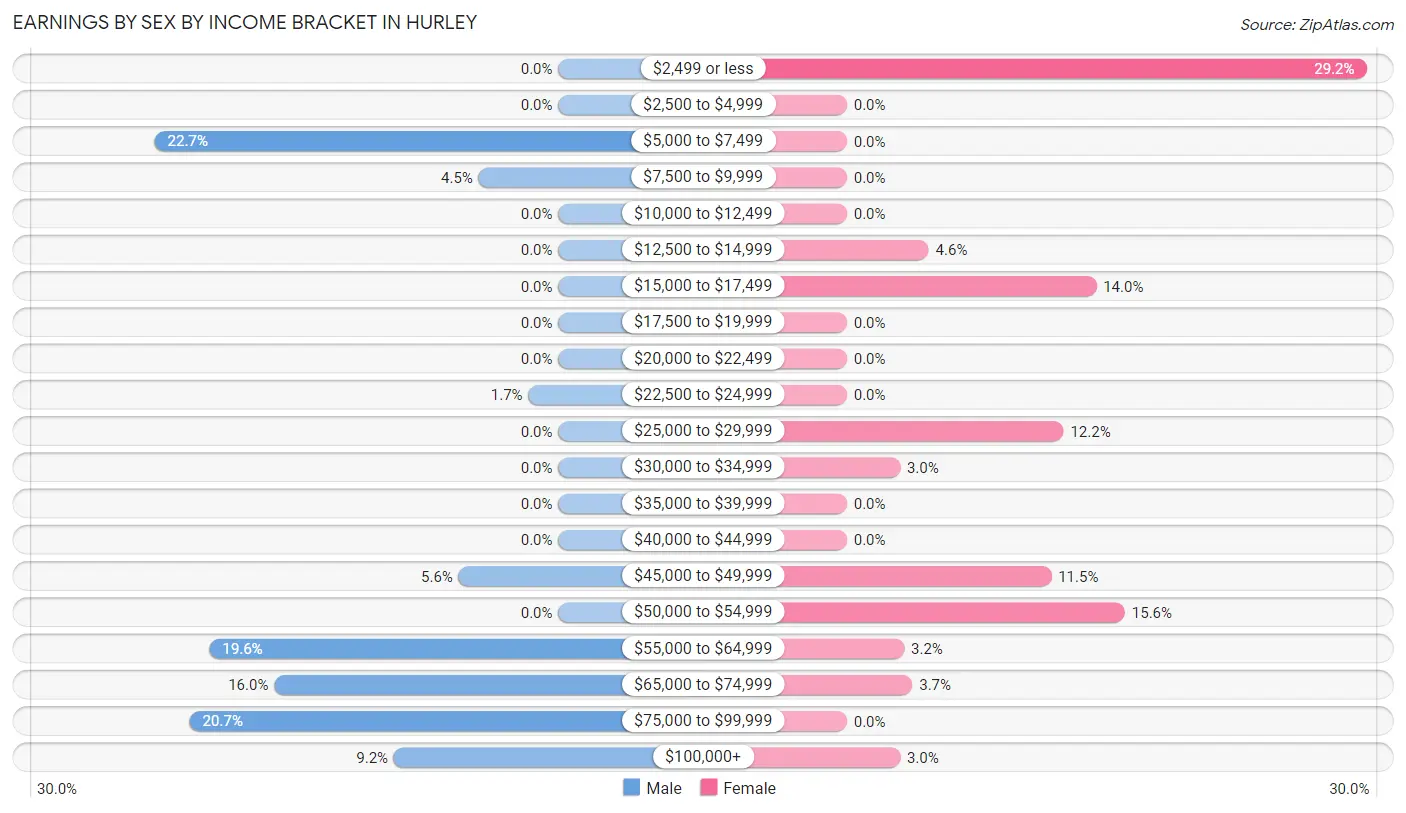
Earnings by Sex by Income Bracket in Hurley
The most common earnings brackets in Hurley are $5,000 to $7,499 for men (81 | 22.7%) and $2,499 or less for women (127 | 29.2%).
| Income | Male | Female |
| $2,499 or less | 0 (0.0%) | 127 (29.2%) |
| $2,500 to $4,999 | 0 (0.0%) | 0 (0.0%) |
| $5,000 to $7,499 | 81 (22.7%) | 0 (0.0%) |
| $7,500 to $9,999 | 16 (4.5%) | 0 (0.0%) |
| $10,000 to $12,499 | 0 (0.0%) | 0 (0.0%) |
| $12,500 to $14,999 | 0 (0.0%) | 20 (4.6%) |
| $15,000 to $17,499 | 0 (0.0%) | 61 (14.0%) |
| $17,500 to $19,999 | 0 (0.0%) | 0 (0.0%) |
| $20,000 to $22,499 | 0 (0.0%) | 0 (0.0%) |
| $22,500 to $24,999 | 6 (1.7%) | 0 (0.0%) |
| $25,000 to $29,999 | 0 (0.0%) | 53 (12.2%) |
| $30,000 to $34,999 | 0 (0.0%) | 13 (3.0%) |
| $35,000 to $39,999 | 0 (0.0%) | 0 (0.0%) |
| $40,000 to $44,999 | 0 (0.0%) | 0 (0.0%) |
| $45,000 to $49,999 | 20 (5.6%) | 50 (11.5%) |
| $50,000 to $54,999 | 0 (0.0%) | 68 (15.6%) |
| $55,000 to $64,999 | 70 (19.6%) | 14 (3.2%) |
| $65,000 to $74,999 | 57 (16.0%) | 16 (3.7%) |
| $75,000 to $99,999 | 74 (20.7%) | 0 (0.0%) |
| $100,000+ | 33 (9.2%) | 13 (3.0%) |
| Total | 357 (100.0%) | 435 (100.0%) |
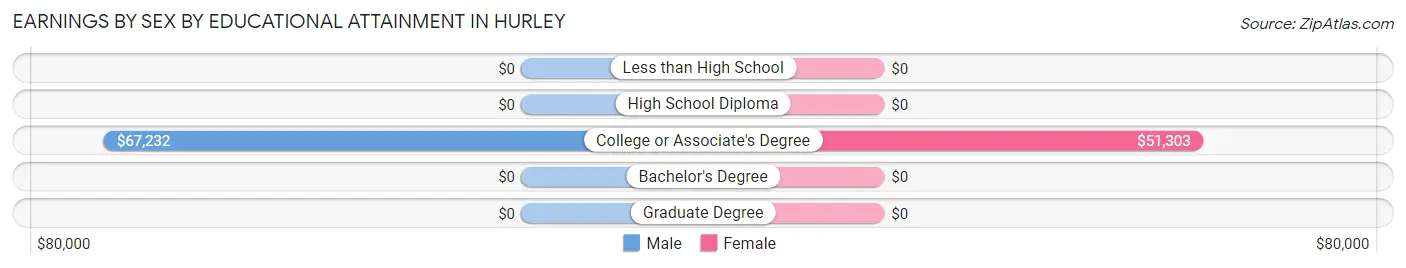
Earnings by Sex by Educational Attainment in Hurley
| Educational Attainment | Male Income | Female Income |
| Less than High School | - | - |
| High School Diploma | - | - |
| College or Associate's Degree | $67,232 | $51,303 |
| Bachelor's Degree | - | - |
| Graduate Degree | - | - |
| Total | $65,744 | $0 |
Family Income in Hurley
Family Income Brackets in Hurley
According to the Hurley family income data, there are 120 families falling into the $50,000 to $74,999 income range, which is the most common income bracket and makes up 32.1% of all families.
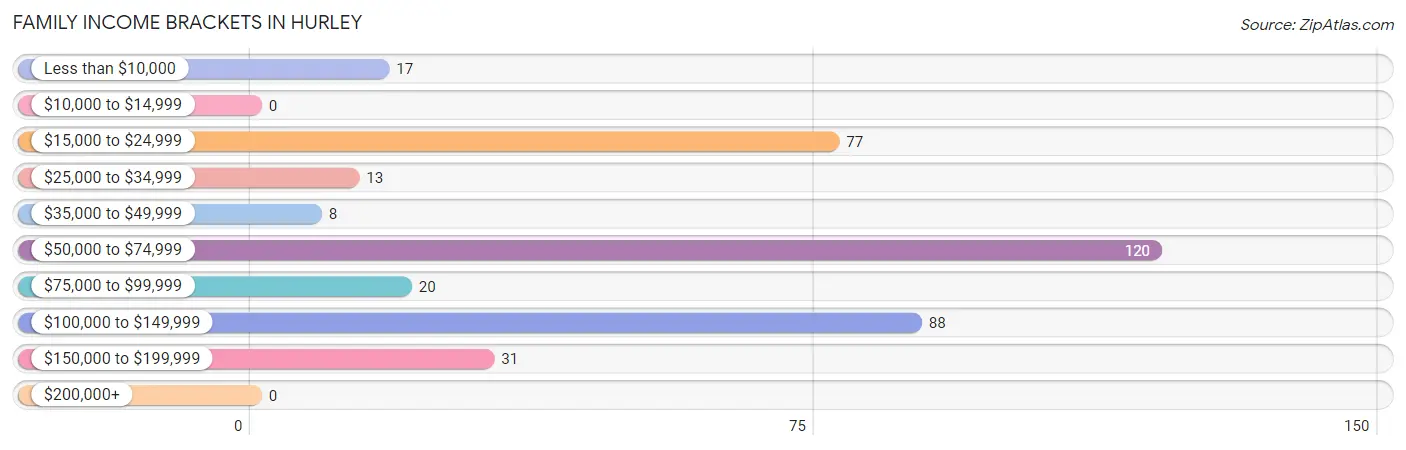
| Income Bracket | # Families | % Families |
| Less than $10,000 | 17 | 4.5% |
| $10,000 to $14,999 | 0 | 0.0% |
| $15,000 to $24,999 | 77 | 20.6% |
| $25,000 to $34,999 | 13 | 3.5% |
| $35,000 to $49,999 | 8 | 2.1% |
| $50,000 to $74,999 | 120 | 32.1% |
| $75,000 to $99,999 | 20 | 5.3% |
| $100,000 to $149,999 | 88 | 23.5% |
| $150,000 to $199,999 | 31 | 8.3% |
| $200,000+ | 0 | 0.0% |
Family Income by Famaliy Size in Hurley
4-person families (49 | 13.1%) account for the highest median family income in Hurley with $123,365 per family, while 4-person families (49 | 13.1%) have the highest median income of $30,841 per family member.
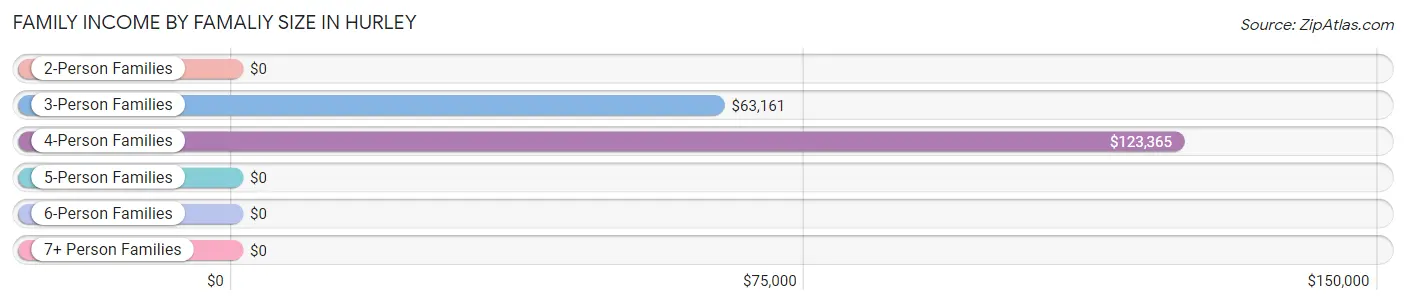
| Income Bracket | # Families | Median Income |
| 2-Person Families | 150 (40.1%) | $0 |
| 3-Person Families | 175 (46.8%) | $63,161 |
| 4-Person Families | 49 (13.1%) | $123,365 |
| 5-Person Families | 0 (0.0%) | $0 |
| 6-Person Families | 0 (0.0%) | $0 |
| 7+ Person Families | 0 (0.0%) | $0 |
| Total | 374 (100.0%) | $64,000 |
Family Income by Number of Earners in Hurley
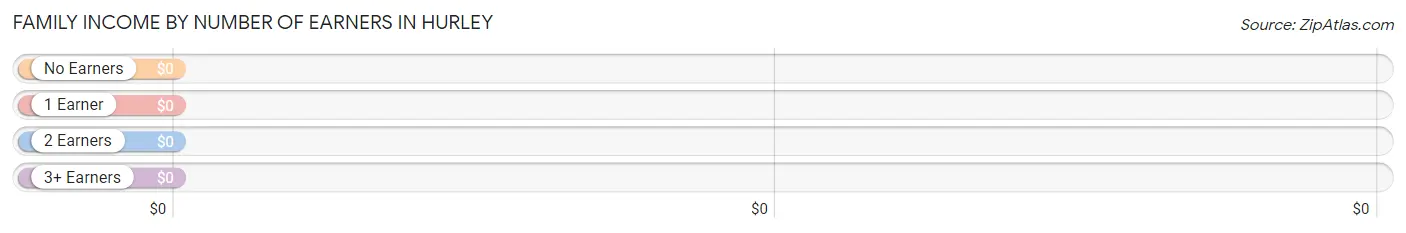
| Number of Earners | # Families | Median Income |
| No Earners | 16 (4.3%) | $0 |
| 1 Earner | 187 (50.0%) | $0 |
| 2 Earners | 151 (40.4%) | $0 |
| 3+ Earners | 20 (5.3%) | $0 |
| Total | 374 (100.0%) | $64,000 |
Household Income in Hurley
Household Income Brackets in Hurley
With 153 households falling in the category, the $100,000 to $149,999 income range is the most frequent in Hurley, accounting for 30.1% of all households.
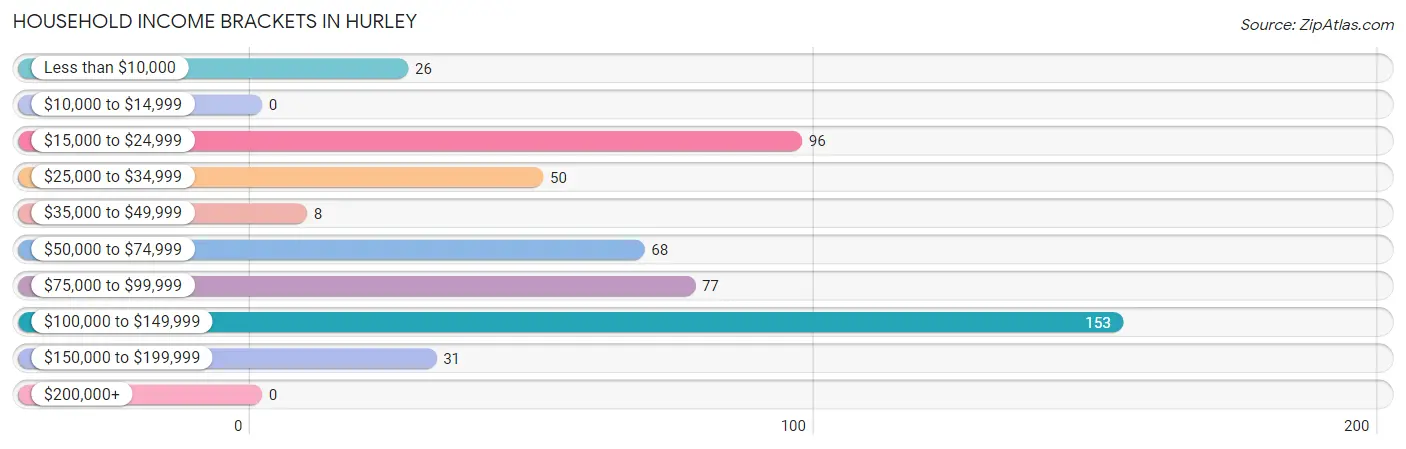
| Income Bracket | # Households | % Households |
| Less than $10,000 | 26 | 5.1% |
| $10,000 to $14,999 | 0 | 0.0% |
| $15,000 to $24,999 | 96 | 18.9% |
| $25,000 to $34,999 | 50 | 9.8% |
| $35,000 to $49,999 | 8 | 1.6% |
| $50,000 to $74,999 | 68 | 13.4% |
| $75,000 to $99,999 | 77 | 15.1% |
| $100,000 to $149,999 | 153 | 30.1% |
| $150,000 to $199,999 | 31 | 6.1% |
| $200,000+ | 0 | 0.0% |
Household Income by Householder Age in Hurley
The median household income in Hurley is $81,083, with the highest median household income of $96,696 found in the 25 to 44 years age bracket for the primary householder. A total of 117 households (23.0%) fall into this category.
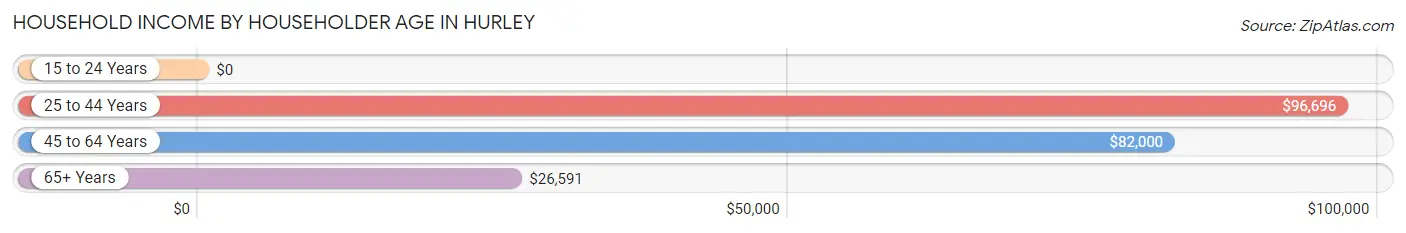
| Income Bracket | # Households | Median Income |
| 15 to 24 Years | 0 (0.0%) | $0 |
| 25 to 44 Years | 117 (23.0%) | $96,696 |
| 45 to 64 Years | 324 (63.6%) | $82,000 |
| 65+ Years | 68 (13.4%) | $26,591 |
| Total | 509 (100.0%) | $81,083 |
Poverty in Hurley
Income Below Poverty by Sex and Age in Hurley
With 23.6% poverty level for males and 30.0% for females among the residents of Hurley, 18 to 24 year old males and 18 to 24 year old females are the most vulnerable to poverty, with 90 males (100.0%) and 65 females (92.9%) in their respective age groups living below the poverty level.
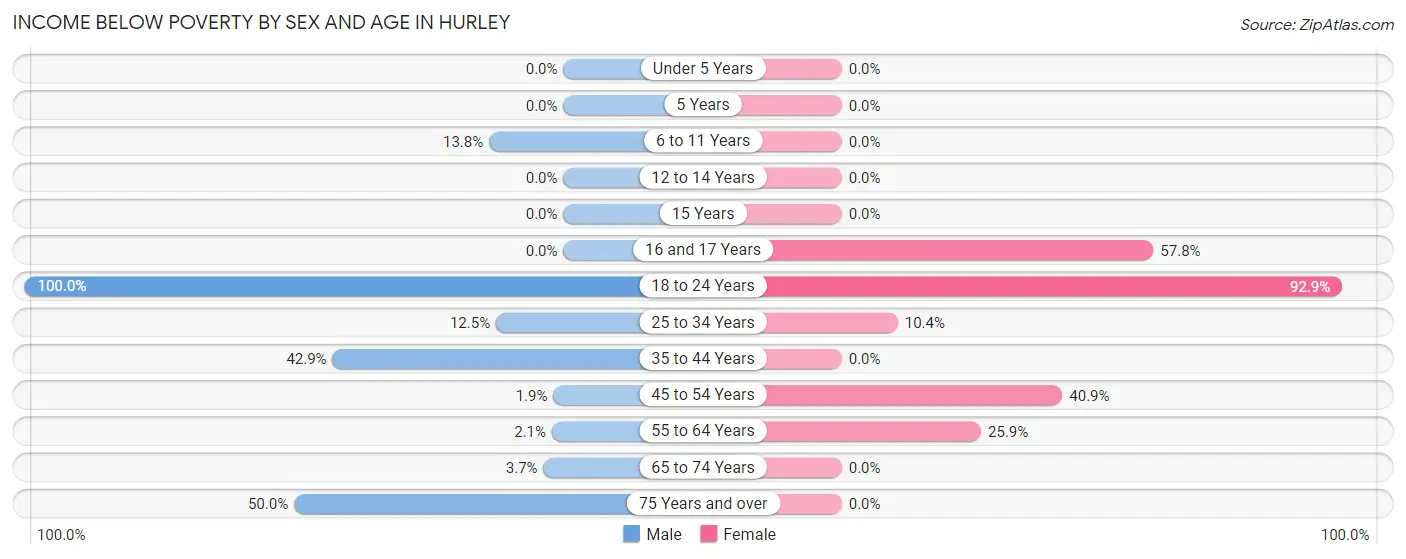
| Age Bracket | Male | Female |
| Under 5 Years | 0 (0.0%) | 0 (0.0%) |
| 5 Years | 0 (0.0%) | 0 (0.0%) |
| 6 to 11 Years | 8 (13.8%) | 0 (0.0%) |
| 12 to 14 Years | 0 (0.0%) | 0 (0.0%) |
| 15 Years | 0 (0.0%) | 0 (0.0%) |
| 16 and 17 Years | 0 (0.0%) | 59 (57.8%) |
| 18 to 24 Years | 90 (100.0%) | 65 (92.9%) |
| 25 to 34 Years | 6 (12.5%) | 8 (10.4%) |
| 35 to 44 Years | 36 (42.9%) | 0 (0.0%) |
| 45 to 54 Years | 2 (1.9%) | 61 (40.9%) |
| 55 to 64 Years | 2 (2.1%) | 30 (25.9%) |
| 65 to 74 Years | 1 (3.7%) | 0 (0.0%) |
| 75 Years and over | 8 (50.0%) | 0 (0.0%) |
| Total | 153 (23.6%) | 223 (30.0%) |
Income Above Poverty by Sex and Age in Hurley
According to the poverty statistics in Hurley, males aged 12 to 14 years and females aged 6 to 11 years are the age groups that are most secure financially, with 100.0% of males and 100.0% of females in these age groups living above the poverty line.
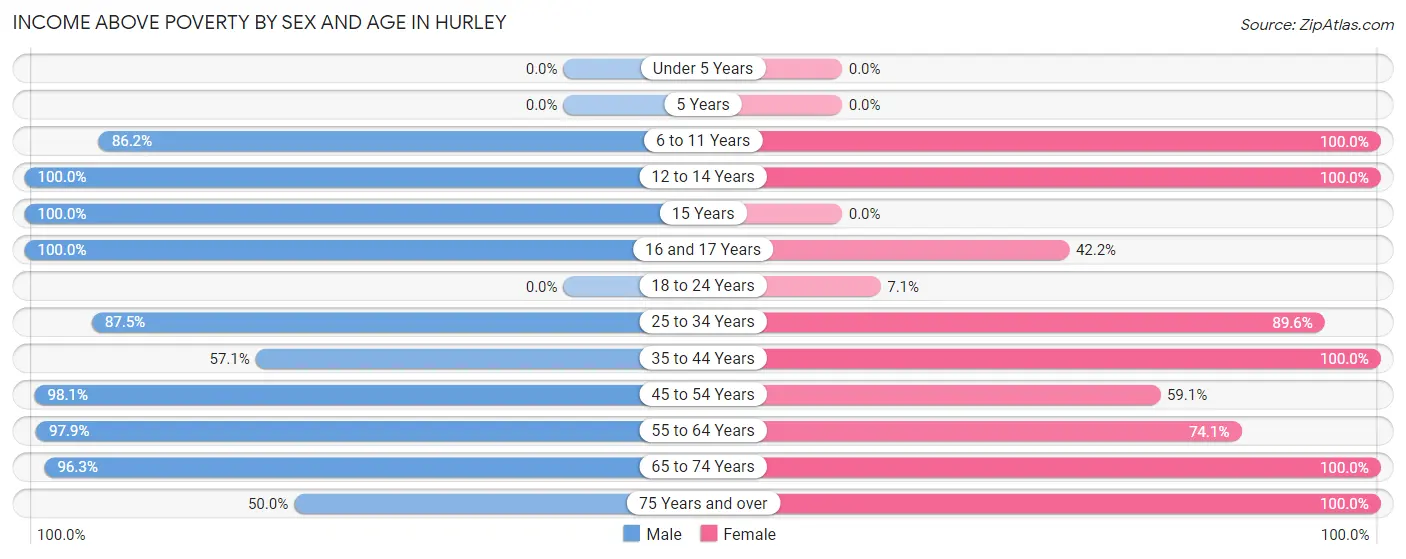
| Age Bracket | Male | Female |
| Under 5 Years | 0 (0.0%) | 0 (0.0%) |
| 5 Years | 0 (0.0%) | 0 (0.0%) |
| 6 to 11 Years | 50 (86.2%) | 62 (100.0%) |
| 12 to 14 Years | 96 (100.0%) | 38 (100.0%) |
| 15 Years | 11 (100.0%) | 0 (0.0%) |
| 16 and 17 Years | 16 (100.0%) | 43 (42.2%) |
| 18 to 24 Years | 0 (0.0%) | 5 (7.1%) |
| 25 to 34 Years | 42 (87.5%) | 69 (89.6%) |
| 35 to 44 Years | 48 (57.1%) | 64 (100.0%) |
| 45 to 54 Years | 105 (98.1%) | 88 (59.1%) |
| 55 to 64 Years | 92 (97.9%) | 86 (74.1%) |
| 65 to 74 Years | 26 (96.3%) | 41 (100.0%) |
| 75 Years and over | 8 (50.0%) | 25 (100.0%) |
| Total | 494 (76.3%) | 521 (70.0%) |
Income Below Poverty Among Married-Couple Families in Hurley
The poverty statistics for married-couple families in Hurley show that 5.0% or 8 of the total 160 families live below the poverty line. Families with 1 or 2 children have the highest poverty rate of 8.6%, comprising of 8 families. On the other hand, families with no children have the lowest poverty rate of 0.0%, which includes 0 families.
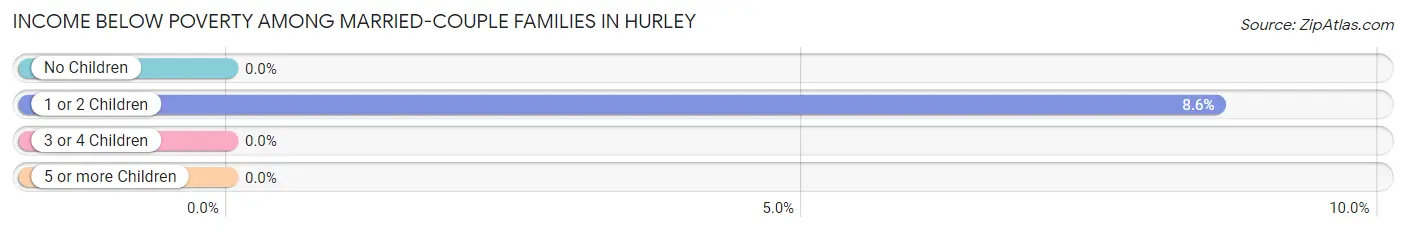
| Children | Above Poverty | Below Poverty |
| No Children | 67 (100.0%) | 0 (0.0%) |
| 1 or 2 Children | 85 (91.4%) | 8 (8.6%) |
| 3 or 4 Children | 0 (0.0%) | 0 (0.0%) |
| 5 or more Children | 0 (0.0%) | 0 (0.0%) |
| Total | 152 (95.0%) | 8 (5.0%) |
Income Below Poverty Among Single-Parent Households in Hurley
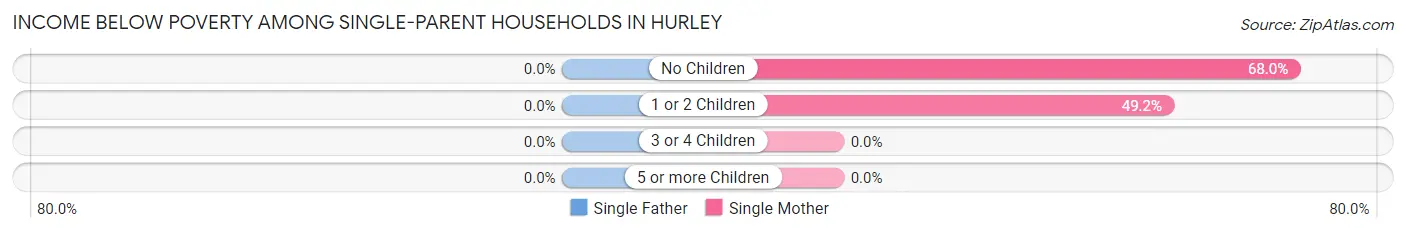
| Children | Single Father | Single Mother |
| No Children | 0 (0.0%) | 17 (68.0%) |
| 1 or 2 Children | 0 (0.0%) | 61 (49.2%) |
| 3 or 4 Children | 0 (0.0%) | 0 (0.0%) |
| 5 or more Children | 0 (0.0%) | 0 (0.0%) |
| Total | 0 (0.0%) | 78 (52.3%) |
Income Below Poverty Among Married-Couple vs Single-Parent Households in Hurley
The poverty data for Hurley shows that 8 of the married-couple family households (5.0%) and 78 of the single-parent households (36.4%) are living below the poverty level. Within the married-couple family households, those with 1 or 2 children have the highest poverty rate, with 8 households (8.6%) falling below the poverty line. Among the single-parent households, those with no children have the highest poverty rate, with 17 household (68.0%) living below poverty.
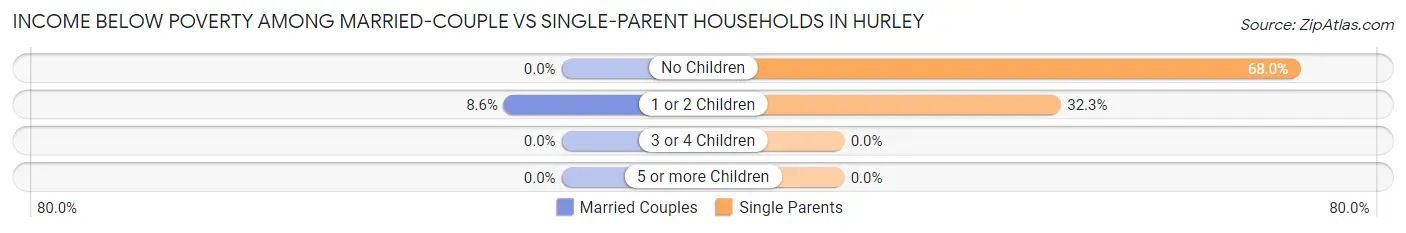
| Children | Married-Couple Families | Single-Parent Households |
| No Children | 0 (0.0%) | 17 (68.0%) |
| 1 or 2 Children | 8 (8.6%) | 61 (32.3%) |
| 3 or 4 Children | 0 (0.0%) | 0 (0.0%) |
| 5 or more Children | 0 (0.0%) | 0 (0.0%) |
| Total | 8 (5.0%) | 78 (36.4%) |
Race in Hurley
The most populous races in Hurley are White / Caucasian (1,363 | 98.0%), Hispanic or Latino (11 | 0.8%), and Some other Race (11 | 0.8%).
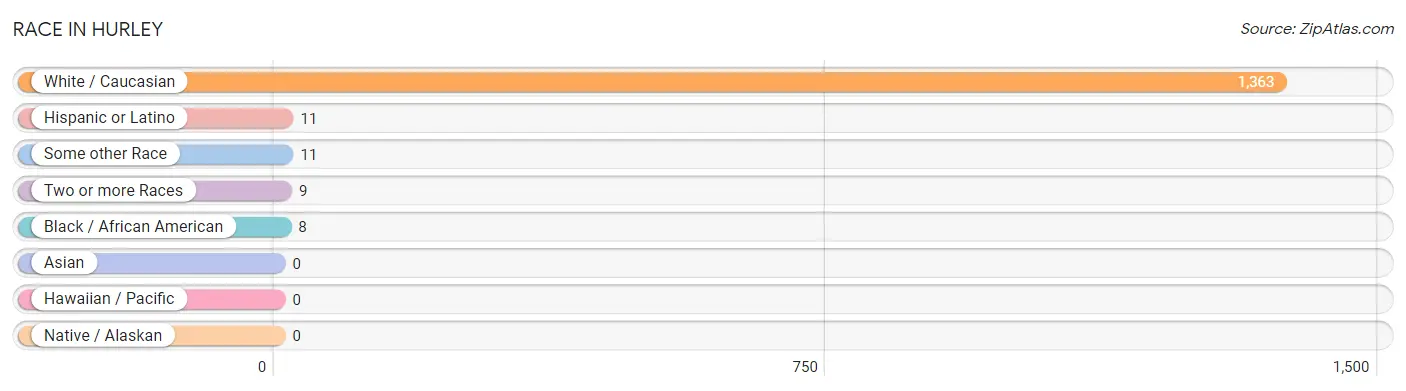
| Race | # Population | % Population |
| Asian | 0 | 0.0% |
| Black / African American | 8 | 0.6% |
| Hawaiian / Pacific | 0 | 0.0% |
| Hispanic or Latino | 11 | 0.8% |
| Native / Alaskan | 0 | 0.0% |
| White / Caucasian | 1,363 | 98.0% |
| Two or more Races | 9 | 0.6% |
| Some other Race | 11 | 0.8% |
| Total | 1,391 | 100.0% |
Ancestry in Hurley
The most populous ancestries reported in Hurley are American (287 | 20.6%), English (141 | 10.1%), Irish (40 | 2.9%), Ukrainian (35 | 2.5%), and Croatian (20 | 1.4%), together accounting for 37.6% of all Hurley residents.
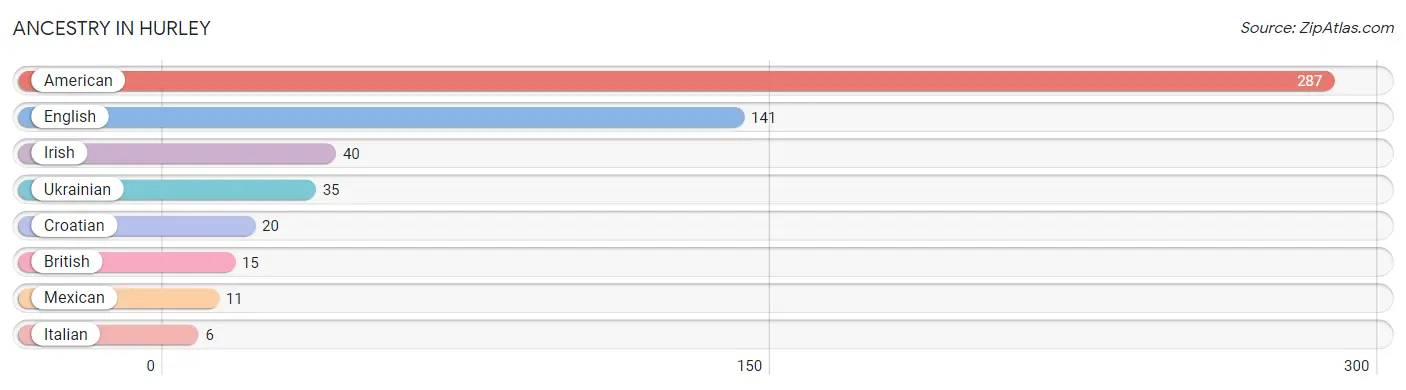
| Ancestry | # Population | % Population |
| American | 287 | 20.6% |
| British | 15 | 1.1% |
| Croatian | 20 | 1.4% |
| English | 141 | 10.1% |
| Irish | 40 | 2.9% |
| Italian | 6 | 0.4% |
| Mexican | 11 | 0.8% |
| Ukrainian | 35 | 2.5% | View All 8 Rows |
Immigrants in Hurley
The most numerous immigrant groups reported in Hurley came from Eastern Europe (35 | 2.5%), Europe (35 | 2.5%), Ukraine (35 | 2.5%), Central America (11 | 0.8%), and Latin America (11 | 0.8%), together accounting for 9.1% of all Hurley residents.
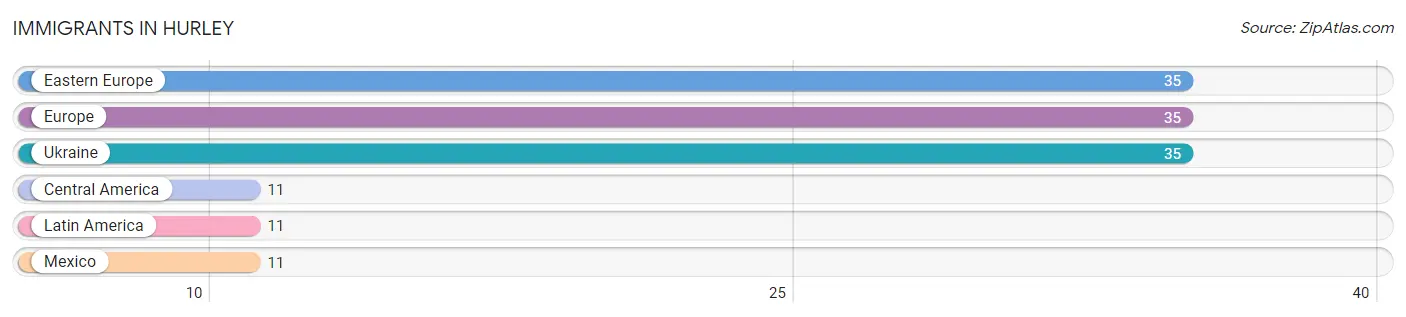
| Immigration Origin | # Population | % Population |
| Central America | 11 | 0.8% |
| Eastern Europe | 35 | 2.5% |
| Europe | 35 | 2.5% |
| Latin America | 11 | 0.8% |
| Mexico | 11 | 0.8% |
| Ukraine | 35 | 2.5% | View All 6 Rows |
Sex and Age in Hurley
Sex and Age in Hurley
The most populous age groups in Hurley are 15 to 19 Years (117 | 18.1%) for men and 50 to 54 Years (129 | 17.3%) for women.
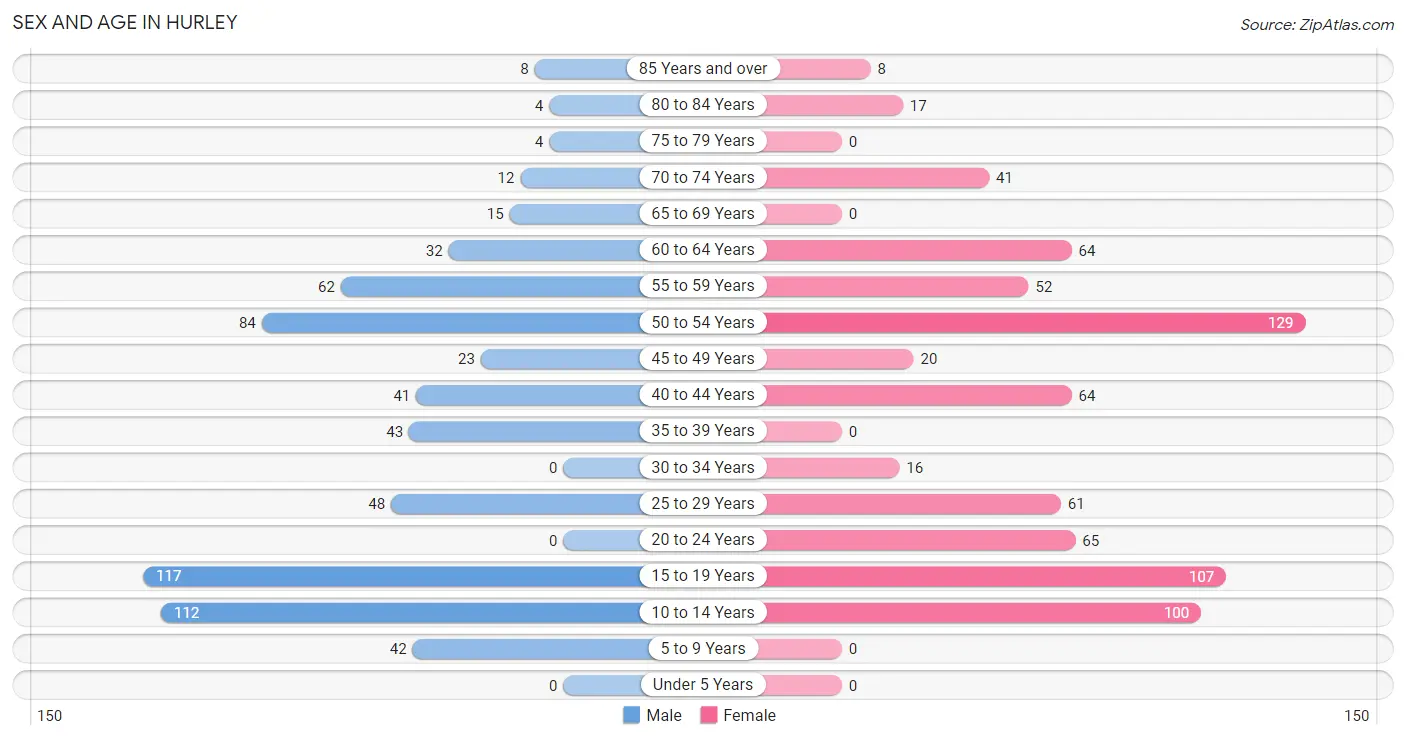
| Age Bracket | Male | Female |
| Under 5 Years | 0 (0.0%) | 0 (0.0%) |
| 5 to 9 Years | 42 (6.5%) | 0 (0.0%) |
| 10 to 14 Years | 112 (17.3%) | 100 (13.4%) |
| 15 to 19 Years | 117 (18.1%) | 107 (14.4%) |
| 20 to 24 Years | 0 (0.0%) | 65 (8.7%) |
| 25 to 29 Years | 48 (7.4%) | 61 (8.2%) |
| 30 to 34 Years | 0 (0.0%) | 16 (2.1%) |
| 35 to 39 Years | 43 (6.7%) | 0 (0.0%) |
| 40 to 44 Years | 41 (6.3%) | 64 (8.6%) |
| 45 to 49 Years | 23 (3.5%) | 20 (2.7%) |
| 50 to 54 Years | 84 (13.0%) | 129 (17.3%) |
| 55 to 59 Years | 62 (9.6%) | 52 (7.0%) |
| 60 to 64 Years | 32 (5.0%) | 64 (8.6%) |
| 65 to 69 Years | 15 (2.3%) | 0 (0.0%) |
| 70 to 74 Years | 12 (1.8%) | 41 (5.5%) |
| 75 to 79 Years | 4 (0.6%) | 0 (0.0%) |
| 80 to 84 Years | 4 (0.6%) | 17 (2.3%) |
| 85 Years and over | 8 (1.2%) | 8 (1.1%) |
| Total | 647 (100.0%) | 744 (100.0%) |
Families and Households in Hurley
Median Family Size in Hurley
The median family size in Hurley is 2.71 persons per family, with married-couple families (160 | 42.8%) accounting for the largest median family size of 2.93 persons per family. On the other hand, single female/mother families (149 | 39.8%) represent the smallest median family size with 2.51 persons per family.
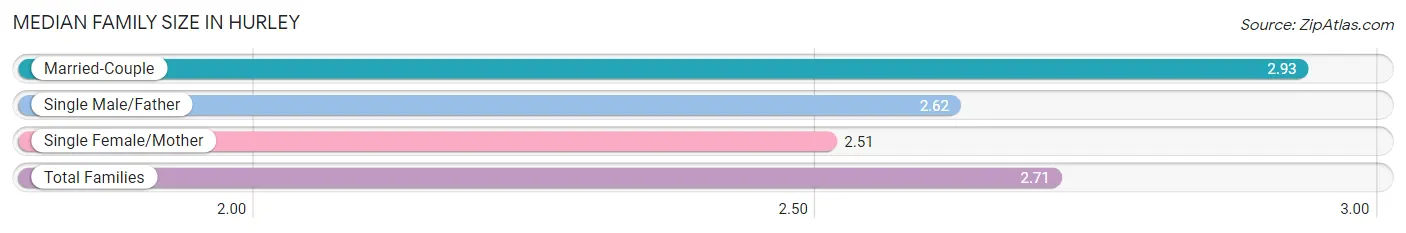
| Family Type | # Families | Family Size |
| Married-Couple | 160 (42.8%) | 2.93 |
| Single Male/Father | 65 (17.4%) | 2.62 |
| Single Female/Mother | 149 (39.8%) | 2.51 |
| Total Families | 374 (100.0%) | 2.71 |
Median Household Size in Hurley
The median household size in Hurley is 2.70 persons per household, with single male/father households (65 | 12.8%) accounting for the largest median household size of 4.92 persons per household. non-family households (135 | 26.5%) represent the smallest median household size with 1.49 persons per household.
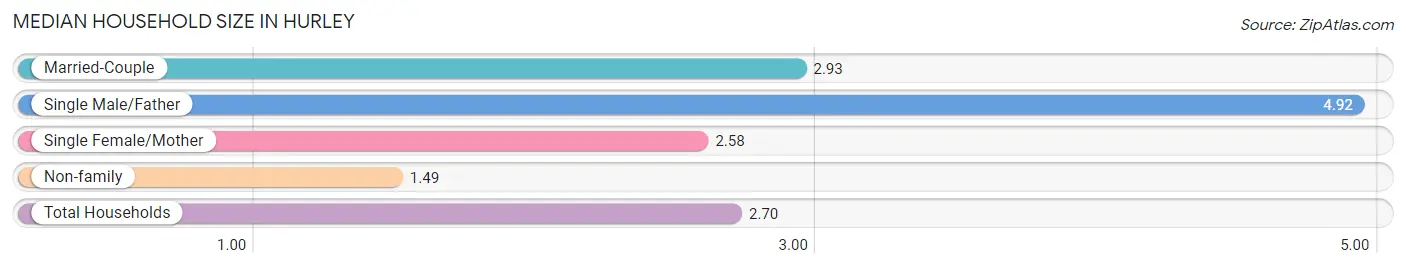
| Household Type | # Households | Household Size |
| Married-Couple | 160 (31.4%) | 2.93 |
| Single Male/Father | 65 (12.8%) | 4.92 |
| Single Female/Mother | 149 (29.3%) | 2.58 |
| Non-family | 135 (26.5%) | 1.49 |
| Total Households | 509 (100.0%) | 2.70 |
Household Size by Marriage Status in Hurley
Out of a total of 509 households in Hurley, 374 (73.5%) are family households, while 135 (26.5%) are nonfamily households. The most numerous type of family households are 2-person households, comprising 137, and the most common type of nonfamily households are 1-person households, comprising 76.
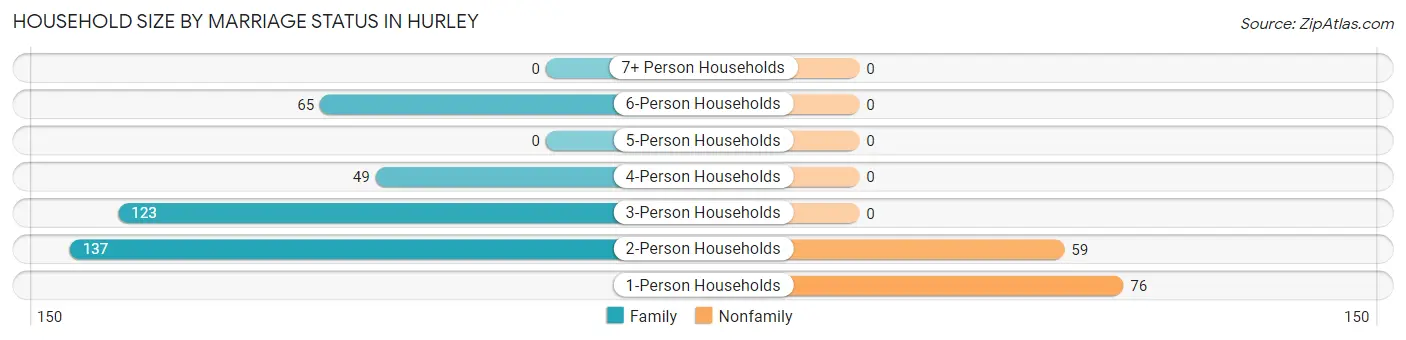
| Household Size | Family Households | Nonfamily Households |
| 1-Person Households | - | 76 (14.9%) |
| 2-Person Households | 137 (26.9%) | 59 (11.6%) |
| 3-Person Households | 123 (24.2%) | 0 (0.0%) |
| 4-Person Households | 49 (9.6%) | 0 (0.0%) |
| 5-Person Households | 0 (0.0%) | 0 (0.0%) |
| 6-Person Households | 65 (12.8%) | 0 (0.0%) |
| 7+ Person Households | 0 (0.0%) | 0 (0.0%) |
| Total | 374 (73.5%) | 135 (26.5%) |
Female Fertility in Hurley
Fertility by Age in Hurley
| Age Bracket | Women with Births | Births / 1,000 Women |
| 15 to 19 years | 0 (0.0%) | 0.0 |
| 20 to 34 years | 0 (0.0%) | 0.0 |
| 35 to 50 years | 0 (0.0%) | 0.0 |
| Total | 0 (0.0%) | 0.0 |
Fertility by Age by Marriage Status in Hurley
| Age Bracket | Married | Unmarried |
| 15 to 19 years | 0 (0.0%) | 0 (0.0%) |
| 20 to 34 years | 0 (0.0%) | 0 (0.0%) |
| 35 to 50 years | 0 (0.0%) | 0 (0.0%) |
| Total | 0 (0.0%) | 0 (0.0%) |
Fertility by Education in Hurley
| Educational Attainment | Women with Births | Births / 1,000 Women |
| Less than High School | 0 (0.0%) | 0.0 |
| High School Diploma | 0 (0.0%) | 0.0 |
| College or Associate's Degree | 0 (0.0%) | 0.0 |
| Bachelor's Degree | 0 (0.0%) | 0.0 |
| Graduate Degree | 0 (0.0%) | 0.0 |
| Total | 0 (0.0%) | 0.0 |
Fertility by Education by Marriage Status in Hurley
| Educational Attainment | Married | Unmarried |
| Less than High School | 0 (0.0%) | 0 (0.0%) |
| High School Diploma | 0 (0.0%) | 0 (0.0%) |
| College or Associate's Degree | 0 (0.0%) | 0 (0.0%) |
| Bachelor's Degree | 0 (0.0%) | 0 (0.0%) |
| Graduate Degree | 0 (0.0%) | 0 (0.0%) |
| Total | 0 (0.0%) | 0 (0.0%) |
Employment Characteristics in Hurley
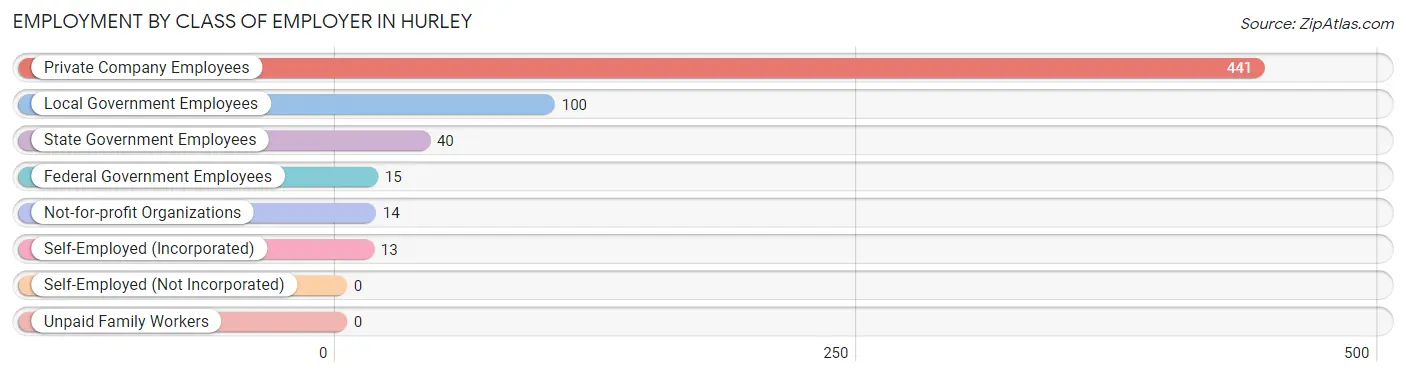
Employment by Class of Employer in Hurley
Among the 623 employed individuals in Hurley, private company employees (441 | 70.8%), local government employees (100 | 16.1%), and state government employees (40 | 6.4%) make up the most common classes of employment.
| Employer Class | # Employees | % Employees |
| Private Company Employees | 441 | 70.8% |
| Self-Employed (Incorporated) | 13 | 2.1% |
| Self-Employed (Not Incorporated) | 0 | 0.0% |
| Not-for-profit Organizations | 14 | 2.2% |
| Local Government Employees | 100 | 16.1% |
| State Government Employees | 40 | 6.4% |
| Federal Government Employees | 15 | 2.4% |
| Unpaid Family Workers | 0 | 0.0% |
| Total | 623 | 100.0% |
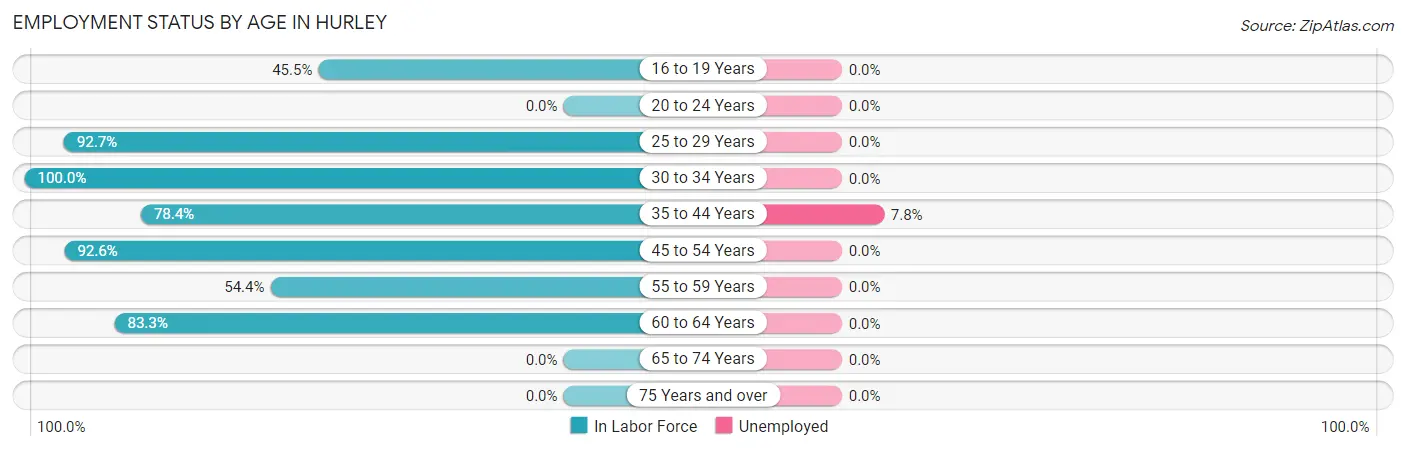
Employment Status by Age in Hurley
According to the labor force statistics for Hurley, out of the total population over 16 years of age (1,126), 63.0% or 709 individuals are in the labor force, with 1.3% or 9 of them unemployed. The age group with the highest labor force participation rate is 30 to 34 years, with 100.0% or 16 individuals in the labor force. Within the labor force, the 35 to 44 years age range has the highest percentage of unemployed individuals, with 7.8% or 9 of them being unemployed.
| Age Bracket | In Labor Force | Unemployed |
| 16 to 19 Years | 97 (45.5%) | 0 (0.0%) |
| 20 to 24 Years | 0 (0.0%) | 0 (0.0%) |
| 25 to 29 Years | 101 (92.7%) | 0 (0.0%) |
| 30 to 34 Years | 16 (100.0%) | 0 (0.0%) |
| 35 to 44 Years | 116 (78.4%) | 9 (7.8%) |
| 45 to 54 Years | 237 (92.6%) | 0 (0.0%) |
| 55 to 59 Years | 62 (54.4%) | 0 (0.0%) |
| 60 to 64 Years | 80 (83.3%) | 0 (0.0%) |
| 65 to 74 Years | 0 (0.0%) | 0 (0.0%) |
| 75 Years and over | 0 (0.0%) | 0 (0.0%) |
| Total | 709 (63.0%) | 9 (1.3%) |
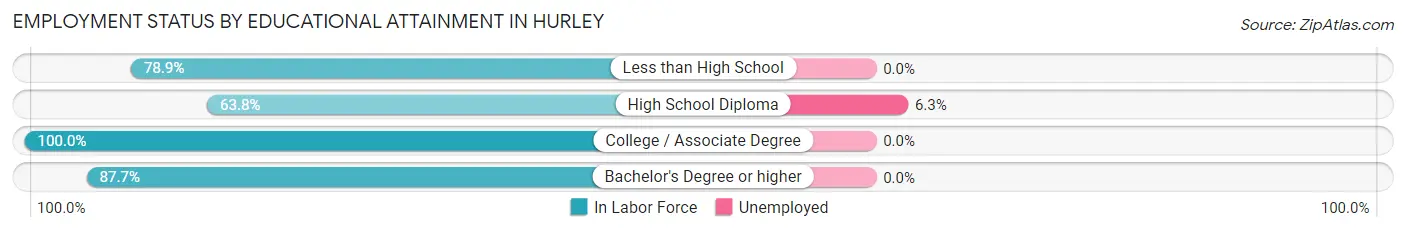
Employment Status by Educational Attainment in Hurley
According to labor force statistics for Hurley, 82.8% of individuals (612) out of the total population between 25 and 64 years of age (739) are in the labor force, with 1.5% or 9 of them being unemployed. The group with the highest labor force participation rate are those with the educational attainment of college / associate degree, with 100.0% or 222 individuals in the labor force. Within the labor force, individuals with high school diploma education have the highest percentage of unemployment, with 6.3% or 9 of them being unemployed.
| Educational Attainment | In Labor Force | Unemployed |
| Less than High School | 90 (78.9%) | 0 (0.0%) |
| High School Diploma | 143 (63.8%) | 14 (6.3%) |
| College / Associate Degree | 222 (100.0%) | 0 (0.0%) |
| Bachelor's Degree or higher | 157 (87.7%) | 0 (0.0%) |
| Total | 612 (82.8%) | 11 (1.5%) |
Employment Occupations by Sex in Hurley
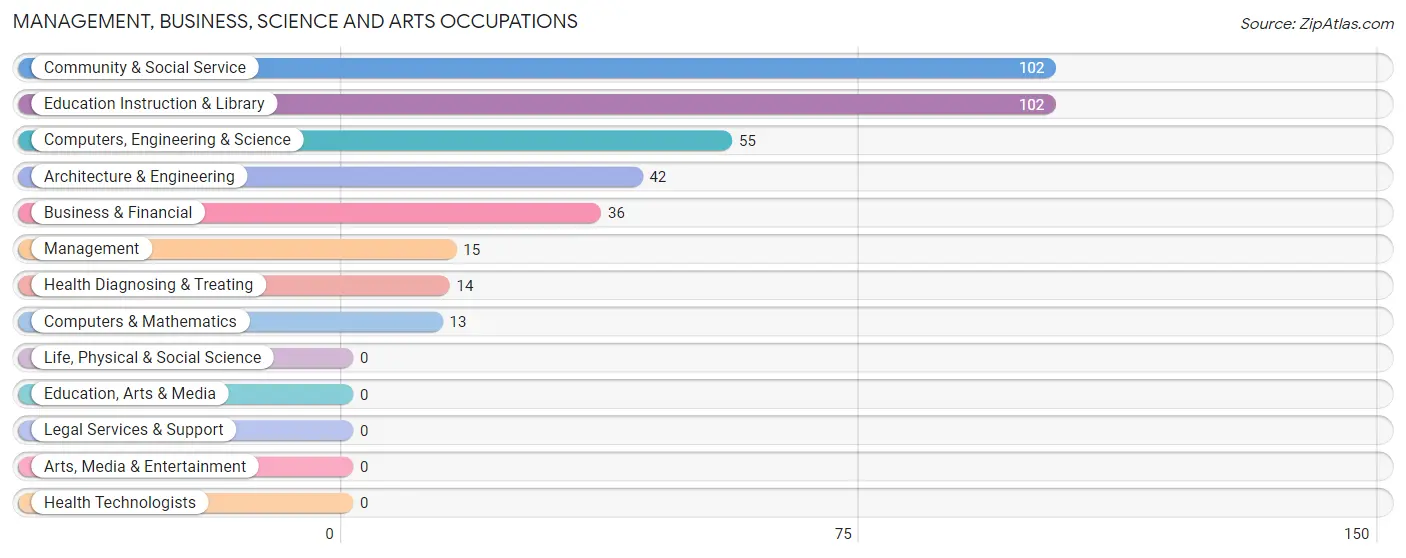
Management, Business, Science and Arts Occupations
The most common Management, Business, Science and Arts occupations in Hurley are Community & Social Service (102 | 14.6%), Education Instruction & Library (102 | 14.6%), Computers, Engineering & Science (55 | 7.9%), Architecture & Engineering (42 | 6.0%), and Business & Financial (36 | 5.1%).
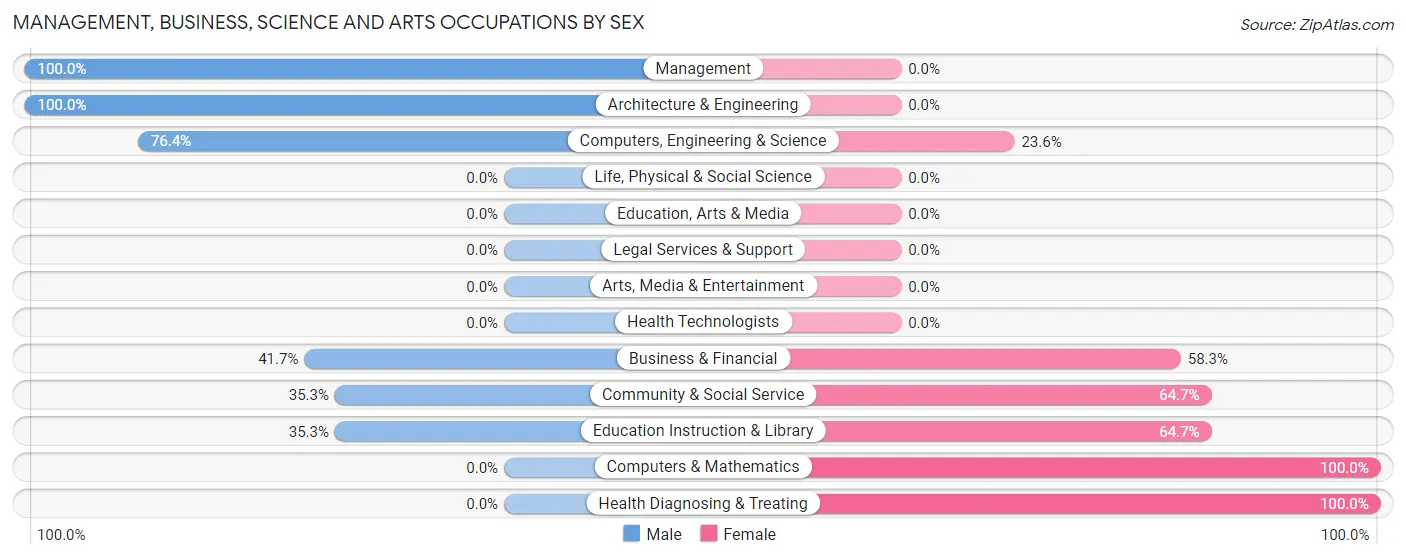
Management, Business, Science and Arts Occupations by Sex
Within the Management, Business, Science and Arts occupations in Hurley, the most male-oriented occupations are Management (100.0%), Architecture & Engineering (100.0%), and Computers, Engineering & Science (76.4%), while the most female-oriented occupations are Computers & Mathematics (100.0%), Health Diagnosing & Treating (100.0%), and Community & Social Service (64.7%).
| Occupation | Male | Female |
| Management | 15 (100.0%) | 0 (0.0%) |
| Business & Financial | 15 (41.7%) | 21 (58.3%) |
| Computers, Engineering & Science | 42 (76.4%) | 13 (23.6%) |
| Computers & Mathematics | 0 (0.0%) | 13 (100.0%) |
| Architecture & Engineering | 42 (100.0%) | 0 (0.0%) |
| Life, Physical & Social Science | 0 (0.0%) | 0 (0.0%) |
| Community & Social Service | 36 (35.3%) | 66 (64.7%) |
| Education, Arts & Media | 0 (0.0%) | 0 (0.0%) |
| Legal Services & Support | 0 (0.0%) | 0 (0.0%) |
| Education Instruction & Library | 36 (35.3%) | 66 (64.7%) |
| Arts, Media & Entertainment | 0 (0.0%) | 0 (0.0%) |
| Health Diagnosing & Treating | 0 (0.0%) | 14 (100.0%) |
| Health Technologists | 0 (0.0%) | 0 (0.0%) |
| Total (Category) | 108 (48.6%) | 114 (51.3%) |
| Total (Overall) | 330 (47.1%) | 370 (52.9%) |
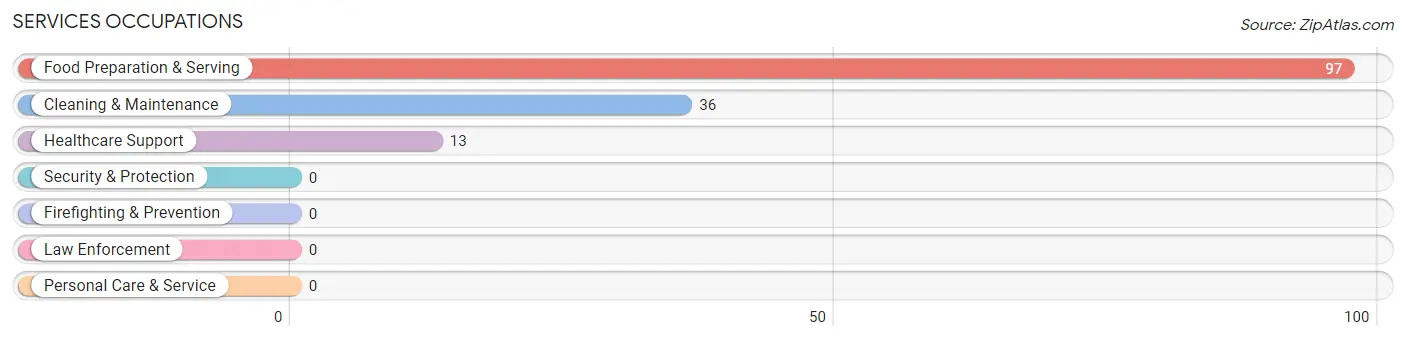
Services Occupations
The most common Services occupations in Hurley are Food Preparation & Serving (97 | 13.9%), Cleaning & Maintenance (36 | 5.1%), and Healthcare Support (13 | 1.9%).
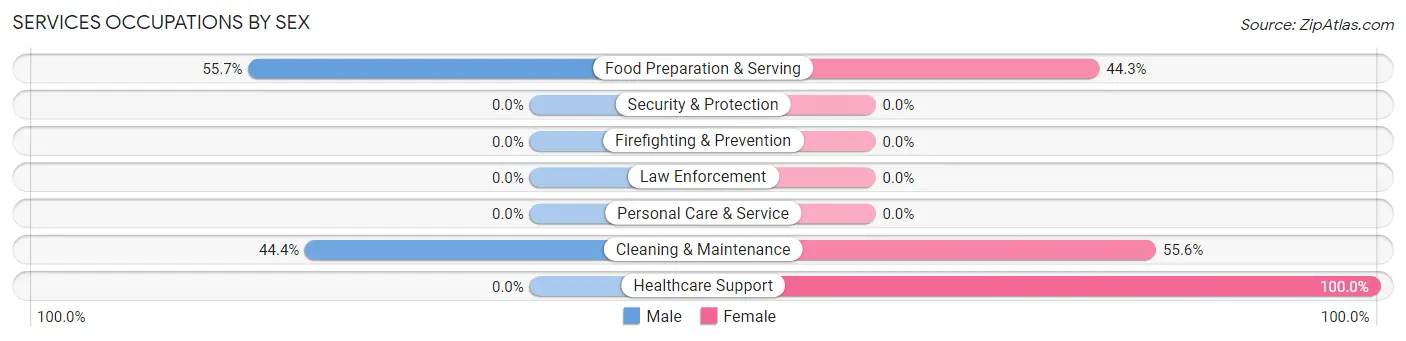
Services Occupations by Sex
Within the Services occupations in Hurley, the most male-oriented occupations are Food Preparation & Serving (55.7%), and Cleaning & Maintenance (44.4%), while the most female-oriented occupations are Healthcare Support (100.0%), Cleaning & Maintenance (55.6%), and Food Preparation & Serving (44.3%).
| Occupation | Male | Female |
| Healthcare Support | 0 (0.0%) | 13 (100.0%) |
| Security & Protection | 0 (0.0%) | 0 (0.0%) |
| Firefighting & Prevention | 0 (0.0%) | 0 (0.0%) |
| Law Enforcement | 0 (0.0%) | 0 (0.0%) |
| Food Preparation & Serving | 54 (55.7%) | 43 (44.3%) |
| Cleaning & Maintenance | 16 (44.4%) | 20 (55.6%) |
| Personal Care & Service | 0 (0.0%) | 0 (0.0%) |
| Total (Category) | 70 (47.9%) | 76 (52.0%) |
| Total (Overall) | 330 (47.1%) | 370 (52.9%) |
Sales and Office Occupations
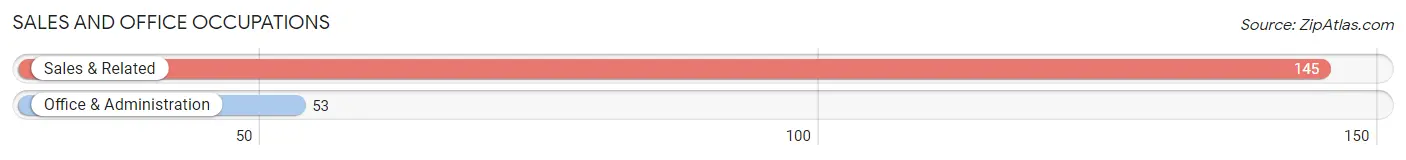
The most common Sales and Office occupations in Hurley are Sales & Related (145 | 20.7%), and Office & Administration (53 | 7.6%).
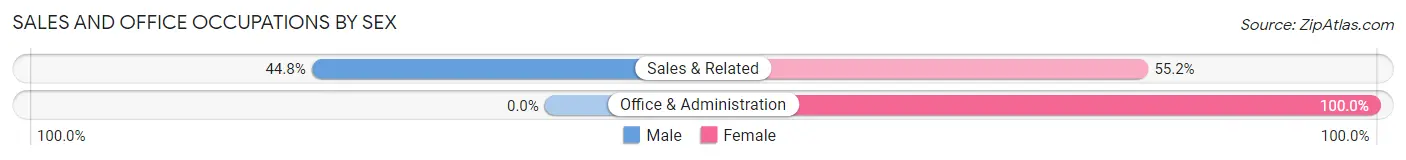
Sales and Office Occupations by Sex
| Occupation | Male | Female |
| Sales & Related | 65 (44.8%) | 80 (55.2%) |
| Office & Administration | 0 (0.0%) | 53 (100.0%) |
| Total (Category) | 65 (32.8%) | 133 (67.2%) |
| Total (Overall) | 330 (47.1%) | 370 (52.9%) |
Natural Resources, Construction and Maintenance Occupations
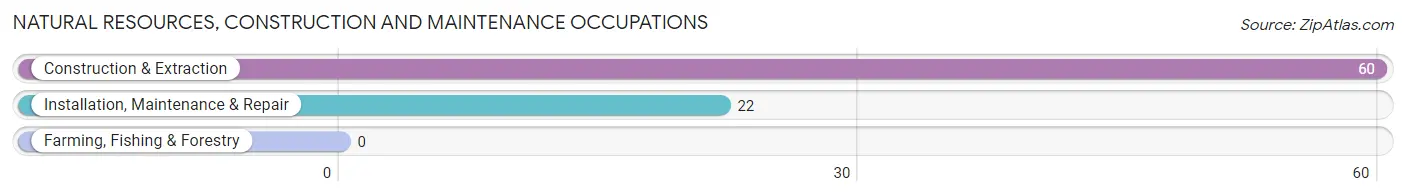
The most common Natural Resources, Construction and Maintenance occupations in Hurley are Construction & Extraction (60 | 8.6%), and Installation, Maintenance & Repair (22 | 3.1%).
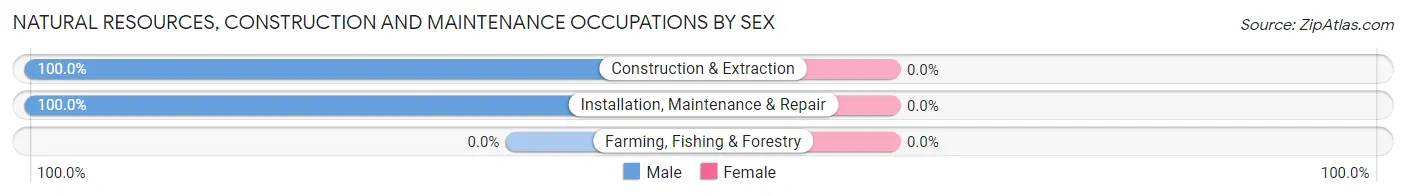
Natural Resources, Construction and Maintenance Occupations by Sex
| Occupation | Male | Female |
| Farming, Fishing & Forestry | 0 (0.0%) | 0 (0.0%) |
| Construction & Extraction | 60 (100.0%) | 0 (0.0%) |
| Installation, Maintenance & Repair | 22 (100.0%) | 0 (0.0%) |
| Total (Category) | 82 (100.0%) | 0 (0.0%) |
| Total (Overall) | 330 (47.1%) | 370 (52.9%) |
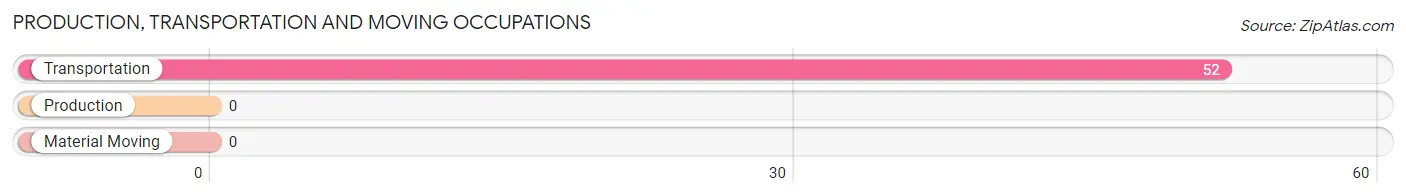
Production, Transportation and Moving Occupations
The most common Production, Transportation and Moving occupations in Hurley are , and Transportation (52 | 7.4%).
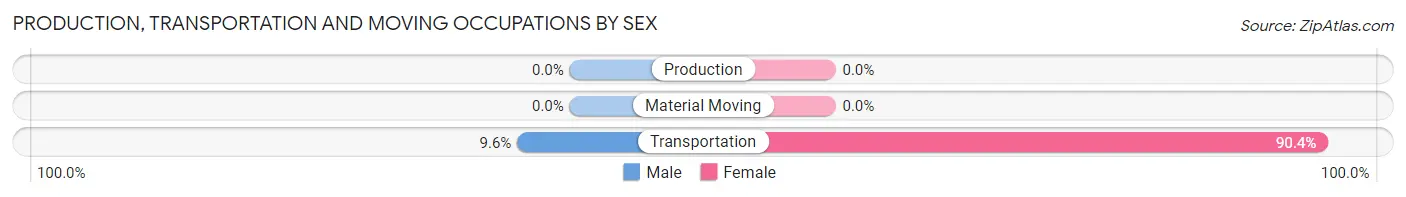
Production, Transportation and Moving Occupations by Sex
| Occupation | Male | Female |
| Production | 0 (0.0%) | 0 (0.0%) |
| Transportation | 5 (9.6%) | 47 (90.4%) |
| Material Moving | 0 (0.0%) | 0 (0.0%) |
| Total (Category) | 5 (9.6%) | 47 (90.4%) |
| Total (Overall) | 330 (47.1%) | 370 (52.9%) |
Employment Industries by Sex in Hurley
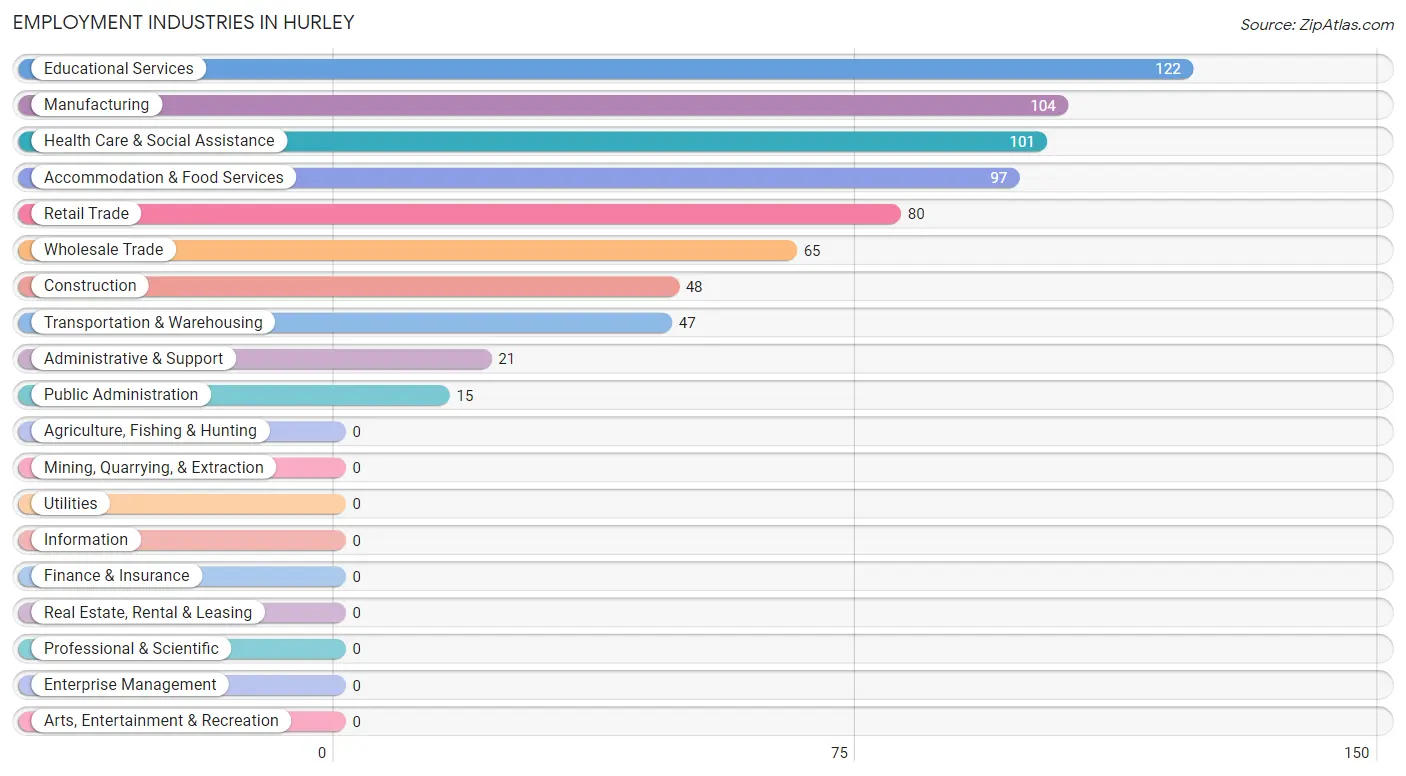
Employment Industries in Hurley
The major employment industries in Hurley include Educational Services (122 | 17.4%), Manufacturing (104 | 14.9%), Health Care & Social Assistance (101 | 14.4%), Accommodation & Food Services (97 | 13.9%), and Retail Trade (80 | 11.4%).
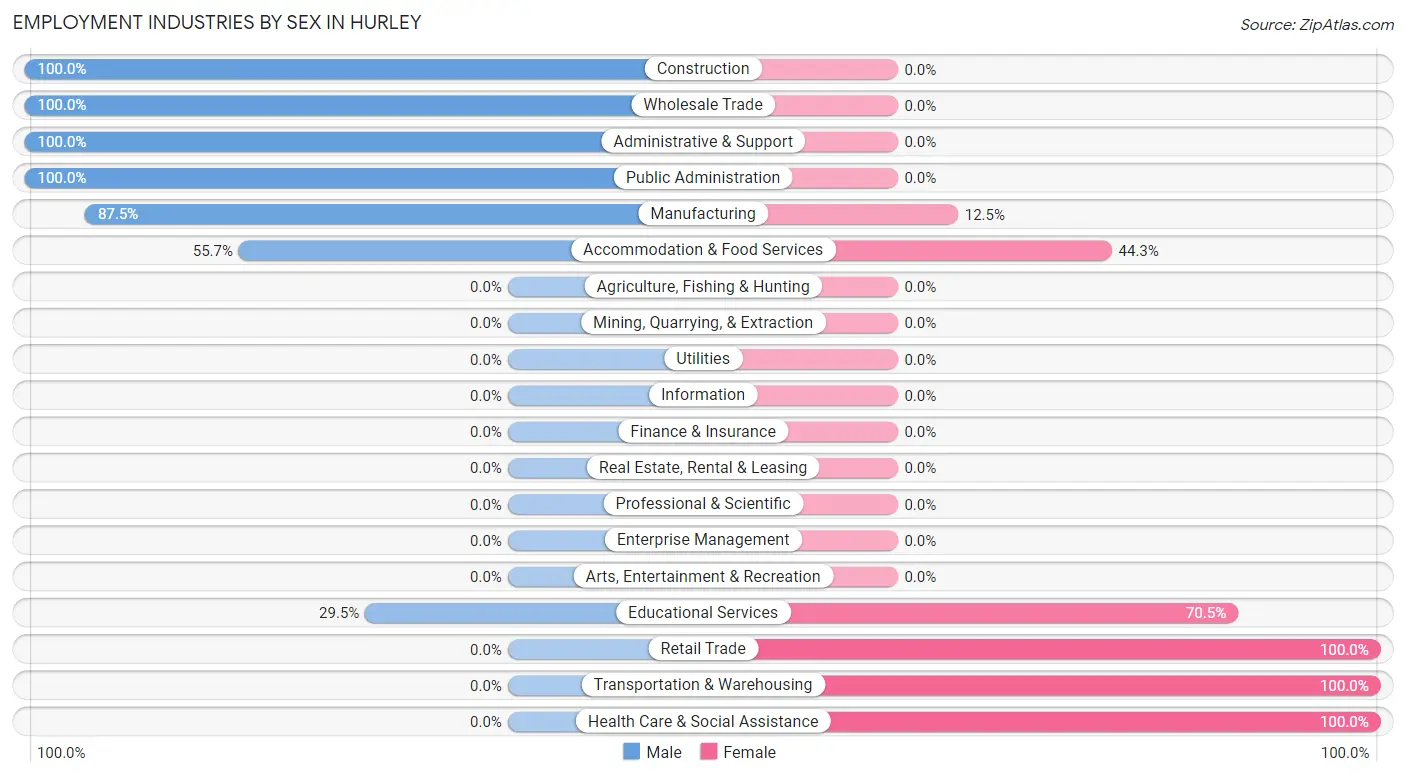
Employment Industries by Sex in Hurley
The Hurley industries that see more men than women are Construction (100.0%), Wholesale Trade (100.0%), and Administrative & Support (100.0%), whereas the industries that tend to have a higher number of women are Retail Trade (100.0%), Transportation & Warehousing (100.0%), and Health Care & Social Assistance (100.0%).
| Industry | Male | Female |
| Agriculture, Fishing & Hunting | 0 (0.0%) | 0 (0.0%) |
| Mining, Quarrying, & Extraction | 0 (0.0%) | 0 (0.0%) |
| Construction | 48 (100.0%) | 0 (0.0%) |
| Manufacturing | 91 (87.5%) | 13 (12.5%) |
| Wholesale Trade | 65 (100.0%) | 0 (0.0%) |
| Retail Trade | 0 (0.0%) | 80 (100.0%) |
| Transportation & Warehousing | 0 (0.0%) | 47 (100.0%) |
| Utilities | 0 (0.0%) | 0 (0.0%) |
| Information | 0 (0.0%) | 0 (0.0%) |
| Finance & Insurance | 0 (0.0%) | 0 (0.0%) |
| Real Estate, Rental & Leasing | 0 (0.0%) | 0 (0.0%) |
| Professional & Scientific | 0 (0.0%) | 0 (0.0%) |
| Enterprise Management | 0 (0.0%) | 0 (0.0%) |
| Administrative & Support | 21 (100.0%) | 0 (0.0%) |
| Educational Services | 36 (29.5%) | 86 (70.5%) |
| Health Care & Social Assistance | 0 (0.0%) | 101 (100.0%) |
| Arts, Entertainment & Recreation | 0 (0.0%) | 0 (0.0%) |
| Accommodation & Food Services | 54 (55.7%) | 43 (44.3%) |
| Public Administration | 15 (100.0%) | 0 (0.0%) |
| Total | 330 (47.1%) | 370 (52.9%) |
Education in Hurley
School Enrollment in Hurley
The most common levels of schooling among the 524 students in Hurley are high school (201 | 38.4%), middle school (197 | 37.6%), and college / undergraduate (84 | 16.0%).
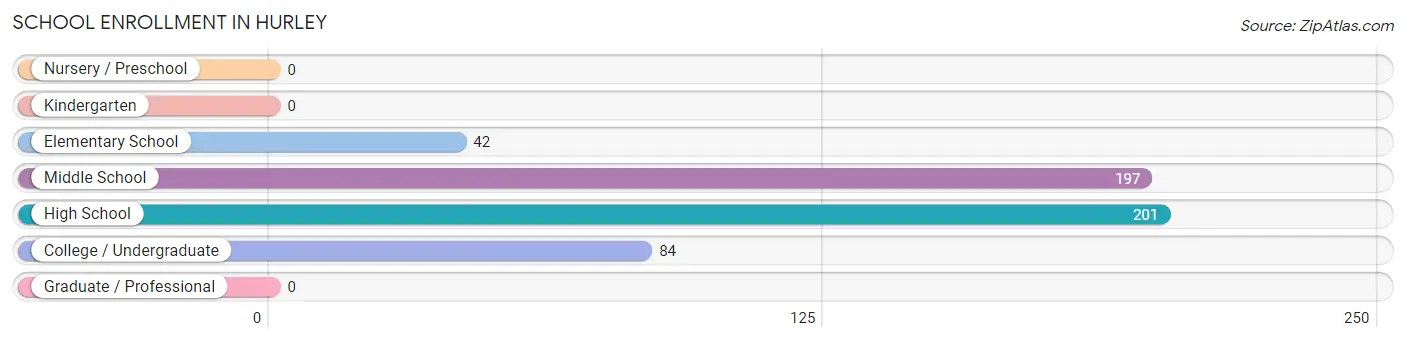
| School Level | # Students | % Students |
| Nursery / Preschool | 0 | 0.0% |
| Kindergarten | 0 | 0.0% |
| Elementary School | 42 | 8.0% |
| Middle School | 197 | 37.6% |
| High School | 201 | 38.4% |
| College / Undergraduate | 84 | 16.0% |
| Graduate / Professional | 0 | 0.0% |
| Total | 524 | 100.0% |
School Enrollment by Age by Funding Source in Hurley
Out of a total of 524 students who are enrolled in schools in Hurley, 138 (26.3%) attend a private institution, while the remaining 386 (73.7%) are enrolled in public schools. The age group of 5 to 9 year old has the highest likelihood of being enrolled in private schools, with 28 (66.7% in the age bracket) enrolled. Conversely, the age group of 20 to 24 year olds has the lowest likelihood of being enrolled in a private school, with 65 (100.0% in the age bracket) attending a public institution.
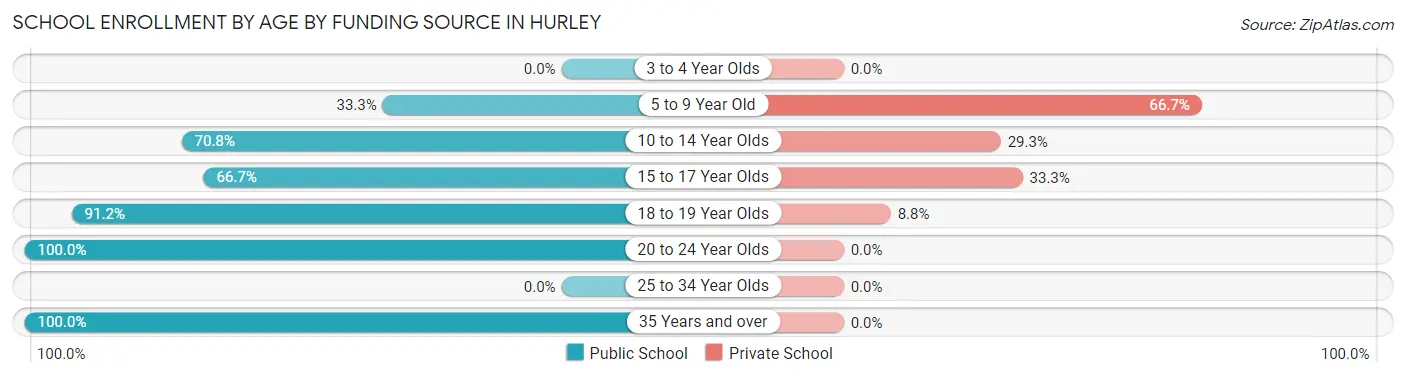
| Age Bracket | Public School | Private School |
| 3 to 4 Year Olds | 0 (0.0%) | 0 (0.0%) |
| 5 to 9 Year Old | 14 (33.3%) | 28 (66.7%) |
| 10 to 14 Year Olds | 150 (70.8%) | 62 (29.2%) |
| 15 to 17 Year Olds | 86 (66.7%) | 43 (33.3%) |
| 18 to 19 Year Olds | 52 (91.2%) | 5 (8.8%) |
| 20 to 24 Year Olds | 65 (100.0%) | 0 (0.0%) |
| 25 to 34 Year Olds | 0 (0.0%) | 0 (0.0%) |
| 35 Years and over | 19 (100.0%) | 0 (0.0%) |
| Total | 386 (73.7%) | 138 (26.3%) |
Educational Attainment by Field of Study in Hurley
Science & technology (80 | 38.8%), business (50 | 24.3%), bio, nature & agricultural (24 | 11.7%), physical & health sciences (20 | 9.7%), and literature & languages (16 | 7.8%) are the most common fields of study among 206 individuals in Hurley who have obtained a bachelor's degree or higher.
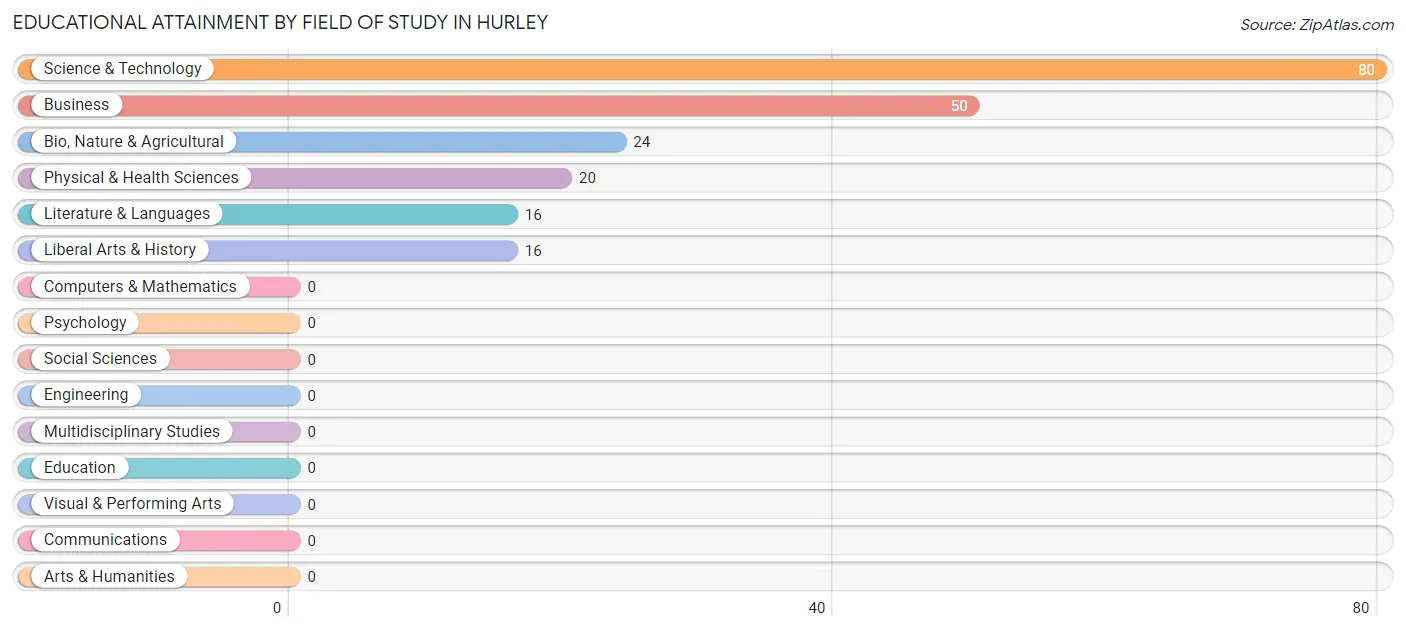
| Field of Study | # Graduates | % Graduates |
| Computers & Mathematics | 0 | 0.0% |
| Bio, Nature & Agricultural | 24 | 11.7% |
| Physical & Health Sciences | 20 | 9.7% |
| Psychology | 0 | 0.0% |
| Social Sciences | 0 | 0.0% |
| Engineering | 0 | 0.0% |
| Multidisciplinary Studies | 0 | 0.0% |
| Science & Technology | 80 | 38.8% |
| Business | 50 | 24.3% |
| Education | 0 | 0.0% |
| Literature & Languages | 16 | 7.8% |
| Liberal Arts & History | 16 | 7.8% |
| Visual & Performing Arts | 0 | 0.0% |
| Communications | 0 | 0.0% |
| Arts & Humanities | 0 | 0.0% |
| Total | 206 | 100.0% |
Transportation & Commute in Hurley
Vehicle Availability by Sex in Hurley
The most prevalent vehicle ownership categories in Hurley are males with 3 vehicles (160, accounting for 51.0%) and females with 3 vehicles (123, making up 51.8%).
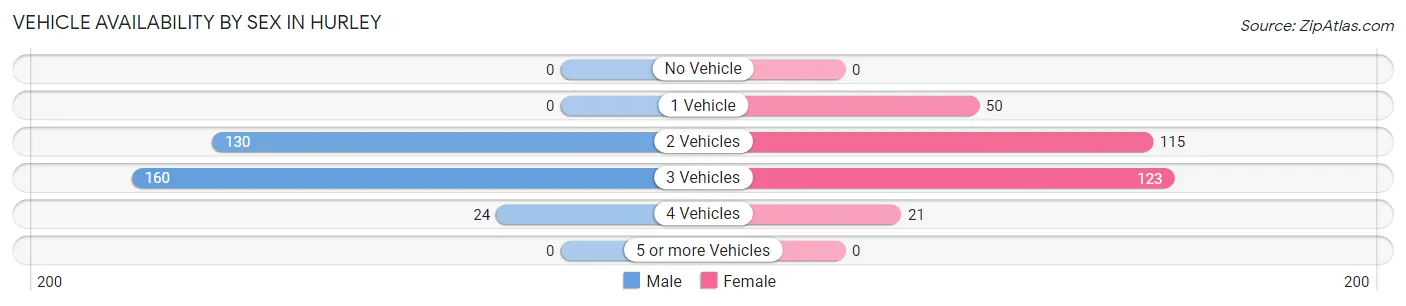
| Vehicles Available | Male | Female |
| No Vehicle | 0 (0.0%) | 0 (0.0%) |
| 1 Vehicle | 0 (0.0%) | 50 (16.2%) |
| 2 Vehicles | 130 (41.4%) | 115 (37.2%) |
| 3 Vehicles | 160 (51.0%) | 123 (39.8%) |
| 4 Vehicles | 24 (7.6%) | 21 (6.8%) |
| 5 or more Vehicles | 0 (0.0%) | 0 (0.0%) |
| Total | 314 (100.0%) | 309 (100.0%) |
Commute Time in Hurley
The most frequently occuring commute durations in Hurley are 35 to 39 minutes (113 commuters, 20.9%), 30 to 34 minutes (89 commuters, 16.5%), and 5 to 9 minutes (88 commuters, 16.3%).
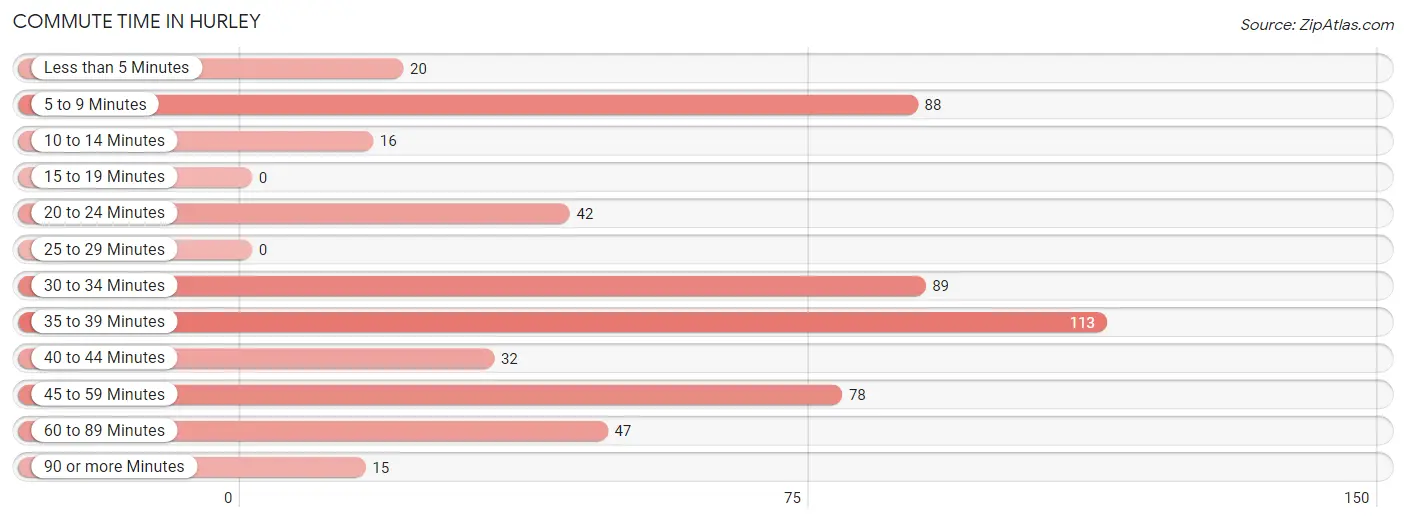
| Commute Time | # Commuters | % Commuters |
| Less than 5 Minutes | 20 | 3.7% |
| 5 to 9 Minutes | 88 | 16.3% |
| 10 to 14 Minutes | 16 | 3.0% |
| 15 to 19 Minutes | 0 | 0.0% |
| 20 to 24 Minutes | 42 | 7.8% |
| 25 to 29 Minutes | 0 | 0.0% |
| 30 to 34 Minutes | 89 | 16.5% |
| 35 to 39 Minutes | 113 | 20.9% |
| 40 to 44 Minutes | 32 | 5.9% |
| 45 to 59 Minutes | 78 | 14.4% |
| 60 to 89 Minutes | 47 | 8.7% |
| 90 or more Minutes | 15 | 2.8% |
Commute Time by Sex in Hurley
The most common commute times in Hurley are 35 to 39 minutes (49 commuters, 21.2%) for males and 35 to 39 minutes (64 commuters, 20.7%) for females.
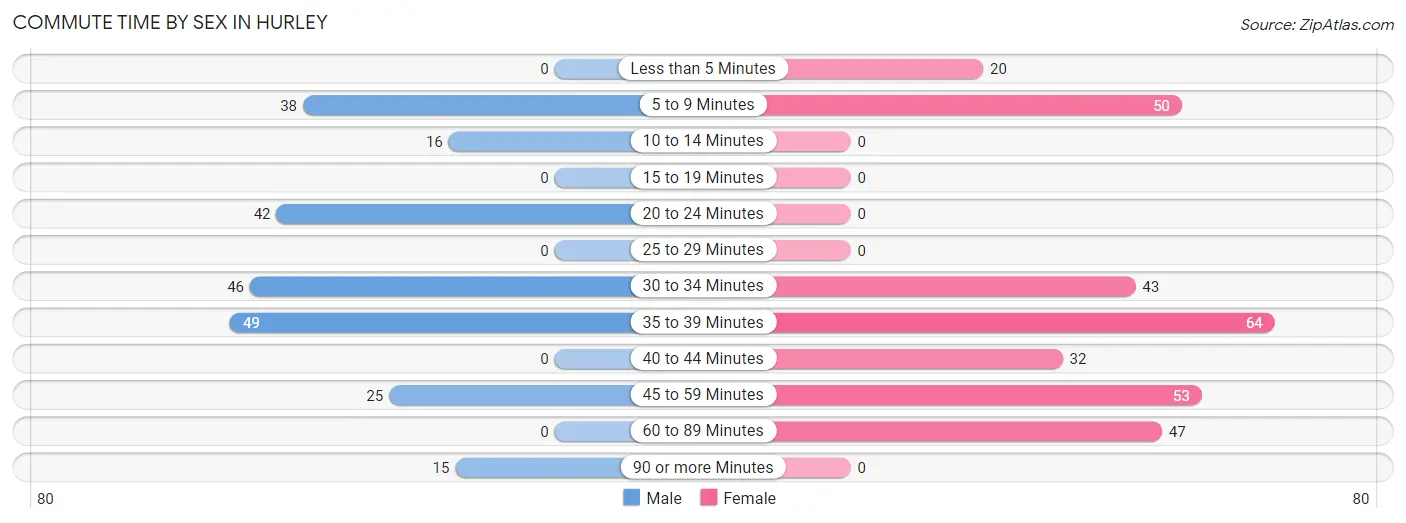
| Commute Time | Male | Female |
| Less than 5 Minutes | 0 (0.0%) | 20 (6.5%) |
| 5 to 9 Minutes | 38 (16.5%) | 50 (16.2%) |
| 10 to 14 Minutes | 16 (6.9%) | 0 (0.0%) |
| 15 to 19 Minutes | 0 (0.0%) | 0 (0.0%) |
| 20 to 24 Minutes | 42 (18.2%) | 0 (0.0%) |
| 25 to 29 Minutes | 0 (0.0%) | 0 (0.0%) |
| 30 to 34 Minutes | 46 (19.9%) | 43 (13.9%) |
| 35 to 39 Minutes | 49 (21.2%) | 64 (20.7%) |
| 40 to 44 Minutes | 0 (0.0%) | 32 (10.4%) |
| 45 to 59 Minutes | 25 (10.8%) | 53 (17.2%) |
| 60 to 89 Minutes | 0 (0.0%) | 47 (15.2%) |
| 90 or more Minutes | 15 (6.5%) | 0 (0.0%) |
Time of Departure to Work by Sex in Hurley
The most frequent times of departure to work in Hurley are 6:30 AM to 6:59 AM (42, 18.2%) for males and 6:30 AM to 6:59 AM (67, 21.7%) for females.
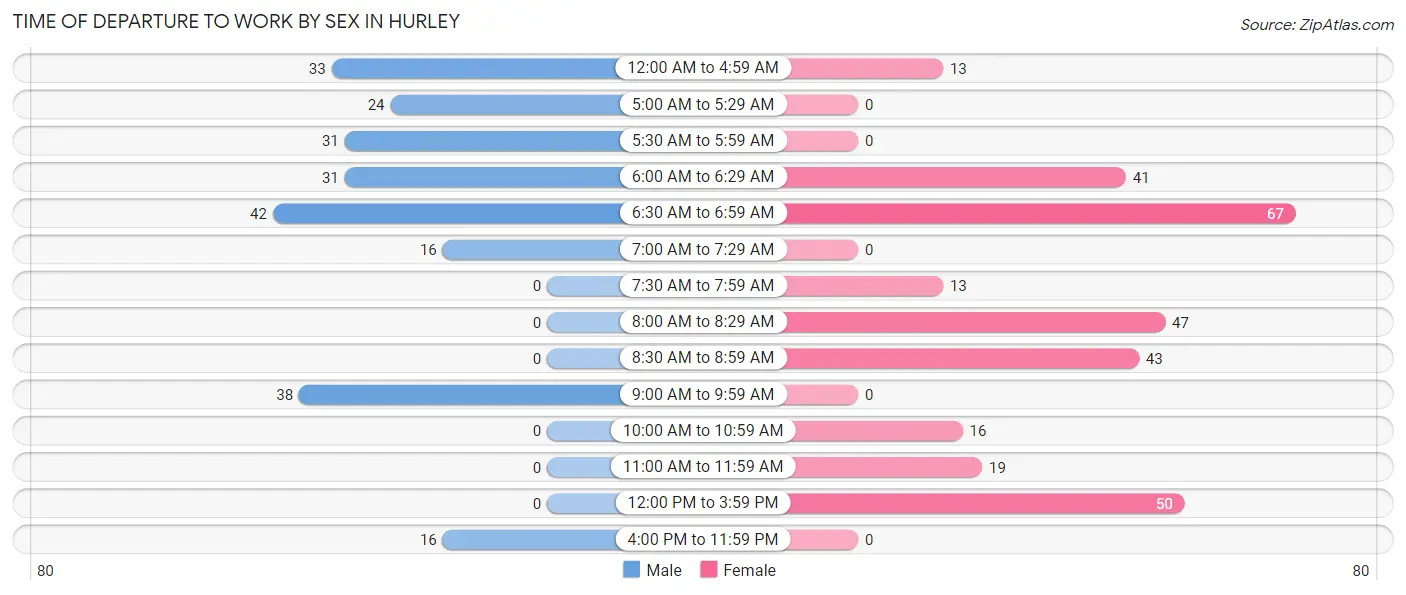
| Time of Departure | Male | Female |
| 12:00 AM to 4:59 AM | 33 (14.3%) | 13 (4.2%) |
| 5:00 AM to 5:29 AM | 24 (10.4%) | 0 (0.0%) |
| 5:30 AM to 5:59 AM | 31 (13.4%) | 0 (0.0%) |
| 6:00 AM to 6:29 AM | 31 (13.4%) | 41 (13.3%) |
| 6:30 AM to 6:59 AM | 42 (18.2%) | 67 (21.7%) |
| 7:00 AM to 7:29 AM | 16 (6.9%) | 0 (0.0%) |
| 7:30 AM to 7:59 AM | 0 (0.0%) | 13 (4.2%) |
| 8:00 AM to 8:29 AM | 0 (0.0%) | 47 (15.2%) |
| 8:30 AM to 8:59 AM | 0 (0.0%) | 43 (13.9%) |
| 9:00 AM to 9:59 AM | 38 (16.5%) | 0 (0.0%) |
| 10:00 AM to 10:59 AM | 0 (0.0%) | 16 (5.2%) |
| 11:00 AM to 11:59 AM | 0 (0.0%) | 19 (6.1%) |
| 12:00 PM to 3:59 PM | 0 (0.0%) | 50 (16.2%) |
| 4:00 PM to 11:59 PM | 16 (6.9%) | 0 (0.0%) |
| Total | 231 (100.0%) | 309 (100.0%) |
Housing Occupancy in Hurley
Occupancy by Ownership in Hurley
Of the total 509 dwellings in Hurley, owner-occupied units account for 484 (95.1%), while renter-occupied units make up 25 (4.9%).
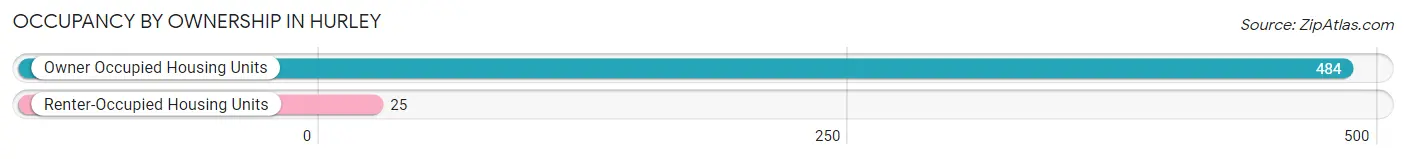
| Occupancy | # Housing Units | % Housing Units |
| Owner Occupied Housing Units | 484 | 95.1% |
| Renter-Occupied Housing Units | 25 | 4.9% |
| Total Occupied Housing Units | 509 | 100.0% |
Occupancy by Household Size in Hurley
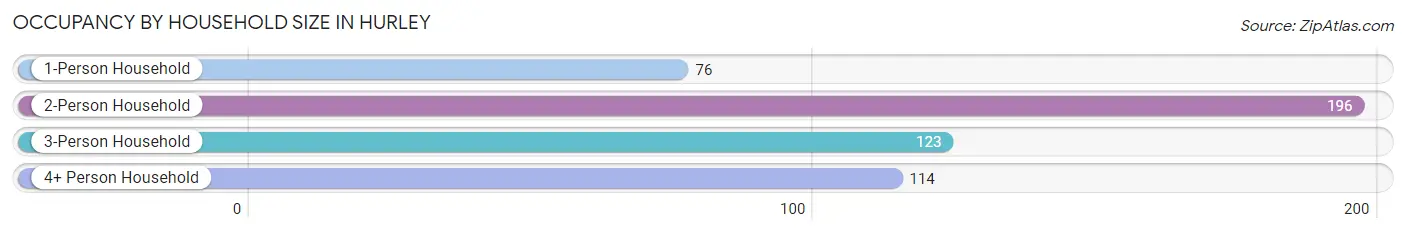
| Household Size | # Housing Units | % Housing Units |
| 1-Person Household | 76 | 14.9% |
| 2-Person Household | 196 | 38.5% |
| 3-Person Household | 123 | 24.2% |
| 4+ Person Household | 114 | 22.4% |
| Total Housing Units | 509 | 100.0% |
Occupancy by Ownership by Household Size in Hurley
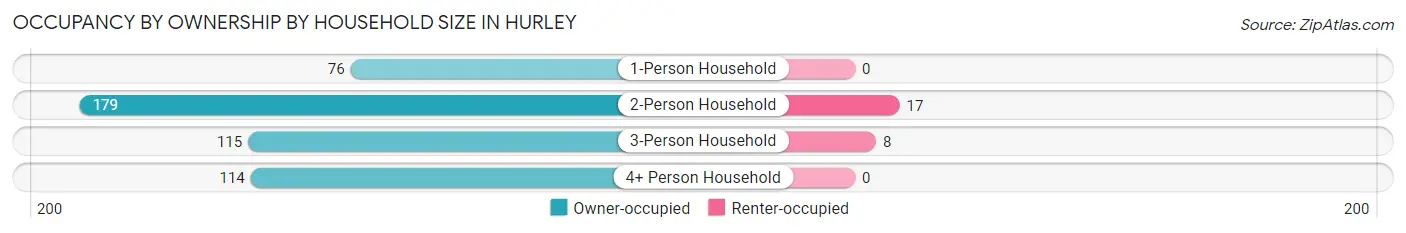
| Household Size | Owner-occupied | Renter-occupied |
| 1-Person Household | 76 (100.0%) | 0 (0.0%) |
| 2-Person Household | 179 (91.3%) | 17 (8.7%) |
| 3-Person Household | 115 (93.5%) | 8 (6.5%) |
| 4+ Person Household | 114 (100.0%) | 0 (0.0%) |
| Total Housing Units | 484 (95.1%) | 25 (4.9%) |
Occupancy by Educational Attainment in Hurley
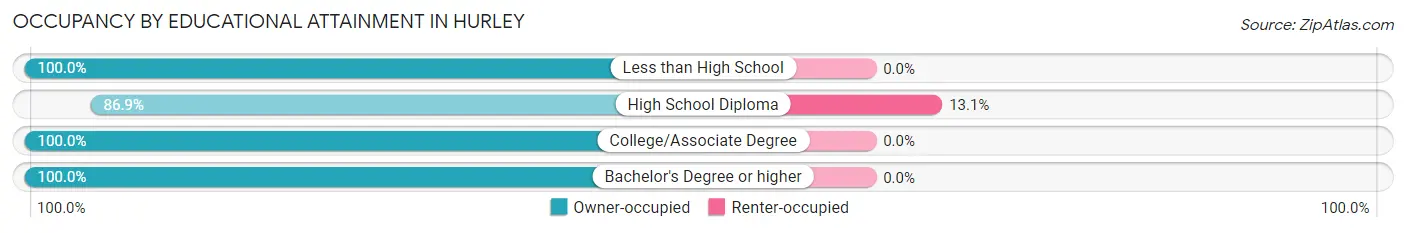
| Household Size | Owner-occupied | Renter-occupied |
| Less than High School | 90 (100.0%) | 0 (0.0%) |
| High School Diploma | 166 (86.9%) | 25 (13.1%) |
| College/Associate Degree | 164 (100.0%) | 0 (0.0%) |
| Bachelor's Degree or higher | 64 (100.0%) | 0 (0.0%) |
Occupancy by Age of Householder in Hurley
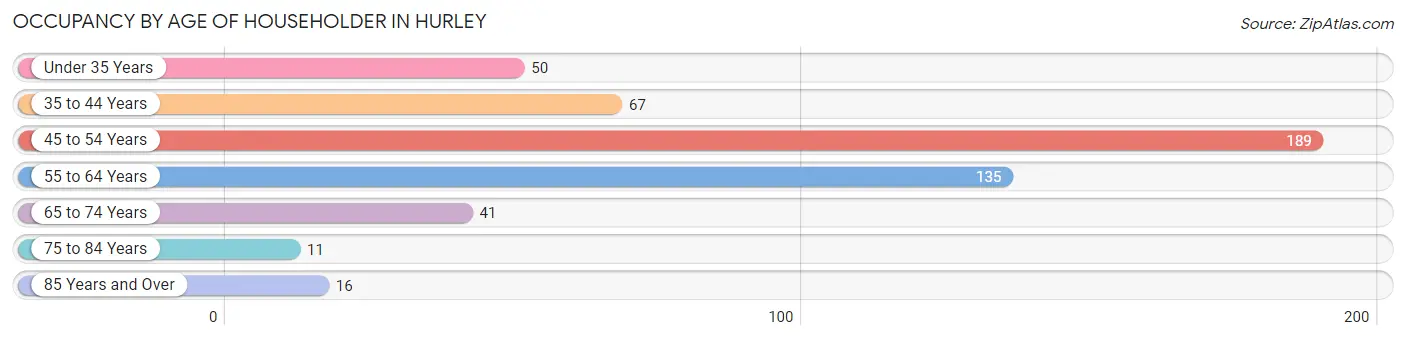
| Age Bracket | # Households | % Households |
| Under 35 Years | 50 | 9.8% |
| 35 to 44 Years | 67 | 13.2% |
| 45 to 54 Years | 189 | 37.1% |
| 55 to 64 Years | 135 | 26.5% |
| 65 to 74 Years | 41 | 8.1% |
| 75 to 84 Years | 11 | 2.2% |
| 85 Years and Over | 16 | 3.1% |
| Total | 509 | 100.0% |
Housing Finances in Hurley
Median Income by Occupancy in Hurley
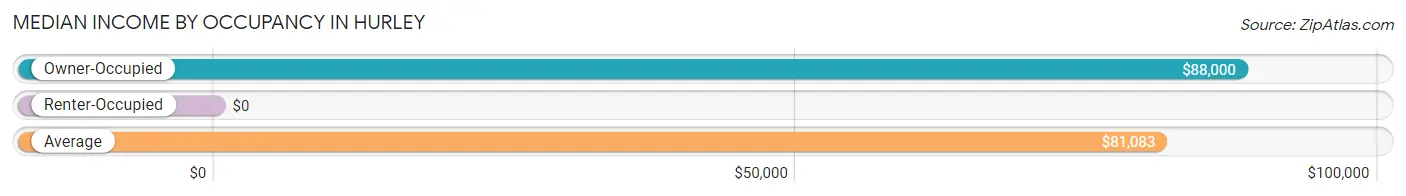
| Occupancy Type | # Households | Median Income |
| Owner-Occupied | 484 (95.1%) | $88,000 |
| Renter-Occupied | 25 (4.9%) | $0 |
| Average | 509 (100.0%) | $81,083 |
Occupancy by Householder Income Bracket in Hurley
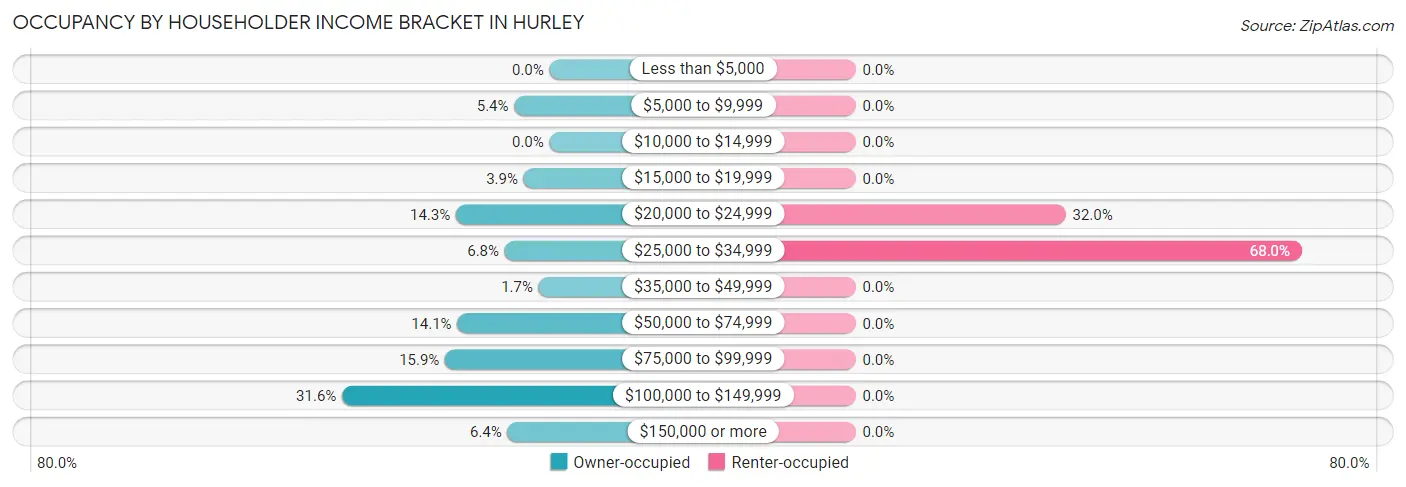
| Income Bracket | Owner-occupied | Renter-occupied |
| Less than $5,000 | 0 (0.0%) | 0 (0.0%) |
| $5,000 to $9,999 | 26 (5.4%) | 0 (0.0%) |
| $10,000 to $14,999 | 0 (0.0%) | 0 (0.0%) |
| $15,000 to $19,999 | 19 (3.9%) | 0 (0.0%) |
| $20,000 to $24,999 | 69 (14.3%) | 8 (32.0%) |
| $25,000 to $34,999 | 33 (6.8%) | 17 (68.0%) |
| $35,000 to $49,999 | 8 (1.7%) | 0 (0.0%) |
| $50,000 to $74,999 | 68 (14.1%) | 0 (0.0%) |
| $75,000 to $99,999 | 77 (15.9%) | 0 (0.0%) |
| $100,000 to $149,999 | 153 (31.6%) | 0 (0.0%) |
| $150,000 or more | 31 (6.4%) | 0 (0.0%) |
| Total | 484 (100.0%) | 25 (100.0%) |
Monthly Housing Cost Tiers in Hurley
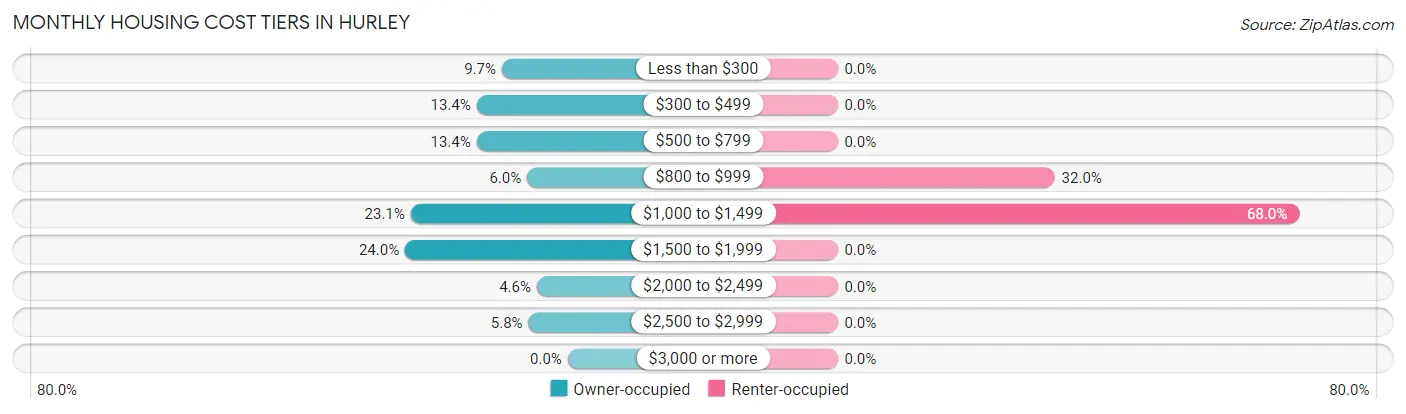
| Monthly Cost | Owner-occupied | Renter-occupied |
| Less than $300 | 47 (9.7%) | 0 (0.0%) |
| $300 to $499 | 65 (13.4%) | 0 (0.0%) |
| $500 to $799 | 65 (13.4%) | 0 (0.0%) |
| $800 to $999 | 29 (6.0%) | 8 (32.0%) |
| $1,000 to $1,499 | 112 (23.1%) | 17 (68.0%) |
| $1,500 to $1,999 | 116 (24.0%) | 0 (0.0%) |
| $2,000 to $2,499 | 22 (4.5%) | 0 (0.0%) |
| $2,500 to $2,999 | 28 (5.8%) | 0 (0.0%) |
| $3,000 or more | 0 (0.0%) | 0 (0.0%) |
| Total | 484 (100.0%) | 25 (100.0%) |
Physical Housing Characteristics in Hurley
Housing Structures in Hurley
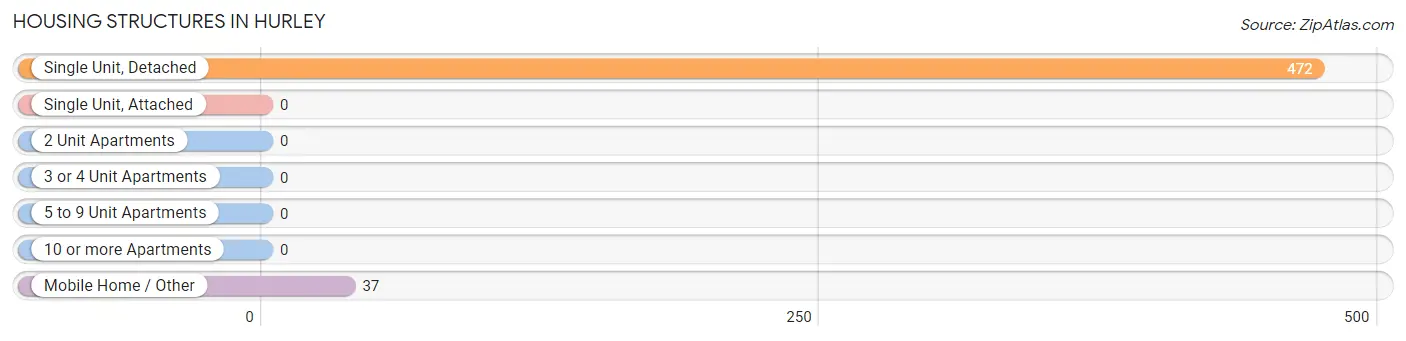
| Structure Type | # Housing Units | % Housing Units |
| Single Unit, Detached | 472 | 92.7% |
| Single Unit, Attached | 0 | 0.0% |
| 2 Unit Apartments | 0 | 0.0% |
| 3 or 4 Unit Apartments | 0 | 0.0% |
| 5 to 9 Unit Apartments | 0 | 0.0% |
| 10 or more Apartments | 0 | 0.0% |
| Mobile Home / Other | 37 | 7.3% |
| Total | 509 | 100.0% |
Housing Structures by Occupancy in Hurley
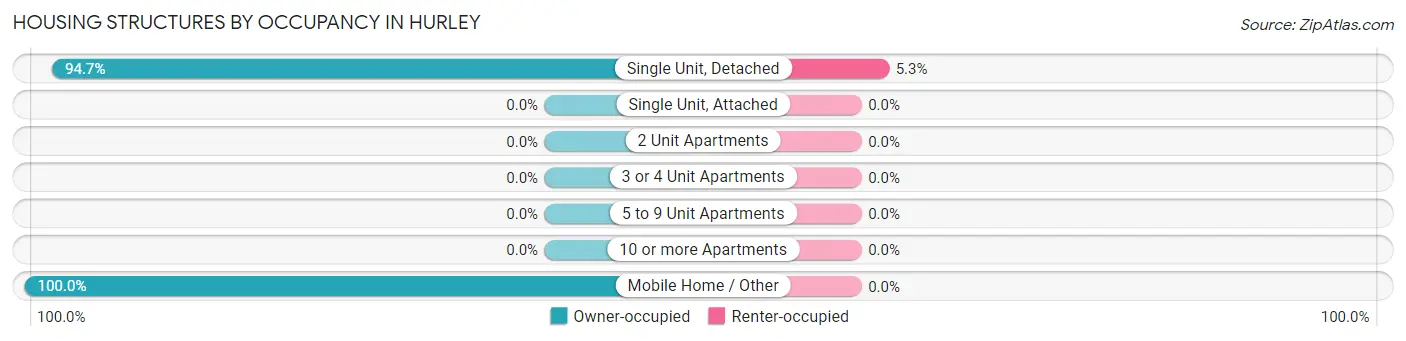
| Structure Type | Owner-occupied | Renter-occupied |
| Single Unit, Detached | 447 (94.7%) | 25 (5.3%) |
| Single Unit, Attached | 0 (0.0%) | 0 (0.0%) |
| 2 Unit Apartments | 0 (0.0%) | 0 (0.0%) |
| 3 or 4 Unit Apartments | 0 (0.0%) | 0 (0.0%) |
| 5 to 9 Unit Apartments | 0 (0.0%) | 0 (0.0%) |
| 10 or more Apartments | 0 (0.0%) | 0 (0.0%) |
| Mobile Home / Other | 37 (100.0%) | 0 (0.0%) |
| Total | 484 (95.1%) | 25 (4.9%) |
Housing Structures by Number of Rooms in Hurley
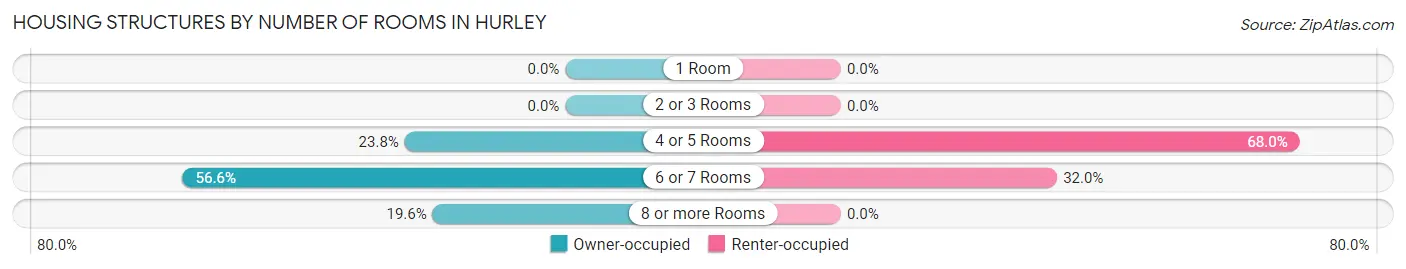
| Number of Rooms | Owner-occupied | Renter-occupied |
| 1 Room | 0 (0.0%) | 0 (0.0%) |
| 2 or 3 Rooms | 0 (0.0%) | 0 (0.0%) |
| 4 or 5 Rooms | 115 (23.8%) | 17 (68.0%) |
| 6 or 7 Rooms | 274 (56.6%) | 8 (32.0%) |
| 8 or more Rooms | 95 (19.6%) | 0 (0.0%) |
| Total | 484 (100.0%) | 25 (100.0%) |
Housing Structure by Heating Type in Hurley
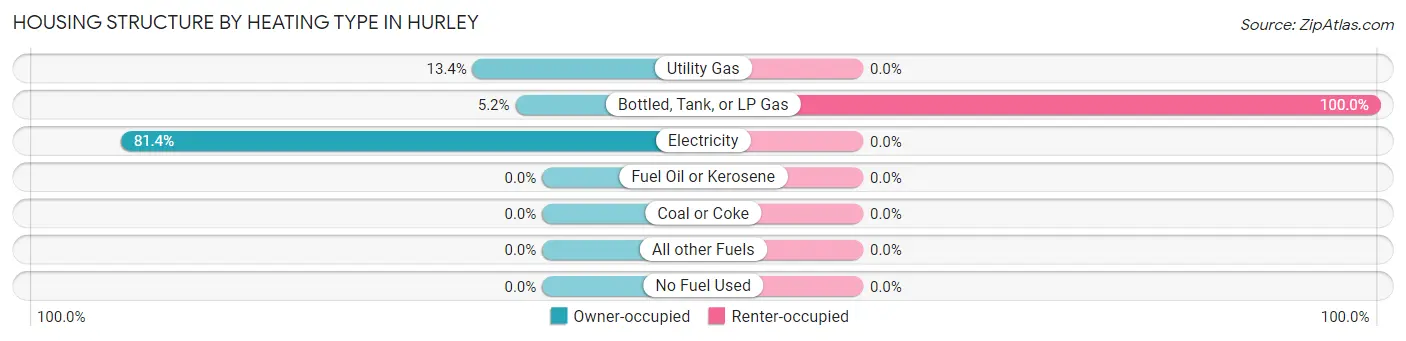
| Heating Type | Owner-occupied | Renter-occupied |
| Utility Gas | 65 (13.4%) | 0 (0.0%) |
| Bottled, Tank, or LP Gas | 25 (5.2%) | 25 (100.0%) |
| Electricity | 394 (81.4%) | 0 (0.0%) |
| Fuel Oil or Kerosene | 0 (0.0%) | 0 (0.0%) |
| Coal or Coke | 0 (0.0%) | 0 (0.0%) |
| All other Fuels | 0 (0.0%) | 0 (0.0%) |
| No Fuel Used | 0 (0.0%) | 0 (0.0%) |
| Total | 484 (100.0%) | 25 (100.0%) |
Household Vehicle Usage in Hurley
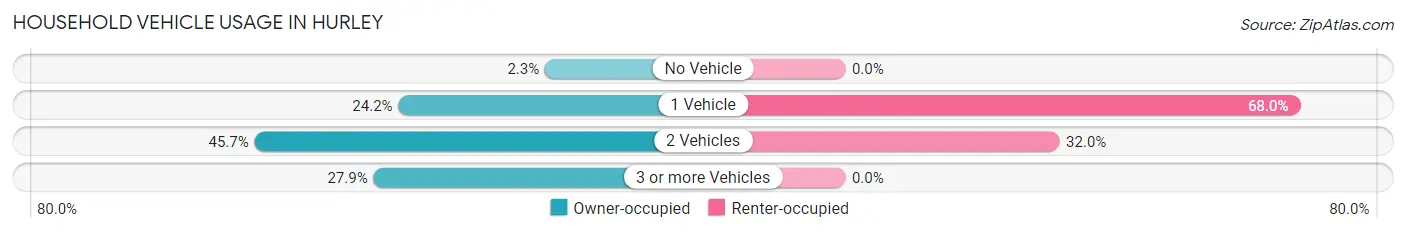
| Vehicles per Household | Owner-occupied | Renter-occupied |
| No Vehicle | 11 (2.3%) | 0 (0.0%) |
| 1 Vehicle | 117 (24.2%) | 17 (68.0%) |
| 2 Vehicles | 221 (45.7%) | 8 (32.0%) |
| 3 or more Vehicles | 135 (27.9%) | 0 (0.0%) |
| Total | 484 (100.0%) | 25 (100.0%) |
Real Estate & Mortgages in Hurley
Real Estate and Mortgage Overview in Hurley
| Characteristic | Without Mortgage | With Mortgage |
| Housing Units | 141 | 343 |
| Median Property Value | $142,600 | $196,700 |
| Median Household Income | - | - |
| Monthly Housing Costs | $341 | $0 |
| Real Estate Taxes | $838 | $42 |
Property Value by Mortgage Status in Hurley
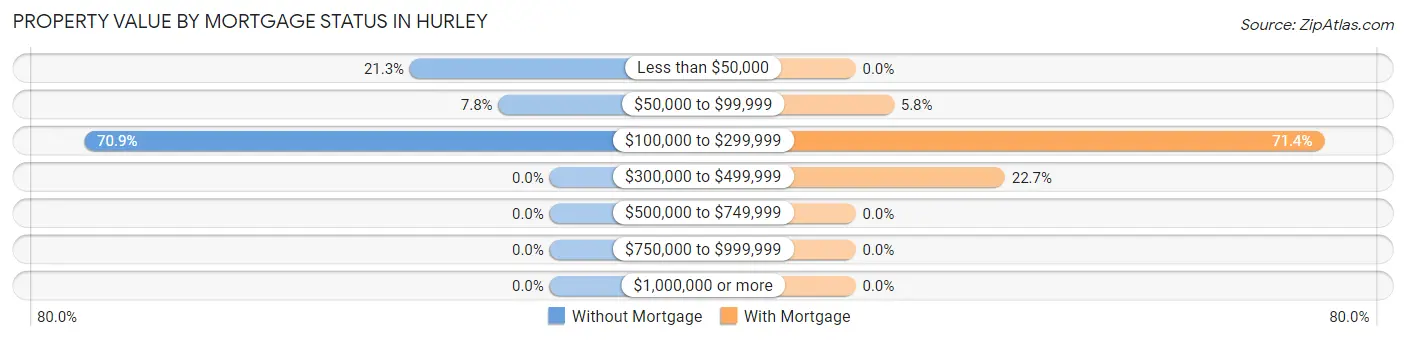
| Property Value | Without Mortgage | With Mortgage |
| Less than $50,000 | 30 (21.3%) | 0 (0.0%) |
| $50,000 to $99,999 | 11 (7.8%) | 20 (5.8%) |
| $100,000 to $299,999 | 100 (70.9%) | 245 (71.4%) |
| $300,000 to $499,999 | 0 (0.0%) | 78 (22.7%) |
| $500,000 to $749,999 | 0 (0.0%) | 0 (0.0%) |
| $750,000 to $999,999 | 0 (0.0%) | 0 (0.0%) |
| $1,000,000 or more | 0 (0.0%) | 0 (0.0%) |
| Total | 141 (100.0%) | 343 (100.0%) |
Household Income by Mortgage Status in Hurley
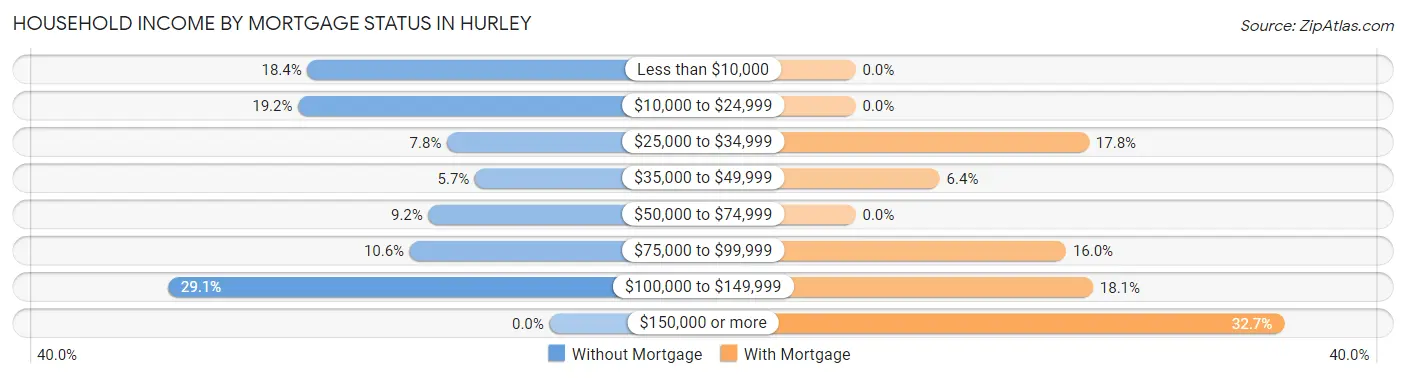
| Household Income | Without Mortgage | With Mortgage |
| Less than $10,000 | 26 (18.4%) | 0 (0.0%) |
| $10,000 to $24,999 | 27 (19.2%) | 0 (0.0%) |
| $25,000 to $34,999 | 11 (7.8%) | 61 (17.8%) |
| $35,000 to $49,999 | 8 (5.7%) | 22 (6.4%) |
| $50,000 to $74,999 | 13 (9.2%) | 0 (0.0%) |
| $75,000 to $99,999 | 15 (10.6%) | 55 (16.0%) |
| $100,000 to $149,999 | 41 (29.1%) | 62 (18.1%) |
| $150,000 or more | 0 (0.0%) | 112 (32.7%) |
| Total | 141 (100.0%) | 343 (100.0%) |
Property Value to Household Income Ratio in Hurley
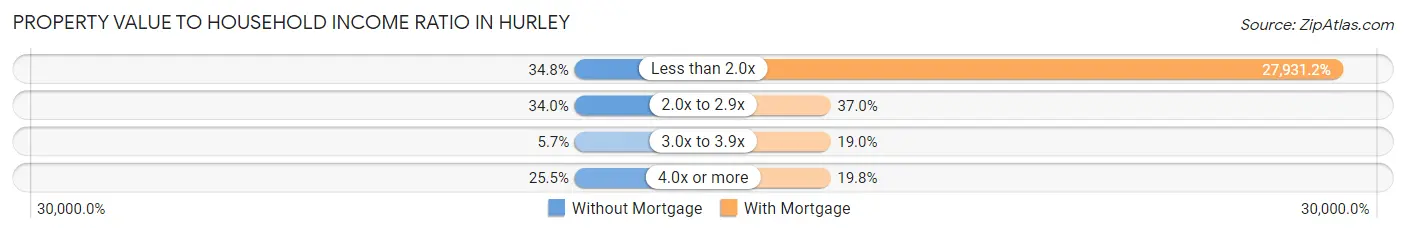
| Value-to-Income Ratio | Without Mortgage | With Mortgage |
| Less than 2.0x | 49 (34.7%) | 95,804 (27,931.2%) |
| 2.0x to 2.9x | 48 (34.0%) | 127 (37.0%) |
| 3.0x to 3.9x | 8 (5.7%) | 65 (19.0%) |
| 4.0x or more | 36 (25.5%) | 68 (19.8%) |
| Total | 141 (100.0%) | 343 (100.0%) |
Real Estate Taxes by Mortgage Status in Hurley
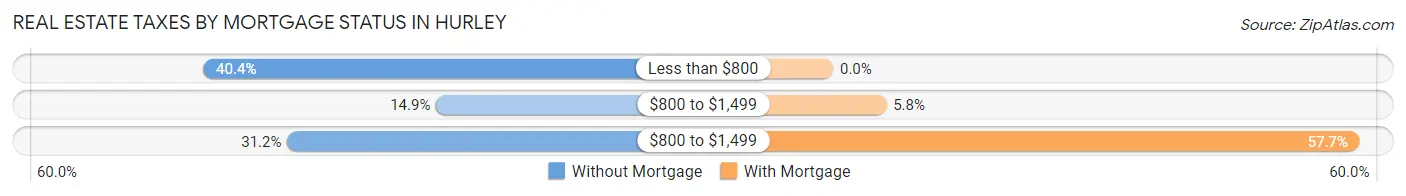
| Property Taxes | Without Mortgage | With Mortgage |
| Less than $800 | 57 (40.4%) | 0 (0.0%) |
| $800 to $1,499 | 21 (14.9%) | 20 (5.8%) |
| $800 to $1,499 | 44 (31.2%) | 198 (57.7%) |
| Total | 141 (100.0%) | 343 (100.0%) |
Health & Disability in Hurley
Health Insurance Coverage by Age in Hurley
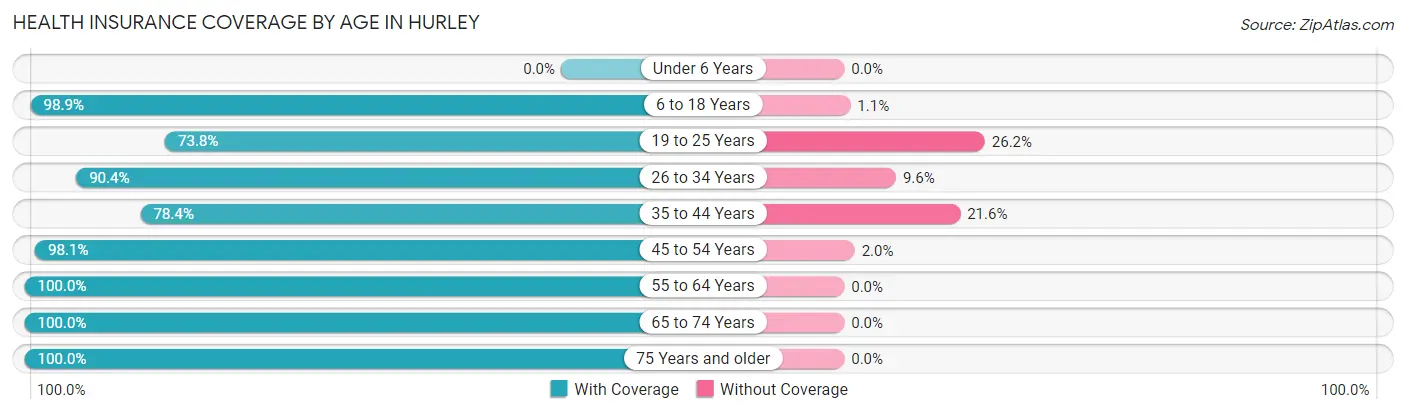
| Age Bracket | With Coverage | Without Coverage |
| Under 6 Years | 0 (0.0%) | 0 (0.0%) |
| 6 to 18 Years | 435 (98.9%) | 5 (1.1%) |
| 19 to 25 Years | 107 (73.8%) | 38 (26.2%) |
| 26 to 34 Years | 75 (90.4%) | 8 (9.6%) |
| 35 to 44 Years | 116 (78.4%) | 32 (21.6%) |
| 45 to 54 Years | 251 (98.1%) | 5 (1.9%) |
| 55 to 64 Years | 210 (100.0%) | 0 (0.0%) |
| 65 to 74 Years | 68 (100.0%) | 0 (0.0%) |
| 75 Years and older | 41 (100.0%) | 0 (0.0%) |
| Total | 1,303 (93.7%) | 88 (6.3%) |
Health Insurance Coverage by Citizenship Status in Hurley
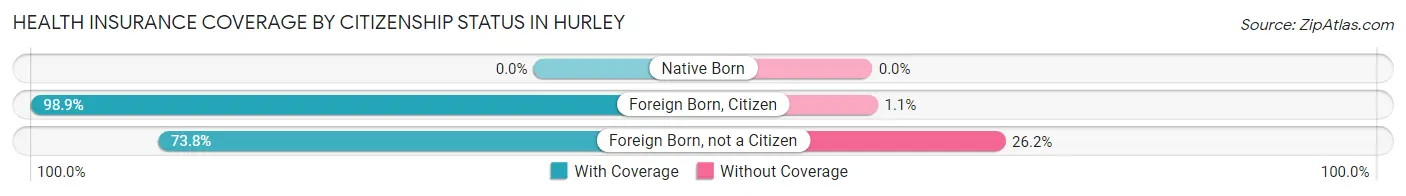
| Citizenship Status | With Coverage | Without Coverage |
| Native Born | 0 (0.0%) | 0 (0.0%) |
| Foreign Born, Citizen | 435 (98.9%) | 5 (1.1%) |
| Foreign Born, not a Citizen | 107 (73.8%) | 38 (26.2%) |
Health Insurance Coverage by Household Income in Hurley
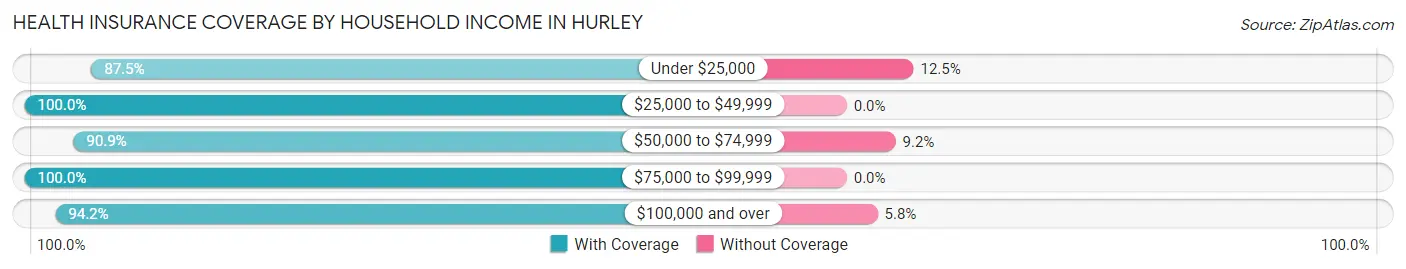
| Household Income | With Coverage | Without Coverage |
| Under $25,000 | 245 (87.5%) | 35 (12.5%) |
| $25,000 to $49,999 | 83 (100.0%) | 0 (0.0%) |
| $50,000 to $74,999 | 149 (90.8%) | 15 (9.1%) |
| $75,000 to $99,999 | 189 (100.0%) | 0 (0.0%) |
| $100,000 and over | 621 (94.2%) | 38 (5.8%) |
Public vs Private Health Insurance Coverage by Age in Hurley
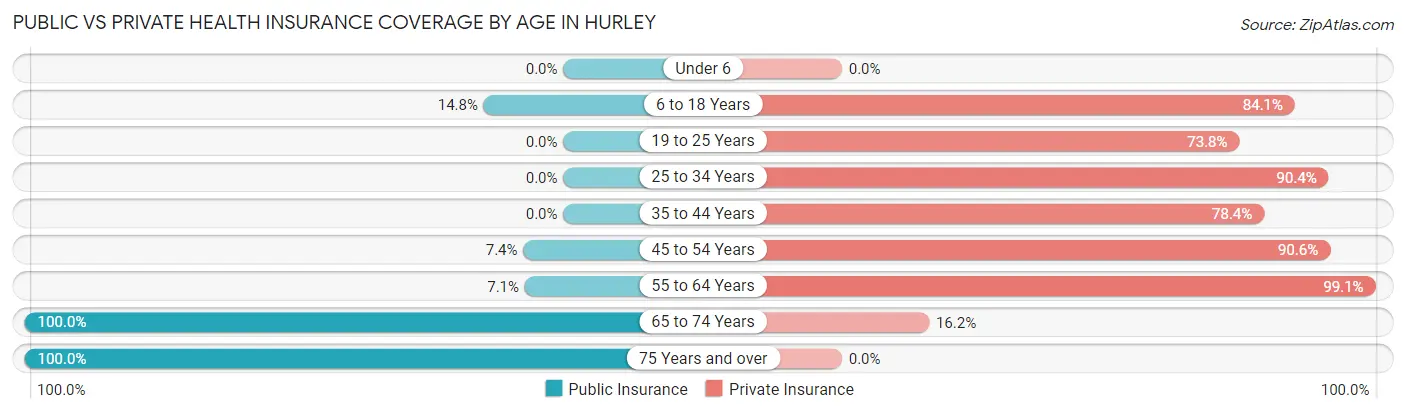
| Age Bracket | Public Insurance | Private Insurance |
| Under 6 | 0 (0.0%) | 0 (0.0%) |
| 6 to 18 Years | 65 (14.8%) | 370 (84.1%) |
| 19 to 25 Years | 0 (0.0%) | 107 (73.8%) |
| 25 to 34 Years | 0 (0.0%) | 75 (90.4%) |
| 35 to 44 Years | 0 (0.0%) | 116 (78.4%) |
| 45 to 54 Years | 19 (7.4%) | 232 (90.6%) |
| 55 to 64 Years | 15 (7.1%) | 208 (99.1%) |
| 65 to 74 Years | 68 (100.0%) | 11 (16.2%) |
| 75 Years and over | 41 (100.0%) | 0 (0.0%) |
| Total | 208 (14.9%) | 1,119 (80.4%) |
Disability Status by Sex by Age in Hurley
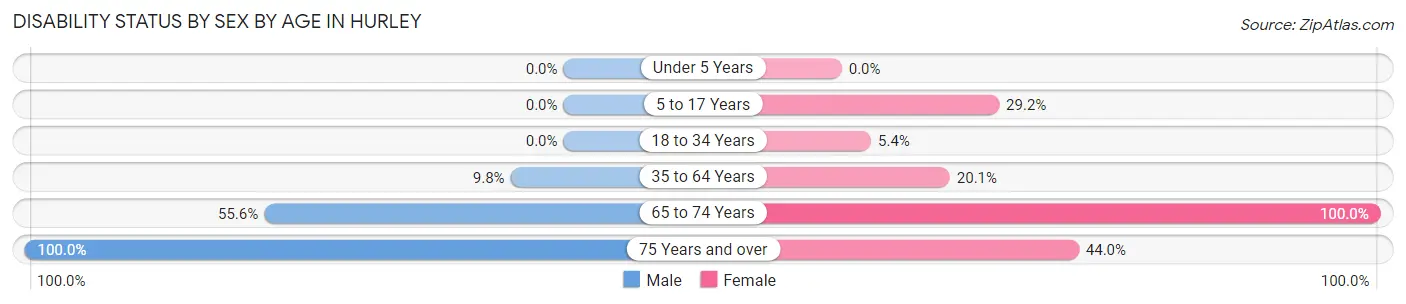
| Age Bracket | Male | Female |
| Under 5 Years | 0 (0.0%) | 0 (0.0%) |
| 5 to 17 Years | 0 (0.0%) | 59 (29.2%) |
| 18 to 34 Years | 0 (0.0%) | 8 (5.4%) |
| 35 to 64 Years | 28 (9.8%) | 66 (20.1%) |
| 65 to 74 Years | 15 (55.6%) | 41 (100.0%) |
| 75 Years and over | 16 (100.0%) | 11 (44.0%) |
Disability Class by Sex by Age in Hurley
Disability Class: Hearing Difficulty
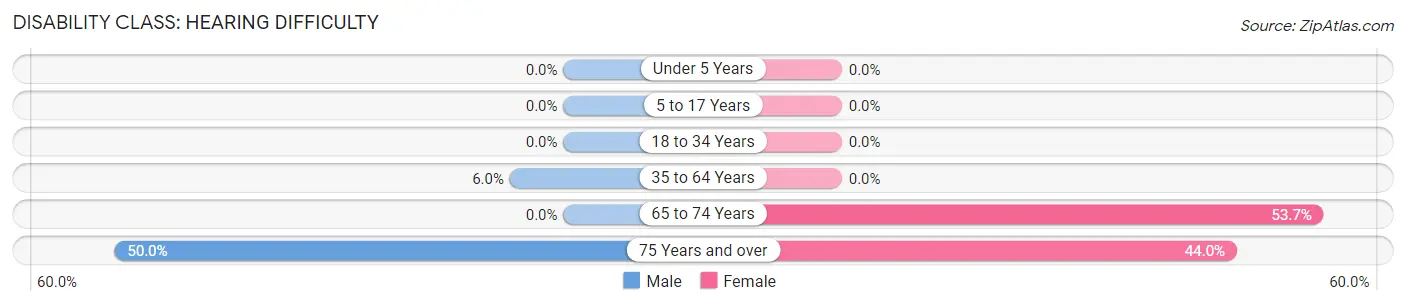
| Age Bracket | Male | Female |
| Under 5 Years | 0 (0.0%) | 0 (0.0%) |
| 5 to 17 Years | 0 (0.0%) | 0 (0.0%) |
| 18 to 34 Years | 0 (0.0%) | 0 (0.0%) |
| 35 to 64 Years | 17 (6.0%) | 0 (0.0%) |
| 65 to 74 Years | 0 (0.0%) | 22 (53.7%) |
| 75 Years and over | 8 (50.0%) | 11 (44.0%) |
Disability Class: Vision Difficulty
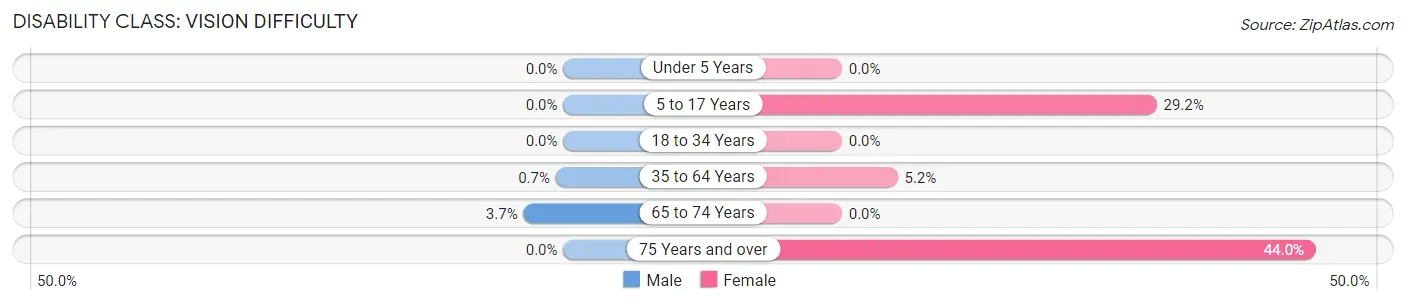
| Age Bracket | Male | Female |
| Under 5 Years | 0 (0.0%) | 0 (0.0%) |
| 5 to 17 Years | 0 (0.0%) | 59 (29.2%) |
| 18 to 34 Years | 0 (0.0%) | 0 (0.0%) |
| 35 to 64 Years | 2 (0.7%) | 17 (5.2%) |
| 65 to 74 Years | 1 (3.7%) | 0 (0.0%) |
| 75 Years and over | 0 (0.0%) | 11 (44.0%) |
Disability Class: Cognitive Difficulty
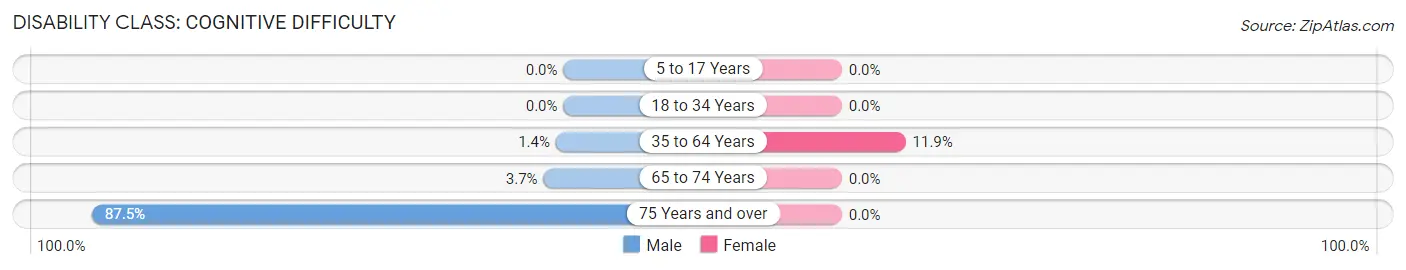
| Age Bracket | Male | Female |
| 5 to 17 Years | 0 (0.0%) | 0 (0.0%) |
| 18 to 34 Years | 0 (0.0%) | 0 (0.0%) |
| 35 to 64 Years | 4 (1.4%) | 39 (11.8%) |
| 65 to 74 Years | 1 (3.7%) | 0 (0.0%) |
| 75 Years and over | 14 (87.5%) | 0 (0.0%) |
Disability Class: Ambulatory Difficulty
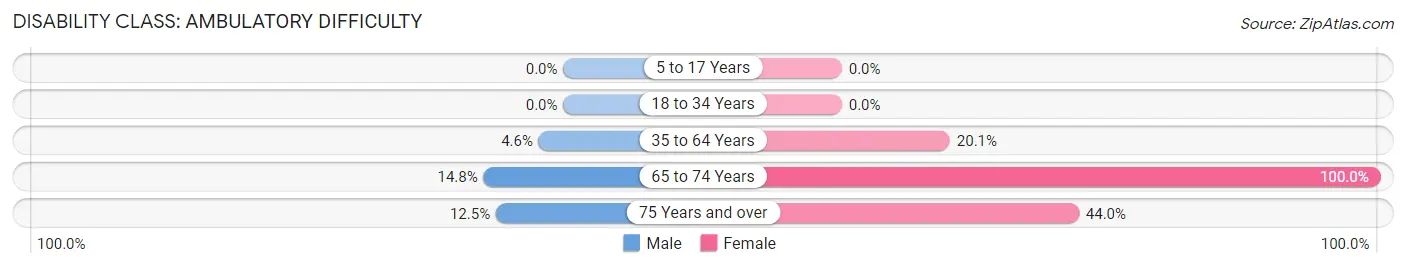
| Age Bracket | Male | Female |
| 5 to 17 Years | 0 (0.0%) | 0 (0.0%) |
| 18 to 34 Years | 0 (0.0%) | 0 (0.0%) |
| 35 to 64 Years | 13 (4.6%) | 66 (20.1%) |
| 65 to 74 Years | 4 (14.8%) | 41 (100.0%) |
| 75 Years and over | 2 (12.5%) | 11 (44.0%) |
Disability Class: Self-Care Difficulty
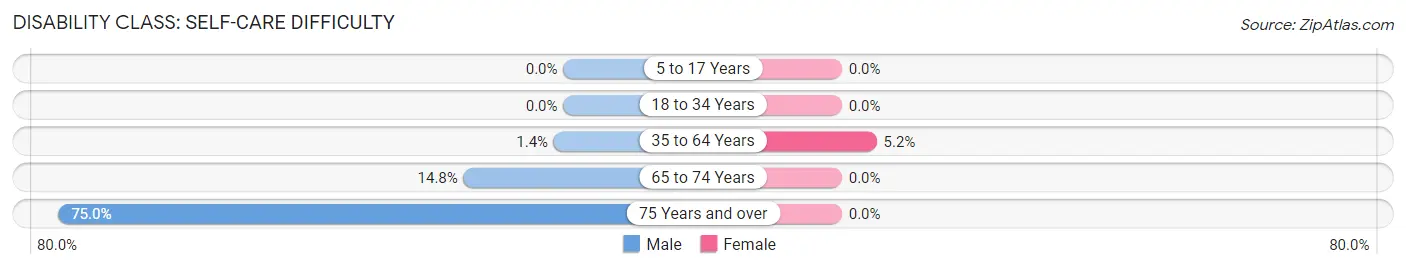
| Age Bracket | Male | Female |
| 5 to 17 Years | 0 (0.0%) | 0 (0.0%) |
| 18 to 34 Years | 0 (0.0%) | 0 (0.0%) |
| 35 to 64 Years | 4 (1.4%) | 17 (5.2%) |
| 65 to 74 Years | 4 (14.8%) | 0 (0.0%) |
| 75 Years and over | 12 (75.0%) | 0 (0.0%) |
Technology Access in Hurley
Computing Device Access in Hurley
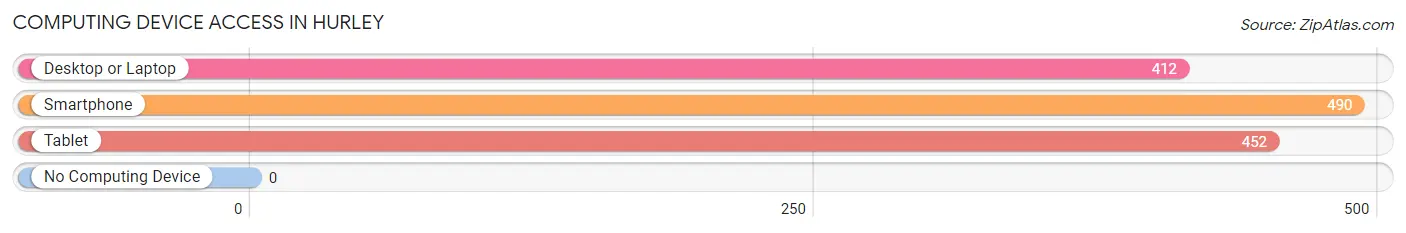
| Device Type | # Households | % Households |
| Desktop or Laptop | 412 | 80.9% |
| Smartphone | 490 | 96.3% |
| Tablet | 452 | 88.8% |
| No Computing Device | 0 | 0.0% |
| Total | 509 | 100.0% |
Internet Access in Hurley
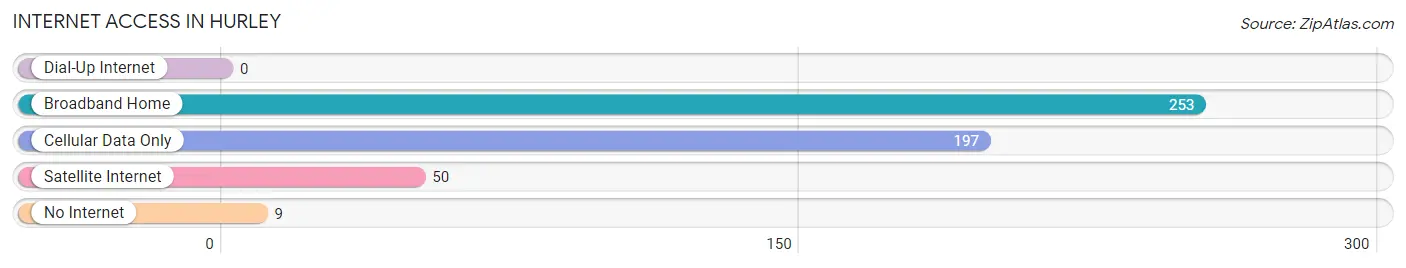
| Internet Type | # Households | % Households |
| Dial-Up Internet | 0 | 0.0% |
| Broadband Home | 253 | 49.7% |
| Cellular Data Only | 197 | 38.7% |
| Satellite Internet | 50 | 9.8% |
| No Internet | 9 | 1.8% |
| Total | 509 | 100.0% |
Hurley Summary
Hurley, Mississippi is a small town located in Jackson County, Mississippi. It is situated on the banks of the Pascagoula River, approximately 20 miles east of the state capital of Jackson. The town was founded in 1883 and has a population of approximately 2,000 people.
History
Hurley was founded in 1883 by a group of settlers from the nearby town of Pascagoula. The town was named after the first postmaster, William Hurley. The town was originally a farming community, but it soon became a center for the lumber industry. The lumber industry was the main source of income for the town until the early 1900s when the timber industry began to decline.
In the early 1900s, the town began to diversify its economy by becoming a center for the seafood industry. The seafood industry was a major source of income for the town until the late 1970s when the industry began to decline.
In the late 1970s, the town began to diversify its economy again by becoming a center for the oil and gas industry. The oil and gas industry was a major source of income for the town until the early 2000s when the industry began to decline.
Geography
Hurley is located in Jackson County, Mississippi. It is situated on the banks of the Pascagoula River, approximately 20 miles east of the state capital of Jackson. The town is located in a rural area and is surrounded by forests and farmland. The town is located in a humid subtropical climate zone and experiences hot, humid summers and mild winters.
Economy
The economy of Hurley is largely based on the oil and gas industry. The town is home to several oil and gas companies, including Chevron, Shell, and BP. The town is also home to several seafood processing plants, which process and package seafood for local and national markets.
The town is also home to several small businesses, including restaurants, retail stores, and service providers. The town is also home to several manufacturing companies, which produce a variety of products, including furniture, clothing, and electronics.
Demographics
As of the 2010 census, the population of Hurley was 2,000 people. The racial makeup of the town was 95.2% White, 2.2% African American, 0.7% Native American, 0.3% Asian, and 1.6% from other races. The median household income was $37,500 and the median family income was $45,000.
Conclusion
Hurley, Mississippi is a small town located in Jackson County, Mississippi. It was founded in 1883 and has a population of approximately 2,000 people. The town is situated on the banks of the Pascagoula River and is surrounded by forests and farmland. The economy of Hurley is largely based on the oil and gas industry, seafood processing plants, and small businesses. The racial makeup of the town is 95.2% White, 2.2% African American, 0.7% Native American, 0.3% Asian, and 1.6% from other races. The median household income was $37,500 and the median family income was $45,000.
Common Questions
What is Per Capita Income in Hurley?
Per Capita income in Hurley is $28,768.
What is the Median Family Income in Hurley?
Median Family Income in Hurley is $64,000.
What is the Median Household income in Hurley?
Median Household Income in Hurley is $81,083.
What is Income or Wage Gap in Hurley?
Income or Wage Gap in Hurley is 56.7%.
Women in Hurley earn 43.3 cents for every dollar earned by a man.
What is Inequality or Gini Index in Hurley?
Inequality or Gini Index in Hurley is 0.36.
What is the Total Population of Hurley?
Total Population of Hurley is 1,391.
What is the Total Male Population of Hurley?
Total Male Population of Hurley is 647.
What is the Total Female Population of Hurley?
Total Female Population of Hurley is 744.
What is the Ratio of Males per 100 Females in Hurley?
There are 86.96 Males per 100 Females in Hurley.
What is the Ratio of Females per 100 Males in Hurley?
There are 114.99 Females per 100 Males in Hurley.
What is the Median Population Age in Hurley?
Median Population Age in Hurley is 36.0 Years.
What is the Average Family Size in Hurley
Average Family Size in Hurley is 2.7 People.
What is the Average Household Size in Hurley
Average Household Size in Hurley is 2.7 People.
How Large is the Labor Force in Hurley?
There are 709 People in the Labor Forcein in Hurley.
What is the Percentage of People in the Labor Force in Hurley?
63.0% of People are in the Labor Force in Hurley.
What is the Unemployment Rate in Hurley?
Unemployment Rate in Hurley is 1.3%.