Waynesboro, MS Map & Demographics
Waynesboro Map
Waynesboro Overview
$19,623
PER CAPITA INCOME
$29,903
AVG FAMILY INCOME
$24,779
AVG HOUSEHOLD INCOME
30.5%
WAGE / INCOME GAP [ % ]
69.5¢/ $1
WAGE / INCOME GAP [ $ ]
0.56
INEQUALITY / GINI INDEX
4,576
TOTAL POPULATION
2,284
MALE POPULATION
2,292
FEMALE POPULATION
99.65
MALES / 100 FEMALES
100.35
FEMALES / 100 MALES
38.1
MEDIAN AGE
2.9
AVG FAMILY SIZE
2.5
AVG HOUSEHOLD SIZE
1,288
LABOR FORCE [ PEOPLE ]
37.2%
PERCENT IN LABOR FORCE
5.2%
UNEMPLOYMENT RATE
Waynesboro Zip Codes
Waynesboro Area Codes
Income in Waynesboro
Income Overview in Waynesboro
Per Capita Income in Waynesboro is $19,623, while median incomes of families and households are $29,903 and $24,779 respectively.
| Characteristic | Number | Measure |
| Per Capita Income | 4,576 | $19,623 |
| Median Family Income | 1,272 | $29,903 |
| Mean Family Income | 1,272 | $49,691 |
| Median Household Income | 1,788 | $24,779 |
| Mean Household Income | 1,788 | $47,293 |
| Income Deficit | 1,272 | $0 |
| Wage / Income Gap (%) | 4,576 | 30.47% |
| Wage / Income Gap ($) | 4,576 | 69.53¢ per $1 |
| Gini / Inequality Index | 4,576 | 0.56 |
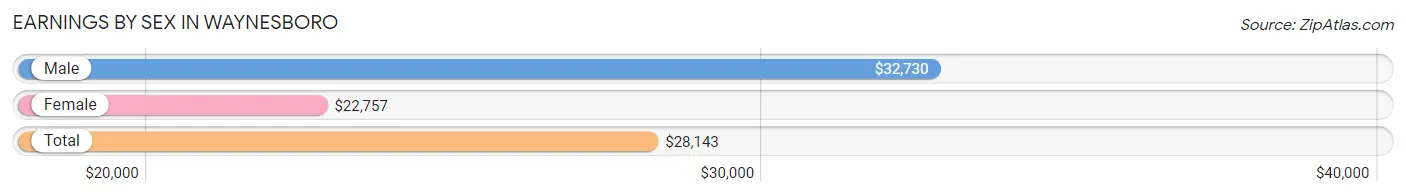
Earnings by Sex in Waynesboro
Average Earnings in Waynesboro are $28,143, $32,730 for men and $22,757 for women, a difference of 30.5%.
| Sex | Number | Average Earnings |
| Male | 667 (43.9%) | $32,730 |
| Female | 851 (56.1%) | $22,757 |
| Total | 1,518 (100.0%) | $28,143 |
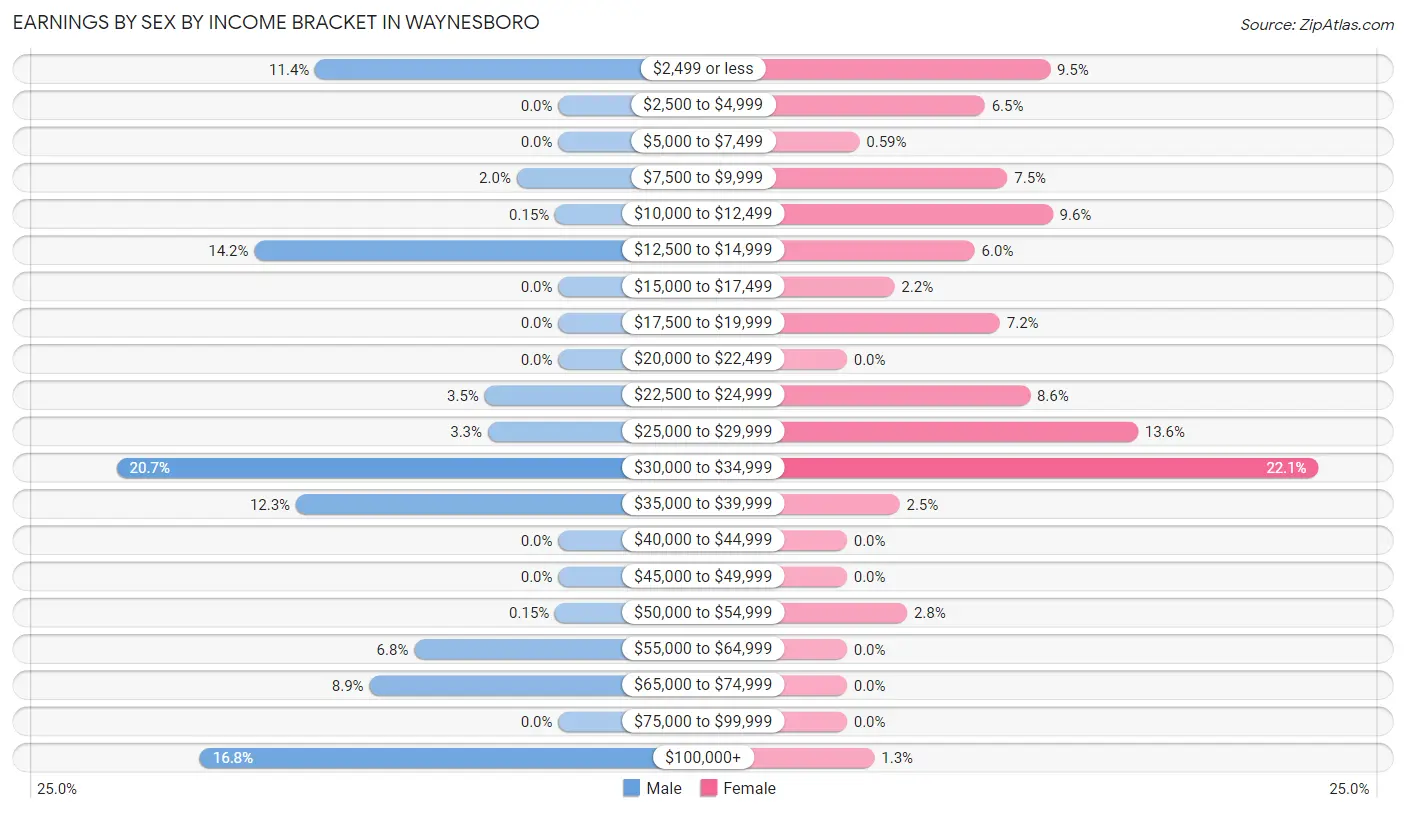
Earnings by Sex by Income Bracket in Waynesboro
The most common earnings brackets in Waynesboro are $30,000 to $34,999 for men (138 | 20.7%) and $30,000 to $34,999 for women (188 | 22.1%).
| Income | Male | Female |
| $2,499 or less | 76 (11.4%) | 81 (9.5%) |
| $2,500 to $4,999 | 0 (0.0%) | 55 (6.5%) |
| $5,000 to $7,499 | 0 (0.0%) | 5 (0.6%) |
| $7,500 to $9,999 | 13 (1.9%) | 64 (7.5%) |
| $10,000 to $12,499 | 1 (0.2%) | 82 (9.6%) |
| $12,500 to $14,999 | 95 (14.2%) | 51 (6.0%) |
| $15,000 to $17,499 | 0 (0.0%) | 19 (2.2%) |
| $17,500 to $19,999 | 0 (0.0%) | 61 (7.2%) |
| $20,000 to $22,499 | 0 (0.0%) | 0 (0.0%) |
| $22,500 to $24,999 | 23 (3.5%) | 73 (8.6%) |
| $25,000 to $29,999 | 22 (3.3%) | 116 (13.6%) |
| $30,000 to $34,999 | 138 (20.7%) | 188 (22.1%) |
| $35,000 to $39,999 | 82 (12.3%) | 21 (2.5%) |
| $40,000 to $44,999 | 0 (0.0%) | 0 (0.0%) |
| $45,000 to $49,999 | 0 (0.0%) | 0 (0.0%) |
| $50,000 to $54,999 | 1 (0.2%) | 24 (2.8%) |
| $55,000 to $64,999 | 45 (6.8%) | 0 (0.0%) |
| $65,000 to $74,999 | 59 (8.8%) | 0 (0.0%) |
| $75,000 to $99,999 | 0 (0.0%) | 0 (0.0%) |
| $100,000+ | 112 (16.8%) | 11 (1.3%) |
| Total | 667 (100.0%) | 851 (100.0%) |
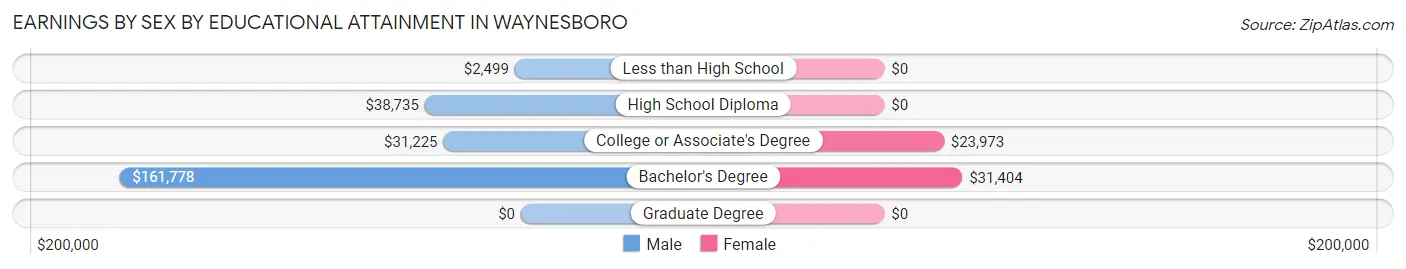
Earnings by Sex by Educational Attainment in Waynesboro
Average earnings in Waynesboro are $32,138 for men and $23,442 for women, a difference of 27.1%. Men with an educational attainment of bachelor's degree enjoy the highest average annual earnings of $161,778, while those with less than high school education earn the least with $2,499. Women with an educational attainment of bachelor's degree earn the most with the average annual earnings of $31,404, while those with college or associate's degree education have the smallest earnings of $23,973.
| Educational Attainment | Male Income | Female Income |
| Less than High School | $2,499 | $0 |
| High School Diploma | $38,735 | $0 |
| College or Associate's Degree | $31,225 | $23,973 |
| Bachelor's Degree | $161,778 | $31,404 |
| Graduate Degree | - | - |
| Total | $32,138 | $23,442 |
Family Income in Waynesboro
Family Income Brackets in Waynesboro
According to the Waynesboro family income data, there are 310 families falling into the $15,000 to $24,999 income range, which is the most common income bracket and makes up 24.4% of all families. Conversely, the $10,000 to $14,999 income bracket is the least frequent group with only 28 families (2.2%) belonging to this category.
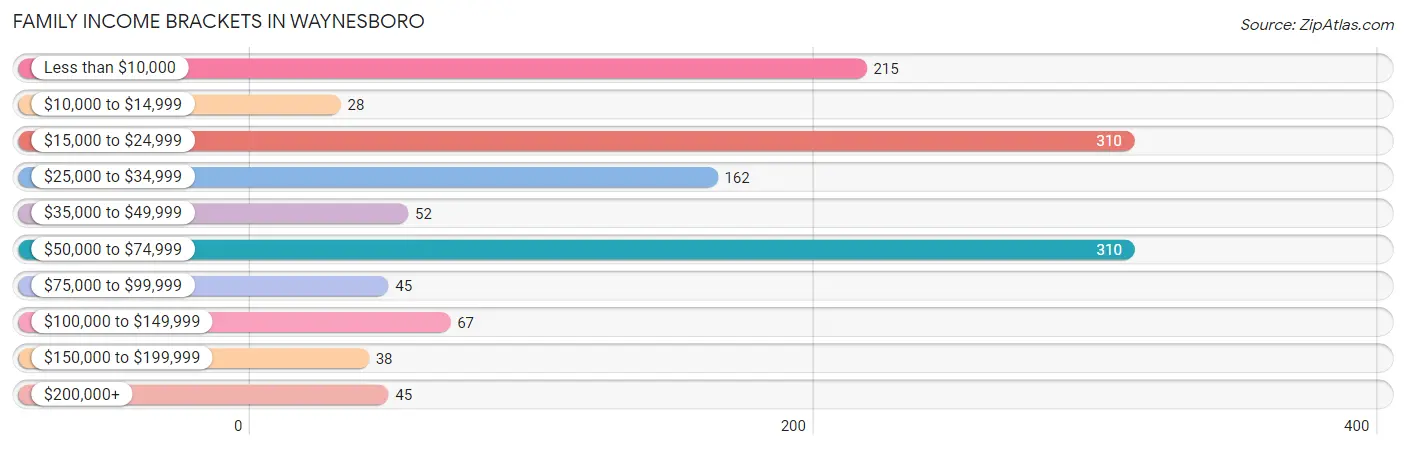
| Income Bracket | # Families | % Families |
| Less than $10,000 | 215 | 16.9% |
| $10,000 to $14,999 | 28 | 2.2% |
| $15,000 to $24,999 | 310 | 24.4% |
| $25,000 to $34,999 | 162 | 12.7% |
| $35,000 to $49,999 | 52 | 4.1% |
| $50,000 to $74,999 | 310 | 24.4% |
| $75,000 to $99,999 | 45 | 3.5% |
| $100,000 to $149,999 | 67 | 5.3% |
| $150,000 to $199,999 | 38 | 3.0% |
| $200,000+ | 45 | 3.5% |
Family Income by Famaliy Size in Waynesboro
4-person families (355 | 27.9%) account for the highest median family income in Waynesboro with $51,274 per family, while 2-person families (742 | 58.3%) have the highest median income of $14,028 per family member.
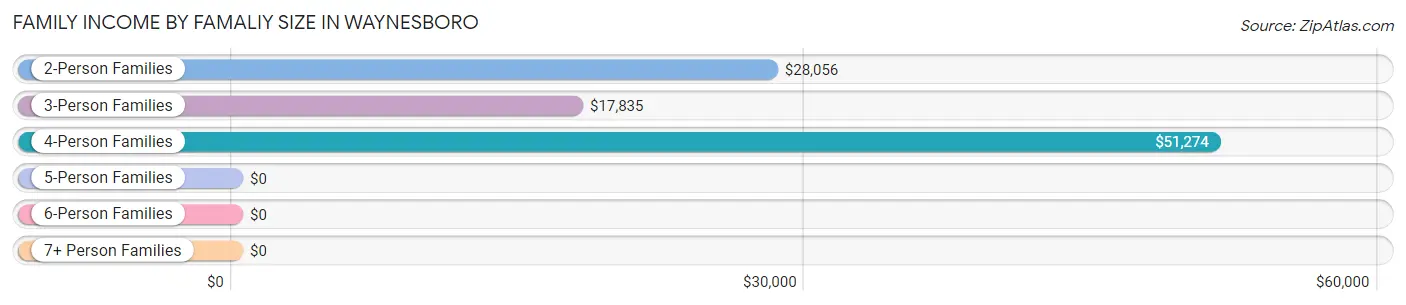
| Income Bracket | # Families | Median Income |
| 2-Person Families | 742 (58.3%) | $28,056 |
| 3-Person Families | 139 (10.9%) | $17,835 |
| 4-Person Families | 355 (27.9%) | $51,274 |
| 5-Person Families | 0 (0.0%) | $0 |
| 6-Person Families | 36 (2.8%) | $0 |
| 7+ Person Families | 0 (0.0%) | $0 |
| Total | 1,272 (100.0%) | $29,903 |
Family Income by Number of Earners in Waynesboro
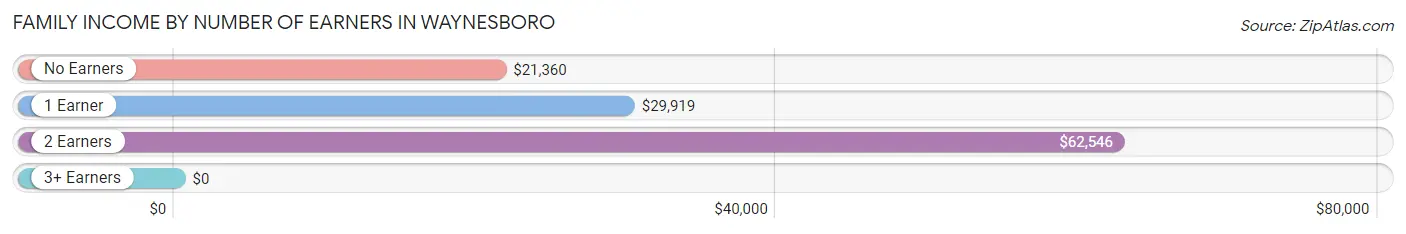
| Number of Earners | # Families | Median Income |
| No Earners | 353 (27.8%) | $21,360 |
| 1 Earner | 661 (52.0%) | $29,919 |
| 2 Earners | 231 (18.2%) | $62,546 |
| 3+ Earners | 27 (2.1%) | $0 |
| Total | 1,272 (100.0%) | $29,903 |
Household Income in Waynesboro
Household Income Brackets in Waynesboro
With 336 households falling in the category, the $15,000 to $24,999 income range is the most frequent in Waynesboro, accounting for 18.8% of all households. In contrast, only 38 households (2.1%) fall into the $150,000 to $199,999 income bracket, making it the least populous group.
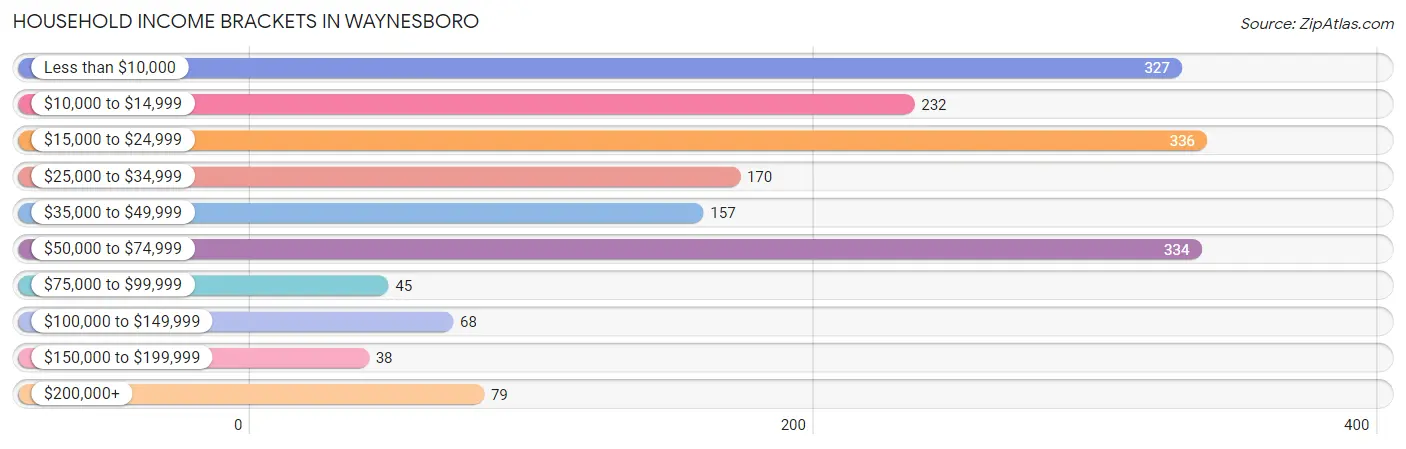
| Income Bracket | # Households | % Households |
| Less than $10,000 | 327 | 18.3% |
| $10,000 to $14,999 | 232 | 13.0% |
| $15,000 to $24,999 | 336 | 18.8% |
| $25,000 to $34,999 | 170 | 9.5% |
| $35,000 to $49,999 | 157 | 8.8% |
| $50,000 to $74,999 | 334 | 18.7% |
| $75,000 to $99,999 | 45 | 2.5% |
| $100,000 to $149,999 | 68 | 3.8% |
| $150,000 to $199,999 | 38 | 2.1% |
| $200,000+ | 79 | 4.4% |
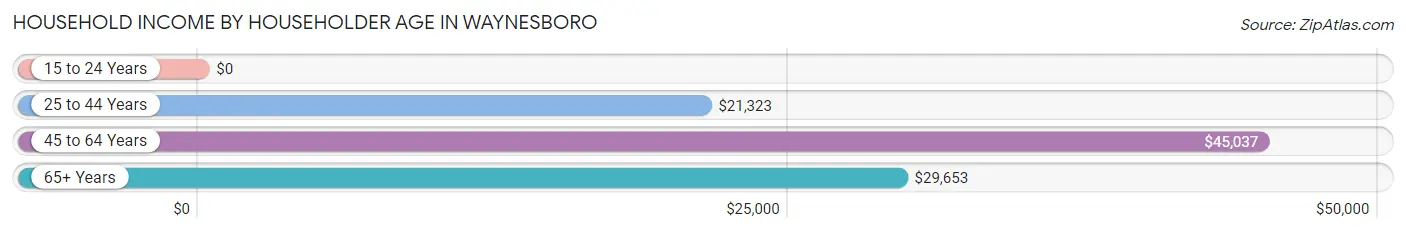
Household Income by Householder Age in Waynesboro
The median household income in Waynesboro is $24,779, with the highest median household income of $45,037 found in the 45 to 64 years age bracket for the primary householder. A total of 621 households (34.7%) fall into this category. Meanwhile, the 15 to 24 years age bracket for the primary householder has the lowest median household income of $0, with 79 households (4.4%) in this group.
| Income Bracket | # Households | Median Income |
| 15 to 24 Years | 79 (4.4%) | $0 |
| 25 to 44 Years | 587 (32.8%) | $21,323 |
| 45 to 64 Years | 621 (34.7%) | $45,037 |
| 65+ Years | 501 (28.0%) | $29,653 |
| Total | 1,788 (100.0%) | $24,779 |
Poverty in Waynesboro
Income Below Poverty by Sex and Age in Waynesboro
With 33.8% poverty level for males and 44.8% for females among the residents of Waynesboro, under 5 year old males and under 5 year old females are the most vulnerable to poverty, with 111 males (73.0%) and 111 females (100.0%) in their respective age groups living below the poverty level.
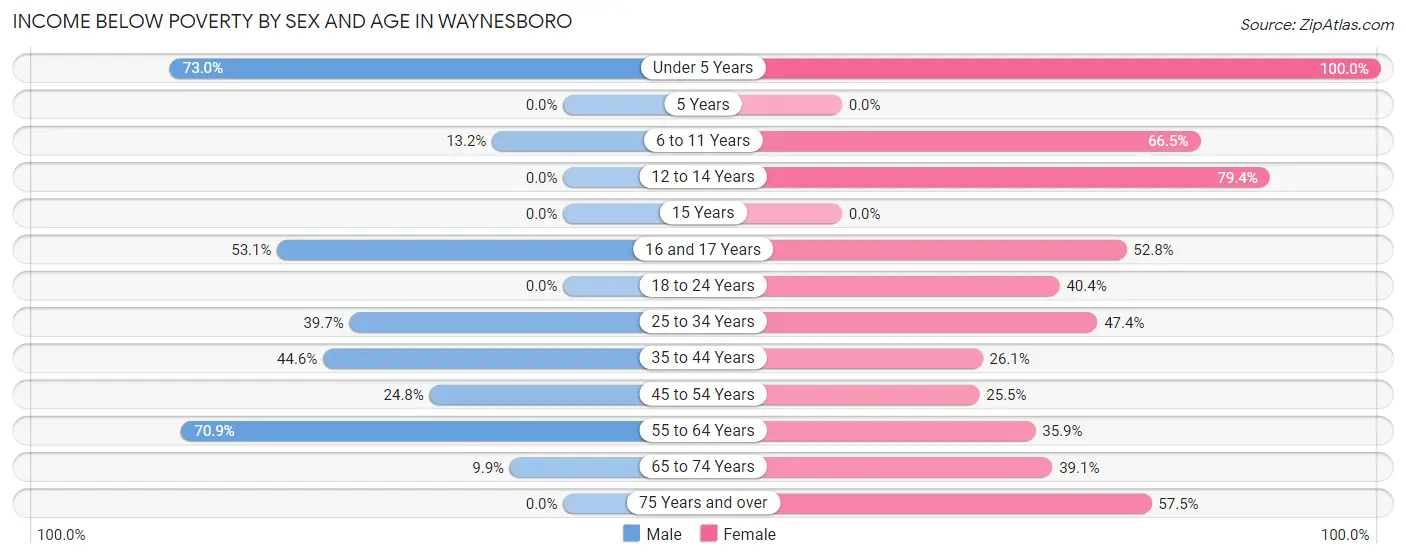
| Age Bracket | Male | Female |
| Under 5 Years | 111 (73.0%) | 111 (100.0%) |
| 5 Years | 0 (0.0%) | 0 (0.0%) |
| 6 to 11 Years | 21 (13.2%) | 155 (66.5%) |
| 12 to 14 Years | 0 (0.0%) | 135 (79.4%) |
| 15 Years | 0 (0.0%) | 0 (0.0%) |
| 16 and 17 Years | 60 (53.1%) | 28 (52.8%) |
| 18 to 24 Years | 0 (0.0%) | 78 (40.4%) |
| 25 to 34 Years | 160 (39.7%) | 64 (47.4%) |
| 35 to 44 Years | 66 (44.6%) | 109 (26.1%) |
| 45 to 54 Years | 69 (24.8%) | 94 (25.5%) |
| 55 to 64 Years | 246 (70.9%) | 60 (35.9%) |
| 65 to 74 Years | 23 (9.9%) | 125 (39.1%) |
| 75 Years and over | 0 (0.0%) | 50 (57.5%) |
| Total | 756 (33.8%) | 1,009 (44.8%) |
Income Above Poverty by Sex and Age in Waynesboro
According to the poverty statistics in Waynesboro, males aged 5 years and females aged 45 to 54 years are the age groups that are most secure financially, with 100.0% of males and 74.5% of females in these age groups living above the poverty line.
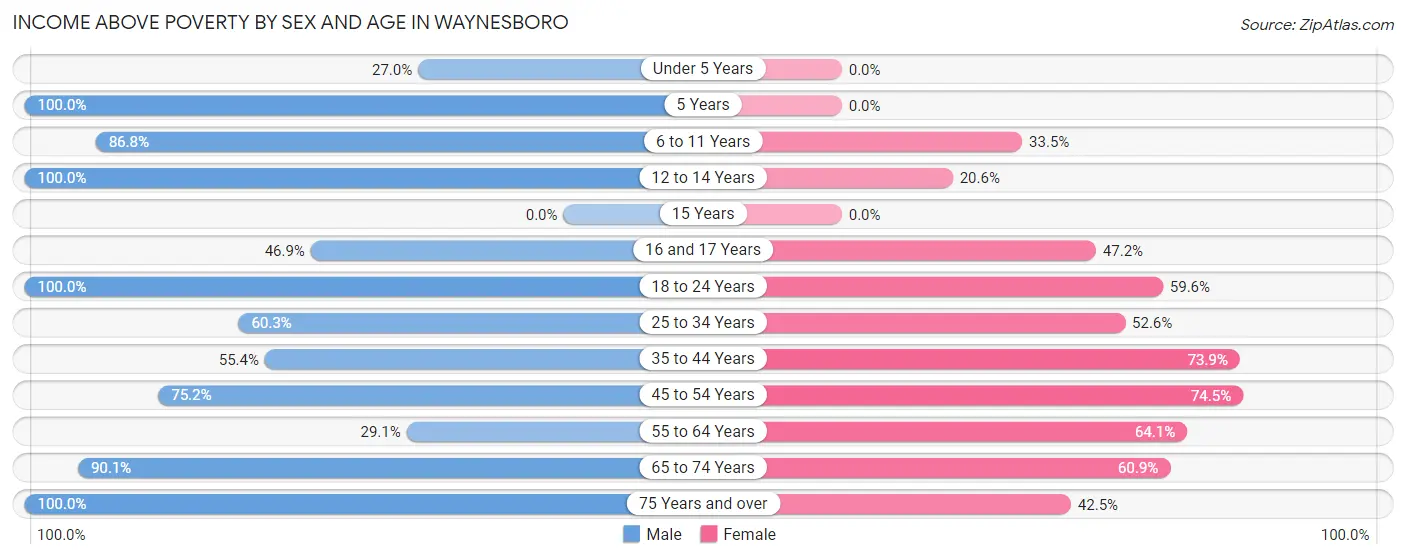
| Age Bracket | Male | Female |
| Under 5 Years | 41 (27.0%) | 0 (0.0%) |
| 5 Years | 14 (100.0%) | 0 (0.0%) |
| 6 to 11 Years | 138 (86.8%) | 78 (33.5%) |
| 12 to 14 Years | 273 (100.0%) | 35 (20.6%) |
| 15 Years | 0 (0.0%) | 0 (0.0%) |
| 16 and 17 Years | 53 (46.9%) | 25 (47.2%) |
| 18 to 24 Years | 38 (100.0%) | 115 (59.6%) |
| 25 to 34 Years | 243 (60.3%) | 71 (52.6%) |
| 35 to 44 Years | 82 (55.4%) | 308 (73.9%) |
| 45 to 54 Years | 209 (75.2%) | 274 (74.5%) |
| 55 to 64 Years | 101 (29.1%) | 107 (64.1%) |
| 65 to 74 Years | 209 (90.1%) | 195 (60.9%) |
| 75 Years and over | 81 (100.0%) | 37 (42.5%) |
| Total | 1,482 (66.2%) | 1,245 (55.2%) |
Income Below Poverty Among Married-Couple Families in Waynesboro
The poverty statistics for married-couple families in Waynesboro show that 13.1% or 77 of the total 588 families live below the poverty line. Families with 1 or 2 children have the highest poverty rate of 22.0%, comprising of 66 families. On the other hand, families with no children have the lowest poverty rate of 3.8%, which includes 11 families.
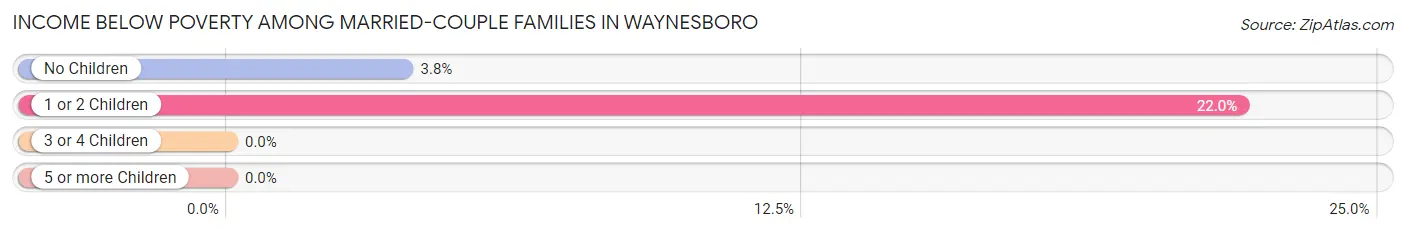
| Children | Above Poverty | Below Poverty |
| No Children | 277 (96.2%) | 11 (3.8%) |
| 1 or 2 Children | 234 (78.0%) | 66 (22.0%) |
| 3 or 4 Children | 0 (0.0%) | 0 (0.0%) |
| 5 or more Children | 0 (0.0%) | 0 (0.0%) |
| Total | 511 (86.9%) | 77 (13.1%) |
Income Below Poverty Among Single-Parent Households in Waynesboro
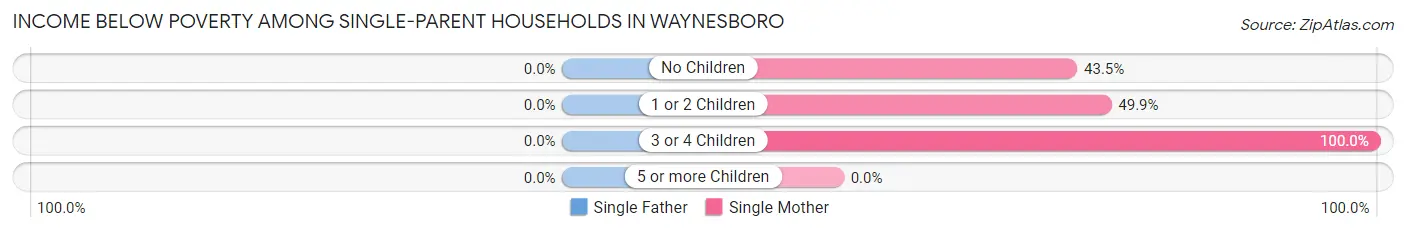
| Children | Single Father | Single Mother |
| No Children | 0 (0.0%) | 30 (43.5%) |
| 1 or 2 Children | 0 (0.0%) | 179 (49.9%) |
| 3 or 4 Children | 0 (0.0%) | 17 (100.0%) |
| 5 or more Children | 0 (0.0%) | 0 (0.0%) |
| Total | 0 (0.0%) | 226 (50.8%) |
Income Below Poverty Among Married-Couple vs Single-Parent Households in Waynesboro
The poverty data for Waynesboro shows that 77 of the married-couple family households (13.1%) and 226 of the single-parent households (33.0%) are living below the poverty level. Within the married-couple family households, those with 1 or 2 children have the highest poverty rate, with 66 households (22.0%) falling below the poverty line. Among the single-parent households, those with 3 or 4 children have the highest poverty rate, with 17 household (100.0%) living below poverty.
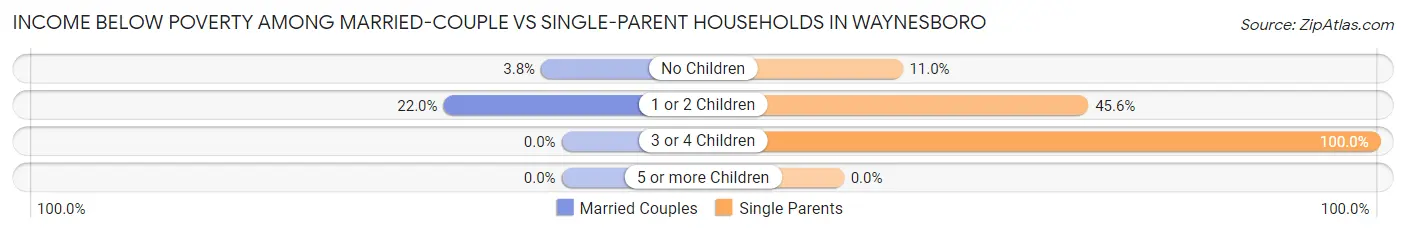
| Children | Married-Couple Families | Single-Parent Households |
| No Children | 11 (3.8%) | 30 (11.0%) |
| 1 or 2 Children | 66 (22.0%) | 179 (45.6%) |
| 3 or 4 Children | 0 (0.0%) | 17 (100.0%) |
| 5 or more Children | 0 (0.0%) | 0 (0.0%) |
| Total | 77 (13.1%) | 226 (33.0%) |
Race in Waynesboro
The most populous races in Waynesboro are Black / African American (2,546 | 55.6%), White / Caucasian (1,762 | 38.5%), and Hispanic or Latino (247 | 5.4%).
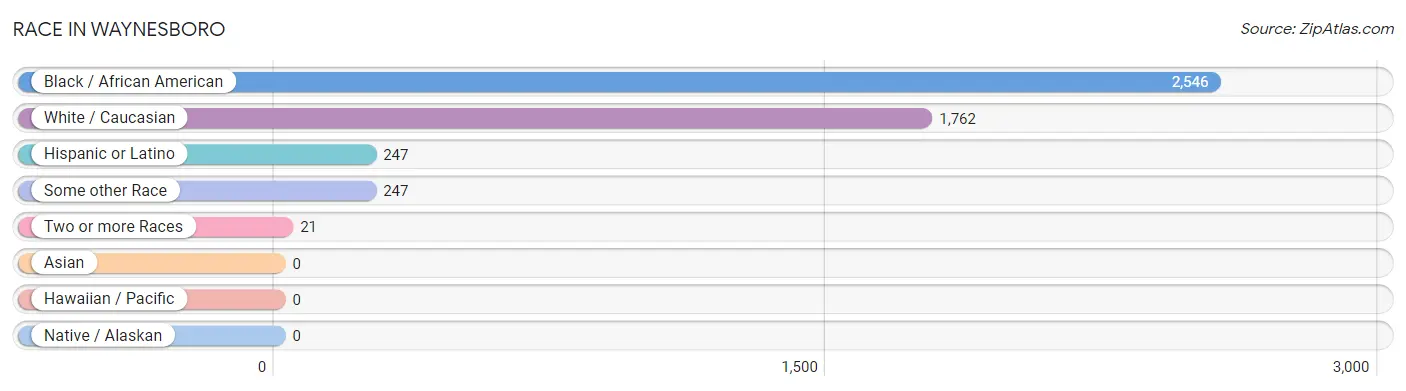
| Race | # Population | % Population |
| Asian | 0 | 0.0% |
| Black / African American | 2,546 | 55.6% |
| Hawaiian / Pacific | 0 | 0.0% |
| Hispanic or Latino | 247 | 5.4% |
| Native / Alaskan | 0 | 0.0% |
| White / Caucasian | 1,762 | 38.5% |
| Two or more Races | 21 | 0.5% |
| Some other Race | 247 | 5.4% |
| Total | 4,576 | 100.0% |
Ancestry in Waynesboro
The most populous ancestries reported in Waynesboro are American (394 | 8.6%), English (313 | 6.8%), Mexican (247 | 5.4%), Irish (235 | 5.1%), and European (54 | 1.2%), together accounting for 27.2% of all Waynesboro residents.
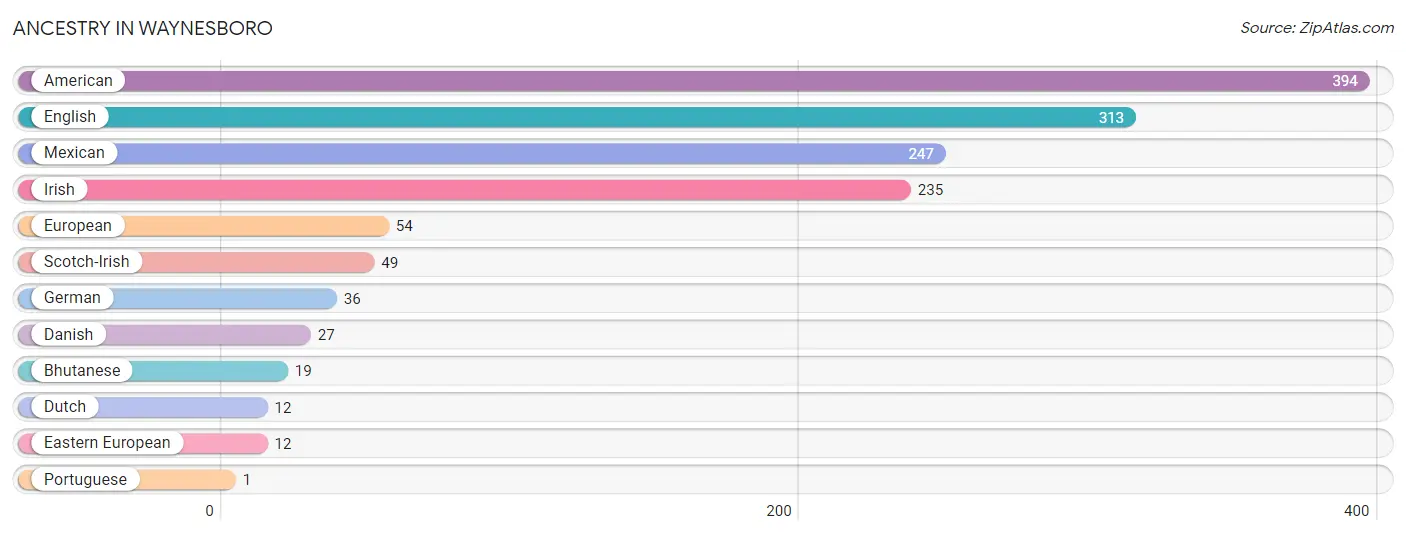
| Ancestry | # Population | % Population |
| American | 394 | 8.6% |
| Bhutanese | 19 | 0.4% |
| Danish | 27 | 0.6% |
| Dutch | 12 | 0.3% |
| Eastern European | 12 | 0.3% |
| English | 313 | 6.8% |
| European | 54 | 1.2% |
| German | 36 | 0.8% |
| Irish | 235 | 5.1% |
| Mexican | 247 | 5.4% |
| Portuguese | 1 | 0.0% |
| Scotch-Irish | 49 | 1.1% | View All 12 Rows |
Immigrants in Waynesboro
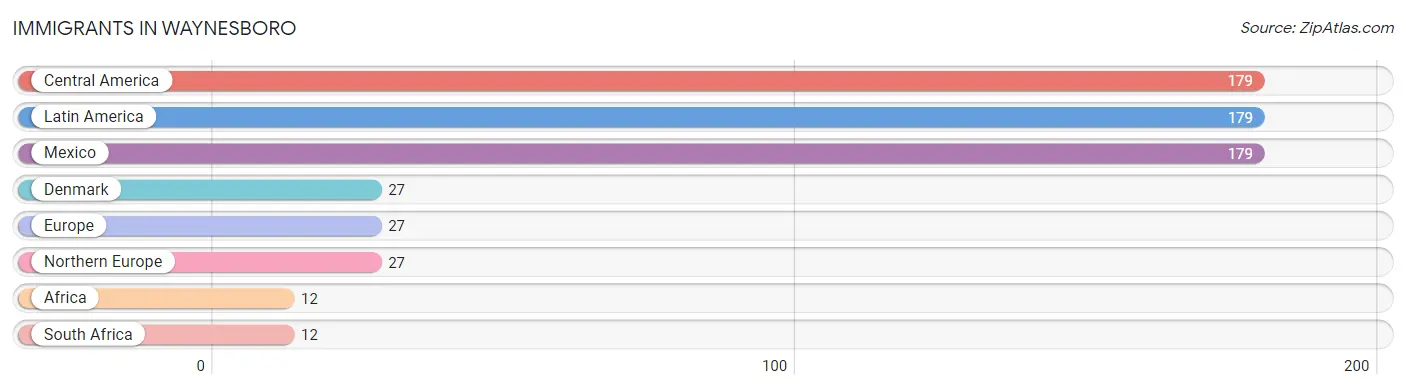
The most numerous immigrant groups reported in Waynesboro came from Central America (179 | 3.9%), Latin America (179 | 3.9%), Mexico (179 | 3.9%), Denmark (27 | 0.6%), and Europe (27 | 0.6%), together accounting for 12.9% of all Waynesboro residents.
| Immigration Origin | # Population | % Population |
| Africa | 12 | 0.3% |
| Central America | 179 | 3.9% |
| Denmark | 27 | 0.6% |
| Europe | 27 | 0.6% |
| Latin America | 179 | 3.9% |
| Mexico | 179 | 3.9% |
| Northern Europe | 27 | 0.6% |
| South Africa | 12 | 0.3% | View All 8 Rows |
Sex and Age in Waynesboro
Sex and Age in Waynesboro
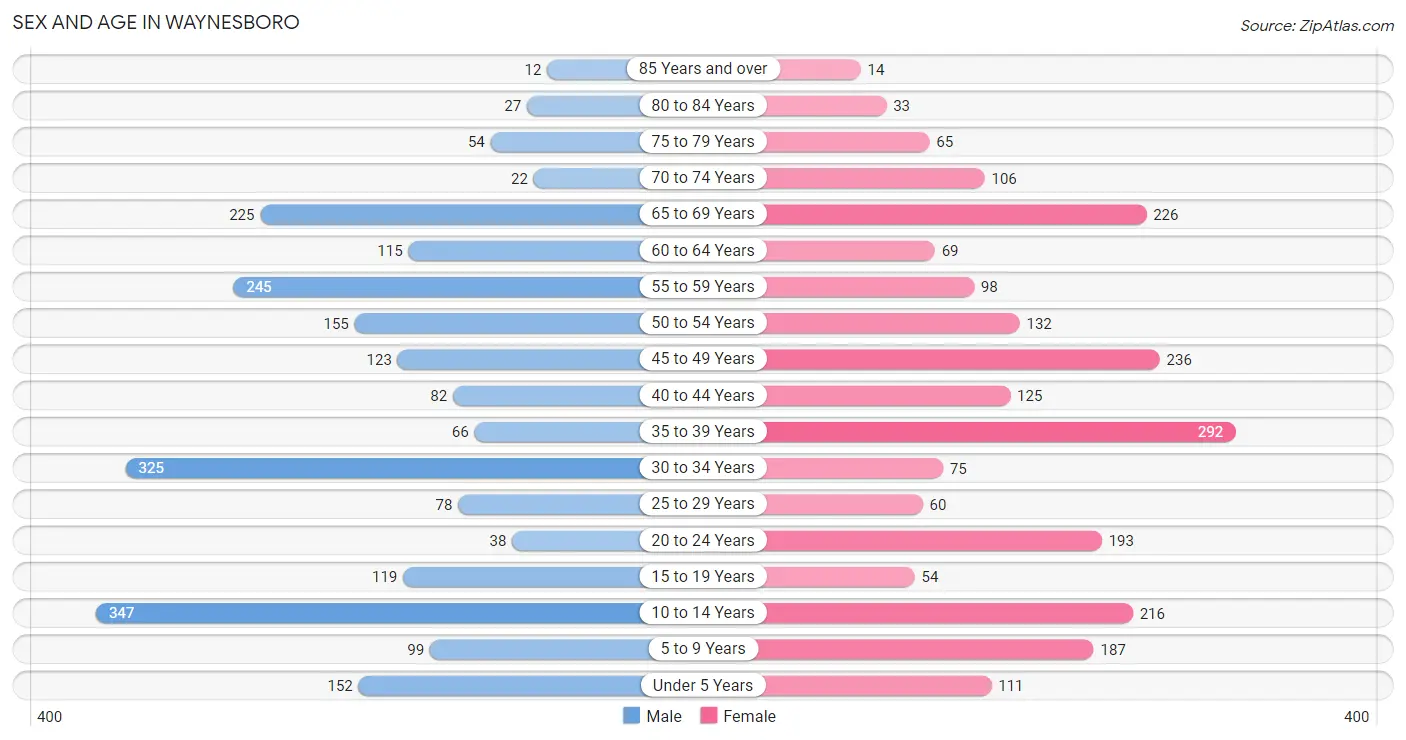
The most populous age groups in Waynesboro are 10 to 14 Years (347 | 15.2%) for men and 35 to 39 Years (292 | 12.7%) for women.
| Age Bracket | Male | Female |
| Under 5 Years | 152 (6.7%) | 111 (4.8%) |
| 5 to 9 Years | 99 (4.3%) | 187 (8.2%) |
| 10 to 14 Years | 347 (15.2%) | 216 (9.4%) |
| 15 to 19 Years | 119 (5.2%) | 54 (2.4%) |
| 20 to 24 Years | 38 (1.7%) | 193 (8.4%) |
| 25 to 29 Years | 78 (3.4%) | 60 (2.6%) |
| 30 to 34 Years | 325 (14.2%) | 75 (3.3%) |
| 35 to 39 Years | 66 (2.9%) | 292 (12.7%) |
| 40 to 44 Years | 82 (3.6%) | 125 (5.4%) |
| 45 to 49 Years | 123 (5.4%) | 236 (10.3%) |
| 50 to 54 Years | 155 (6.8%) | 132 (5.8%) |
| 55 to 59 Years | 245 (10.7%) | 98 (4.3%) |
| 60 to 64 Years | 115 (5.0%) | 69 (3.0%) |
| 65 to 69 Years | 225 (9.9%) | 226 (9.9%) |
| 70 to 74 Years | 22 (1.0%) | 106 (4.6%) |
| 75 to 79 Years | 54 (2.4%) | 65 (2.8%) |
| 80 to 84 Years | 27 (1.2%) | 33 (1.4%) |
| 85 Years and over | 12 (0.5%) | 14 (0.6%) |
| Total | 2,284 (100.0%) | 2,292 (100.0%) |
Families and Households in Waynesboro
Median Family Size in Waynesboro
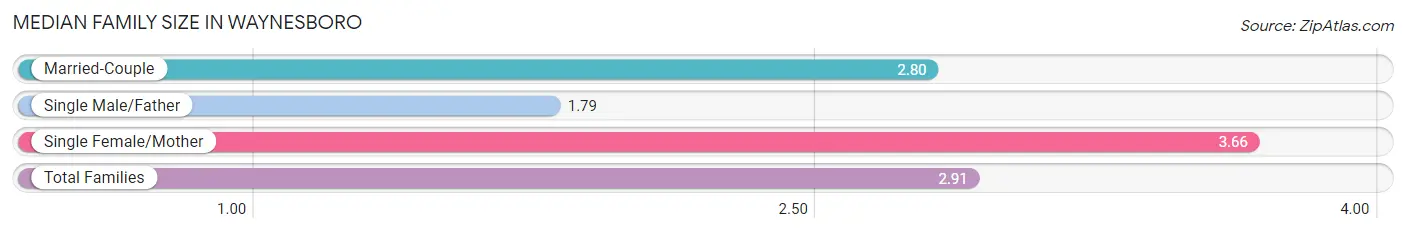
The median family size in Waynesboro is 2.91 persons per family, with single female/mother families (445 | 35.0%) accounting for the largest median family size of 3.66 persons per family. On the other hand, single male/father families (239 | 18.8%) represent the smallest median family size with 1.79 persons per family.
| Family Type | # Families | Family Size |
| Married-Couple | 588 (46.2%) | 2.80 |
| Single Male/Father | 239 (18.8%) | 1.79 |
| Single Female/Mother | 445 (35.0%) | 3.66 |
| Total Families | 1,272 (100.0%) | 2.91 |
Median Household Size in Waynesboro
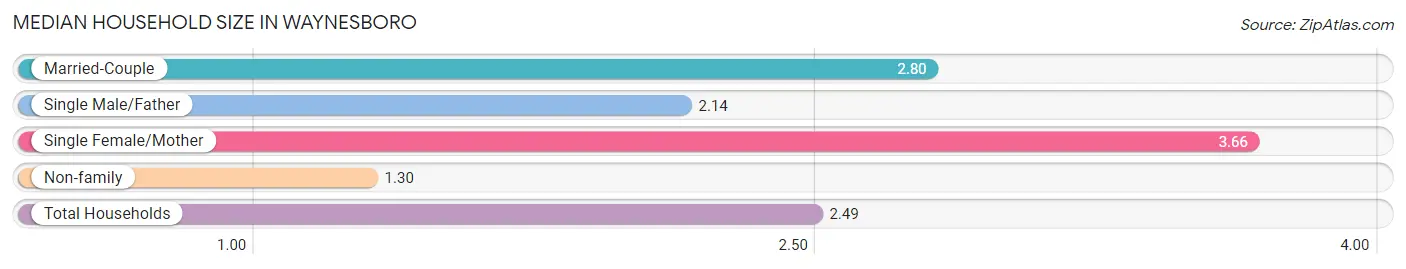
The median household size in Waynesboro is 2.49 persons per household, with single female/mother households (445 | 24.9%) accounting for the largest median household size of 3.66 persons per household. non-family households (516 | 28.9%) represent the smallest median household size with 1.30 persons per household.
| Household Type | # Households | Household Size |
| Married-Couple | 588 (32.9%) | 2.80 |
| Single Male/Father | 239 (13.4%) | 2.14 |
| Single Female/Mother | 445 (24.9%) | 3.66 |
| Non-family | 516 (28.9%) | 1.30 |
| Total Households | 1,788 (100.0%) | 2.49 |
Household Size by Marriage Status in Waynesboro
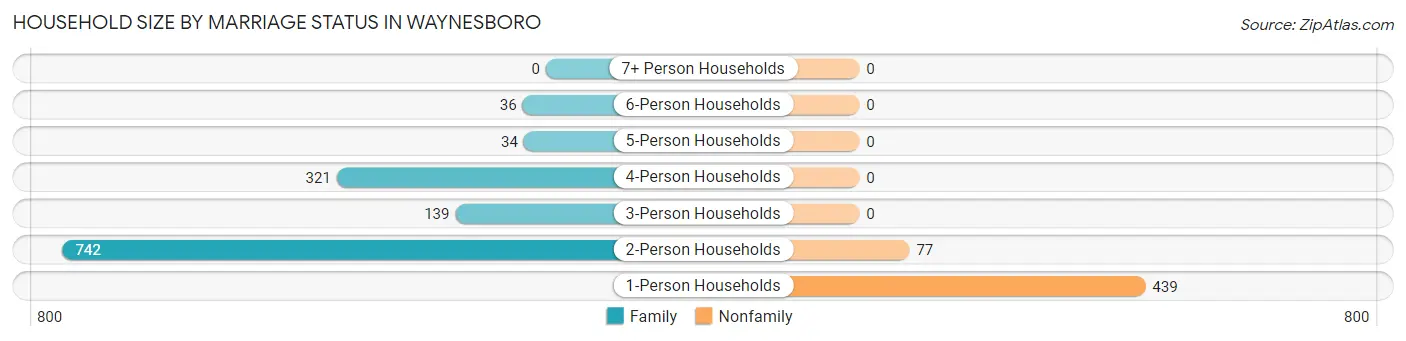
Out of a total of 1,788 households in Waynesboro, 1,272 (71.1%) are family households, while 516 (28.9%) are nonfamily households. The most numerous type of family households are 2-person households, comprising 742, and the most common type of nonfamily households are 1-person households, comprising 439.
| Household Size | Family Households | Nonfamily Households |
| 1-Person Households | - | 439 (24.5%) |
| 2-Person Households | 742 (41.5%) | 77 (4.3%) |
| 3-Person Households | 139 (7.8%) | 0 (0.0%) |
| 4-Person Households | 321 (17.9%) | 0 (0.0%) |
| 5-Person Households | 34 (1.9%) | 0 (0.0%) |
| 6-Person Households | 36 (2.0%) | 0 (0.0%) |
| 7+ Person Households | 0 (0.0%) | 0 (0.0%) |
| Total | 1,272 (71.1%) | 516 (28.9%) |
Female Fertility in Waynesboro
Fertility by Age in Waynesboro
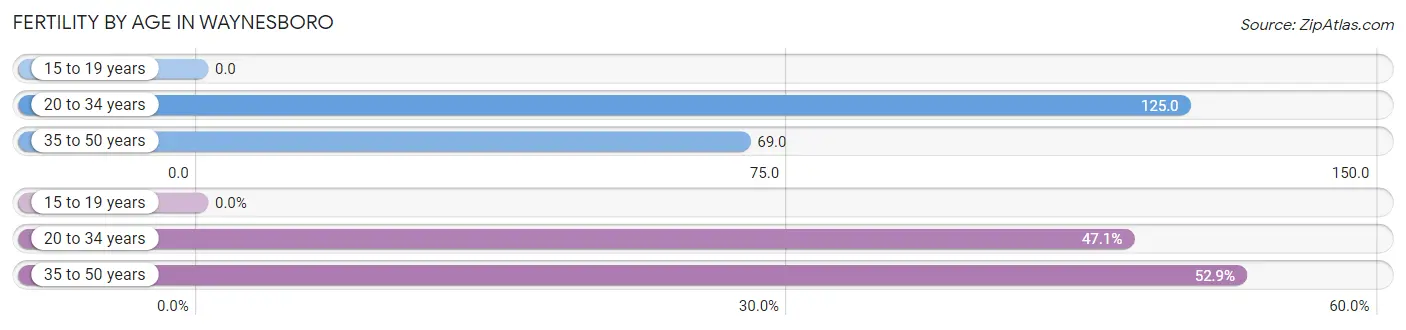
Average fertility rate in Waynesboro is 83.0 births per 1,000 women. Women in the age bracket of 20 to 34 years have the highest fertility rate with 125.0 births per 1,000 women. Women in the age bracket of 35 to 50 years acount for 52.9% of all women with births.
| Age Bracket | Women with Births | Births / 1,000 Women |
| 15 to 19 years | 0 (0.0%) | 0.0 |
| 20 to 34 years | 41 (47.1%) | 125.0 |
| 35 to 50 years | 46 (52.9%) | 69.0 |
| Total | 87 (100.0%) | 83.0 |
Fertility by Age by Marriage Status in Waynesboro
52.9% of women with births (87) in Waynesboro are married. The highest percentage of unmarried women with births falls into 20 to 34 years age bracket with 100.0% of them unmarried at the time of birth, while the lowest percentage of unmarried women with births belong to 35 to 50 years age bracket with 0.0% of them unmarried.
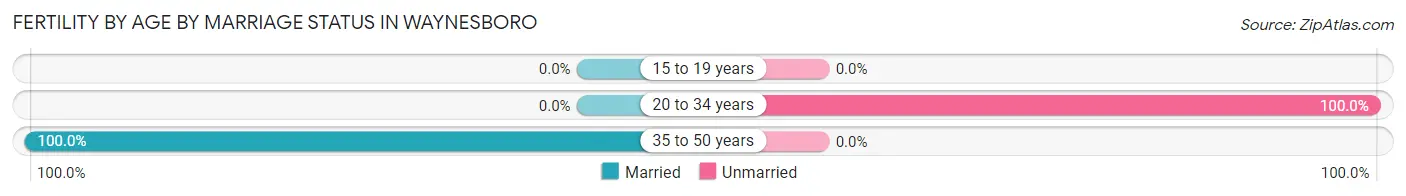
| Age Bracket | Married | Unmarried |
| 15 to 19 years | 0 (0.0%) | 0 (0.0%) |
| 20 to 34 years | 0 (0.0%) | 41 (100.0%) |
| 35 to 50 years | 46 (100.0%) | 0 (0.0%) |
| Total | 46 (52.9%) | 41 (47.1%) |
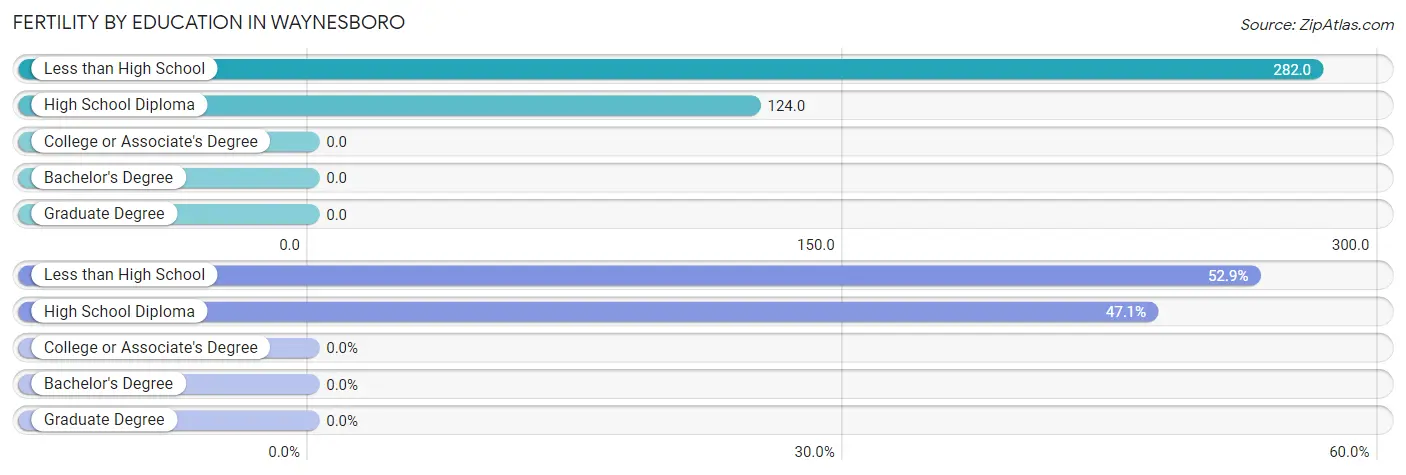
Fertility by Education in Waynesboro
| Educational Attainment | Women with Births | Births / 1,000 Women |
| Less than High School | 46 (52.9%) | 282.0 |
| High School Diploma | 41 (47.1%) | 124.0 |
| College or Associate's Degree | 0 (0.0%) | 0.0 |
| Bachelor's Degree | 0 (0.0%) | 0.0 |
| Graduate Degree | 0 (0.0%) | 0.0 |
| Total | 87 (100.0%) | 83.0 |
Fertility by Education by Marriage Status in Waynesboro
47.1% of women with births in Waynesboro are unmarried. Women with the educational attainment of less than high school are most likely to be married with 100.0% of them married at childbirth, while women with the educational attainment of high school diploma are least likely to be married with 100.0% of them unmarried at childbirth.
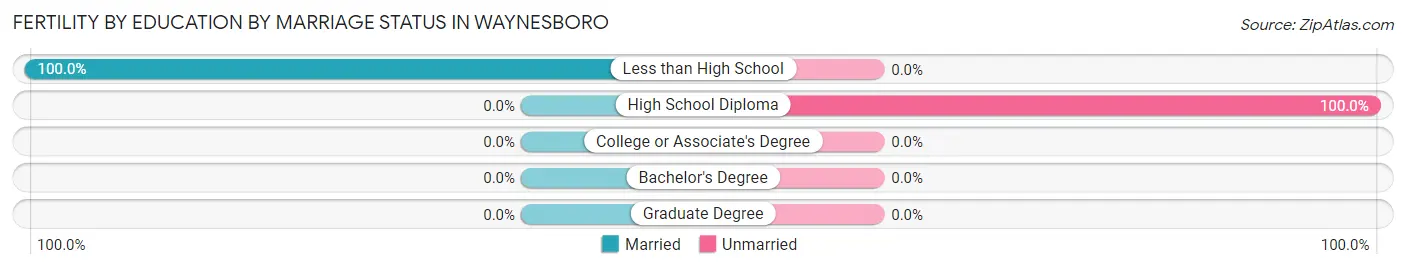
| Educational Attainment | Married | Unmarried |
| Less than High School | 46 (100.0%) | 0 (0.0%) |
| High School Diploma | 0 (0.0%) | 41 (100.0%) |
| College or Associate's Degree | 0 (0.0%) | 0 (0.0%) |
| Bachelor's Degree | 0 (0.0%) | 0 (0.0%) |
| Graduate Degree | 0 (0.0%) | 0 (0.0%) |
| Total | 46 (52.9%) | 41 (47.1%) |
Employment Characteristics in Waynesboro
Employment by Class of Employer in Waynesboro
Among the 1,222 employed individuals in Waynesboro, private company employees (746 | 61.1%), state government employees (127 | 10.4%), and self-employed (incorporated) (96 | 7.9%) make up the most common classes of employment.
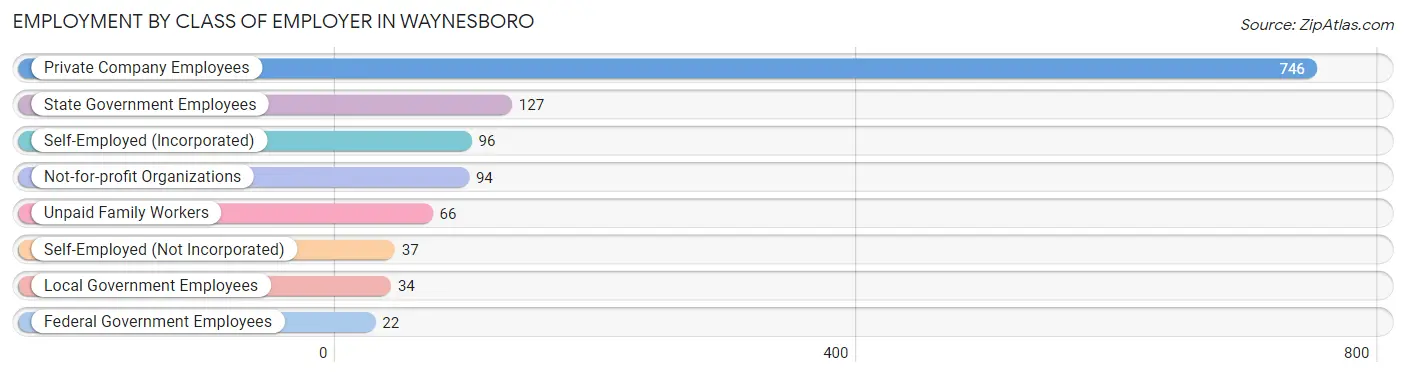
| Employer Class | # Employees | % Employees |
| Private Company Employees | 746 | 61.1% |
| Self-Employed (Incorporated) | 96 | 7.9% |
| Self-Employed (Not Incorporated) | 37 | 3.0% |
| Not-for-profit Organizations | 94 | 7.7% |
| Local Government Employees | 34 | 2.8% |
| State Government Employees | 127 | 10.4% |
| Federal Government Employees | 22 | 1.8% |
| Unpaid Family Workers | 66 | 5.4% |
| Total | 1,222 | 100.0% |
Employment Status by Age in Waynesboro
According to the labor force statistics for Waynesboro, out of the total population over 16 years of age (3,463), 37.2% or 1,288 individuals are in the labor force, with 5.2% or 67 of them unemployed. The age group with the highest labor force participation rate is 25 to 29 years, with 92.8% or 128 individuals in the labor force. Within the labor force, the 30 to 34 years age range has the highest percentage of unemployed individuals, with 77.1% or 37 of them being unemployed.
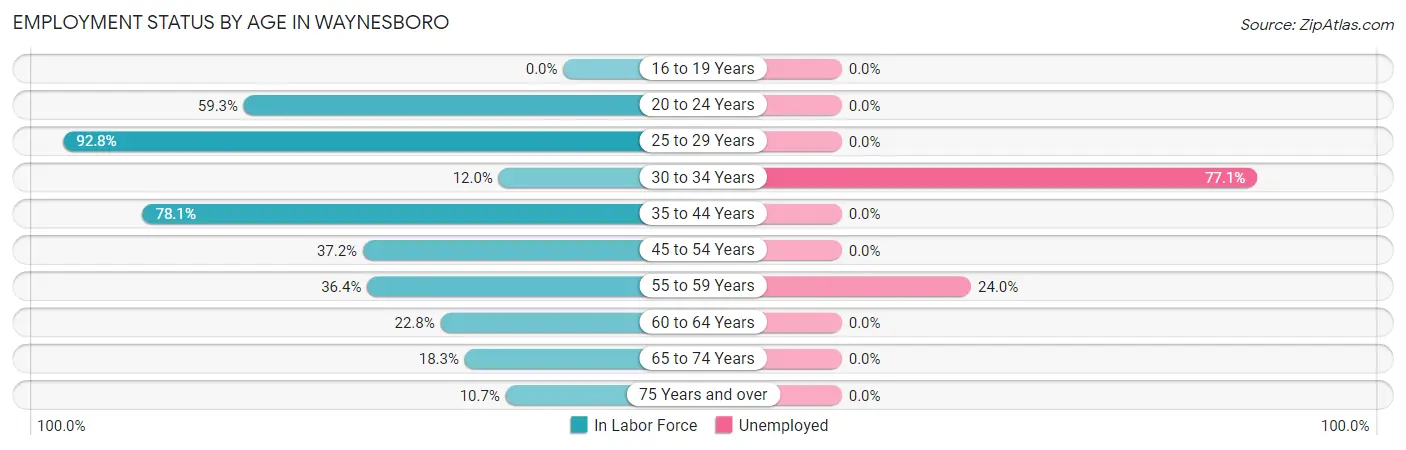
| Age Bracket | In Labor Force | Unemployed |
| 16 to 19 Years | 0 (0.0%) | 0 (0.0%) |
| 20 to 24 Years | 137 (59.3%) | 0 (0.0%) |
| 25 to 29 Years | 128 (92.8%) | 0 (0.0%) |
| 30 to 34 Years | 48 (12.0%) | 37 (77.1%) |
| 35 to 44 Years | 441 (78.1%) | 0 (0.0%) |
| 45 to 54 Years | 240 (37.2%) | 0 (0.0%) |
| 55 to 59 Years | 125 (36.4%) | 30 (24.0%) |
| 60 to 64 Years | 42 (22.8%) | 0 (0.0%) |
| 65 to 74 Years | 106 (18.3%) | 0 (0.0%) |
| 75 Years and over | 22 (10.7%) | 0 (0.0%) |
| Total | 1,288 (37.2%) | 67 (5.2%) |
Employment Status by Educational Attainment in Waynesboro
According to labor force statistics for Waynesboro, 45.0% of individuals (1,024) out of the total population between 25 and 64 years of age (2,276) are in the labor force, with 6.5% or 67 of them being unemployed. The group with the highest labor force participation rate are those with the educational attainment of college / associate degree, with 59.5% or 179 individuals in the labor force. Within the labor force, individuals with college / associate degree education have the highest percentage of unemployment, with 20.7% or 37 of them being unemployed.
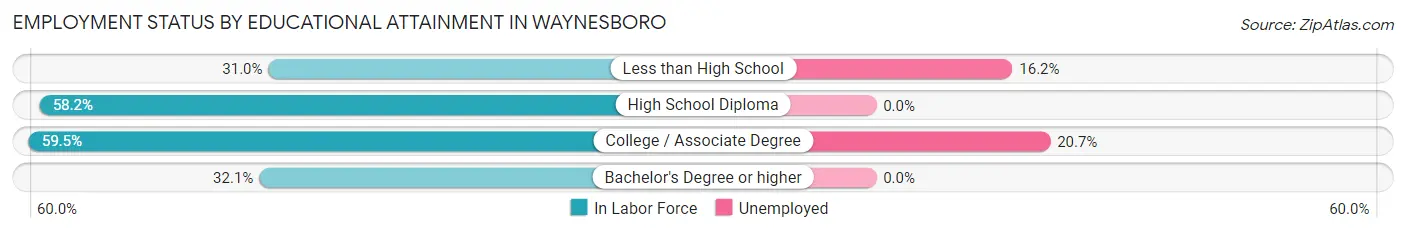
| Educational Attainment | In Labor Force | Unemployed |
| Less than High School | 185 (31.0%) | 97 (16.2%) |
| High School Diploma | 485 (58.2%) | 0 (0.0%) |
| College / Associate Degree | 179 (59.5%) | 62 (20.7%) |
| Bachelor's Degree or higher | 175 (32.1%) | 0 (0.0%) |
| Total | 1,024 (45.0%) | 148 (6.5%) |
Employment Occupations by Sex in Waynesboro
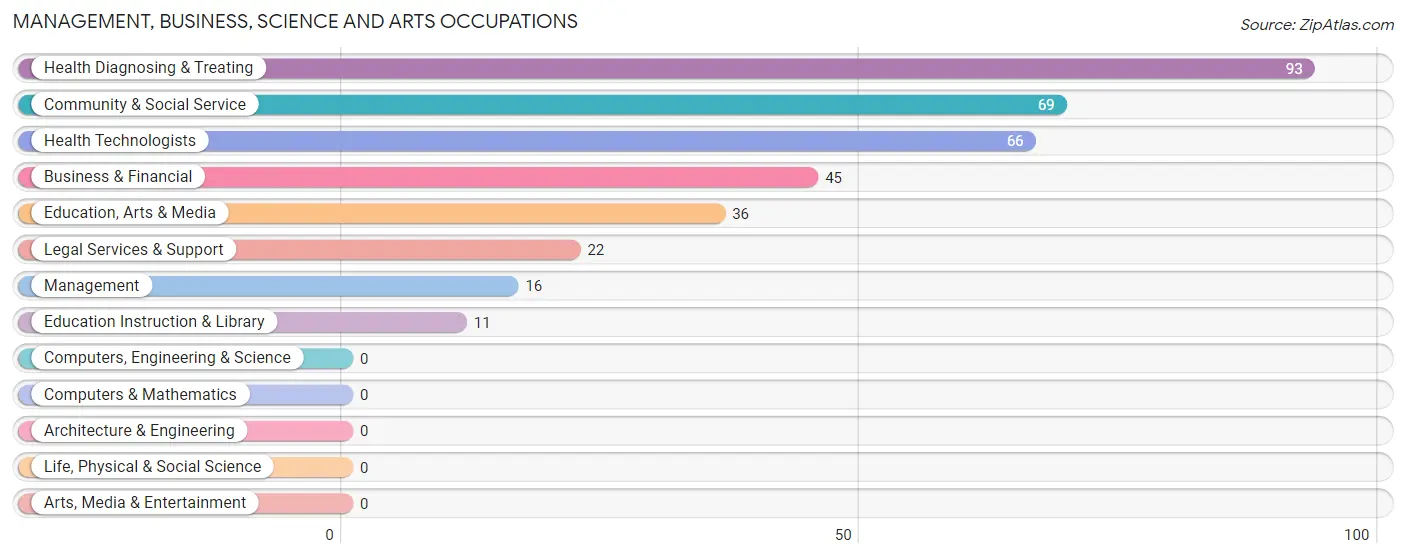
Management, Business, Science and Arts Occupations
The most common Management, Business, Science and Arts occupations in Waynesboro are Health Diagnosing & Treating (93 | 7.6%), Community & Social Service (69 | 5.7%), Health Technologists (66 | 5.4%), Business & Financial (45 | 3.7%), and Education, Arts & Media (36 | 2.9%).
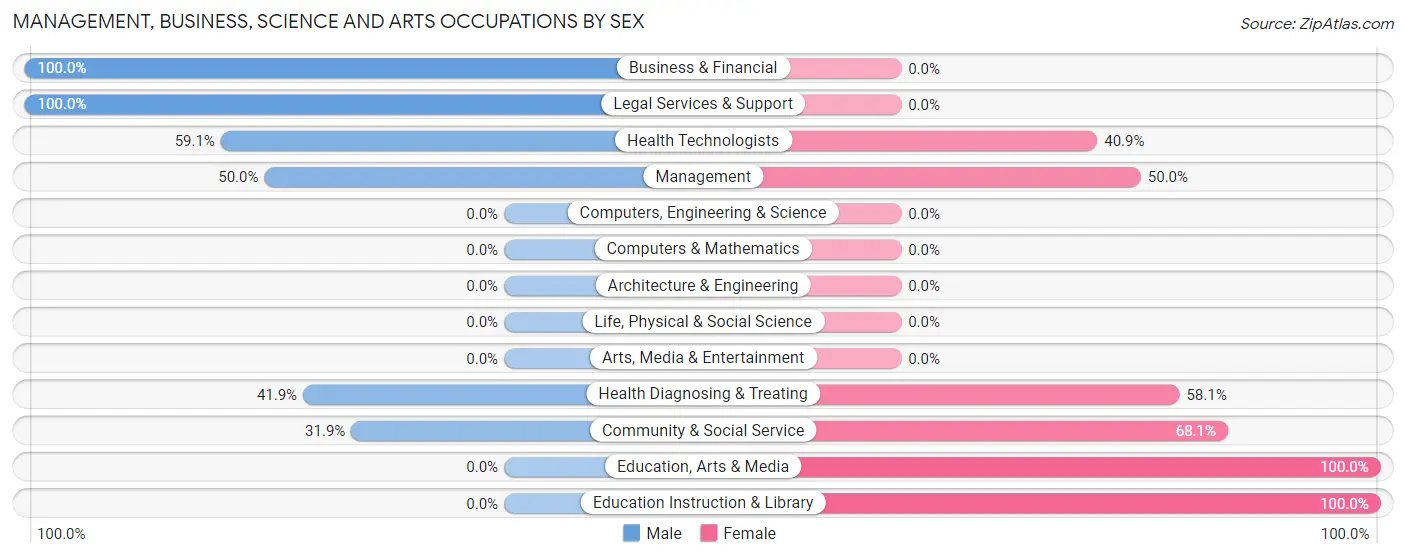
Management, Business, Science and Arts Occupations by Sex
Within the Management, Business, Science and Arts occupations in Waynesboro, the most male-oriented occupations are Business & Financial (100.0%), Legal Services & Support (100.0%), and Health Technologists (59.1%), while the most female-oriented occupations are Education, Arts & Media (100.0%), Education Instruction & Library (100.0%), and Community & Social Service (68.1%).
| Occupation | Male | Female |
| Management | 8 (50.0%) | 8 (50.0%) |
| Business & Financial | 45 (100.0%) | 0 (0.0%) |
| Computers, Engineering & Science | 0 (0.0%) | 0 (0.0%) |
| Computers & Mathematics | 0 (0.0%) | 0 (0.0%) |
| Architecture & Engineering | 0 (0.0%) | 0 (0.0%) |
| Life, Physical & Social Science | 0 (0.0%) | 0 (0.0%) |
| Community & Social Service | 22 (31.9%) | 47 (68.1%) |
| Education, Arts & Media | 0 (0.0%) | 36 (100.0%) |
| Legal Services & Support | 22 (100.0%) | 0 (0.0%) |
| Education Instruction & Library | 0 (0.0%) | 11 (100.0%) |
| Arts, Media & Entertainment | 0 (0.0%) | 0 (0.0%) |
| Health Diagnosing & Treating | 39 (41.9%) | 54 (58.1%) |
| Health Technologists | 39 (59.1%) | 27 (40.9%) |
| Total (Category) | 114 (51.1%) | 109 (48.9%) |
| Total (Overall) | 500 (40.9%) | 722 (59.1%) |
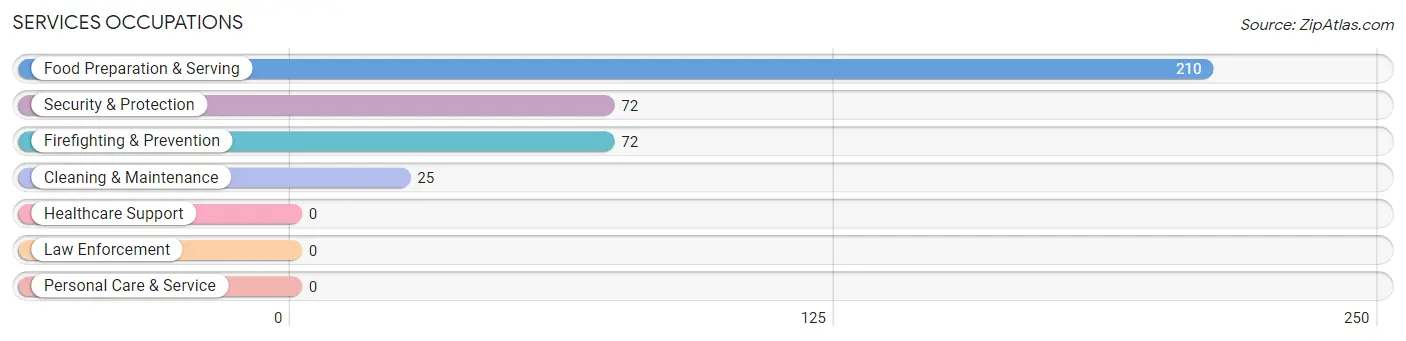
Services Occupations
The most common Services occupations in Waynesboro are Food Preparation & Serving (210 | 17.2%), Security & Protection (72 | 5.9%), Firefighting & Prevention (72 | 5.9%), and Cleaning & Maintenance (25 | 2.1%).
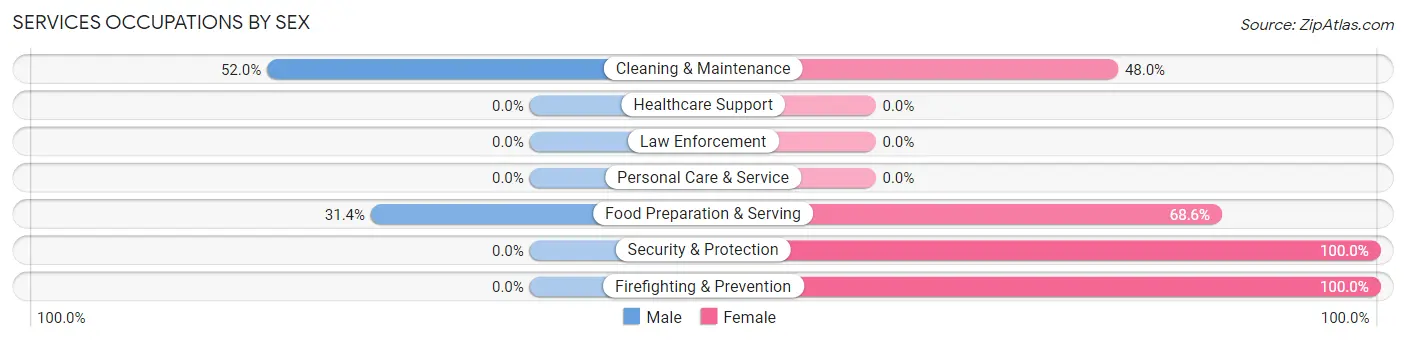
Services Occupations by Sex
Within the Services occupations in Waynesboro, the most male-oriented occupations are Cleaning & Maintenance (52.0%), and Food Preparation & Serving (31.4%), while the most female-oriented occupations are Security & Protection (100.0%), Firefighting & Prevention (100.0%), and Food Preparation & Serving (68.6%).
| Occupation | Male | Female |
| Healthcare Support | 0 (0.0%) | 0 (0.0%) |
| Security & Protection | 0 (0.0%) | 72 (100.0%) |
| Firefighting & Prevention | 0 (0.0%) | 72 (100.0%) |
| Law Enforcement | 0 (0.0%) | 0 (0.0%) |
| Food Preparation & Serving | 66 (31.4%) | 144 (68.6%) |
| Cleaning & Maintenance | 13 (52.0%) | 12 (48.0%) |
| Personal Care & Service | 0 (0.0%) | 0 (0.0%) |
| Total (Category) | 79 (25.7%) | 228 (74.3%) |
| Total (Overall) | 500 (40.9%) | 722 (59.1%) |
Sales and Office Occupations
The most common Sales and Office occupations in Waynesboro are Office & Administration (274 | 22.4%), and Sales & Related (46 | 3.8%).
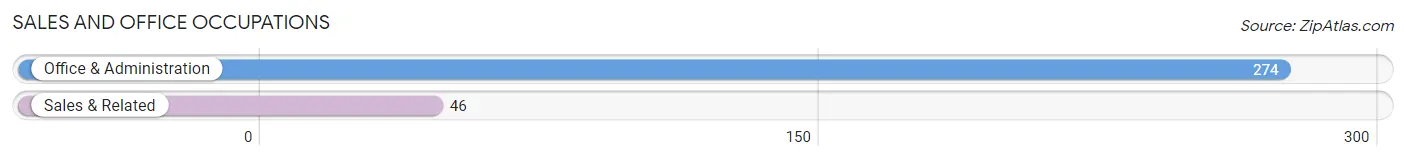
Sales and Office Occupations by Sex
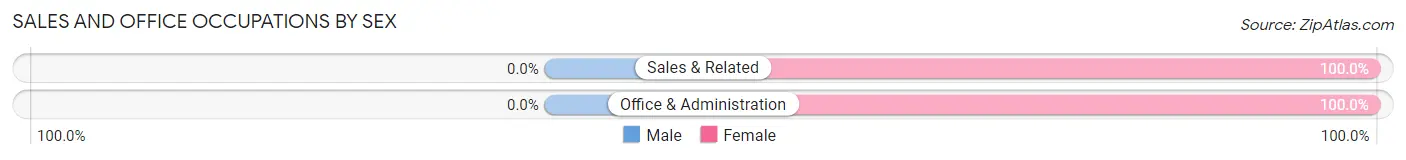
| Occupation | Male | Female |
| Sales & Related | 0 (0.0%) | 46 (100.0%) |
| Office & Administration | 0 (0.0%) | 274 (100.0%) |
| Total (Category) | 0 (0.0%) | 320 (100.0%) |
| Total (Overall) | 500 (40.9%) | 722 (59.1%) |
Natural Resources, Construction and Maintenance Occupations
The most common Natural Resources, Construction and Maintenance occupations in Waynesboro are Construction & Extraction (91 | 7.4%), and Installation, Maintenance & Repair (55 | 4.5%).
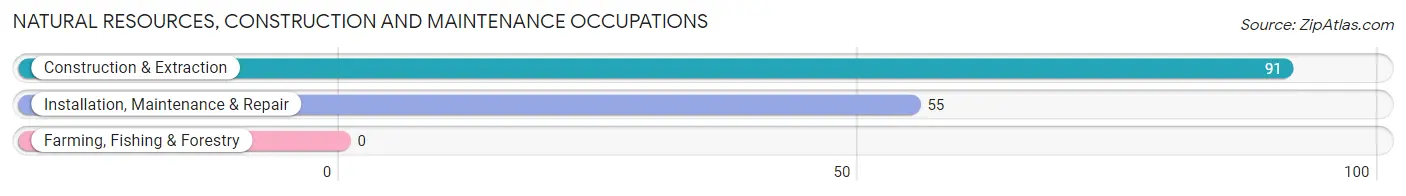
Natural Resources, Construction and Maintenance Occupations by Sex
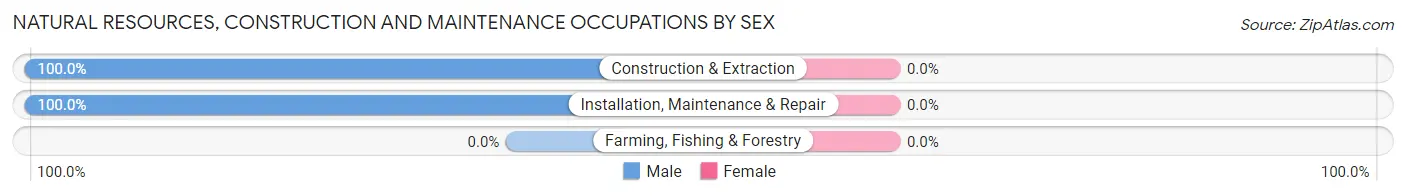
| Occupation | Male | Female |
| Farming, Fishing & Forestry | 0 (0.0%) | 0 (0.0%) |
| Construction & Extraction | 91 (100.0%) | 0 (0.0%) |
| Installation, Maintenance & Repair | 55 (100.0%) | 0 (0.0%) |
| Total (Category) | 146 (100.0%) | 0 (0.0%) |
| Total (Overall) | 500 (40.9%) | 722 (59.1%) |
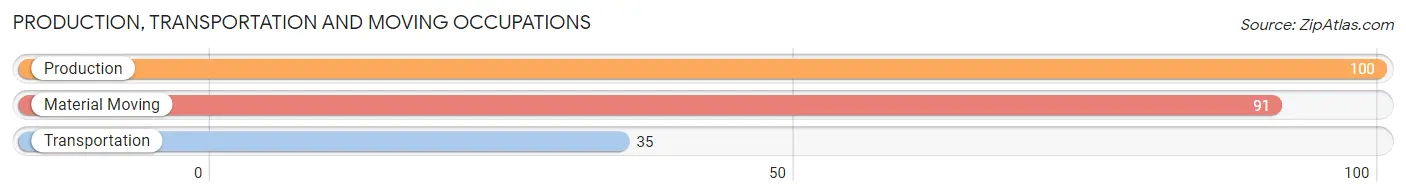
Production, Transportation and Moving Occupations
The most common Production, Transportation and Moving occupations in Waynesboro are Production (100 | 8.2%), Material Moving (91 | 7.4%), and Transportation (35 | 2.9%).
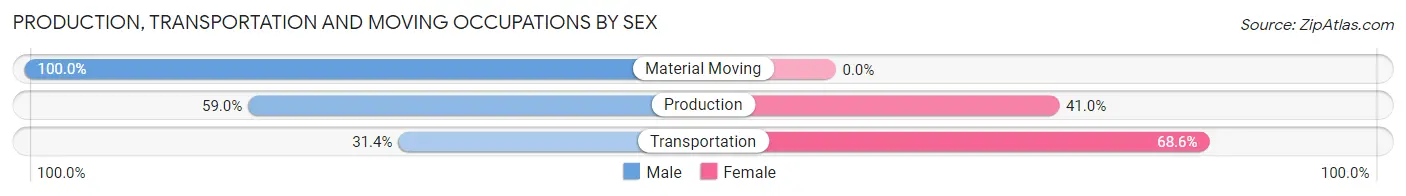
Production, Transportation and Moving Occupations by Sex
| Occupation | Male | Female |
| Production | 59 (59.0%) | 41 (41.0%) |
| Transportation | 11 (31.4%) | 24 (68.6%) |
| Material Moving | 91 (100.0%) | 0 (0.0%) |
| Total (Category) | 161 (71.2%) | 65 (28.8%) |
| Total (Overall) | 500 (40.9%) | 722 (59.1%) |
Employment Industries by Sex in Waynesboro
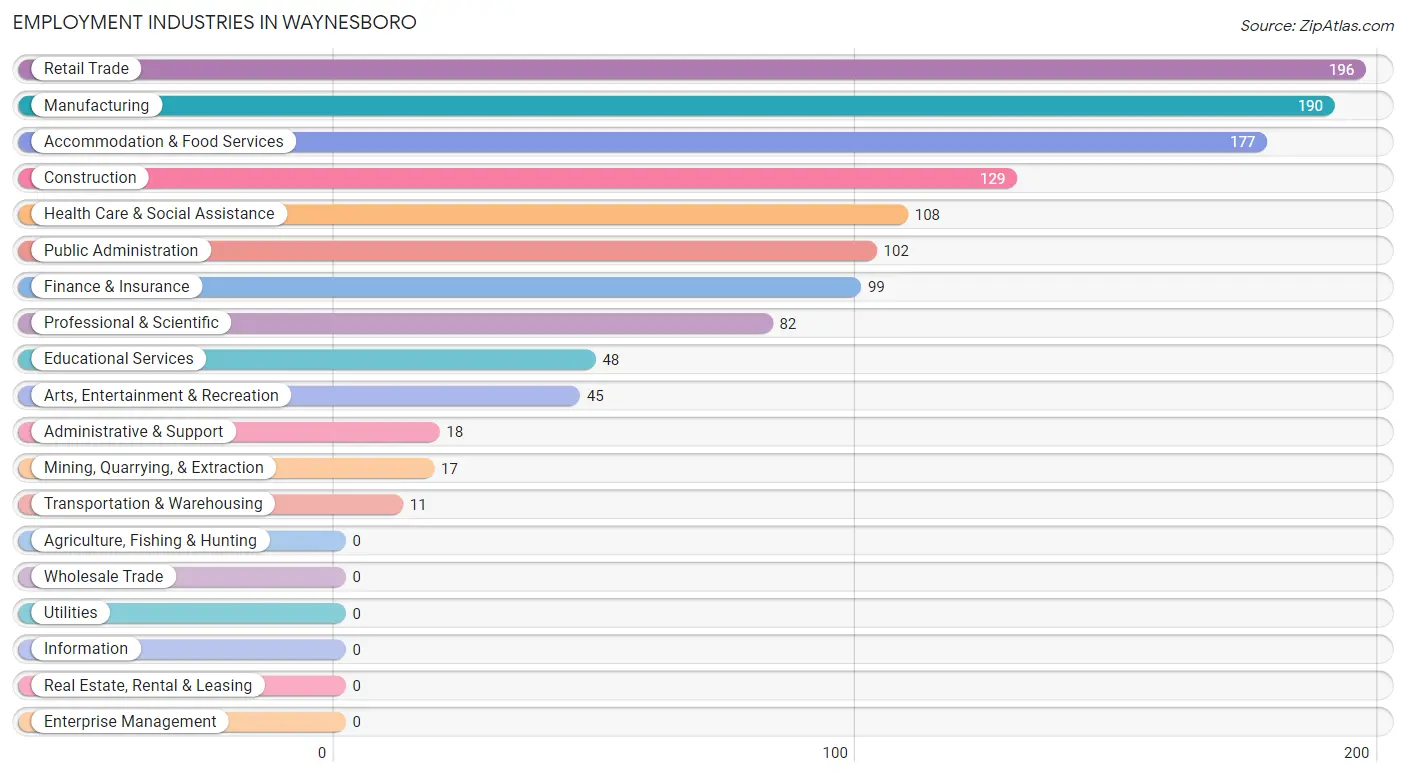
Employment Industries in Waynesboro
The major employment industries in Waynesboro include Retail Trade (196 | 16.0%), Manufacturing (190 | 15.5%), Accommodation & Food Services (177 | 14.5%), Construction (129 | 10.6%), and Health Care & Social Assistance (108 | 8.8%).
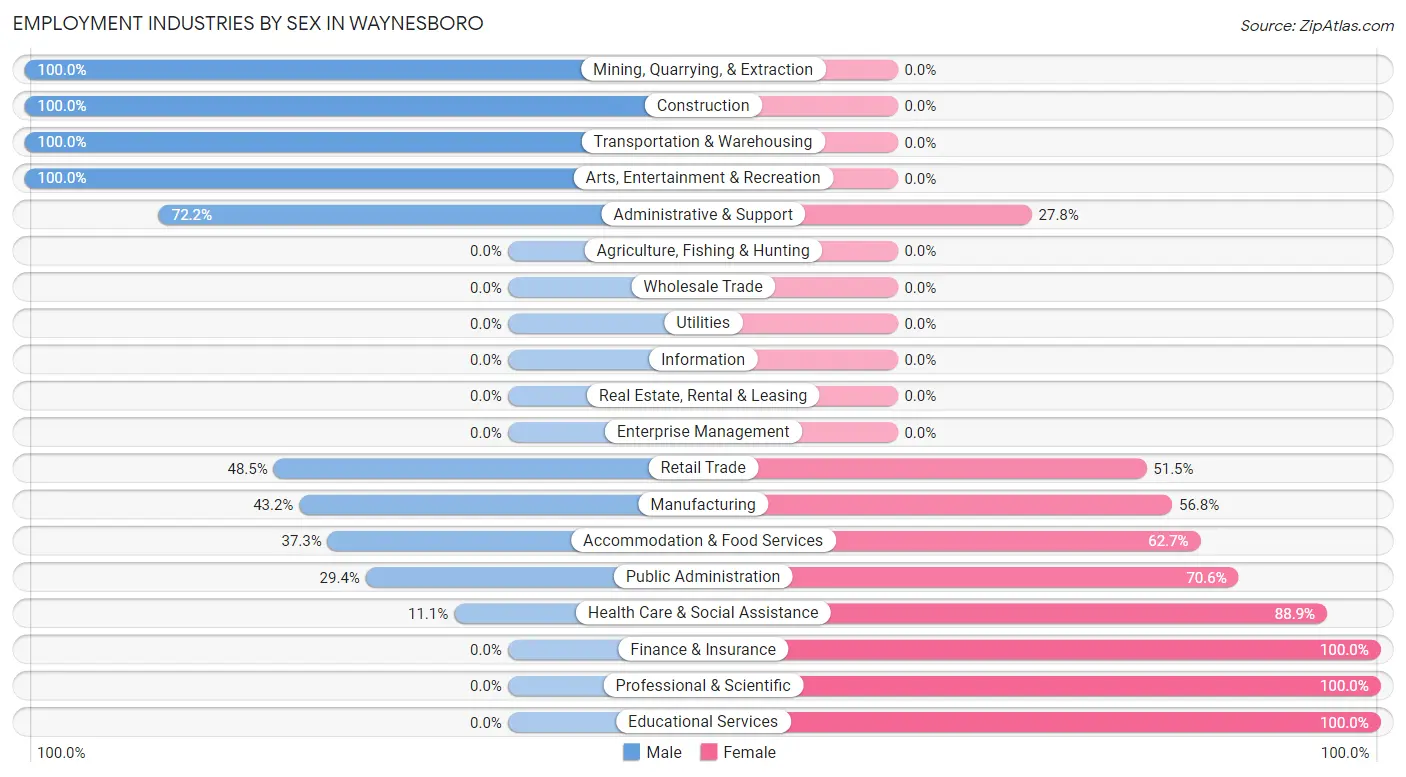
Employment Industries by Sex in Waynesboro
The Waynesboro industries that see more men than women are Mining, Quarrying, & Extraction (100.0%), Construction (100.0%), and Transportation & Warehousing (100.0%), whereas the industries that tend to have a higher number of women are Finance & Insurance (100.0%), Professional & Scientific (100.0%), and Educational Services (100.0%).
| Industry | Male | Female |
| Agriculture, Fishing & Hunting | 0 (0.0%) | 0 (0.0%) |
| Mining, Quarrying, & Extraction | 17 (100.0%) | 0 (0.0%) |
| Construction | 129 (100.0%) | 0 (0.0%) |
| Manufacturing | 82 (43.2%) | 108 (56.8%) |
| Wholesale Trade | 0 (0.0%) | 0 (0.0%) |
| Retail Trade | 95 (48.5%) | 101 (51.5%) |
| Transportation & Warehousing | 11 (100.0%) | 0 (0.0%) |
| Utilities | 0 (0.0%) | 0 (0.0%) |
| Information | 0 (0.0%) | 0 (0.0%) |
| Finance & Insurance | 0 (0.0%) | 99 (100.0%) |
| Real Estate, Rental & Leasing | 0 (0.0%) | 0 (0.0%) |
| Professional & Scientific | 0 (0.0%) | 82 (100.0%) |
| Enterprise Management | 0 (0.0%) | 0 (0.0%) |
| Administrative & Support | 13 (72.2%) | 5 (27.8%) |
| Educational Services | 0 (0.0%) | 48 (100.0%) |
| Health Care & Social Assistance | 12 (11.1%) | 96 (88.9%) |
| Arts, Entertainment & Recreation | 45 (100.0%) | 0 (0.0%) |
| Accommodation & Food Services | 66 (37.3%) | 111 (62.7%) |
| Public Administration | 30 (29.4%) | 72 (70.6%) |
| Total | 500 (40.9%) | 722 (59.1%) |
Education in Waynesboro
School Enrollment in Waynesboro
The most common levels of schooling among the 1,097 students in Waynesboro are elementary school (346 | 31.5%), middle school (339 | 30.9%), and high school (273 | 24.9%).
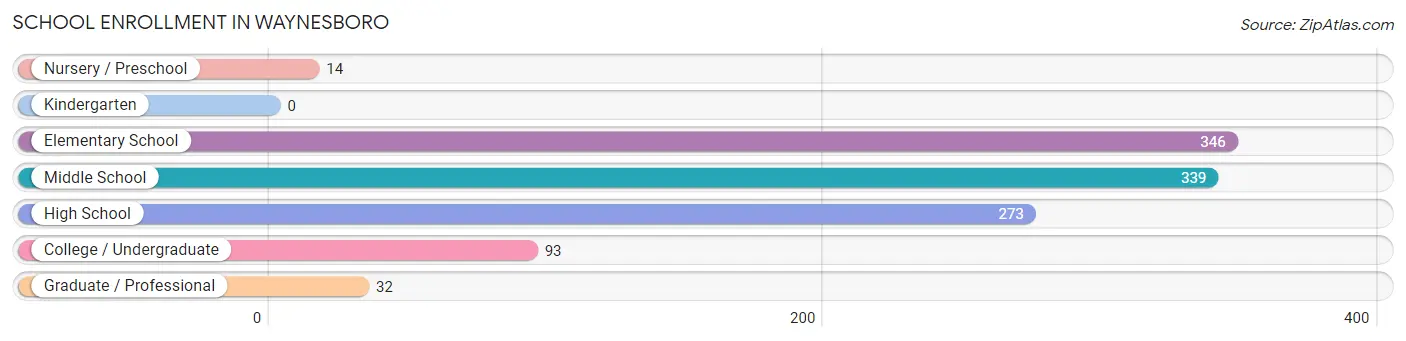
| School Level | # Students | % Students |
| Nursery / Preschool | 14 | 1.3% |
| Kindergarten | 0 | 0.0% |
| Elementary School | 346 | 31.5% |
| Middle School | 339 | 30.9% |
| High School | 273 | 24.9% |
| College / Undergraduate | 93 | 8.5% |
| Graduate / Professional | 32 | 2.9% |
| Total | 1,097 | 100.0% |
School Enrollment by Age by Funding Source in Waynesboro
Out of a total of 1,097 students who are enrolled in schools in Waynesboro, 303 (27.6%) attend a private institution, while the remaining 794 (72.4%) are enrolled in public schools. The age group of 25 to 34 year olds has the highest likelihood of being enrolled in private schools, with 36 (76.6% in the age bracket) enrolled. Conversely, the age group of 20 to 24 year olds has the lowest likelihood of being enrolled in a private school, with 57 (100.0% in the age bracket) attending a public institution.
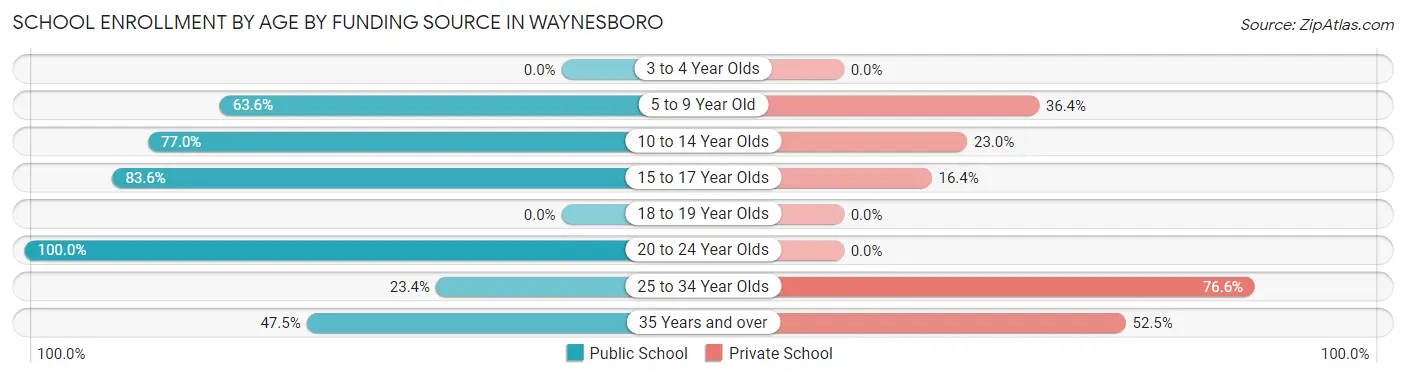
| Age Bracket | Public School | Private School |
| 3 to 4 Year Olds | 0 (0.0%) | 0 (0.0%) |
| 5 to 9 Year Old | 182 (63.6%) | 104 (36.4%) |
| 10 to 14 Year Olds | 382 (77.0%) | 114 (23.0%) |
| 15 to 17 Year Olds | 143 (83.6%) | 28 (16.4%) |
| 18 to 19 Year Olds | 0 (0.0%) | 0 (0.0%) |
| 20 to 24 Year Olds | 57 (100.0%) | 0 (0.0%) |
| 25 to 34 Year Olds | 11 (23.4%) | 36 (76.6%) |
| 35 Years and over | 19 (47.5%) | 21 (52.5%) |
| Total | 794 (72.4%) | 303 (27.6%) |
Educational Attainment by Field of Study in Waynesboro
Psychology (236 | 31.6%), business (135 | 18.1%), education (127 | 17.0%), science & technology (109 | 14.6%), and bio, nature & agricultural (67 | 9.0%) are the most common fields of study among 746 individuals in Waynesboro who have obtained a bachelor's degree or higher.
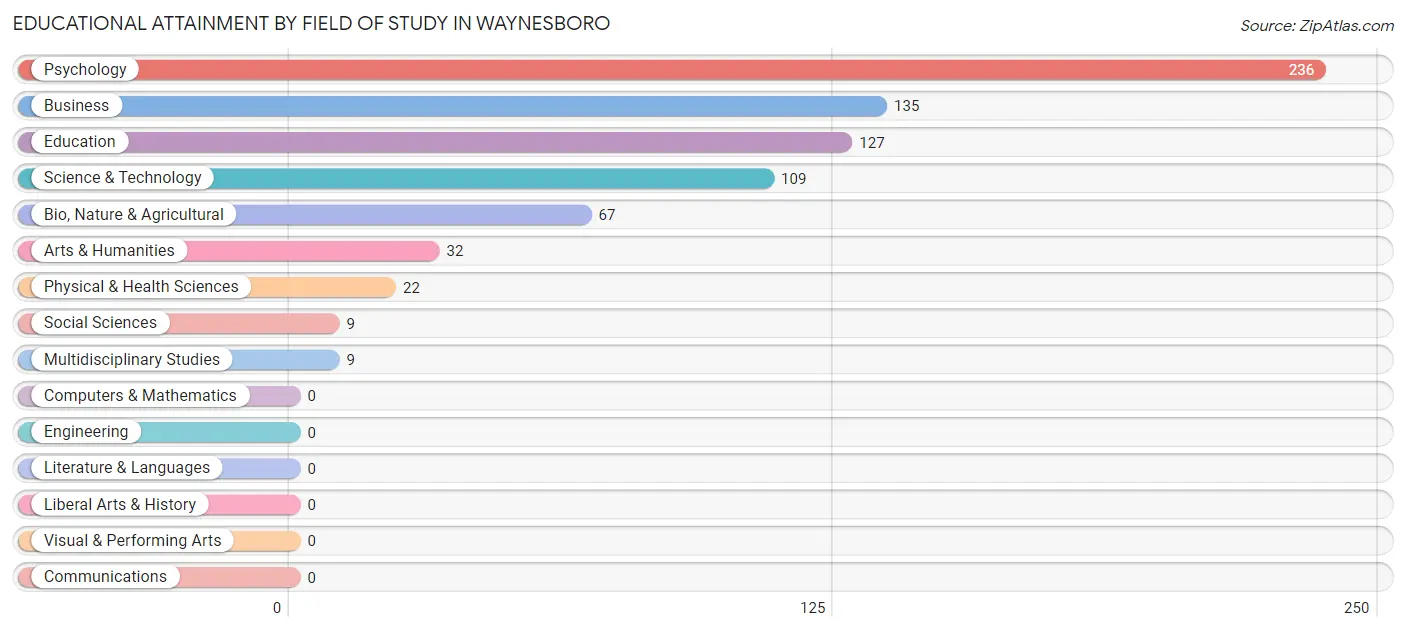
| Field of Study | # Graduates | % Graduates |
| Computers & Mathematics | 0 | 0.0% |
| Bio, Nature & Agricultural | 67 | 9.0% |
| Physical & Health Sciences | 22 | 2.9% |
| Psychology | 236 | 31.6% |
| Social Sciences | 9 | 1.2% |
| Engineering | 0 | 0.0% |
| Multidisciplinary Studies | 9 | 1.2% |
| Science & Technology | 109 | 14.6% |
| Business | 135 | 18.1% |
| Education | 127 | 17.0% |
| Literature & Languages | 0 | 0.0% |
| Liberal Arts & History | 0 | 0.0% |
| Visual & Performing Arts | 0 | 0.0% |
| Communications | 0 | 0.0% |
| Arts & Humanities | 32 | 4.3% |
| Total | 746 | 100.0% |
Transportation & Commute in Waynesboro
Vehicle Availability by Sex in Waynesboro
The most prevalent vehicle ownership categories in Waynesboro are males with 2 vehicles (350, accounting for 70.0%) and females with 2 vehicles (334, making up 48.5%).
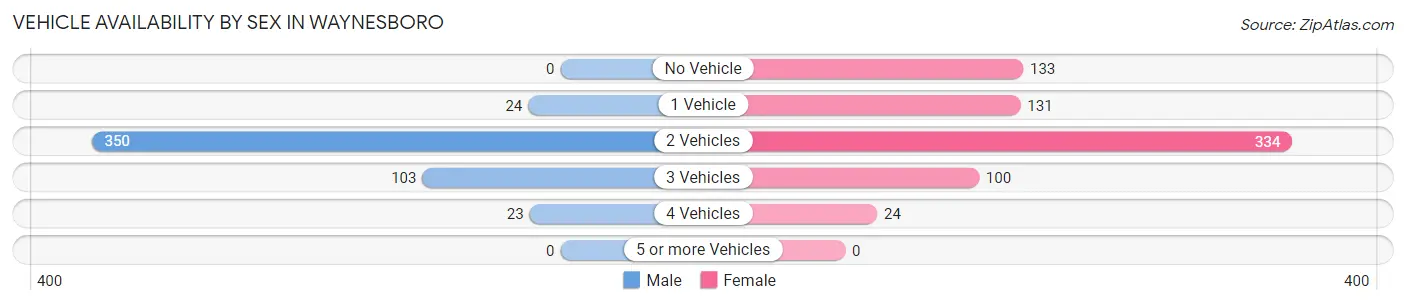
| Vehicles Available | Male | Female |
| No Vehicle | 0 (0.0%) | 133 (18.4%) |
| 1 Vehicle | 24 (4.8%) | 131 (18.1%) |
| 2 Vehicles | 350 (70.0%) | 334 (46.3%) |
| 3 Vehicles | 103 (20.6%) | 100 (13.9%) |
| 4 Vehicles | 23 (4.6%) | 24 (3.3%) |
| 5 or more Vehicles | 0 (0.0%) | 0 (0.0%) |
| Total | 500 (100.0%) | 722 (100.0%) |
Commute Time in Waynesboro
The most frequently occuring commute durations in Waynesboro are 5 to 9 minutes (394 commuters, 34.6%), 10 to 14 minutes (184 commuters, 16.1%), and 15 to 19 minutes (136 commuters, 11.9%).
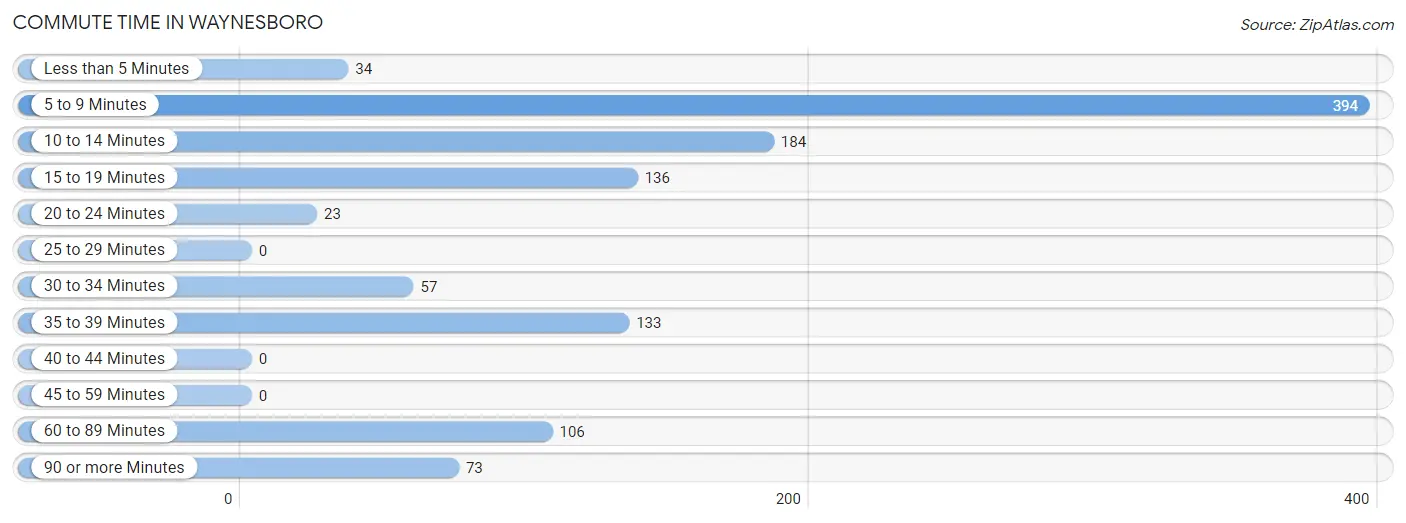
| Commute Time | # Commuters | % Commuters |
| Less than 5 Minutes | 34 | 3.0% |
| 5 to 9 Minutes | 394 | 34.6% |
| 10 to 14 Minutes | 184 | 16.1% |
| 15 to 19 Minutes | 136 | 11.9% |
| 20 to 24 Minutes | 23 | 2.0% |
| 25 to 29 Minutes | 0 | 0.0% |
| 30 to 34 Minutes | 57 | 5.0% |
| 35 to 39 Minutes | 133 | 11.7% |
| 40 to 44 Minutes | 0 | 0.0% |
| 45 to 59 Minutes | 0 | 0.0% |
| 60 to 89 Minutes | 106 | 9.3% |
| 90 or more Minutes | 73 | 6.4% |
Commute Time by Sex in Waynesboro
The most common commute times in Waynesboro are 5 to 9 minutes (151 commuters, 30.2%) for males and 5 to 9 minutes (243 commuters, 38.0%) for females.
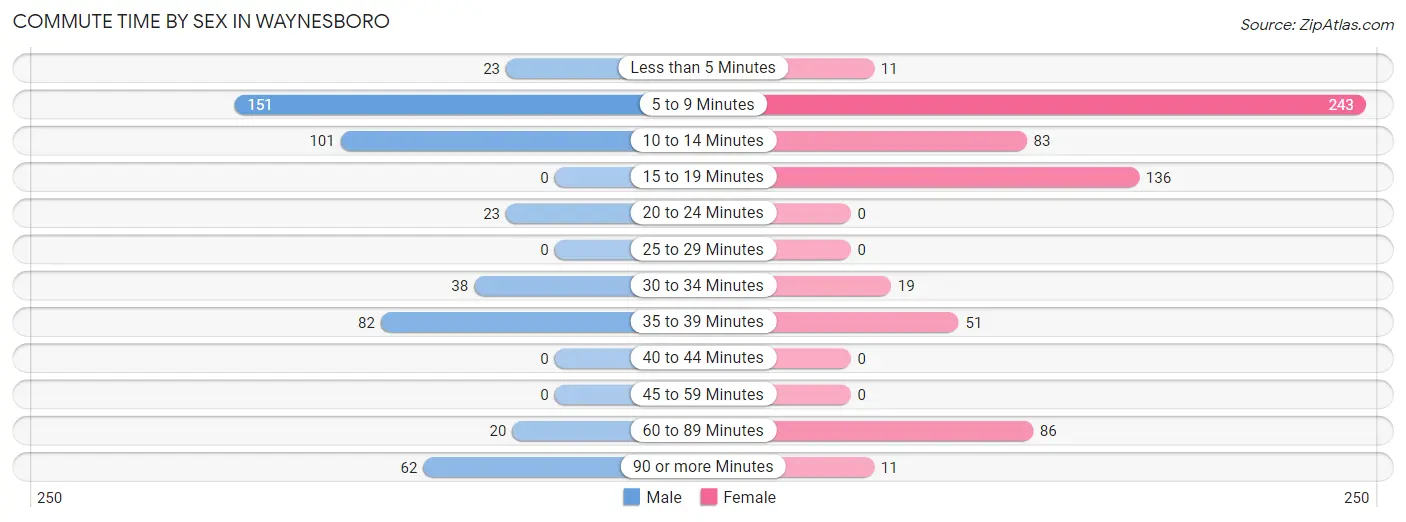
| Commute Time | Male | Female |
| Less than 5 Minutes | 23 (4.6%) | 11 (1.7%) |
| 5 to 9 Minutes | 151 (30.2%) | 243 (38.0%) |
| 10 to 14 Minutes | 101 (20.2%) | 83 (13.0%) |
| 15 to 19 Minutes | 0 (0.0%) | 136 (21.2%) |
| 20 to 24 Minutes | 23 (4.6%) | 0 (0.0%) |
| 25 to 29 Minutes | 0 (0.0%) | 0 (0.0%) |
| 30 to 34 Minutes | 38 (7.6%) | 19 (3.0%) |
| 35 to 39 Minutes | 82 (16.4%) | 51 (8.0%) |
| 40 to 44 Minutes | 0 (0.0%) | 0 (0.0%) |
| 45 to 59 Minutes | 0 (0.0%) | 0 (0.0%) |
| 60 to 89 Minutes | 20 (4.0%) | 86 (13.4%) |
| 90 or more Minutes | 62 (12.4%) | 11 (1.7%) |
Time of Departure to Work by Sex in Waynesboro
The most frequent times of departure to work in Waynesboro are 6:30 AM to 6:59 AM (119, 23.8%) for males and 12:00 PM to 3:59 PM (122, 19.1%) for females.
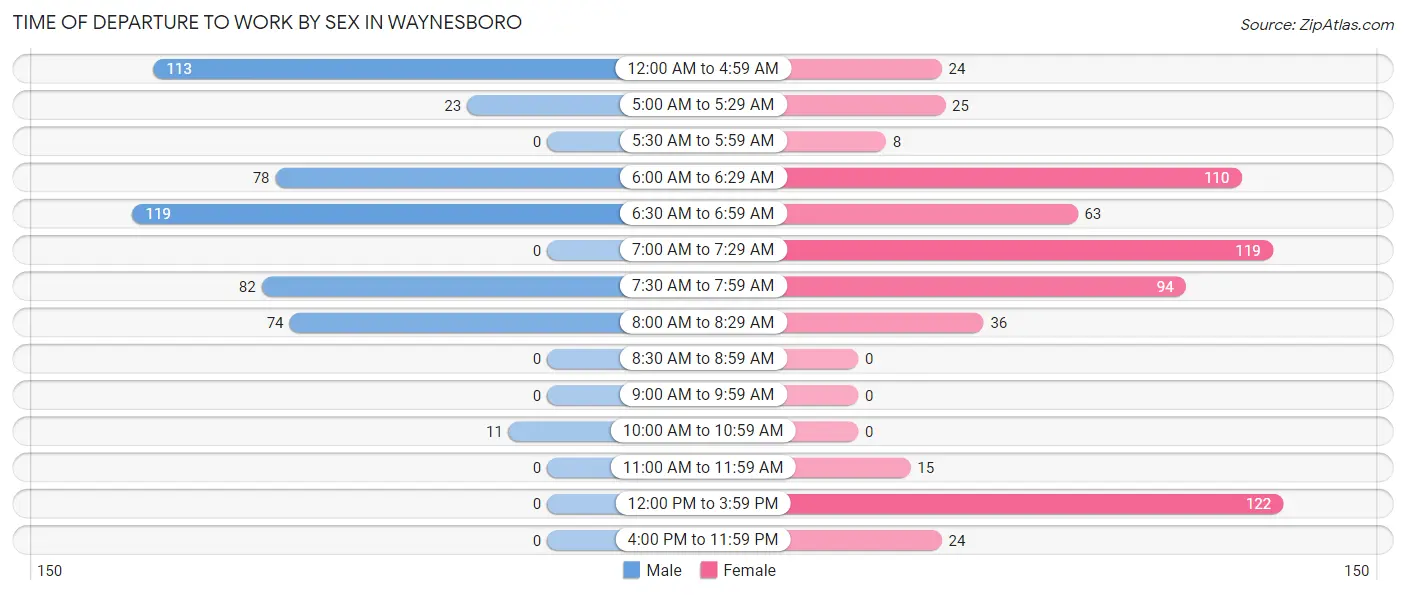
| Time of Departure | Male | Female |
| 12:00 AM to 4:59 AM | 113 (22.6%) | 24 (3.7%) |
| 5:00 AM to 5:29 AM | 23 (4.6%) | 25 (3.9%) |
| 5:30 AM to 5:59 AM | 0 (0.0%) | 8 (1.3%) |
| 6:00 AM to 6:29 AM | 78 (15.6%) | 110 (17.2%) |
| 6:30 AM to 6:59 AM | 119 (23.8%) | 63 (9.8%) |
| 7:00 AM to 7:29 AM | 0 (0.0%) | 119 (18.6%) |
| 7:30 AM to 7:59 AM | 82 (16.4%) | 94 (14.7%) |
| 8:00 AM to 8:29 AM | 74 (14.8%) | 36 (5.6%) |
| 8:30 AM to 8:59 AM | 0 (0.0%) | 0 (0.0%) |
| 9:00 AM to 9:59 AM | 0 (0.0%) | 0 (0.0%) |
| 10:00 AM to 10:59 AM | 11 (2.2%) | 0 (0.0%) |
| 11:00 AM to 11:59 AM | 0 (0.0%) | 15 (2.3%) |
| 12:00 PM to 3:59 PM | 0 (0.0%) | 122 (19.1%) |
| 4:00 PM to 11:59 PM | 0 (0.0%) | 24 (3.7%) |
| Total | 500 (100.0%) | 640 (100.0%) |
Housing Occupancy in Waynesboro
Occupancy by Ownership in Waynesboro
Of the total 1,788 dwellings in Waynesboro, owner-occupied units account for 1,373 (76.8%), while renter-occupied units make up 415 (23.2%).
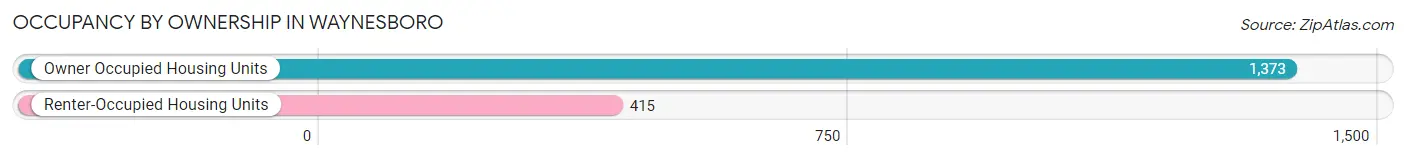
| Occupancy | # Housing Units | % Housing Units |
| Owner Occupied Housing Units | 1,373 | 76.8% |
| Renter-Occupied Housing Units | 415 | 23.2% |
| Total Occupied Housing Units | 1,788 | 100.0% |
Occupancy by Household Size in Waynesboro
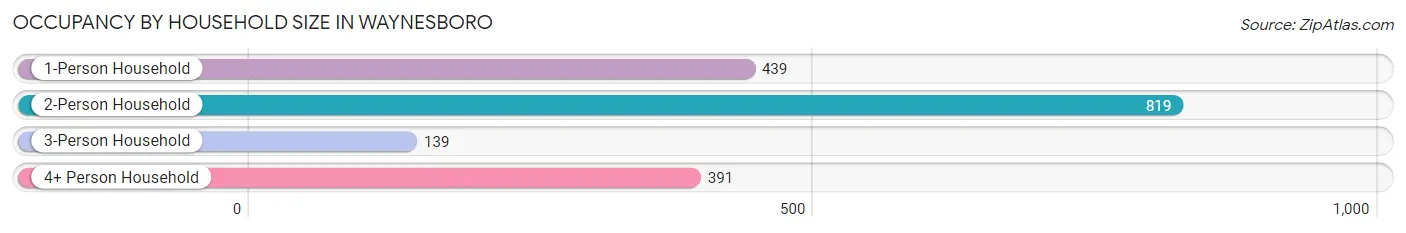
| Household Size | # Housing Units | % Housing Units |
| 1-Person Household | 439 | 24.5% |
| 2-Person Household | 819 | 45.8% |
| 3-Person Household | 139 | 7.8% |
| 4+ Person Household | 391 | 21.9% |
| Total Housing Units | 1,788 | 100.0% |
Occupancy by Ownership by Household Size in Waynesboro
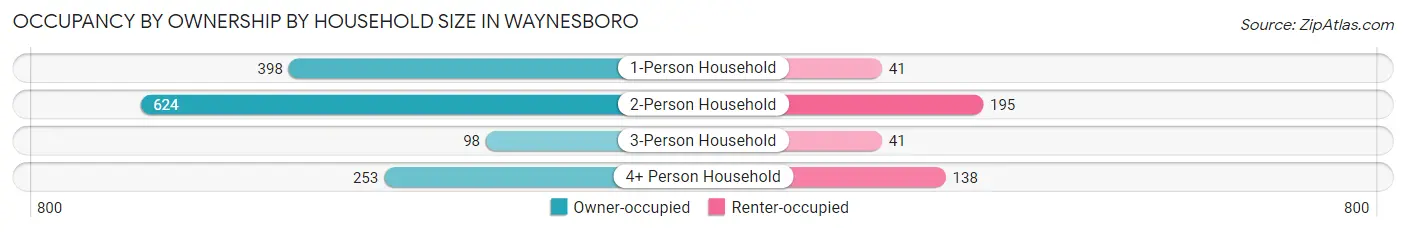
| Household Size | Owner-occupied | Renter-occupied |
| 1-Person Household | 398 (90.7%) | 41 (9.3%) |
| 2-Person Household | 624 (76.2%) | 195 (23.8%) |
| 3-Person Household | 98 (70.5%) | 41 (29.5%) |
| 4+ Person Household | 253 (64.7%) | 138 (35.3%) |
| Total Housing Units | 1,373 (76.8%) | 415 (23.2%) |
Occupancy by Educational Attainment in Waynesboro
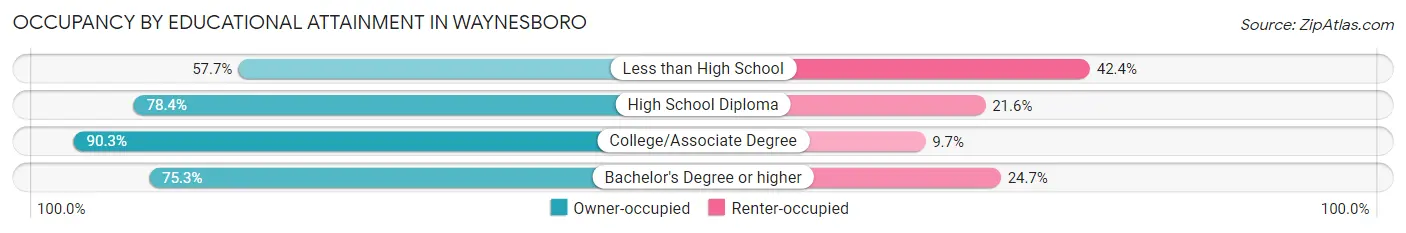
| Household Size | Owner-occupied | Renter-occupied |
| Less than High School | 177 (57.7%) | 130 (42.3%) |
| High School Diploma | 446 (78.4%) | 123 (21.6%) |
| College/Associate Degree | 381 (90.3%) | 41 (9.7%) |
| Bachelor's Degree or higher | 369 (75.3%) | 121 (24.7%) |
Occupancy by Age of Householder in Waynesboro
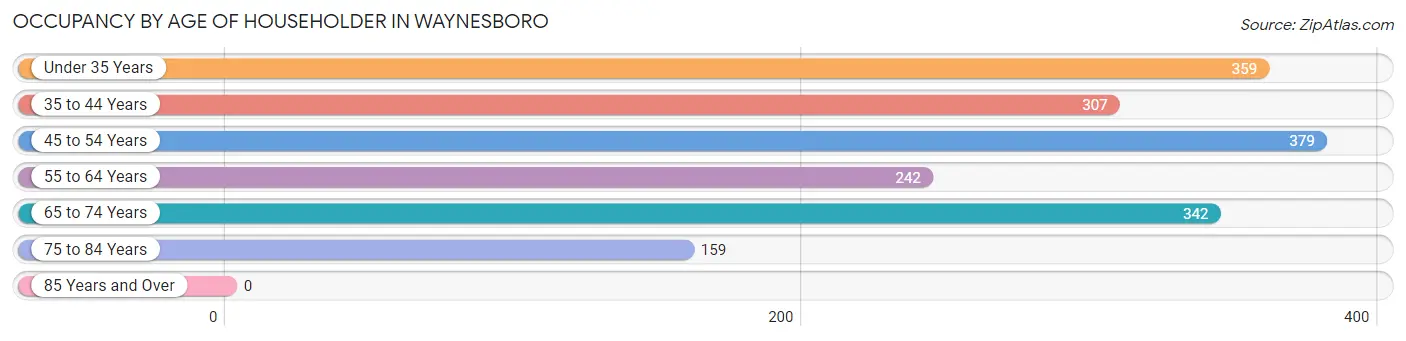
| Age Bracket | # Households | % Households |
| Under 35 Years | 359 | 20.1% |
| 35 to 44 Years | 307 | 17.2% |
| 45 to 54 Years | 379 | 21.2% |
| 55 to 64 Years | 242 | 13.5% |
| 65 to 74 Years | 342 | 19.1% |
| 75 to 84 Years | 159 | 8.9% |
| 85 Years and Over | 0 | 0.0% |
| Total | 1,788 | 100.0% |
Housing Finances in Waynesboro
Median Income by Occupancy in Waynesboro
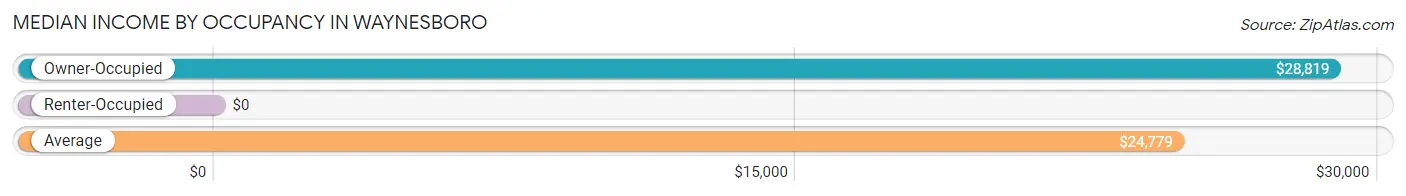
| Occupancy Type | # Households | Median Income |
| Owner-Occupied | 1,373 (76.8%) | $28,819 |
| Renter-Occupied | 415 (23.2%) | $0 |
| Average | 1,788 (100.0%) | $24,779 |
Occupancy by Householder Income Bracket in Waynesboro
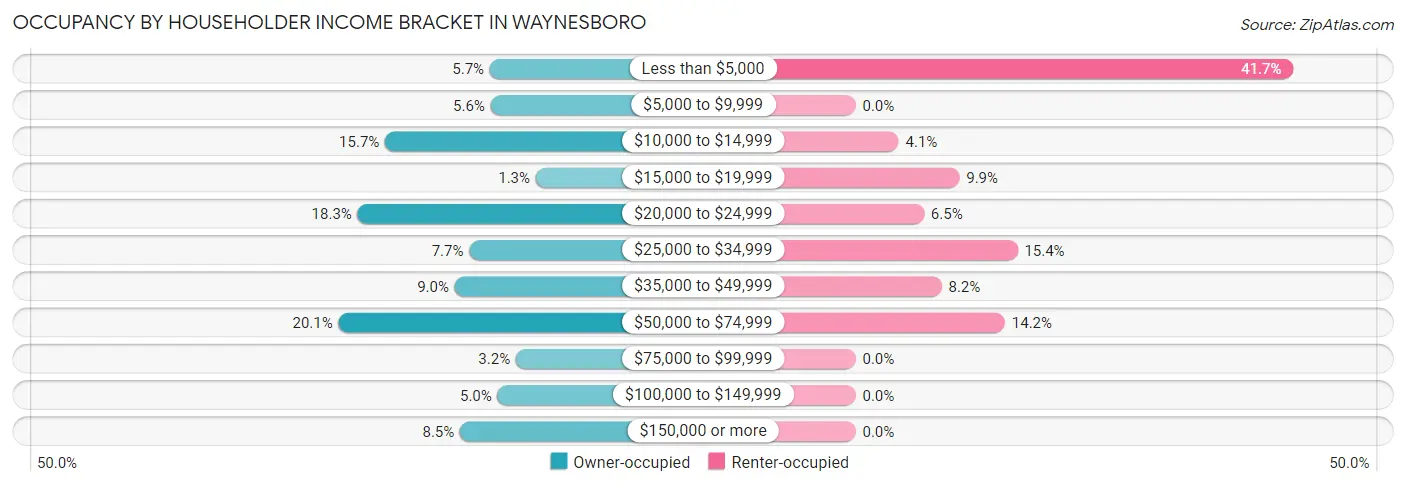
| Income Bracket | Owner-occupied | Renter-occupied |
| Less than $5,000 | 78 (5.7%) | 173 (41.7%) |
| $5,000 to $9,999 | 77 (5.6%) | 0 (0.0%) |
| $10,000 to $14,999 | 215 (15.7%) | 17 (4.1%) |
| $15,000 to $19,999 | 18 (1.3%) | 41 (9.9%) |
| $20,000 to $24,999 | 251 (18.3%) | 27 (6.5%) |
| $25,000 to $34,999 | 105 (7.6%) | 64 (15.4%) |
| $35,000 to $49,999 | 124 (9.0%) | 34 (8.2%) |
| $50,000 to $74,999 | 276 (20.1%) | 59 (14.2%) |
| $75,000 to $99,999 | 44 (3.2%) | 0 (0.0%) |
| $100,000 to $149,999 | 68 (5.0%) | 0 (0.0%) |
| $150,000 or more | 117 (8.5%) | 0 (0.0%) |
| Total | 1,373 (100.0%) | 415 (100.0%) |
Monthly Housing Cost Tiers in Waynesboro
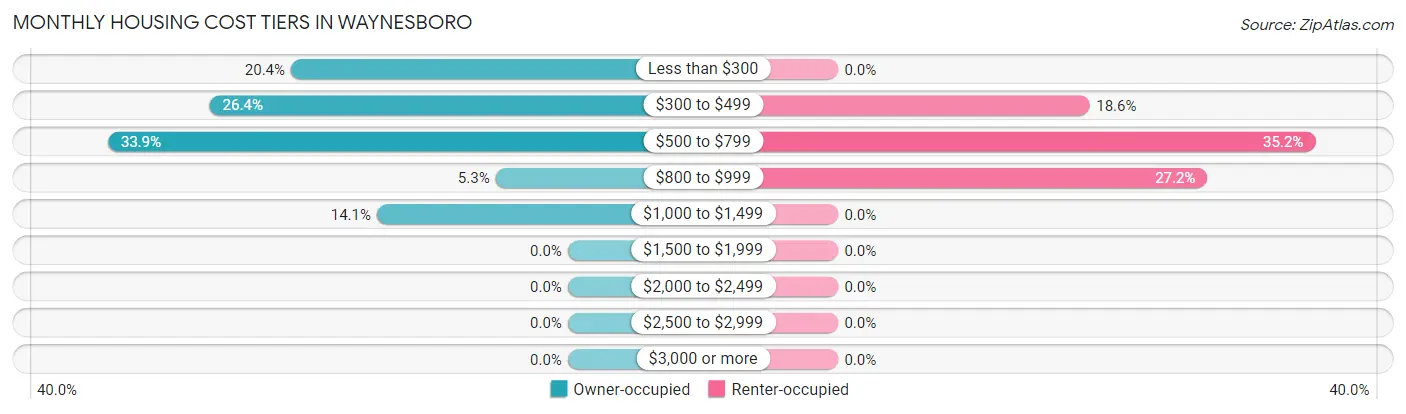
| Monthly Cost | Owner-occupied | Renter-occupied |
| Less than $300 | 280 (20.4%) | 0 (0.0%) |
| $300 to $499 | 362 (26.4%) | 77 (18.5%) |
| $500 to $799 | 465 (33.9%) | 146 (35.2%) |
| $800 to $999 | 73 (5.3%) | 113 (27.2%) |
| $1,000 to $1,499 | 193 (14.1%) | 0 (0.0%) |
| $1,500 to $1,999 | 0 (0.0%) | 0 (0.0%) |
| $2,000 to $2,499 | 0 (0.0%) | 0 (0.0%) |
| $2,500 to $2,999 | 0 (0.0%) | 0 (0.0%) |
| $3,000 or more | 0 (0.0%) | 0 (0.0%) |
| Total | 1,373 (100.0%) | 415 (100.0%) |
Physical Housing Characteristics in Waynesboro
Housing Structures in Waynesboro
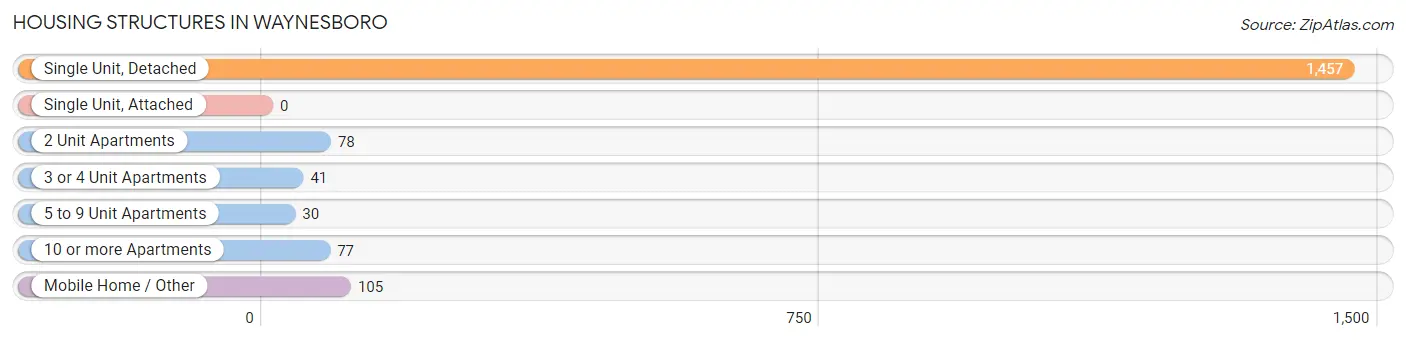
| Structure Type | # Housing Units | % Housing Units |
| Single Unit, Detached | 1,457 | 81.5% |
| Single Unit, Attached | 0 | 0.0% |
| 2 Unit Apartments | 78 | 4.4% |
| 3 or 4 Unit Apartments | 41 | 2.3% |
| 5 to 9 Unit Apartments | 30 | 1.7% |
| 10 or more Apartments | 77 | 4.3% |
| Mobile Home / Other | 105 | 5.9% |
| Total | 1,788 | 100.0% |
Housing Structures by Occupancy in Waynesboro
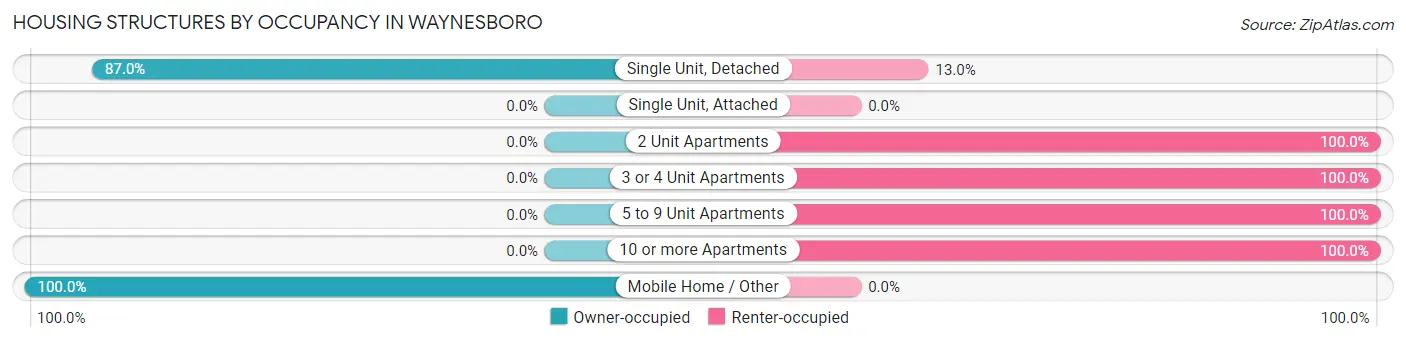
| Structure Type | Owner-occupied | Renter-occupied |
| Single Unit, Detached | 1,268 (87.0%) | 189 (13.0%) |
| Single Unit, Attached | 0 (0.0%) | 0 (0.0%) |
| 2 Unit Apartments | 0 (0.0%) | 78 (100.0%) |
| 3 or 4 Unit Apartments | 0 (0.0%) | 41 (100.0%) |
| 5 to 9 Unit Apartments | 0 (0.0%) | 30 (100.0%) |
| 10 or more Apartments | 0 (0.0%) | 77 (100.0%) |
| Mobile Home / Other | 105 (100.0%) | 0 (0.0%) |
| Total | 1,373 (76.8%) | 415 (23.2%) |
Housing Structures by Number of Rooms in Waynesboro
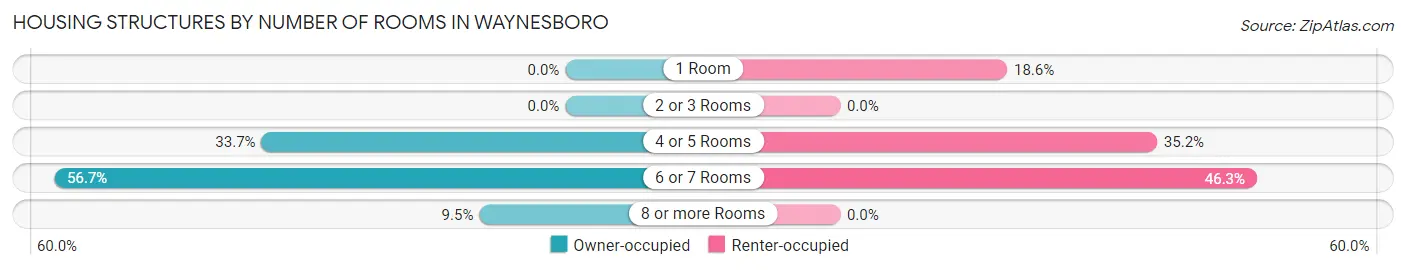
| Number of Rooms | Owner-occupied | Renter-occupied |
| 1 Room | 0 (0.0%) | 77 (18.5%) |
| 2 or 3 Rooms | 0 (0.0%) | 0 (0.0%) |
| 4 or 5 Rooms | 463 (33.7%) | 146 (35.2%) |
| 6 or 7 Rooms | 779 (56.7%) | 192 (46.3%) |
| 8 or more Rooms | 131 (9.5%) | 0 (0.0%) |
| Total | 1,373 (100.0%) | 415 (100.0%) |
Housing Structure by Heating Type in Waynesboro
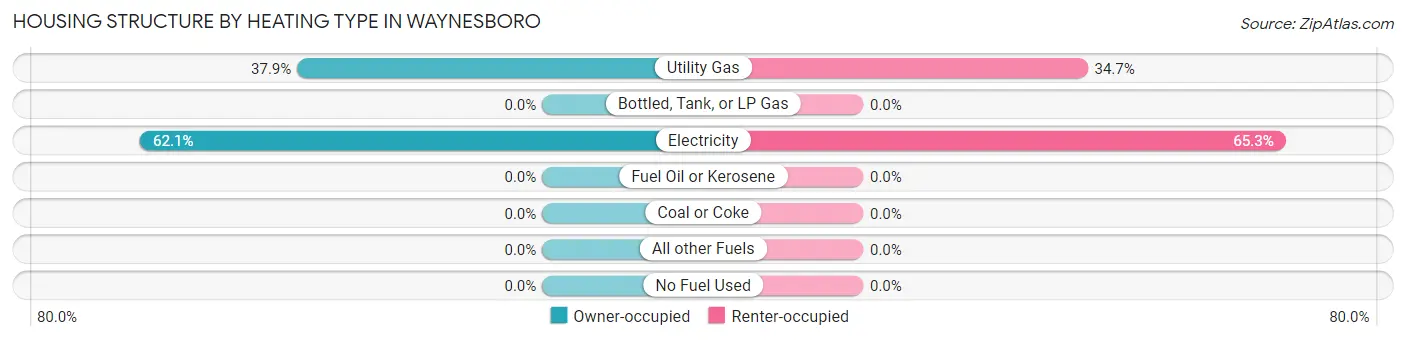
| Heating Type | Owner-occupied | Renter-occupied |
| Utility Gas | 520 (37.9%) | 144 (34.7%) |
| Bottled, Tank, or LP Gas | 0 (0.0%) | 0 (0.0%) |
| Electricity | 853 (62.1%) | 271 (65.3%) |
| Fuel Oil or Kerosene | 0 (0.0%) | 0 (0.0%) |
| Coal or Coke | 0 (0.0%) | 0 (0.0%) |
| All other Fuels | 0 (0.0%) | 0 (0.0%) |
| No Fuel Used | 0 (0.0%) | 0 (0.0%) |
| Total | 1,373 (100.0%) | 415 (100.0%) |
Household Vehicle Usage in Waynesboro
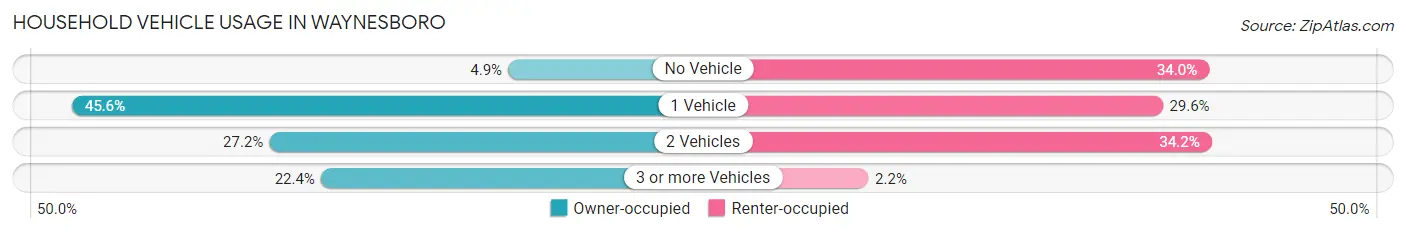
| Vehicles per Household | Owner-occupied | Renter-occupied |
| No Vehicle | 67 (4.9%) | 141 (34.0%) |
| 1 Vehicle | 626 (45.6%) | 123 (29.6%) |
| 2 Vehicles | 373 (27.2%) | 142 (34.2%) |
| 3 or more Vehicles | 307 (22.4%) | 9 (2.2%) |
| Total | 1,373 (100.0%) | 415 (100.0%) |
Real Estate & Mortgages in Waynesboro
Real Estate and Mortgage Overview in Waynesboro
| Characteristic | Without Mortgage | With Mortgage |
| Housing Units | 749 | 624 |
| Median Property Value | $86,600 | $80,700 |
| Median Household Income | $29,375 | $45 |
| Monthly Housing Costs | $352 | $0 |
| Real Estate Taxes | $791 | $10 |
Property Value by Mortgage Status in Waynesboro
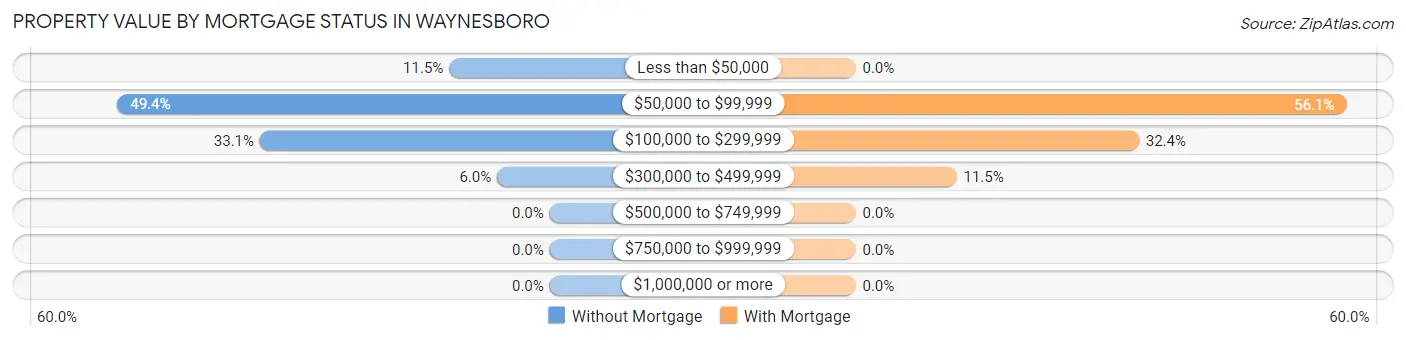
| Property Value | Without Mortgage | With Mortgage |
| Less than $50,000 | 86 (11.5%) | 0 (0.0%) |
| $50,000 to $99,999 | 370 (49.4%) | 350 (56.1%) |
| $100,000 to $299,999 | 248 (33.1%) | 202 (32.4%) |
| $300,000 to $499,999 | 45 (6.0%) | 72 (11.5%) |
| $500,000 to $749,999 | 0 (0.0%) | 0 (0.0%) |
| $750,000 to $999,999 | 0 (0.0%) | 0 (0.0%) |
| $1,000,000 or more | 0 (0.0%) | 0 (0.0%) |
| Total | 749 (100.0%) | 624 (100.0%) |
Household Income by Mortgage Status in Waynesboro
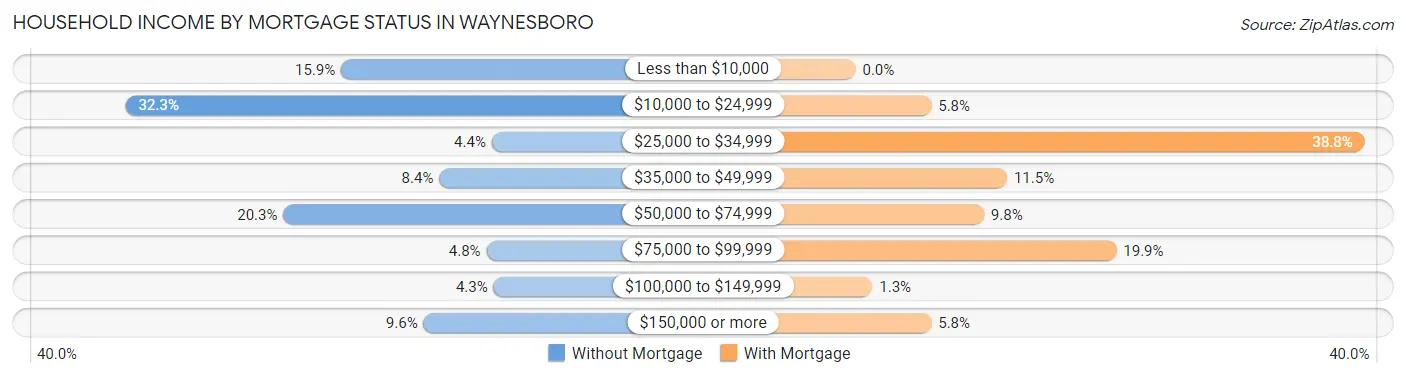
| Household Income | Without Mortgage | With Mortgage |
| Less than $10,000 | 119 (15.9%) | 0 (0.0%) |
| $10,000 to $24,999 | 242 (32.3%) | 36 (5.8%) |
| $25,000 to $34,999 | 33 (4.4%) | 242 (38.8%) |
| $35,000 to $49,999 | 63 (8.4%) | 72 (11.5%) |
| $50,000 to $74,999 | 152 (20.3%) | 61 (9.8%) |
| $75,000 to $99,999 | 36 (4.8%) | 124 (19.9%) |
| $100,000 to $149,999 | 32 (4.3%) | 8 (1.3%) |
| $150,000 or more | 72 (9.6%) | 36 (5.8%) |
| Total | 749 (100.0%) | 624 (100.0%) |
Property Value to Household Income Ratio in Waynesboro
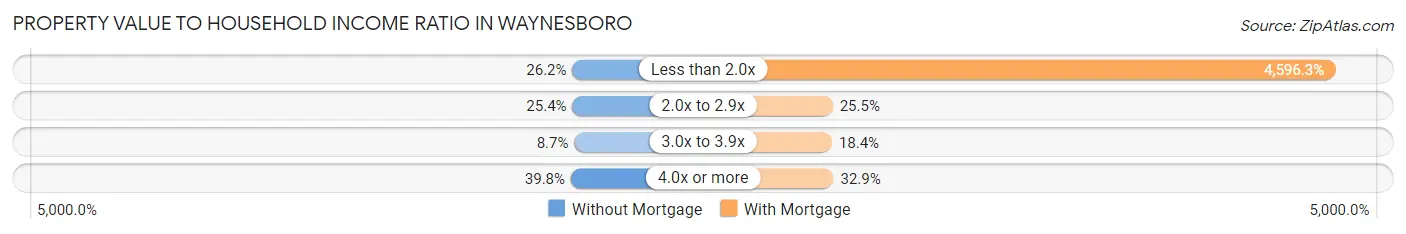
| Value-to-Income Ratio | Without Mortgage | With Mortgage |
| Less than 2.0x | 196 (26.2%) | 28,681 (4,596.3%) |
| 2.0x to 2.9x | 190 (25.4%) | 159 (25.5%) |
| 3.0x to 3.9x | 65 (8.7%) | 115 (18.4%) |
| 4.0x or more | 298 (39.8%) | 205 (32.9%) |
| Total | 749 (100.0%) | 624 (100.0%) |
Real Estate Taxes by Mortgage Status in Waynesboro
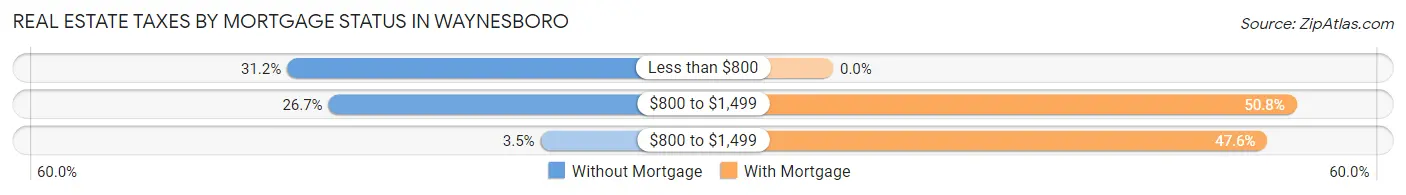
| Property Taxes | Without Mortgage | With Mortgage |
| Less than $800 | 234 (31.2%) | 0 (0.0%) |
| $800 to $1,499 | 200 (26.7%) | 317 (50.8%) |
| $800 to $1,499 | 26 (3.5%) | 297 (47.6%) |
| Total | 749 (100.0%) | 624 (100.0%) |
Health & Disability in Waynesboro
Health Insurance Coverage by Age in Waynesboro
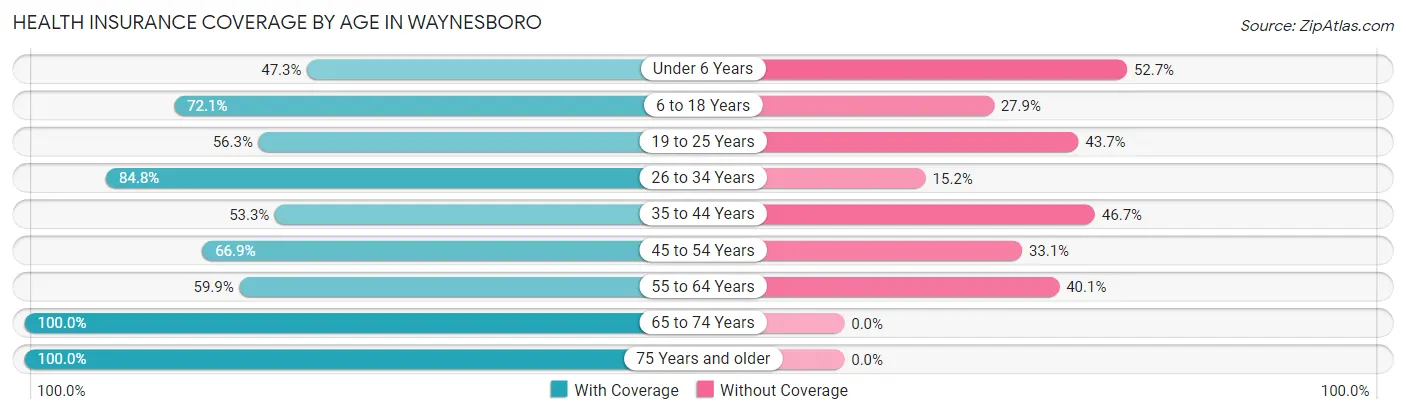
| Age Bracket | With Coverage | Without Coverage |
| Under 6 Years | 131 (47.3%) | 146 (52.7%) |
| 6 to 18 Years | 722 (72.1%) | 279 (27.9%) |
| 19 to 25 Years | 151 (56.3%) | 117 (43.7%) |
| 26 to 34 Years | 425 (84.8%) | 76 (15.2%) |
| 35 to 44 Years | 301 (53.3%) | 264 (46.7%) |
| 45 to 54 Years | 432 (66.9%) | 214 (33.1%) |
| 55 to 64 Years | 308 (59.9%) | 206 (40.1%) |
| 65 to 74 Years | 552 (100.0%) | 0 (0.0%) |
| 75 Years and older | 168 (100.0%) | 0 (0.0%) |
| Total | 3,190 (71.0%) | 1,302 (29.0%) |
Health Insurance Coverage by Citizenship Status in Waynesboro
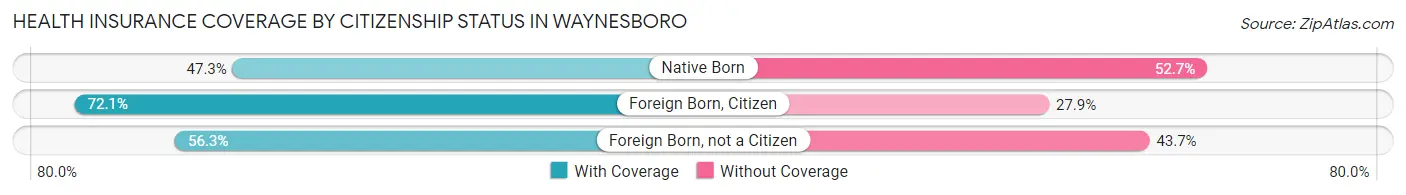
| Citizenship Status | With Coverage | Without Coverage |
| Native Born | 131 (47.3%) | 146 (52.7%) |
| Foreign Born, Citizen | 722 (72.1%) | 279 (27.9%) |
| Foreign Born, not a Citizen | 151 (56.3%) | 117 (43.7%) |
Health Insurance Coverage by Household Income in Waynesboro
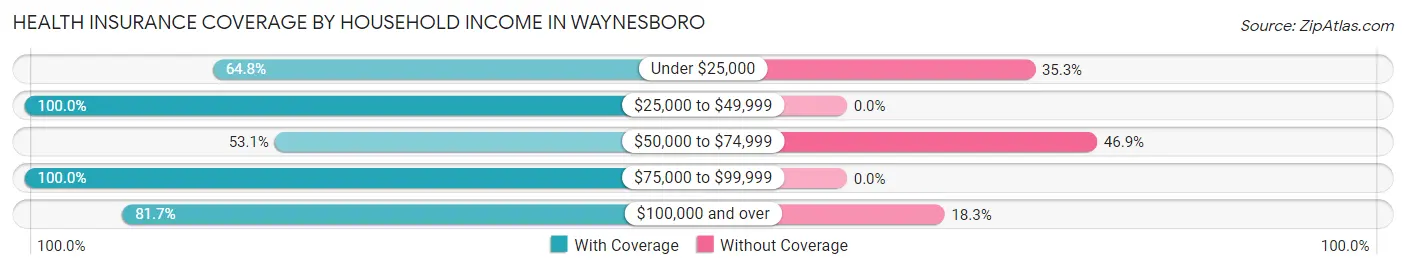
| Household Income | With Coverage | Without Coverage |
| Under $25,000 | 1,407 (64.7%) | 766 (35.2%) |
| $25,000 to $49,999 | 766 (100.0%) | 0 (0.0%) |
| $50,000 to $74,999 | 508 (53.1%) | 448 (46.9%) |
| $75,000 to $99,999 | 80 (100.0%) | 0 (0.0%) |
| $100,000 and over | 393 (81.7%) | 88 (18.3%) |
Public vs Private Health Insurance Coverage by Age in Waynesboro
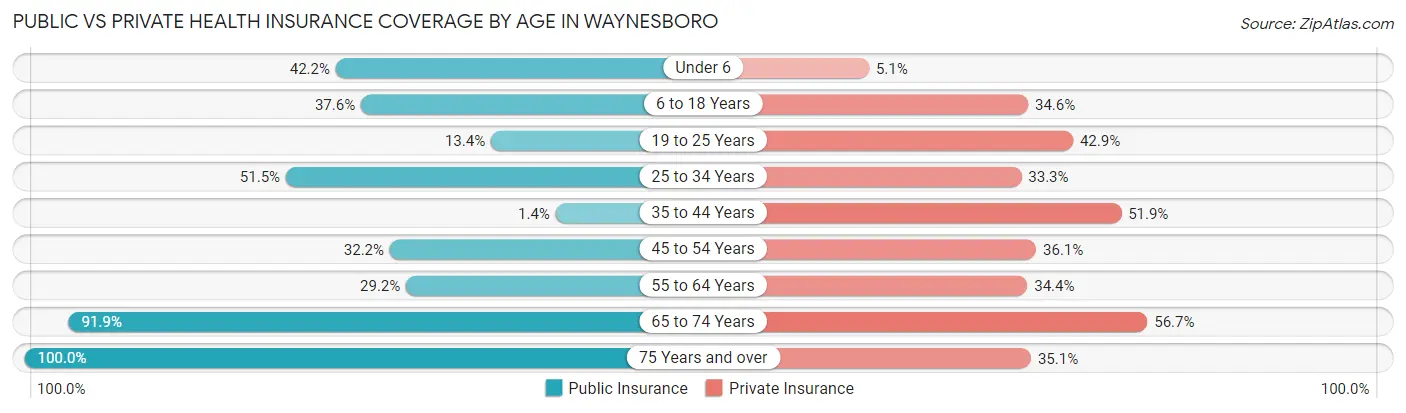
| Age Bracket | Public Insurance | Private Insurance |
| Under 6 | 117 (42.2%) | 14 (5.1%) |
| 6 to 18 Years | 376 (37.6%) | 346 (34.6%) |
| 19 to 25 Years | 36 (13.4%) | 115 (42.9%) |
| 25 to 34 Years | 258 (51.5%) | 167 (33.3%) |
| 35 to 44 Years | 8 (1.4%) | 293 (51.9%) |
| 45 to 54 Years | 208 (32.2%) | 233 (36.1%) |
| 55 to 64 Years | 150 (29.2%) | 177 (34.4%) |
| 65 to 74 Years | 507 (91.8%) | 313 (56.7%) |
| 75 Years and over | 168 (100.0%) | 59 (35.1%) |
| Total | 1,828 (40.7%) | 1,717 (38.2%) |
Disability Status by Sex by Age in Waynesboro
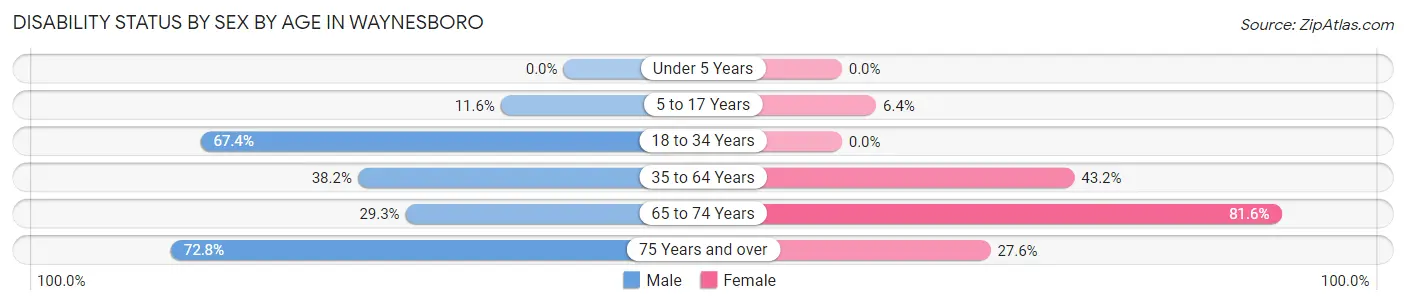
| Age Bracket | Male | Female |
| Under 5 Years | 0 (0.0%) | 0 (0.0%) |
| 5 to 17 Years | 65 (11.6%) | 29 (6.4%) |
| 18 to 34 Years | 297 (67.3%) | 0 (0.0%) |
| 35 to 64 Years | 295 (38.2%) | 411 (43.2%) |
| 65 to 74 Years | 68 (29.3%) | 261 (81.6%) |
| 75 Years and over | 59 (72.8%) | 24 (27.6%) |
Disability Class by Sex by Age in Waynesboro
Disability Class: Hearing Difficulty
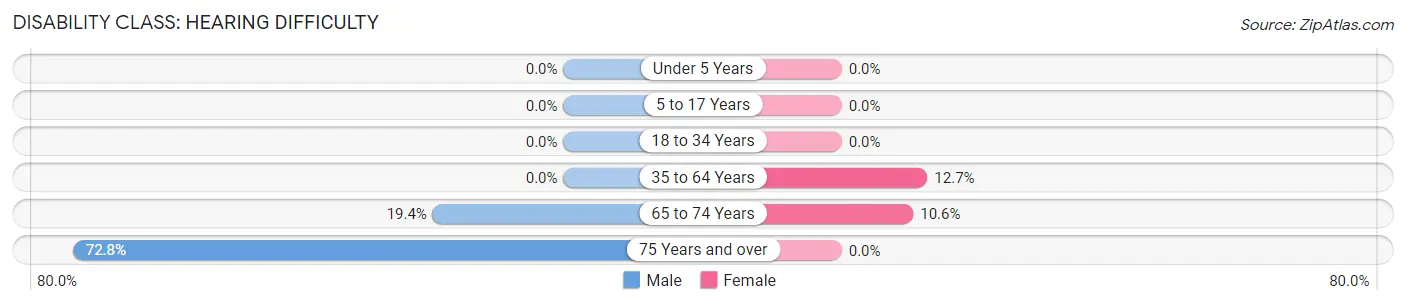
| Age Bracket | Male | Female |
| Under 5 Years | 0 (0.0%) | 0 (0.0%) |
| 5 to 17 Years | 0 (0.0%) | 0 (0.0%) |
| 18 to 34 Years | 0 (0.0%) | 0 (0.0%) |
| 35 to 64 Years | 0 (0.0%) | 121 (12.7%) |
| 65 to 74 Years | 45 (19.4%) | 34 (10.6%) |
| 75 Years and over | 59 (72.8%) | 0 (0.0%) |
Disability Class: Vision Difficulty
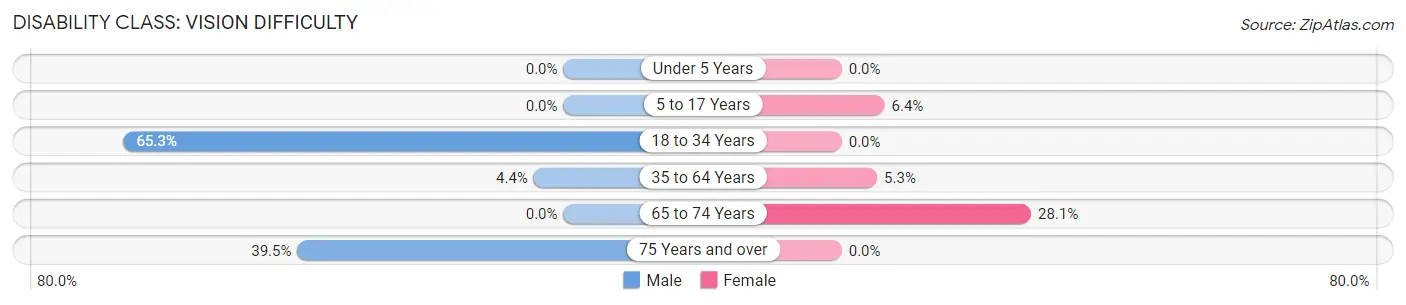
| Age Bracket | Male | Female |
| Under 5 Years | 0 (0.0%) | 0 (0.0%) |
| 5 to 17 Years | 0 (0.0%) | 29 (6.4%) |
| 18 to 34 Years | 288 (65.3%) | 0 (0.0%) |
| 35 to 64 Years | 34 (4.4%) | 50 (5.2%) |
| 65 to 74 Years | 0 (0.0%) | 90 (28.1%) |
| 75 Years and over | 32 (39.5%) | 0 (0.0%) |
Disability Class: Cognitive Difficulty
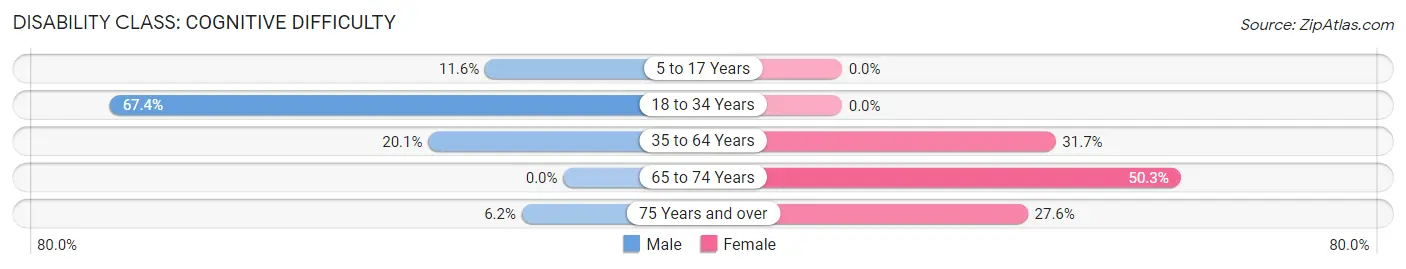
| Age Bracket | Male | Female |
| 5 to 17 Years | 65 (11.6%) | 0 (0.0%) |
| 18 to 34 Years | 297 (67.3%) | 0 (0.0%) |
| 35 to 64 Years | 155 (20.1%) | 302 (31.7%) |
| 65 to 74 Years | 0 (0.0%) | 161 (50.3%) |
| 75 Years and over | 5 (6.2%) | 24 (27.6%) |
Disability Class: Ambulatory Difficulty
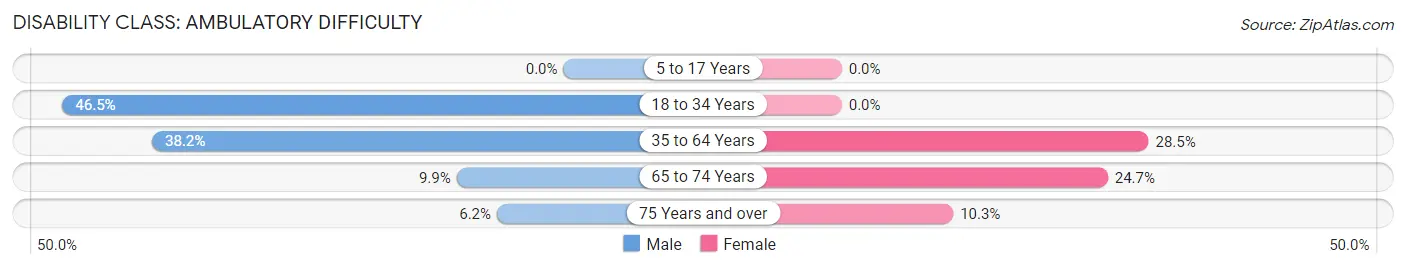
| Age Bracket | Male | Female |
| 5 to 17 Years | 0 (0.0%) | 0 (0.0%) |
| 18 to 34 Years | 205 (46.5%) | 0 (0.0%) |
| 35 to 64 Years | 295 (38.2%) | 271 (28.5%) |
| 65 to 74 Years | 23 (9.9%) | 79 (24.7%) |
| 75 Years and over | 5 (6.2%) | 9 (10.3%) |
Disability Class: Self-Care Difficulty
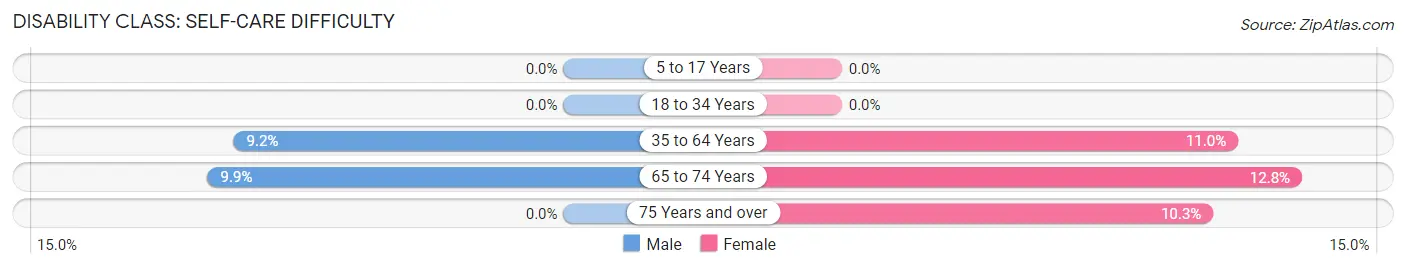
| Age Bracket | Male | Female |
| 5 to 17 Years | 0 (0.0%) | 0 (0.0%) |
| 18 to 34 Years | 0 (0.0%) | 0 (0.0%) |
| 35 to 64 Years | 71 (9.2%) | 105 (11.0%) |
| 65 to 74 Years | 23 (9.9%) | 41 (12.8%) |
| 75 Years and over | 0 (0.0%) | 9 (10.3%) |
Technology Access in Waynesboro
Computing Device Access in Waynesboro
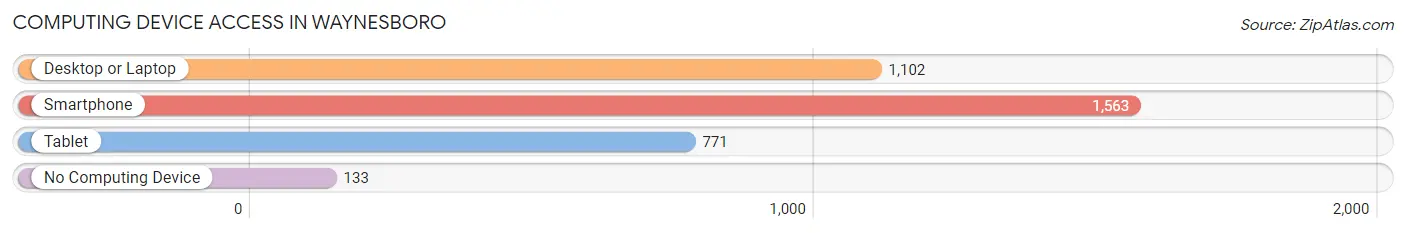
| Device Type | # Households | % Households |
| Desktop or Laptop | 1,102 | 61.6% |
| Smartphone | 1,563 | 87.4% |
| Tablet | 771 | 43.1% |
| No Computing Device | 133 | 7.4% |
| Total | 1,788 | 100.0% |
Internet Access in Waynesboro
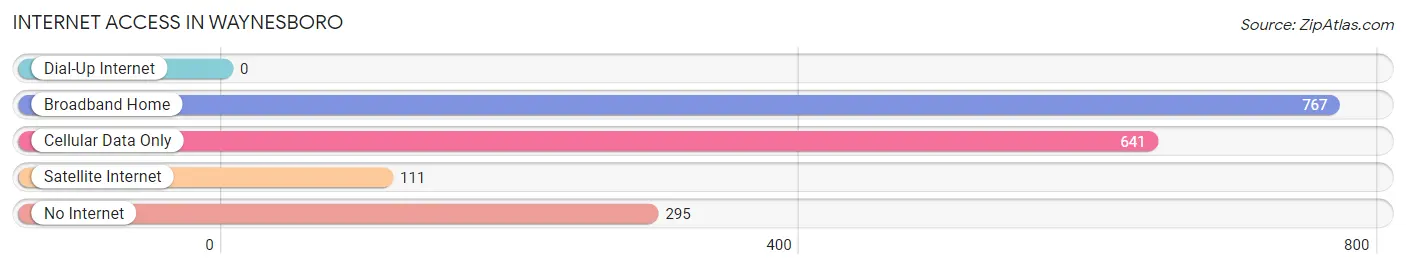
| Internet Type | # Households | % Households |
| Dial-Up Internet | 0 | 0.0% |
| Broadband Home | 767 | 42.9% |
| Cellular Data Only | 641 | 35.8% |
| Satellite Internet | 111 | 6.2% |
| No Internet | 295 | 16.5% |
| Total | 1,788 | 100.0% |
Waynesboro Summary
Waynesboro, Mississippi is a small town located in Wayne County, Mississippi. It is situated in the southeastern corner of the state, approximately 60 miles south of Jackson and 40 miles north of Hattiesburg. The town is located on the banks of the Leaf River and is home to a population of approximately 5,000 people.
History
Waynesboro was founded in 1824 and named after General Anthony Wayne, a Revolutionary War hero. The town was originally a trading post and was the first county seat of Wayne County. In 1837, the town was incorporated and the first mayor was elected.
During the Civil War, Waynesboro was the site of a major battle between Union and Confederate forces. The Battle of Waynesboro was fought on April 6, 1865 and resulted in a Confederate victory.
In the late 19th century, Waynesboro experienced a period of growth and development. The town was home to several businesses, including a cotton gin, a sawmill, and a grist mill. In 1891, the town was connected to the railroad, which further increased its economic activity.
Geography
Waynesboro is located in the southeastern corner of Mississippi, approximately 60 miles south of Jackson and 40 miles north of Hattiesburg. The town is situated on the banks of the Leaf River and is surrounded by rolling hills and forests. The climate in Waynesboro is humid subtropical, with hot, humid summers and mild winters.
Economy
Waynesboro’s economy is largely based on agriculture and manufacturing. The town is home to several large farms, which produce cotton, soybeans, corn, and other crops. The town is also home to several manufacturing companies, including a furniture factory, a paper mill, and a plastics plant.
In addition to agriculture and manufacturing, Waynesboro is home to several small businesses, including restaurants, shops, and other services. The town is also home to a hospital, a library, and a community college.
Demographics
As of the 2010 census, the population of Waynesboro was 5,001. The racial makeup of the town was 57.3% White, 39.3% African American, 0.3% Native American, 0.7% Asian, 0.1% Pacific Islander, 1.2% from other races, and 1.3% from two or more races. Hispanic or Latino of any race were 2.3% of the population.
The median household income in Waynesboro was $30,938, and the median family income was $37,917. The per capita income was $17,845. About 22.3% of families and 25.2% of the population were below the poverty line, including 36.2% of those under age 18 and 16.2% of those age 65 or over.
Common Questions
What is Per Capita Income in Waynesboro?
Per Capita income in Waynesboro is $19,623.
What is the Median Family Income in Waynesboro?
Median Family Income in Waynesboro is $29,903.
What is the Median Household income in Waynesboro?
Median Household Income in Waynesboro is $24,779.
What is Income or Wage Gap in Waynesboro?
Income or Wage Gap in Waynesboro is 30.5%.
Women in Waynesboro earn 69.5 cents for every dollar earned by a man.
What is Inequality or Gini Index in Waynesboro?
Inequality or Gini Index in Waynesboro is 0.56.
What is the Total Population of Waynesboro?
Total Population of Waynesboro is 4,576.
What is the Total Male Population of Waynesboro?
Total Male Population of Waynesboro is 2,284.
What is the Total Female Population of Waynesboro?
Total Female Population of Waynesboro is 2,292.
What is the Ratio of Males per 100 Females in Waynesboro?
There are 99.65 Males per 100 Females in Waynesboro.
What is the Ratio of Females per 100 Males in Waynesboro?
There are 100.35 Females per 100 Males in Waynesboro.
What is the Median Population Age in Waynesboro?
Median Population Age in Waynesboro is 38.1 Years.
What is the Average Family Size in Waynesboro
Average Family Size in Waynesboro is 2.9 People.
What is the Average Household Size in Waynesboro
Average Household Size in Waynesboro is 2.5 People.
How Large is the Labor Force in Waynesboro?
There are 1,288 People in the Labor Forcein in Waynesboro.
What is the Percentage of People in the Labor Force in Waynesboro?
37.2% of People are in the Labor Force in Waynesboro.
What is the Unemployment Rate in Waynesboro?
Unemployment Rate in Waynesboro is 5.2%.