Cities with the Most Immigrants from South Eastern Asia in Mississippi
RELATED REPORTS & OPTIONS
South Eastern Asia
Mississippi
Compare Cities
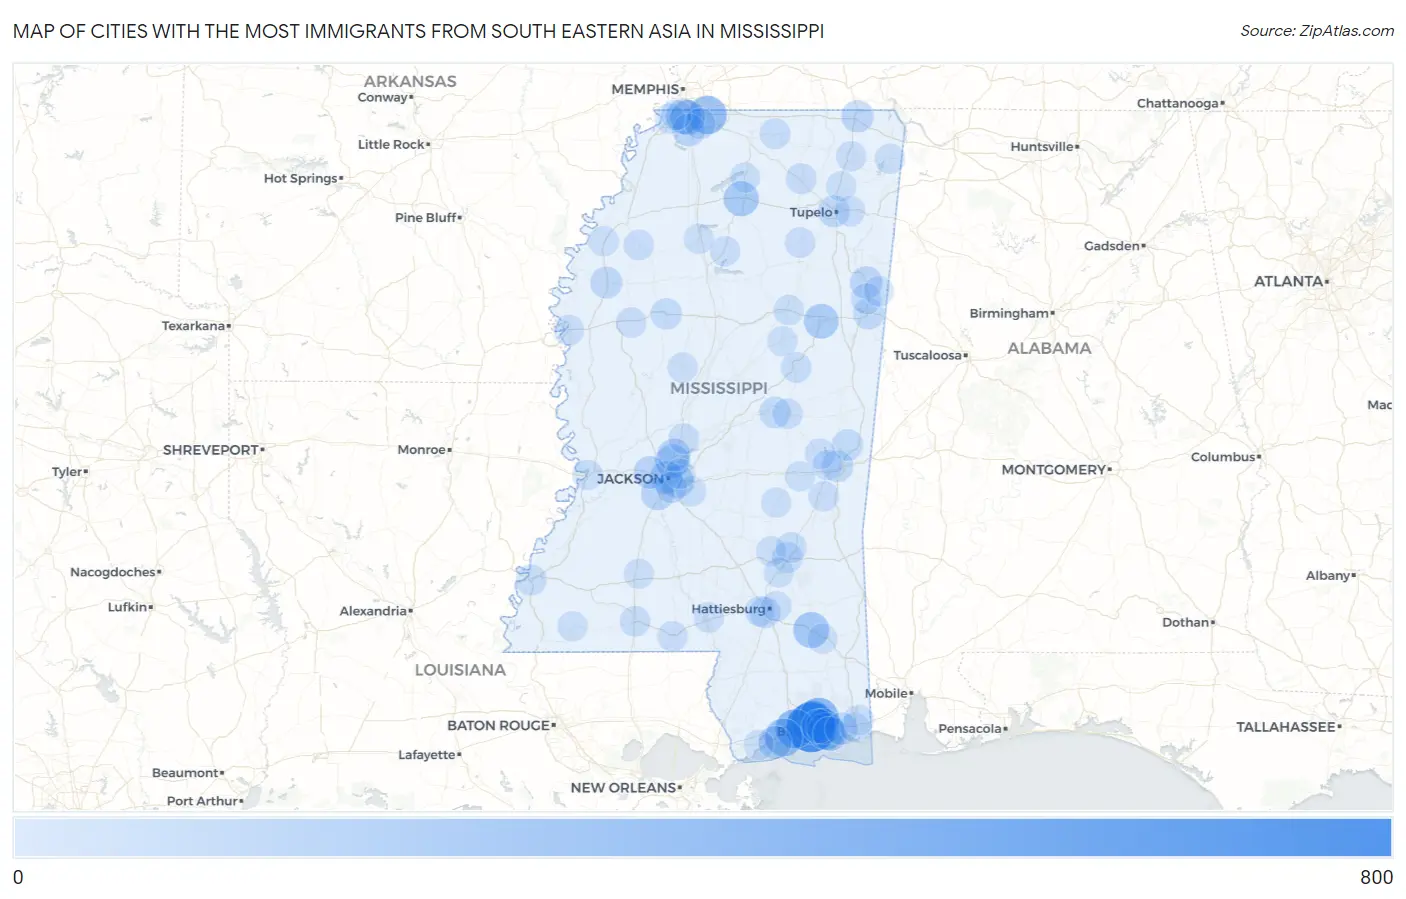
Map of Cities with the Most Immigrants from South Eastern Asia in Mississippi
0
800
Cities with the Most Immigrants from South Eastern Asia in Mississippi
| City | South Eastern Asia | vs State | vs National | |
| 1. | Biloxi | 721 | 8,511(8.47%)#1 | 4,292,058(0.02%)#799 |
| 2. | D Iberville | 473 | 8,511(5.56%)#2 | 4,292,058(0.01%)#1,068 |
| 3. | Latimer | 346 | 8,511(4.07%)#3 | 4,292,058(0.01%)#1,391 |
| 4. | Gulfport | 320 | 8,511(3.76%)#4 | 4,292,058(0.01%)#1,471 |
| 5. | Olive Branch | 303 | 8,511(3.56%)#5 | 4,292,058(0.01%)#1,531 |
| 6. | Long Beach | 276 | 8,511(3.24%)#6 | 4,292,058(0.01%)#1,636 |
| 7. | Ocean Springs | 252 | 8,511(2.96%)#7 | 4,292,058(0.01%)#1,730 |
| 8. | Beaumont | 206 | 8,511(2.42%)#8 | 4,292,058(0.00%)#1,981 |
| 9. | Gulf Hills | 194 | 8,511(2.28%)#9 | 4,292,058(0.00%)#2,064 |
| 10. | Oxford | 180 | 8,511(2.11%)#10 | 4,292,058(0.00%)#2,155 |
| 11. | Horn Lake | 170 | 8,511(2.00%)#11 | 4,292,058(0.00%)#2,237 |
| 12. | Southaven | 169 | 8,511(1.99%)#12 | 4,292,058(0.00%)#2,244 |
| 13. | Starkville | 165 | 8,511(1.94%)#13 | 4,292,058(0.00%)#2,287 |
| 14. | St Martin | 149 | 8,511(1.75%)#14 | 4,292,058(0.00%)#2,461 |
| 15. | Gulf Park Estates | 146 | 8,511(1.72%)#15 | 4,292,058(0.00%)#2,496 |
| 16. | Ridgeland | 129 | 8,511(1.52%)#16 | 4,292,058(0.00%)#2,697 |
| 17. | Pearl | 110 | 8,511(1.29%)#17 | 4,292,058(0.00%)#2,950 |
| 18. | Pass Christian | 105 | 8,511(1.23%)#18 | 4,292,058(0.00%)#3,037 |
| 19. | Jackson | 104 | 8,511(1.22%)#19 | 4,292,058(0.00%)#3,041 |
| 20. | Madison | 101 | 8,511(1.19%)#20 | 4,292,058(0.00%)#3,098 |
| 21. | Byram | 100 | 8,511(1.17%)#21 | 4,292,058(0.00%)#3,118 |
| 22. | Clinton | 93 | 8,511(1.09%)#22 | 4,292,058(0.00%)#3,228 |
| 23. | Hernando | 87 | 8,511(1.02%)#23 | 4,292,058(0.00%)#3,328 |
| 24. | Gautier | 85 | 8,511(1.00%)#24 | 4,292,058(0.00%)#3,377 |
| 25. | New Hamilton | 80 | 8,511(0.94%)#25 | 4,292,058(0.00%)#3,487 |
| 26. | Corinth | 78 | 8,511(0.92%)#26 | 4,292,058(0.00%)#3,522 |
| 27. | Tupelo | 62 | 8,511(0.73%)#27 | 4,292,058(0.00%)#3,877 |
| 28. | Cleveland | 57 | 8,511(0.67%)#28 | 4,292,058(0.00%)#4,011 |
| 29. | Meridian | 53 | 8,511(0.62%)#29 | 4,292,058(0.00%)#4,138 |
| 30. | Pearl River | 46 | 8,511(0.54%)#30 | 4,292,058(0.00%)#4,440 |
| 31. | Columbus | 45 | 8,511(0.53%)#31 | 4,292,058(0.00%)#4,451 |
| 32. | Meridian Station | 44 | 8,511(0.52%)#32 | 4,292,058(0.00%)#4,545 |
| 33. | Greenwood | 41 | 8,511(0.48%)#33 | 4,292,058(0.00%)#4,648 |
| 34. | Hattiesburg | 40 | 8,511(0.47%)#34 | 4,292,058(0.00%)#4,703 |
| 35. | Richland | 40 | 8,511(0.47%)#35 | 4,292,058(0.00%)#4,729 |
| 36. | Bridgetown | 31 | 8,511(0.36%)#36 | 4,292,058(0.00%)#5,235 |
| 37. | Columbus Afb | 25 | 8,511(0.29%)#37 | 4,292,058(0.00%)#5,692 |
| 38. | Laurel | 23 | 8,511(0.27%)#38 | 4,292,058(0.00%)#5,782 |
| 39. | New Albany | 23 | 8,511(0.27%)#39 | 4,292,058(0.00%)#5,803 |
| 40. | Natchez | 22 | 8,511(0.26%)#40 | 4,292,058(0.00%)#5,860 |
| 41. | Snow Lake Shores | 21 | 8,511(0.25%)#41 | 4,292,058(0.00%)#6,041 |
| 42. | Canton | 20 | 8,511(0.23%)#42 | 4,292,058(0.00%)#6,053 |
| 43. | Louisville | 19 | 8,511(0.22%)#43 | 4,292,058(0.00%)#6,156 |
| 44. | Mccomb | 18 | 8,511(0.21%)#44 | 4,292,058(0.00%)#6,242 |
| 45. | Sharon | 18 | 8,511(0.21%)#45 | 4,292,058(0.00%)#6,290 |
| 46. | Collinsville | 14 | 8,511(0.16%)#46 | 4,292,058(0.00%)#6,769 |
| 47. | Greenville | 13 | 8,511(0.15%)#47 | 4,292,058(0.00%)#6,805 |
| 48. | Tutwiler | 13 | 8,511(0.15%)#48 | 4,292,058(0.00%)#6,904 |
| 49. | Enterprise | 13 | 8,511(0.15%)#49 | 4,292,058(0.00%)#6,946 |
| 50. | Philadelphia | 12 | 8,511(0.14%)#50 | 4,292,058(0.00%)#6,994 |
| 51. | New Houlka | 12 | 8,511(0.14%)#51 | 4,292,058(0.00%)#7,102 |
| 52. | Vicksburg | 11 | 8,511(0.13%)#52 | 4,292,058(0.00%)#7,118 |
| 53. | Booneville | 11 | 8,511(0.13%)#53 | 4,292,058(0.00%)#7,139 |
| 54. | West Hattiesburg | 11 | 8,511(0.13%)#54 | 4,292,058(0.00%)#7,151 |
| 55. | Tylertown | 10 | 8,511(0.12%)#55 | 4,292,058(0.00%)#7,398 |
| 56. | Walls | 10 | 8,511(0.12%)#56 | 4,292,058(0.00%)#7,425 |
| 57. | Petal | 9 | 8,511(0.11%)#57 | 4,292,058(0.00%)#7,492 |
| 58. | Columbia | 9 | 8,511(0.11%)#58 | 4,292,058(0.00%)#7,524 |
| 59. | Lynchburg | 9 | 8,511(0.11%)#59 | 4,292,058(0.00%)#7,608 |
| 60. | Moorhead | 9 | 8,511(0.11%)#60 | 4,292,058(0.00%)#7,623 |
| 61. | Coffeeville | 9 | 8,511(0.11%)#61 | 4,292,058(0.00%)#7,650 |
| 62. | Nellieburg | 8 | 8,511(0.09%)#62 | 4,292,058(0.00%)#7,823 |
| 63. | Mathiston | 8 | 8,511(0.09%)#63 | 4,292,058(0.00%)#7,843 |
| 64. | Helena | 8 | 8,511(0.09%)#64 | 4,292,058(0.00%)#7,857 |
| 65. | Mooreville | 7 | 8,511(0.08%)#65 | 4,292,058(0.00%)#7,994 |
| 66. | Robinhood | 7 | 8,511(0.08%)#66 | 4,292,058(0.00%)#8,024 |
| 67. | Moss Point | 6 | 8,511(0.07%)#67 | 4,292,058(0.00%)#8,133 |
| 68. | Flowood | 6 | 8,511(0.07%)#68 | 4,292,058(0.00%)#8,141 |
| 69. | Abbeville | 6 | 8,511(0.07%)#69 | 4,292,058(0.00%)#8,363 |
| 70. | Duncan | 6 | 8,511(0.07%)#70 | 4,292,058(0.00%)#8,368 |
| 71. | Waveland | 4 | 8,511(0.05%)#71 | 4,292,058(0.00%)#8,657 |
| 72. | Guntown | 4 | 8,511(0.05%)#72 | 4,292,058(0.00%)#8,719 |
| 73. | Gloster | 4 | 8,511(0.05%)#73 | 4,292,058(0.00%)#8,785 |
| 74. | Caledonia | 4 | 8,511(0.05%)#74 | 4,292,058(0.00%)#8,797 |
| 75. | Oakland | 4 | 8,511(0.05%)#75 | 4,292,058(0.00%)#8,918 |
| 76. | Ellisville | 3 | 8,511(0.04%)#76 | 4,292,058(0.00%)#8,981 |
| 77. | Lexington | 3 | 8,511(0.04%)#77 | 4,292,058(0.00%)#9,111 |
| 78. | Soso | 3 | 8,511(0.04%)#78 | 4,292,058(0.00%)#9,233 |
| 79. | Brookhaven | 2 | 8,511(0.02%)#79 | 4,292,058(0.00%)#9,325 |
| 80. | Ackerman | 2 | 8,511(0.02%)#80 | 4,292,058(0.00%)#9,389 |
| 81. | Tishomingo | 2 | 8,511(0.02%)#81 | 4,292,058(0.00%)#9,557 |
| 82. | Montrose | 2 | 8,511(0.02%)#82 | 4,292,058(0.00%)#9,697 |
| 83. | Hickory | 1 | 8,511(0.01%)#83 | 4,292,058(0.00%)#9,909 |
| 84. | Mclain | 1 | 8,511(0.01%)#84 | 4,292,058(0.00%)#9,945 |
Common Questions
What are the Top 10 Cities with the Most Immigrants from South Eastern Asia in Mississippi?
Top 10 Cities with the Most Immigrants from South Eastern Asia in Mississippi are:
#1
721
#2
473
#3
346
#4
320
#5
303
#6
276
#7
252
#8
206
#9
194
#10
180
What city has the Most Immigrants from South Eastern Asia in Mississippi?
Biloxi has the Most Immigrants from South Eastern Asia in Mississippi with 721.
What is the Total Immigrants from South Eastern Asia in the State of Mississippi?
Total Immigrants from South Eastern Asia in Mississippi is 8,511.
What is the Total Immigrants from South Eastern Asia in the United States?
Total Immigrants from South Eastern Asia in the United States is 4,292,058.