Mayersville, MS Map & Demographics
Mayersville Map
Mayersville Overview
$10,105
PER CAPITA INCOME
$11,660
AVG HOUSEHOLD INCOME
0.48
INEQUALITY / GINI INDEX
242
TOTAL POPULATION
115
MALE POPULATION
127
FEMALE POPULATION
90.55
MALES / 100 FEMALES
110.43
FEMALES / 100 MALES
43.5
MEDIAN AGE
4.9
AVG FAMILY SIZE
1.9
AVG HOUSEHOLD SIZE
46
LABOR FORCE [ PEOPLE ]
22.2%
PERCENT IN LABOR FORCE
54.3%
UNEMPLOYMENT RATE
Mayersville Zip Codes
Mayersville Area Codes
Income in Mayersville
Income Overview in Mayersville
| Characteristic | Number | Measure |
| Per Capita Income | 242 | $10,105 |
| Median Family Income | 27 | $0 |
| Mean Family Income | 27 | $39,930 |
| Median Household Income | 125 | $11,660 |
| Mean Household Income | 125 | $17,297 |
| Income Deficit | 27 | $0 |
| Wage / Income Gap (%) | 242 | 0.00% |
| Wage / Income Gap ($) | 242 | 100.00¢ per $1 |
| Gini / Inequality Index | 242 | 0.48 |
Earnings by Sex in Mayersville
| Sex | Number | Average Earnings |
| Male | 10 (23.8%) | $0 |
| Female | 32 (76.2%) | $0 |
| Total | 42 (100.0%) | $0 |
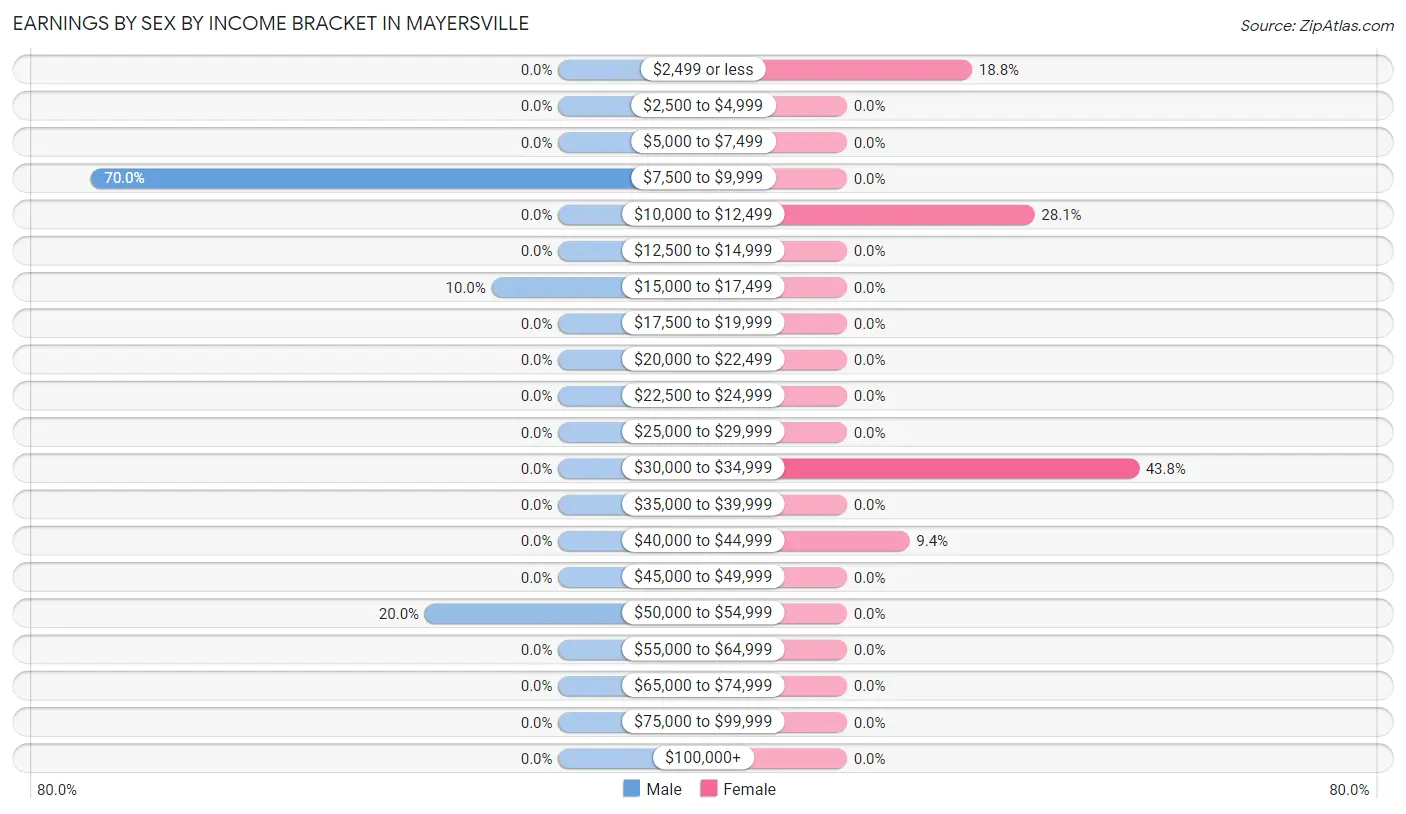
Earnings by Sex by Income Bracket in Mayersville
The most common earnings brackets in Mayersville are $7,500 to $9,999 for men (7 | 70.0%) and $30,000 to $34,999 for women (14 | 43.8%).
| Income | Male | Female |
| $2,499 or less | 0 (0.0%) | 6 (18.8%) |
| $2,500 to $4,999 | 0 (0.0%) | 0 (0.0%) |
| $5,000 to $7,499 | 0 (0.0%) | 0 (0.0%) |
| $7,500 to $9,999 | 7 (70.0%) | 0 (0.0%) |
| $10,000 to $12,499 | 0 (0.0%) | 9 (28.1%) |
| $12,500 to $14,999 | 0 (0.0%) | 0 (0.0%) |
| $15,000 to $17,499 | 1 (10.0%) | 0 (0.0%) |
| $17,500 to $19,999 | 0 (0.0%) | 0 (0.0%) |
| $20,000 to $22,499 | 0 (0.0%) | 0 (0.0%) |
| $22,500 to $24,999 | 0 (0.0%) | 0 (0.0%) |
| $25,000 to $29,999 | 0 (0.0%) | 0 (0.0%) |
| $30,000 to $34,999 | 0 (0.0%) | 14 (43.8%) |
| $35,000 to $39,999 | 0 (0.0%) | 0 (0.0%) |
| $40,000 to $44,999 | 0 (0.0%) | 3 (9.4%) |
| $45,000 to $49,999 | 0 (0.0%) | 0 (0.0%) |
| $50,000 to $54,999 | 2 (20.0%) | 0 (0.0%) |
| $55,000 to $64,999 | 0 (0.0%) | 0 (0.0%) |
| $65,000 to $74,999 | 0 (0.0%) | 0 (0.0%) |
| $75,000 to $99,999 | 0 (0.0%) | 0 (0.0%) |
| $100,000+ | 0 (0.0%) | 0 (0.0%) |
| Total | 10 (100.0%) | 32 (100.0%) |
Earnings by Sex by Educational Attainment in Mayersville
| Educational Attainment | Male Income | Female Income |
| Less than High School | - | - |
| High School Diploma | - | - |
| College or Associate's Degree | - | - |
| Bachelor's Degree | - | - |
| Graduate Degree | - | - |
| Total | - | - |
Family Income in Mayersville
Family Income Brackets in Mayersville
According to the Mayersville family income data, there are 11 families falling into the $15,000 to $24,999 income range, which is the most common income bracket and makes up 40.7% of all families.
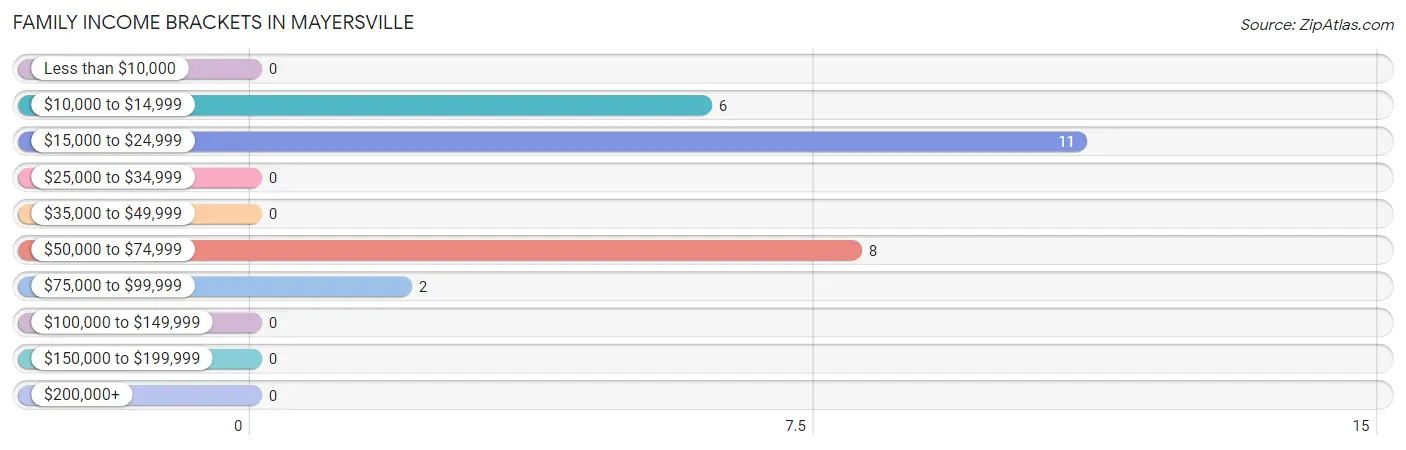
| Income Bracket | # Families | % Families |
| Less than $10,000 | 0 | 0.0% |
| $10,000 to $14,999 | 6 | 22.2% |
| $15,000 to $24,999 | 11 | 40.7% |
| $25,000 to $34,999 | 0 | 0.0% |
| $35,000 to $49,999 | 0 | 0.0% |
| $50,000 to $74,999 | 8 | 29.6% |
| $75,000 to $99,999 | 2 | 7.4% |
| $100,000 to $149,999 | 0 | 0.0% |
| $150,000 to $199,999 | 0 | 0.0% |
| $200,000+ | 0 | 0.0% |
Family Income by Famaliy Size in Mayersville
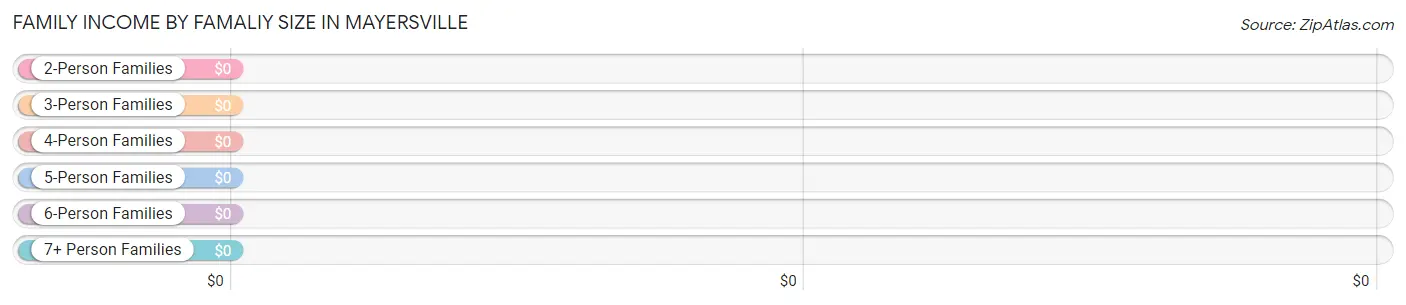
| Income Bracket | # Families | Median Income |
| 2-Person Families | 13 (48.1%) | $0 |
| 3-Person Families | 0 (0.0%) | $0 |
| 4-Person Families | 6 (22.2%) | $0 |
| 5-Person Families | 0 (0.0%) | $0 |
| 6-Person Families | 0 (0.0%) | $0 |
| 7+ Person Families | 8 (29.6%) | $0 |
| Total | 27 (100.0%) | $0 |
Family Income by Number of Earners in Mayersville
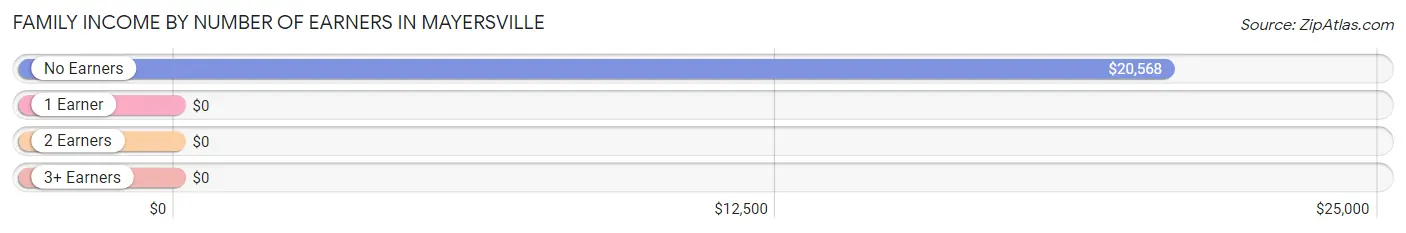
| Number of Earners | # Families | Median Income |
| No Earners | 17 (63.0%) | $20,568 |
| 1 Earner | 0 (0.0%) | $0 |
| 2 Earners | 2 (7.4%) | $0 |
| 3+ Earners | 8 (29.6%) | $0 |
| Total | 27 (100.0%) | $0 |
Household Income in Mayersville
Household Income Brackets in Mayersville
With 64 households falling in the category, the $10,000 to $14,999 income range is the most frequent in Mayersville, accounting for 51.2% of all households.
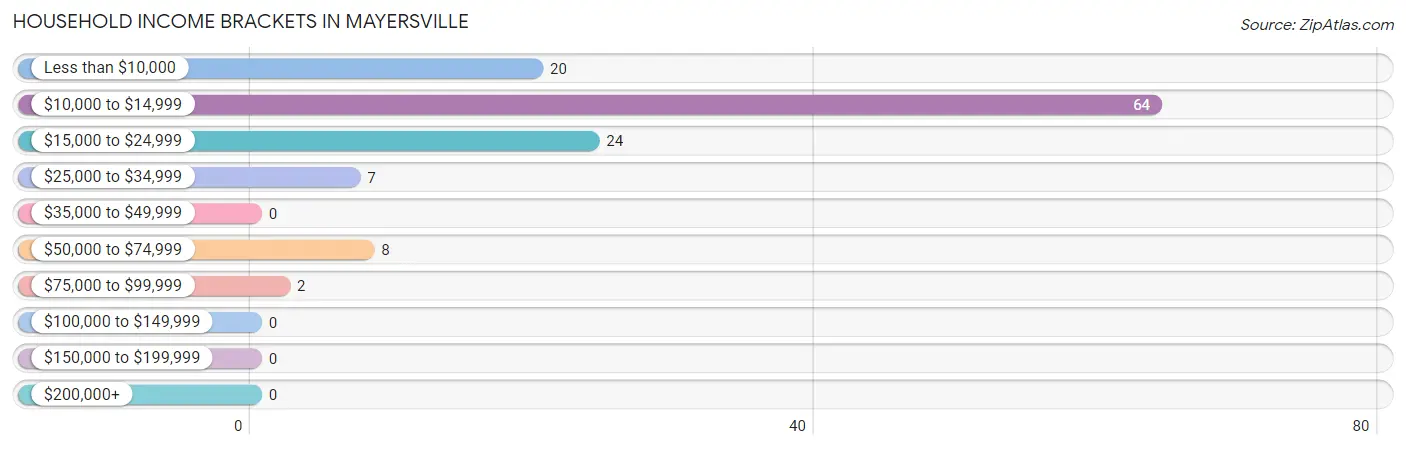
| Income Bracket | # Households | % Households |
| Less than $10,000 | 20 | 16.0% |
| $10,000 to $14,999 | 64 | 51.2% |
| $15,000 to $24,999 | 24 | 19.2% |
| $25,000 to $34,999 | 7 | 5.6% |
| $35,000 to $49,999 | 0 | 0.0% |
| $50,000 to $74,999 | 8 | 6.4% |
| $75,000 to $99,999 | 2 | 1.6% |
| $100,000 to $149,999 | 0 | 0.0% |
| $150,000 to $199,999 | 0 | 0.0% |
| $200,000+ | 0 | 0.0% |
Household Income by Householder Age in Mayersville
The median household income in Mayersville is $11,660, with the highest median household income of $15,417 found in the 65+ years age bracket for the primary householder. A total of 38 households (30.4%) fall into this category.
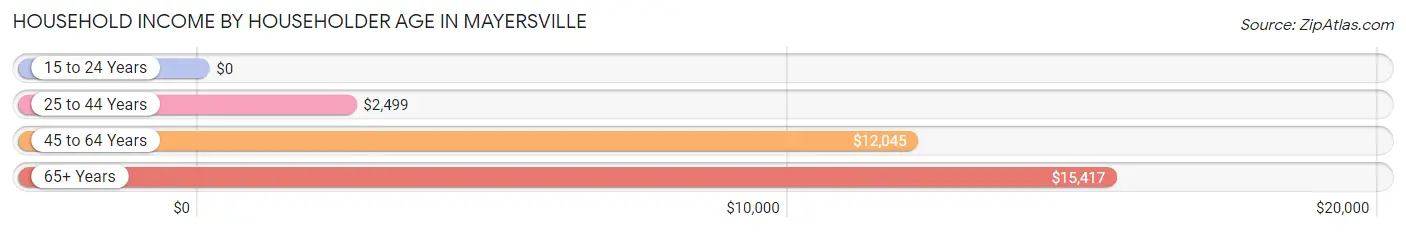
| Income Bracket | # Households | Median Income |
| 15 to 24 Years | 0 (0.0%) | $0 |
| 25 to 44 Years | 33 (26.4%) | $2,499 |
| 45 to 64 Years | 54 (43.2%) | $12,045 |
| 65+ Years | 38 (30.4%) | $15,417 |
| Total | 125 (100.0%) | $11,660 |
Poverty in Mayersville
Income Below Poverty by Sex and Age in Mayersville
With 75.6% poverty level for males and 28.3% for females among the residents of Mayersville, under 5 year old males and 15 year old females are the most vulnerable to poverty, with 6 males (100.0%) and 1 females (100.0%) in their respective age groups living below the poverty level.
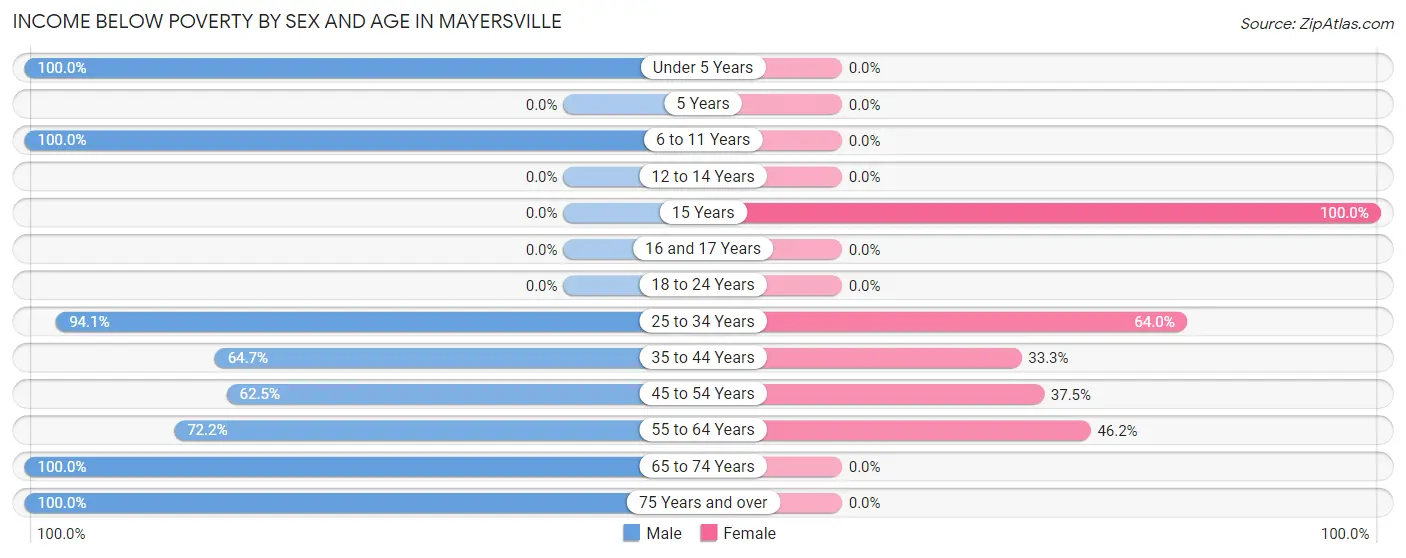
| Age Bracket | Male | Female |
| Under 5 Years | 6 (100.0%) | 0 (0.0%) |
| 5 Years | 0 (0.0%) | 0 (0.0%) |
| 6 to 11 Years | 8 (100.0%) | 0 (0.0%) |
| 12 to 14 Years | 0 (0.0%) | 0 (0.0%) |
| 15 Years | 0 (0.0%) | 1 (100.0%) |
| 16 and 17 Years | 0 (0.0%) | 0 (0.0%) |
| 18 to 24 Years | 0 (0.0%) | 0 (0.0%) |
| 25 to 34 Years | 16 (94.1%) | 16 (64.0%) |
| 35 to 44 Years | 11 (64.7%) | 7 (33.3%) |
| 45 to 54 Years | 15 (62.5%) | 6 (37.5%) |
| 55 to 64 Years | 13 (72.2%) | 6 (46.2%) |
| 65 to 74 Years | 5 (100.0%) | 0 (0.0%) |
| 75 Years and over | 13 (100.0%) | 0 (0.0%) |
| Total | 87 (75.6%) | 36 (28.3%) |
Income Above Poverty by Sex and Age in Mayersville
According to the poverty statistics in Mayersville, males aged 16 and 17 years and females aged 6 to 11 years are the age groups that are most secure financially, with 100.0% of males and 100.0% of females in these age groups living above the poverty line.
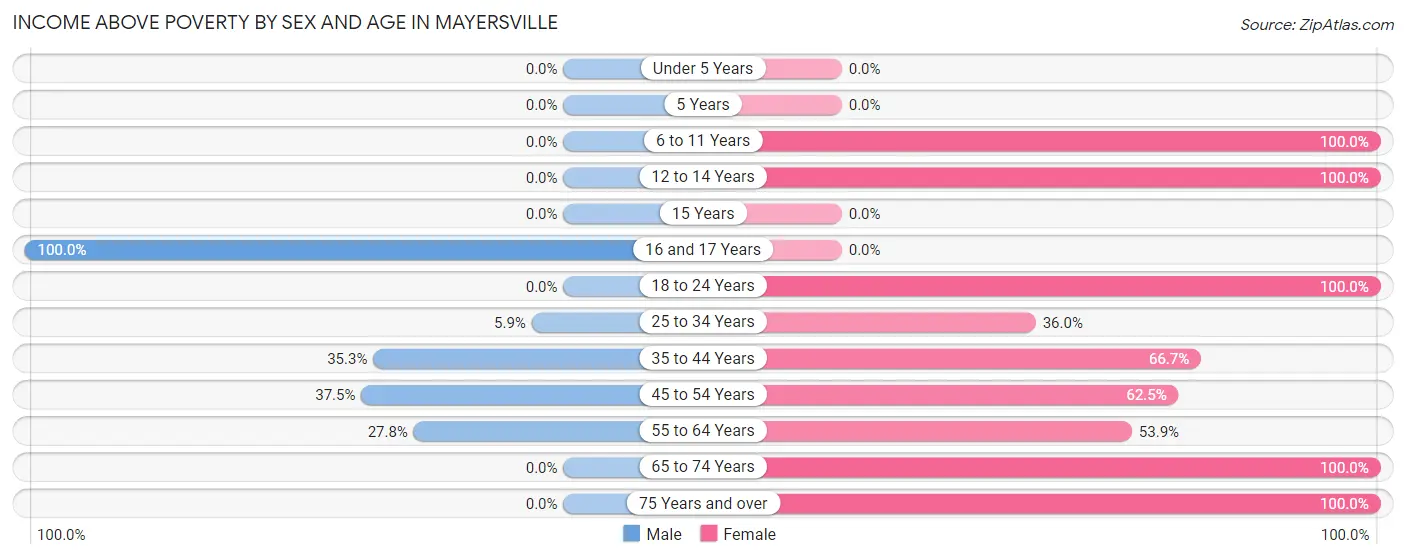
| Age Bracket | Male | Female |
| Under 5 Years | 0 (0.0%) | 0 (0.0%) |
| 5 Years | 0 (0.0%) | 0 (0.0%) |
| 6 to 11 Years | 0 (0.0%) | 10 (100.0%) |
| 12 to 14 Years | 0 (0.0%) | 10 (100.0%) |
| 15 Years | 0 (0.0%) | 0 (0.0%) |
| 16 and 17 Years | 7 (100.0%) | 0 (0.0%) |
| 18 to 24 Years | 0 (0.0%) | 11 (100.0%) |
| 25 to 34 Years | 1 (5.9%) | 9 (36.0%) |
| 35 to 44 Years | 6 (35.3%) | 14 (66.7%) |
| 45 to 54 Years | 9 (37.5%) | 10 (62.5%) |
| 55 to 64 Years | 5 (27.8%) | 7 (53.8%) |
| 65 to 74 Years | 0 (0.0%) | 14 (100.0%) |
| 75 Years and over | 0 (0.0%) | 6 (100.0%) |
| Total | 28 (24.3%) | 91 (71.7%) |
Income Below Poverty Among Married-Couple Families in Mayersville
The poverty statistics for married-couple families in Mayersville show that 75.0% or 6 of the total 8 families live below the poverty line. Families with 1 or 2 children have the highest poverty rate of 100.0%, comprising of 6 families. On the other hand, families with no children have the lowest poverty rate of 0.0%, which includes 0 families.
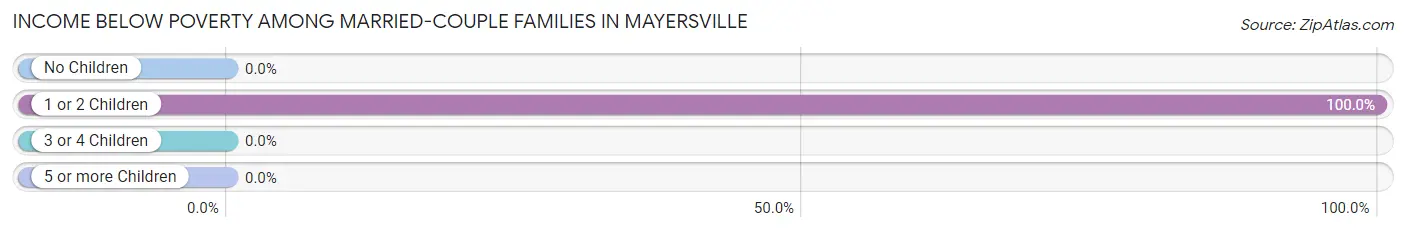
| Children | Above Poverty | Below Poverty |
| No Children | 2 (100.0%) | 0 (0.0%) |
| 1 or 2 Children | 0 (0.0%) | 6 (100.0%) |
| 3 or 4 Children | 0 (0.0%) | 0 (0.0%) |
| 5 or more Children | 0 (0.0%) | 0 (0.0%) |
| Total | 2 (25.0%) | 6 (75.0%) |
Income Below Poverty Among Single-Parent Households in Mayersville
| Children | Single Father | Single Mother |
| No Children | 0 (0.0%) | 0 (0.0%) |
| 1 or 2 Children | 0 (0.0%) | 0 (0.0%) |
| 3 or 4 Children | 0 (0.0%) | 0 (0.0%) |
| 5 or more Children | 0 (0.0%) | 0 (0.0%) |
| Total | 0 (0.0%) | 0 (0.0%) |
Income Below Poverty Among Married-Couple vs Single-Parent Households in Mayersville
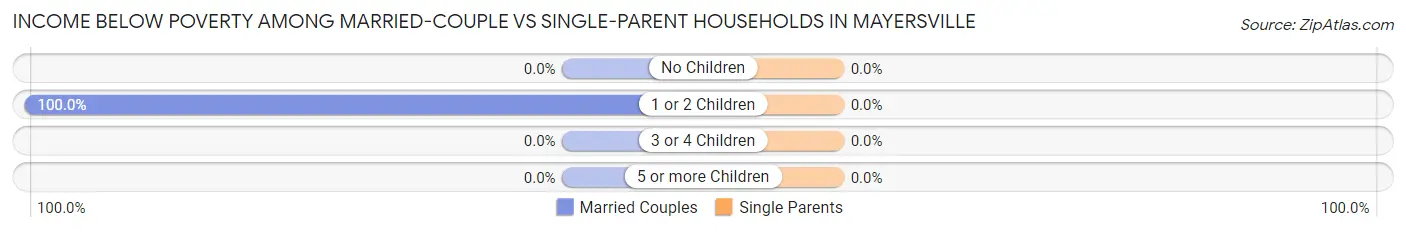
| Children | Married-Couple Families | Single-Parent Households |
| No Children | 0 (0.0%) | 0 (0.0%) |
| 1 or 2 Children | 6 (100.0%) | 0 (0.0%) |
| 3 or 4 Children | 0 (0.0%) | 0 (0.0%) |
| 5 or more Children | 0 (0.0%) | 0 (0.0%) |
| Total | 6 (75.0%) | 0 (0.0%) |
Race in Mayersville
The most populous races in Mayersville are Black / African American (233 | 96.3%), White / Caucasian (8 | 3.3%), and Two or more Races (1 | 0.4%).
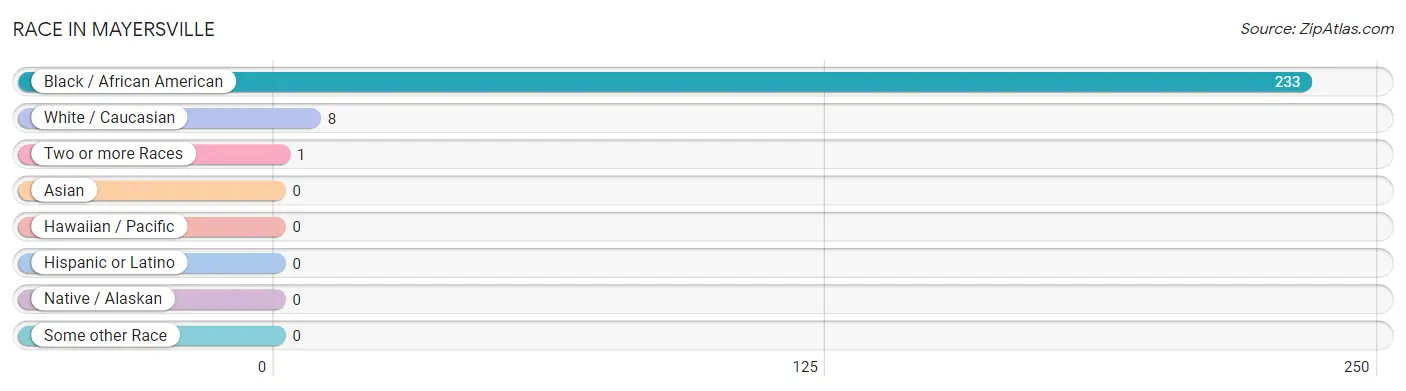
| Race | # Population | % Population |
| Asian | 0 | 0.0% |
| Black / African American | 233 | 96.3% |
| Hawaiian / Pacific | 0 | 0.0% |
| Hispanic or Latino | 0 | 0.0% |
| Native / Alaskan | 0 | 0.0% |
| White / Caucasian | 8 | 3.3% |
| Two or more Races | 1 | 0.4% |
| Some other Race | 0 | 0.0% |
| Total | 242 | 100.0% |
Ancestry in Mayersville
The most populous ancestries reported in Mayersville are , and American (11 | 4.5%), together accounting for 4.5% of all Mayersville residents.

| Ancestry | # Population | % Population |
| American | 11 | 4.5% | View All 1 Rows |
Immigrants in Mayersville

| Immigration Origin | # Population | % Population | View All 0 Rows |
Sex and Age in Mayersville
Sex and Age in Mayersville
The most populous age groups in Mayersville are 25 to 29 Years (17 | 14.8%) for men and 40 to 44 Years (21 | 16.5%) for women.
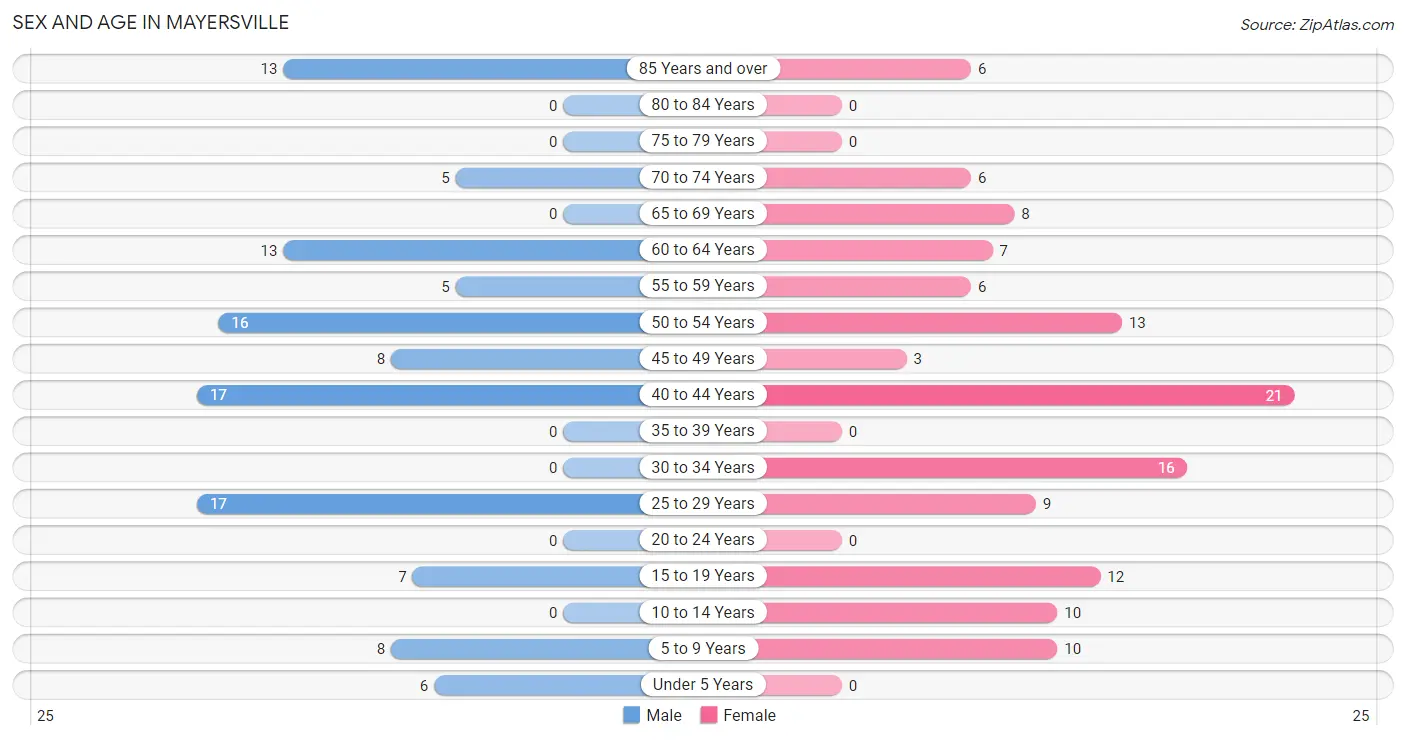
| Age Bracket | Male | Female |
| Under 5 Years | 6 (5.2%) | 0 (0.0%) |
| 5 to 9 Years | 8 (7.0%) | 10 (7.9%) |
| 10 to 14 Years | 0 (0.0%) | 10 (7.9%) |
| 15 to 19 Years | 7 (6.1%) | 12 (9.5%) |
| 20 to 24 Years | 0 (0.0%) | 0 (0.0%) |
| 25 to 29 Years | 17 (14.8%) | 9 (7.1%) |
| 30 to 34 Years | 0 (0.0%) | 16 (12.6%) |
| 35 to 39 Years | 0 (0.0%) | 0 (0.0%) |
| 40 to 44 Years | 17 (14.8%) | 21 (16.5%) |
| 45 to 49 Years | 8 (7.0%) | 3 (2.4%) |
| 50 to 54 Years | 16 (13.9%) | 13 (10.2%) |
| 55 to 59 Years | 5 (4.3%) | 6 (4.7%) |
| 60 to 64 Years | 13 (11.3%) | 7 (5.5%) |
| 65 to 69 Years | 0 (0.0%) | 8 (6.3%) |
| 70 to 74 Years | 5 (4.3%) | 6 (4.7%) |
| 75 to 79 Years | 0 (0.0%) | 0 (0.0%) |
| 80 to 84 Years | 0 (0.0%) | 0 (0.0%) |
| 85 Years and over | 13 (11.3%) | 6 (4.7%) |
| Total | 115 (100.0%) | 127 (100.0%) |
Families and Households in Mayersville
Median Family Size in Mayersville
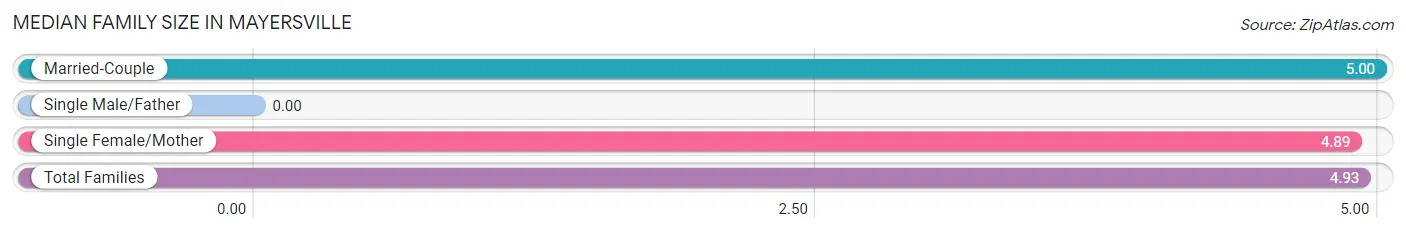
| Family Type | # Families | Family Size |
| Married-Couple | 8 (29.6%) | 5.00 |
| Single Male/Father | 0 (0.0%) | - |
| Single Female/Mother | 19 (70.4%) | 4.89 |
| Total Families | 27 (100.0%) | 4.93 |
Median Household Size in Mayersville
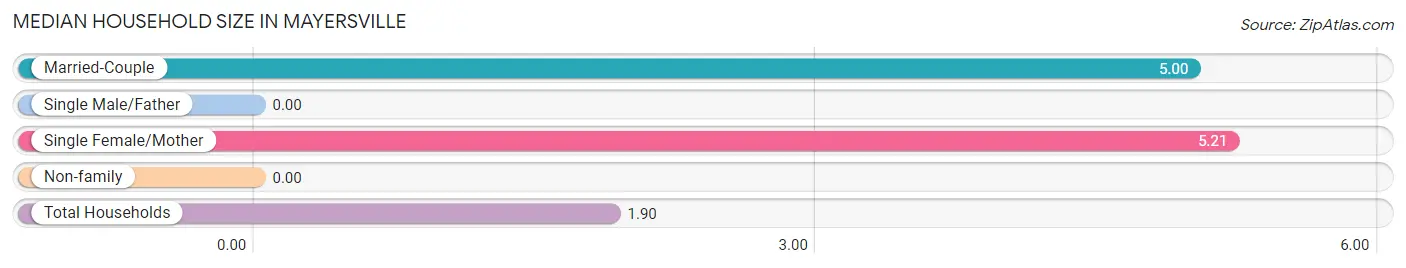
| Household Type | # Households | Household Size |
| Married-Couple | 8 (6.4%) | 5.00 |
| Single Male/Father | 0 (0.0%) | - |
| Single Female/Mother | 19 (15.2%) | 5.21 |
| Non-family | 98 (78.4%) | - |
| Total Households | 125 (100.0%) | 1.90 |
Household Size by Marriage Status in Mayersville
Out of a total of 125 households in Mayersville, 27 (21.6%) are family households, while 98 (78.4%) are nonfamily households. The most numerous type of family households are 7+ person households, comprising 8, and the most common type of nonfamily households are 1-person households, comprising 98.
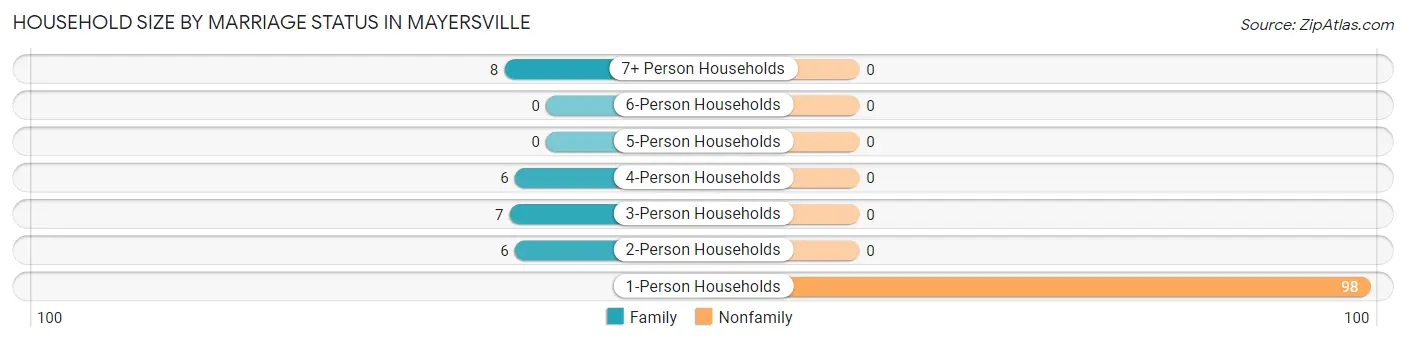
| Household Size | Family Households | Nonfamily Households |
| 1-Person Households | - | 98 (78.4%) |
| 2-Person Households | 6 (4.8%) | 0 (0.0%) |
| 3-Person Households | 7 (5.6%) | 0 (0.0%) |
| 4-Person Households | 6 (4.8%) | 0 (0.0%) |
| 5-Person Households | 0 (0.0%) | 0 (0.0%) |
| 6-Person Households | 0 (0.0%) | 0 (0.0%) |
| 7+ Person Households | 8 (6.4%) | 0 (0.0%) |
| Total | 27 (21.6%) | 98 (78.4%) |
Female Fertility in Mayersville
Fertility by Age in Mayersville
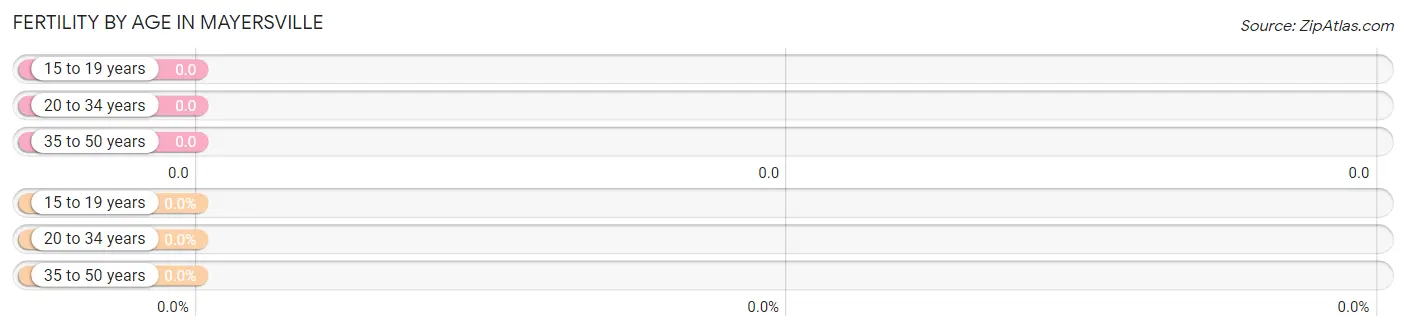
| Age Bracket | Women with Births | Births / 1,000 Women |
| 15 to 19 years | 0 (0.0%) | 0.0 |
| 20 to 34 years | 0 (0.0%) | 0.0 |
| 35 to 50 years | 0 (0.0%) | 0.0 |
| Total | 0 (0.0%) | 0.0 |
Fertility by Age by Marriage Status in Mayersville
| Age Bracket | Married | Unmarried |
| 15 to 19 years | 0 (0.0%) | 0 (0.0%) |
| 20 to 34 years | 0 (0.0%) | 0 (0.0%) |
| 35 to 50 years | 0 (0.0%) | 0 (0.0%) |
| Total | 0 (0.0%) | 0 (0.0%) |
Fertility by Education in Mayersville
| Educational Attainment | Women with Births | Births / 1,000 Women |
| Less than High School | 0 (0.0%) | 0.0 |
| High School Diploma | 0 (0.0%) | 0.0 |
| College or Associate's Degree | 0 (0.0%) | 0.0 |
| Bachelor's Degree | 0 (0.0%) | 0.0 |
| Graduate Degree | 0 (0.0%) | 0.0 |
| Total | 0 (0.0%) | 0.0 |
Fertility by Education by Marriage Status in Mayersville
| Educational Attainment | Married | Unmarried |
| Less than High School | 0 (0.0%) | 0 (0.0%) |
| High School Diploma | 0 (0.0%) | 0 (0.0%) |
| College or Associate's Degree | 0 (0.0%) | 0 (0.0%) |
| Bachelor's Degree | 0 (0.0%) | 0 (0.0%) |
| Graduate Degree | 0 (0.0%) | 0 (0.0%) |
| Total | 0 (0.0%) | 0 (0.0%) |
Employment Characteristics in Mayersville
Employment by Class of Employer in Mayersville
Among the 14 employed individuals in Mayersville, private company employees (12 | 85.7%), and federal government employees (2 | 14.3%) make up the most common classes of employment.
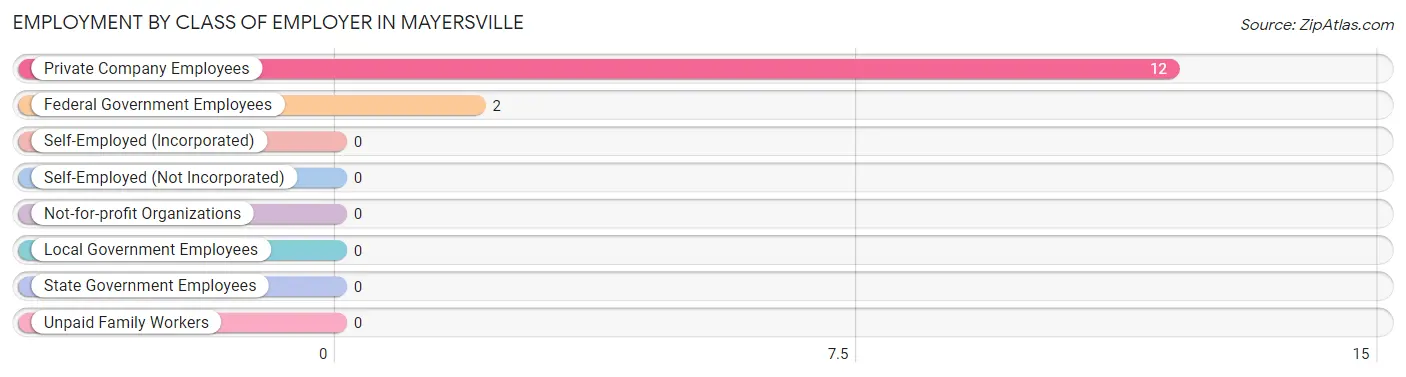
| Employer Class | # Employees | % Employees |
| Private Company Employees | 12 | 85.7% |
| Self-Employed (Incorporated) | 0 | 0.0% |
| Self-Employed (Not Incorporated) | 0 | 0.0% |
| Not-for-profit Organizations | 0 | 0.0% |
| Local Government Employees | 0 | 0.0% |
| State Government Employees | 0 | 0.0% |
| Federal Government Employees | 2 | 14.3% |
| Unpaid Family Workers | 0 | 0.0% |
| Total | 14 | 100.0% |
Employment Status by Age in Mayersville
According to the labor force statistics for Mayersville, out of the total population over 16 years of age (207), 22.2% or 46 individuals are in the labor force, with 54.3% or 25 of them unemployed. The age group with the highest labor force participation rate is 25 to 29 years, with 96.2% or 25 individuals in the labor force. Within the labor force, the 30 to 34 years age range has the highest percentage of unemployed individuals, with 100.0% or 10 of them being unemployed.
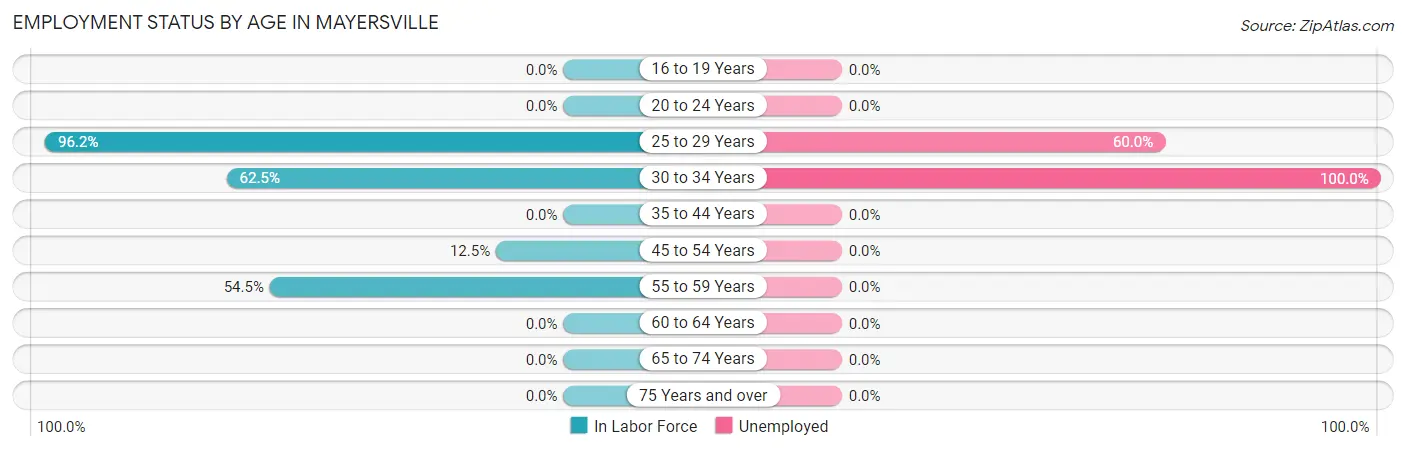
| Age Bracket | In Labor Force | Unemployed |
| 16 to 19 Years | 0 (0.0%) | 0 (0.0%) |
| 20 to 24 Years | 0 (0.0%) | 0 (0.0%) |
| 25 to 29 Years | 25 (96.2%) | 15 (60.0%) |
| 30 to 34 Years | 10 (62.5%) | 10 (100.0%) |
| 35 to 44 Years | 0 (0.0%) | 0 (0.0%) |
| 45 to 54 Years | 5 (12.5%) | 0 (0.0%) |
| 55 to 59 Years | 6 (54.5%) | 0 (0.0%) |
| 60 to 64 Years | 0 (0.0%) | 0 (0.0%) |
| 65 to 74 Years | 0 (0.0%) | 0 (0.0%) |
| 75 Years and over | 0 (0.0%) | 0 (0.0%) |
| Total | 46 (22.2%) | 25 (54.3%) |
Employment Status by Educational Attainment in Mayersville
According to labor force statistics for Mayersville, 30.5% of individuals (46) out of the total population between 25 and 64 years of age (151) are in the labor force, with 54.3% or 25 of them being unemployed. The group with the highest labor force participation rate are those with the educational attainment of high school diploma, with 40.5% or 30 individuals in the labor force. Within the labor force, individuals with college / associate degree education have the highest percentage of unemployment, with 62.5% or 10 of them being unemployed.
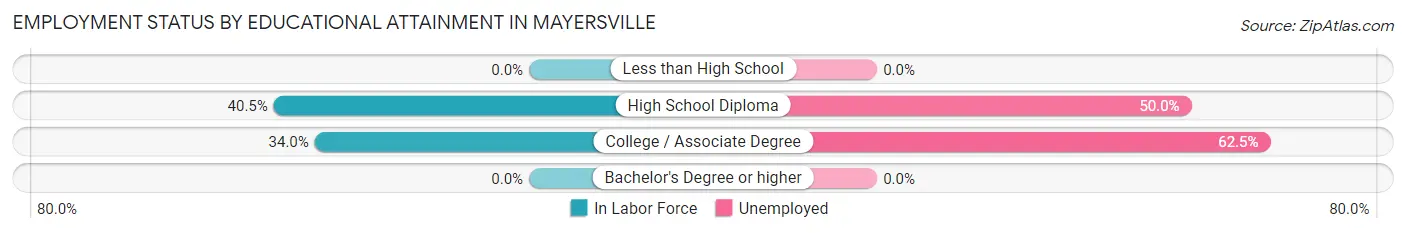
| Educational Attainment | In Labor Force | Unemployed |
| Less than High School | 0 (0.0%) | 0 (0.0%) |
| High School Diploma | 30 (40.5%) | 37 (50.0%) |
| College / Associate Degree | 16 (34.0%) | 29 (62.5%) |
| Bachelor's Degree or higher | 0 (0.0%) | 0 (0.0%) |
| Total | 46 (30.5%) | 82 (54.3%) |
Employment Occupations by Sex in Mayersville
Management, Business, Science and Arts Occupations
Management, Business, Science and Arts Occupations by Sex
| Occupation | Male | Female |
| Management | 0 (0.0%) | 0 (0.0%) |
| Business & Financial | 0 (0.0%) | 0 (0.0%) |
| Computers, Engineering & Science | 0 (0.0%) | 0 (0.0%) |
| Computers & Mathematics | 0 (0.0%) | 0 (0.0%) |
| Architecture & Engineering | 0 (0.0%) | 0 (0.0%) |
| Life, Physical & Social Science | 0 (0.0%) | 0 (0.0%) |
| Community & Social Service | 0 (0.0%) | 0 (0.0%) |
| Education, Arts & Media | 0 (0.0%) | 0 (0.0%) |
| Legal Services & Support | 0 (0.0%) | 0 (0.0%) |
| Education Instruction & Library | 0 (0.0%) | 0 (0.0%) |
| Arts, Media & Entertainment | 0 (0.0%) | 0 (0.0%) |
| Health Diagnosing & Treating | 0 (0.0%) | 0 (0.0%) |
| Health Technologists | 0 (0.0%) | 0 (0.0%) |
| Total (Category) | 0 (0.0%) | 0 (0.0%) |
| Total (Overall) | 3 (14.3%) | 18 (85.7%) |
Services Occupations
The most common Services occupations in Mayersville are , and Food Preparation & Serving (6 | 28.6%).
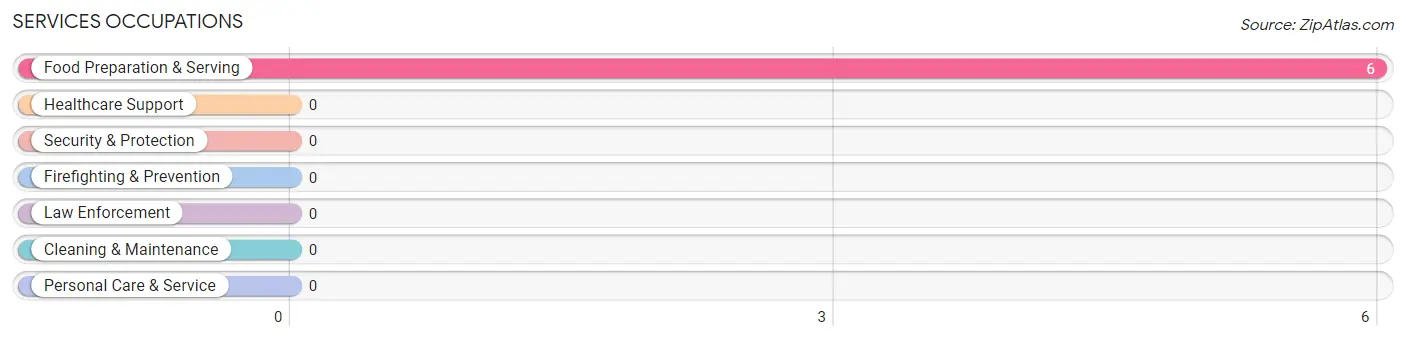
Services Occupations by Sex
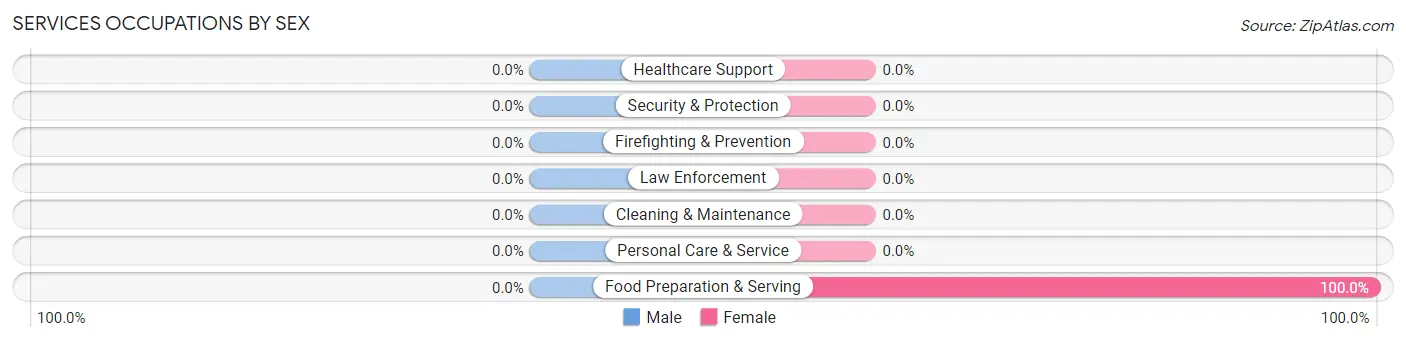
| Occupation | Male | Female |
| Healthcare Support | 0 (0.0%) | 0 (0.0%) |
| Security & Protection | 0 (0.0%) | 0 (0.0%) |
| Firefighting & Prevention | 0 (0.0%) | 0 (0.0%) |
| Law Enforcement | 0 (0.0%) | 0 (0.0%) |
| Food Preparation & Serving | 0 (0.0%) | 6 (100.0%) |
| Cleaning & Maintenance | 0 (0.0%) | 0 (0.0%) |
| Personal Care & Service | 0 (0.0%) | 0 (0.0%) |
| Total (Category) | 0 (0.0%) | 6 (100.0%) |
| Total (Overall) | 3 (14.3%) | 18 (85.7%) |
Sales and Office Occupations
The most common Sales and Office occupations in Mayersville are , and Office & Administration (12 | 57.1%).
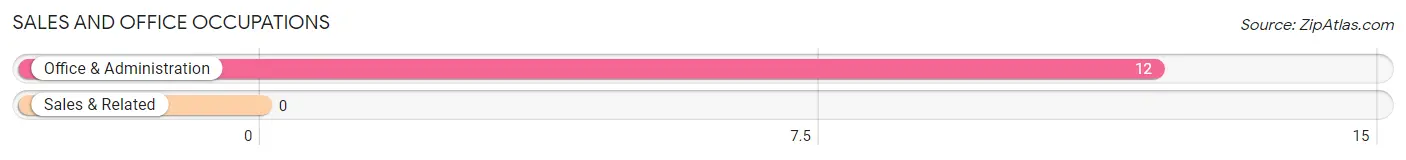
Sales and Office Occupations by Sex

| Occupation | Male | Female |
| Sales & Related | 0 (0.0%) | 0 (0.0%) |
| Office & Administration | 0 (0.0%) | 12 (100.0%) |
| Total (Category) | 0 (0.0%) | 12 (100.0%) |
| Total (Overall) | 3 (14.3%) | 18 (85.7%) |
Natural Resources, Construction and Maintenance Occupations
The most common Natural Resources, Construction and Maintenance occupations in Mayersville are , and Construction & Extraction (1 | 4.8%).
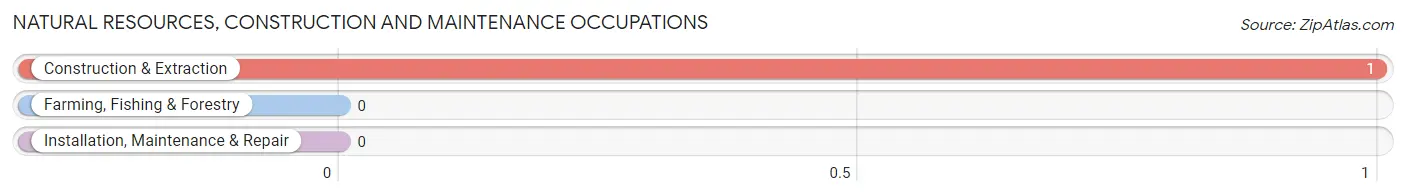
Natural Resources, Construction and Maintenance Occupations by Sex
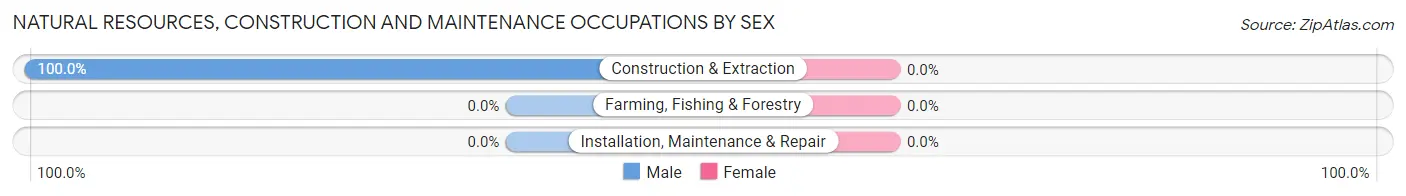
| Occupation | Male | Female |
| Farming, Fishing & Forestry | 0 (0.0%) | 0 (0.0%) |
| Construction & Extraction | 1 (100.0%) | 0 (0.0%) |
| Installation, Maintenance & Repair | 0 (0.0%) | 0 (0.0%) |
| Total (Category) | 1 (100.0%) | 0 (0.0%) |
| Total (Overall) | 3 (14.3%) | 18 (85.7%) |
Production, Transportation and Moving Occupations
The most common Production, Transportation and Moving occupations in Mayersville are , and Transportation (2 | 9.5%).
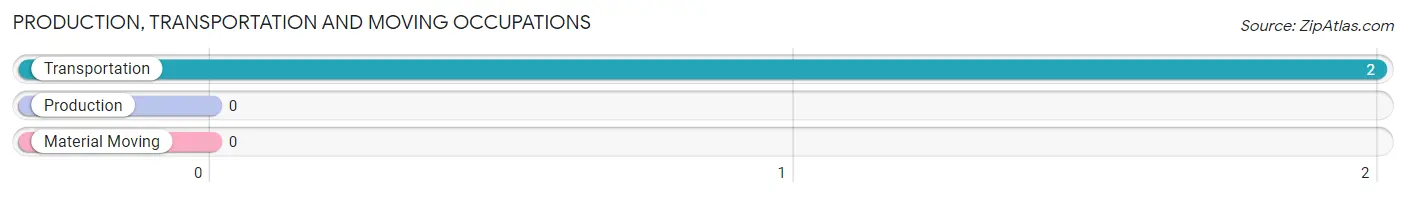
Production, Transportation and Moving Occupations by Sex
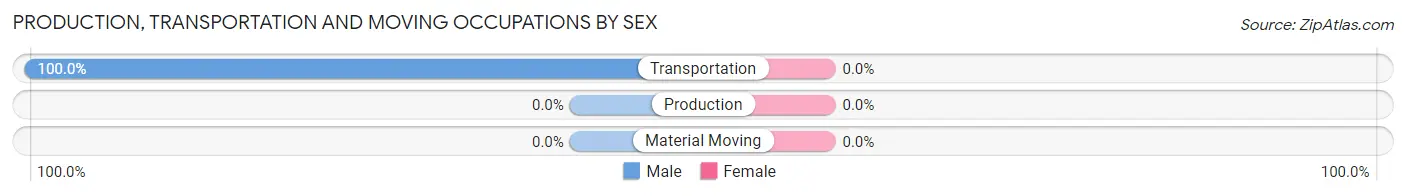
| Occupation | Male | Female |
| Production | 0 (0.0%) | 0 (0.0%) |
| Transportation | 2 (100.0%) | 0 (0.0%) |
| Material Moving | 0 (0.0%) | 0 (0.0%) |
| Total (Category) | 2 (100.0%) | 0 (0.0%) |
| Total (Overall) | 3 (14.3%) | 18 (85.7%) |
Employment Industries by Sex in Mayersville
Employment Industries in Mayersville
The major employment industries in Mayersville include Educational Services (6 | 28.6%), Construction (3 | 14.3%), and Health Care & Social Assistance (3 | 14.3%).
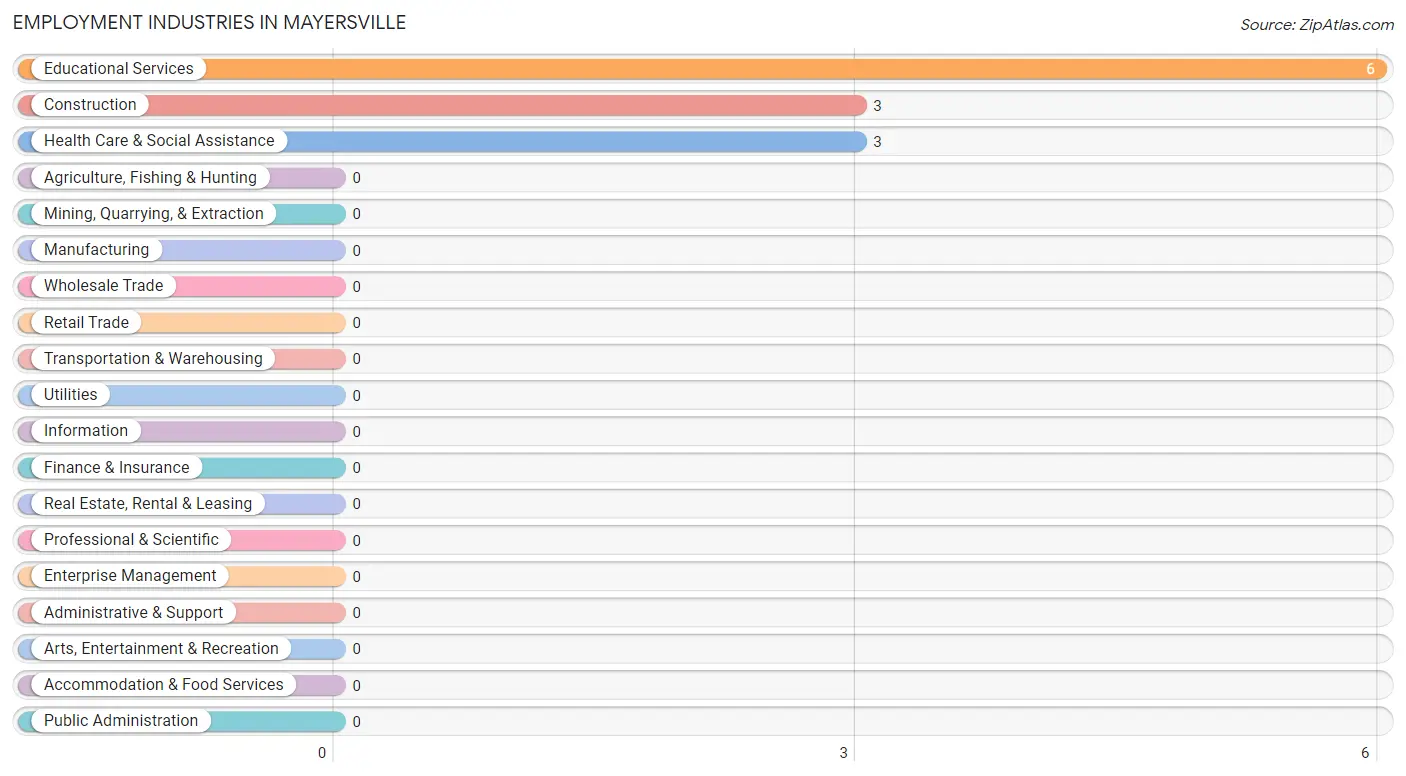
Employment Industries by Sex in Mayersville
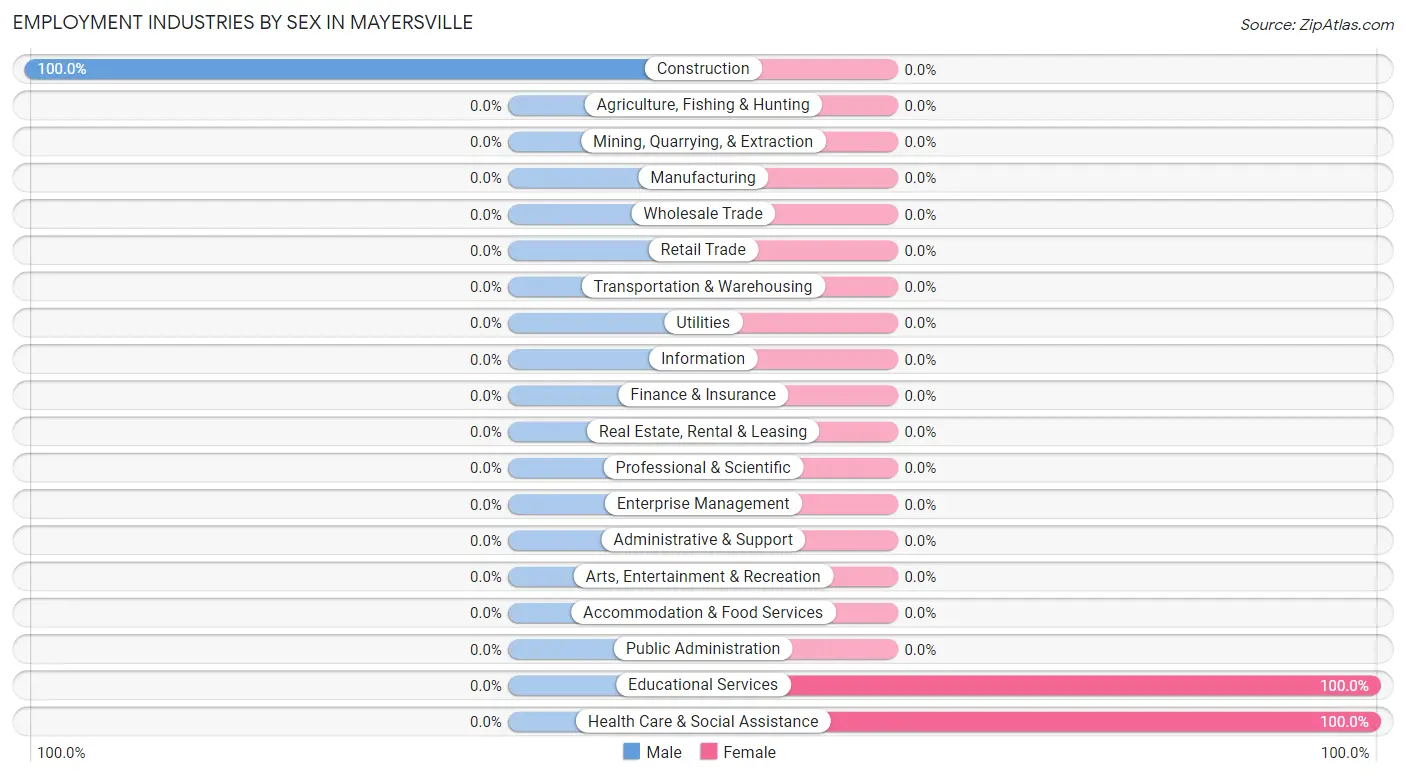
| Industry | Male | Female |
| Agriculture, Fishing & Hunting | 0 (0.0%) | 0 (0.0%) |
| Mining, Quarrying, & Extraction | 0 (0.0%) | 0 (0.0%) |
| Construction | 3 (100.0%) | 0 (0.0%) |
| Manufacturing | 0 (0.0%) | 0 (0.0%) |
| Wholesale Trade | 0 (0.0%) | 0 (0.0%) |
| Retail Trade | 0 (0.0%) | 0 (0.0%) |
| Transportation & Warehousing | 0 (0.0%) | 0 (0.0%) |
| Utilities | 0 (0.0%) | 0 (0.0%) |
| Information | 0 (0.0%) | 0 (0.0%) |
| Finance & Insurance | 0 (0.0%) | 0 (0.0%) |
| Real Estate, Rental & Leasing | 0 (0.0%) | 0 (0.0%) |
| Professional & Scientific | 0 (0.0%) | 0 (0.0%) |
| Enterprise Management | 0 (0.0%) | 0 (0.0%) |
| Administrative & Support | 0 (0.0%) | 0 (0.0%) |
| Educational Services | 0 (0.0%) | 6 (100.0%) |
| Health Care & Social Assistance | 0 (0.0%) | 3 (100.0%) |
| Arts, Entertainment & Recreation | 0 (0.0%) | 0 (0.0%) |
| Accommodation & Food Services | 0 (0.0%) | 0 (0.0%) |
| Public Administration | 0 (0.0%) | 0 (0.0%) |
| Total | 3 (14.3%) | 18 (85.7%) |
Education in Mayersville
School Enrollment in Mayersville
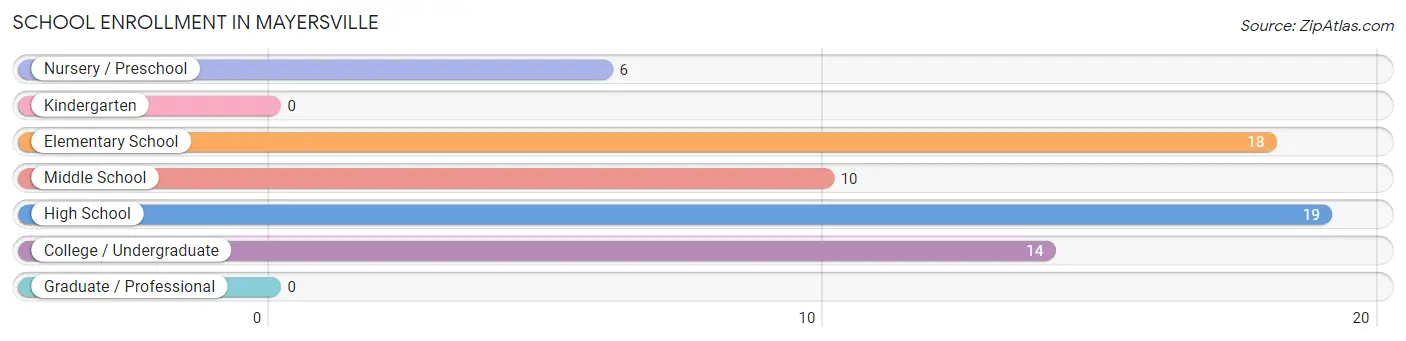
The most common levels of schooling among the 67 students in Mayersville are high school (19 | 28.4%), elementary school (18 | 26.9%), and college / undergraduate (14 | 20.9%).
| School Level | # Students | % Students |
| Nursery / Preschool | 6 | 9.0% |
| Kindergarten | 0 | 0.0% |
| Elementary School | 18 | 26.9% |
| Middle School | 10 | 14.9% |
| High School | 19 | 28.4% |
| College / Undergraduate | 14 | 20.9% |
| Graduate / Professional | 0 | 0.0% |
| Total | 67 | 100.0% |
School Enrollment by Age by Funding Source in Mayersville
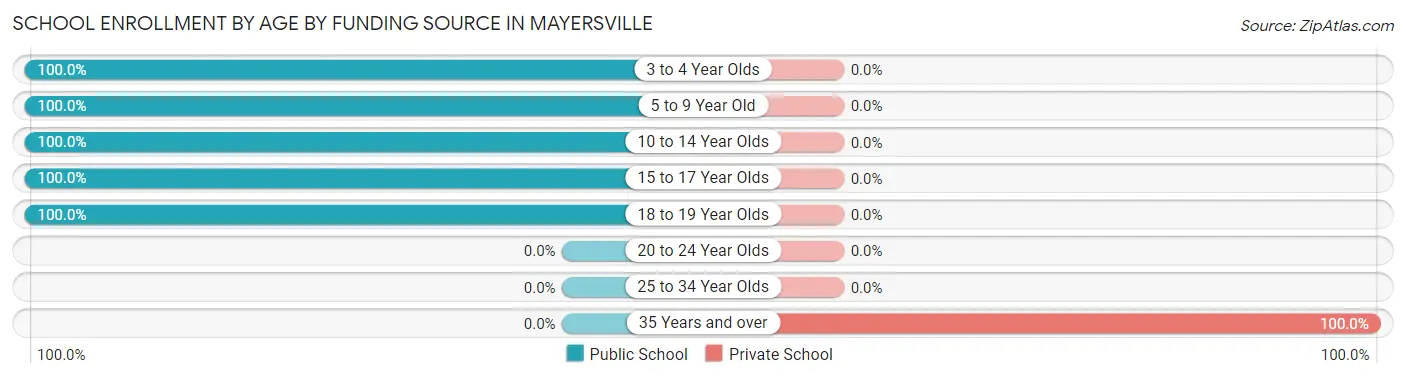
Out of a total of 67 students who are enrolled in schools in Mayersville, 14 (20.9%) attend a private institution, while the remaining 53 (79.1%) are enrolled in public schools. The age group of 35 years and over has the highest likelihood of being enrolled in private schools, with 14 (100.0% in the age bracket) enrolled. Conversely, the age group of 3 to 4 year olds has the lowest likelihood of being enrolled in a private school, with 6 (100.0% in the age bracket) attending a public institution.
| Age Bracket | Public School | Private School |
| 3 to 4 Year Olds | 6 (100.0%) | 0 (0.0%) |
| 5 to 9 Year Old | 18 (100.0%) | 0 (0.0%) |
| 10 to 14 Year Olds | 10 (100.0%) | 0 (0.0%) |
| 15 to 17 Year Olds | 8 (100.0%) | 0 (0.0%) |
| 18 to 19 Year Olds | 11 (100.0%) | 0 (0.0%) |
| 20 to 24 Year Olds | 0 (0.0%) | 0 (0.0%) |
| 25 to 34 Year Olds | 0 (0.0%) | 0 (0.0%) |
| 35 Years and over | 0 (0.0%) | 14 (100.0%) |
| Total | 53 (79.1%) | 14 (20.9%) |
Educational Attainment by Field of Study in Mayersville
| Field of Study | # Graduates | % Graduates |
| Computers & Mathematics | 0 | 0.0% |
| Bio, Nature & Agricultural | 0 | 0.0% |
| Physical & Health Sciences | 0 | 0.0% |
| Psychology | 0 | 0.0% |
| Social Sciences | 0 | 0.0% |
| Engineering | 0 | 0.0% |
| Multidisciplinary Studies | 0 | 0.0% |
| Science & Technology | 0 | 0.0% |
| Business | 0 | 0.0% |
| Education | 0 | 0.0% |
| Literature & Languages | 0 | 0.0% |
| Liberal Arts & History | 0 | 0.0% |
| Visual & Performing Arts | 0 | 0.0% |
| Communications | 0 | 0.0% |
| Arts & Humanities | 0 | 0.0% |
| Total | 0 | 0.0% |
Transportation & Commute in Mayersville
Vehicle Availability by Sex in Mayersville
The most prevalent vehicle ownership categories in Mayersville are males with 5 or more vehicles (2, accounting for 100.0%) and females with 5 or more vehicles (3, making up 16.7%).
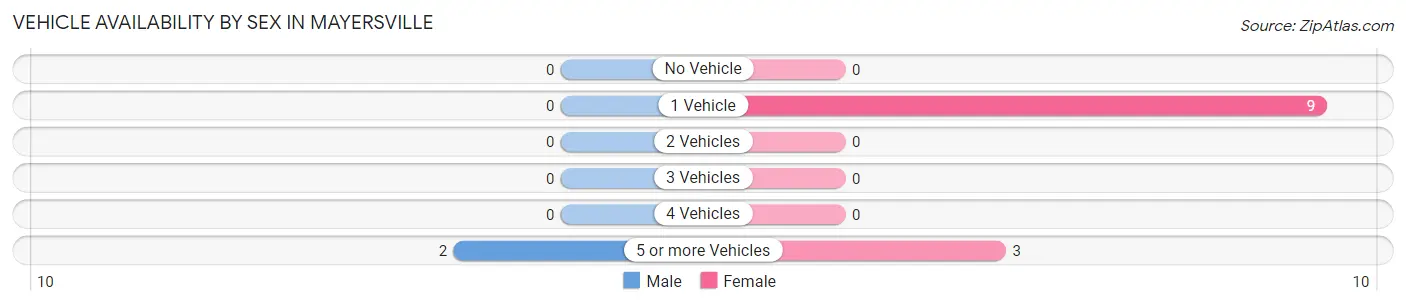
| Vehicles Available | Male | Female |
| No Vehicle | 0 (0.0%) | 0 (0.0%) |
| 1 Vehicle | 0 (0.0%) | 9 (75.0%) |
| 2 Vehicles | 0 (0.0%) | 0 (0.0%) |
| 3 Vehicles | 0 (0.0%) | 0 (0.0%) |
| 4 Vehicles | 0 (0.0%) | 0 (0.0%) |
| 5 or more Vehicles | 2 (100.0%) | 3 (25.0%) |
| Total | 2 (100.0%) | 12 (100.0%) |
Commute Time in Mayersville
The most frequently occuring commute durations in Mayersville are 15 to 19 minutes (9 commuters, 64.3%), 20 to 24 minutes (3 commuters, 21.4%), and 45 to 59 minutes (2 commuters, 14.3%).
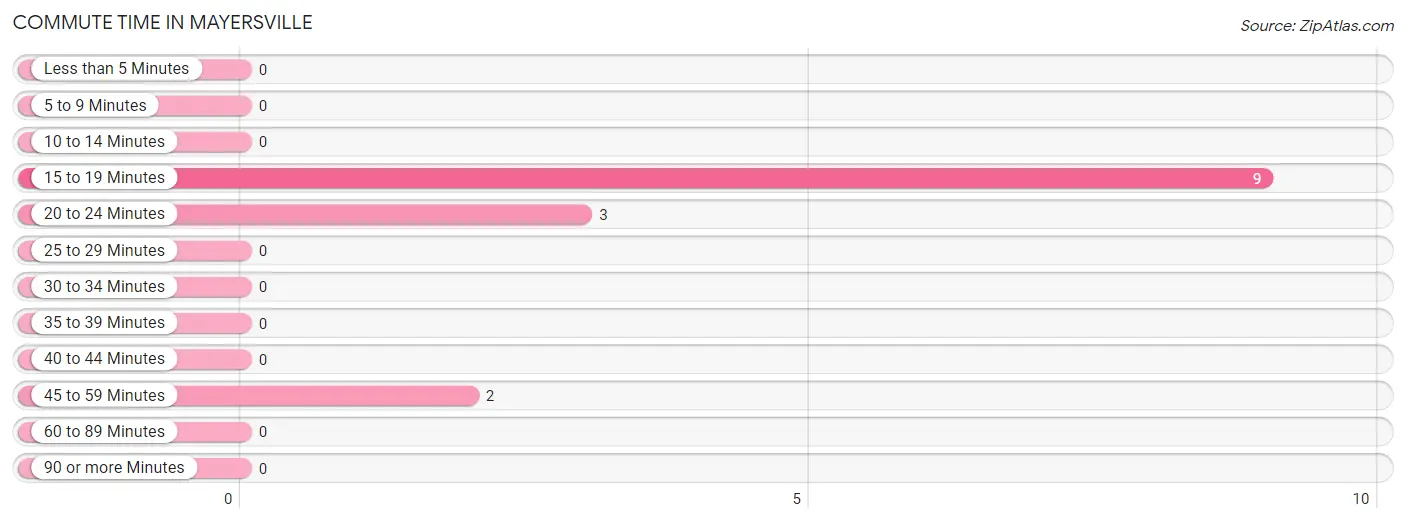
| Commute Time | # Commuters | % Commuters |
| Less than 5 Minutes | 0 | 0.0% |
| 5 to 9 Minutes | 0 | 0.0% |
| 10 to 14 Minutes | 0 | 0.0% |
| 15 to 19 Minutes | 9 | 64.3% |
| 20 to 24 Minutes | 3 | 21.4% |
| 25 to 29 Minutes | 0 | 0.0% |
| 30 to 34 Minutes | 0 | 0.0% |
| 35 to 39 Minutes | 0 | 0.0% |
| 40 to 44 Minutes | 0 | 0.0% |
| 45 to 59 Minutes | 2 | 14.3% |
| 60 to 89 Minutes | 0 | 0.0% |
| 90 or more Minutes | 0 | 0.0% |
Commute Time by Sex in Mayersville
The most common commute times in Mayersville are 45 to 59 minutes (2 commuters, 100.0%) for males and 15 to 19 minutes (9 commuters, 75.0%) for females.
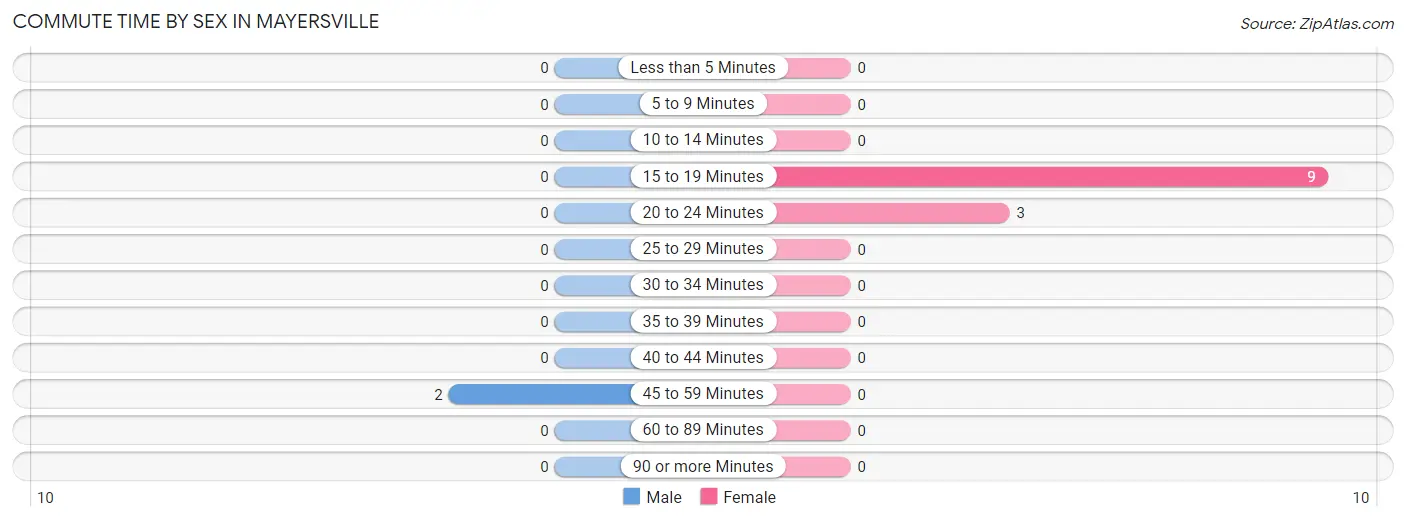
| Commute Time | Male | Female |
| Less than 5 Minutes | 0 (0.0%) | 0 (0.0%) |
| 5 to 9 Minutes | 0 (0.0%) | 0 (0.0%) |
| 10 to 14 Minutes | 0 (0.0%) | 0 (0.0%) |
| 15 to 19 Minutes | 0 (0.0%) | 9 (75.0%) |
| 20 to 24 Minutes | 0 (0.0%) | 3 (25.0%) |
| 25 to 29 Minutes | 0 (0.0%) | 0 (0.0%) |
| 30 to 34 Minutes | 0 (0.0%) | 0 (0.0%) |
| 35 to 39 Minutes | 0 (0.0%) | 0 (0.0%) |
| 40 to 44 Minutes | 0 (0.0%) | 0 (0.0%) |
| 45 to 59 Minutes | 2 (100.0%) | 0 (0.0%) |
| 60 to 89 Minutes | 0 (0.0%) | 0 (0.0%) |
| 90 or more Minutes | 0 (0.0%) | 0 (0.0%) |
Time of Departure to Work by Sex in Mayersville
The most frequent times of departure to work in Mayersville are 7:00 AM to 7:29 AM (2, 100.0%) for males and 7:00 AM to 7:29 AM (9, 75.0%) for females.
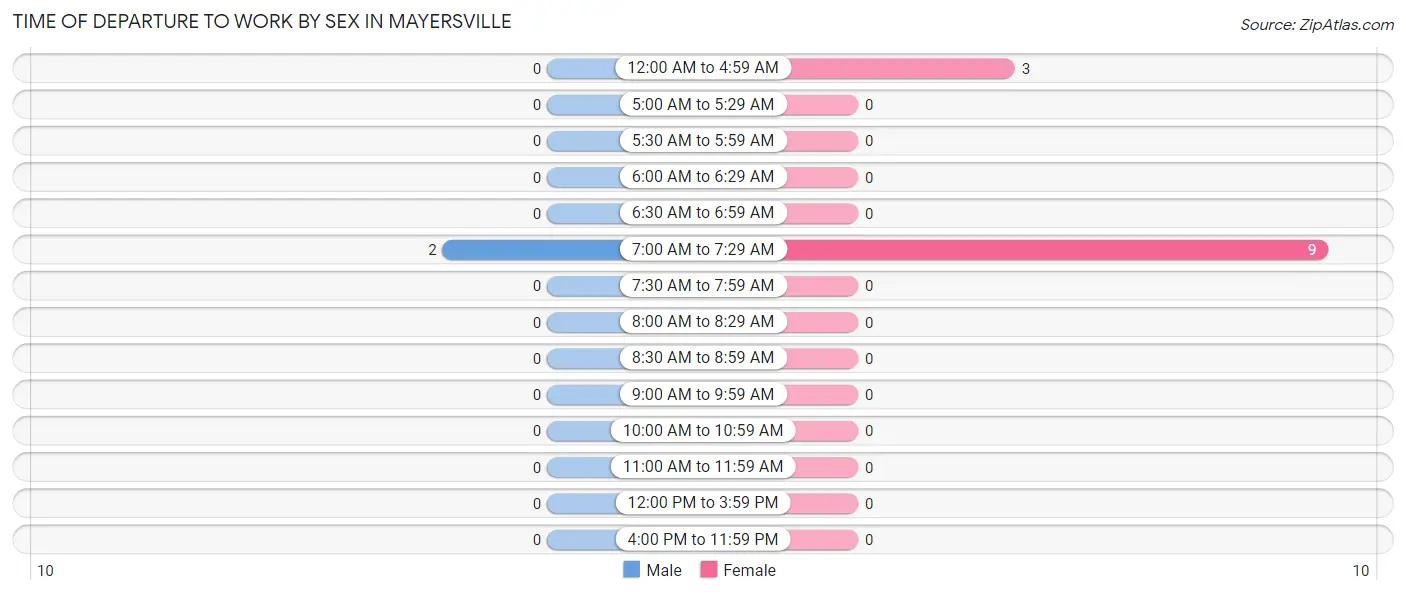
| Time of Departure | Male | Female |
| 12:00 AM to 4:59 AM | 0 (0.0%) | 3 (25.0%) |
| 5:00 AM to 5:29 AM | 0 (0.0%) | 0 (0.0%) |
| 5:30 AM to 5:59 AM | 0 (0.0%) | 0 (0.0%) |
| 6:00 AM to 6:29 AM | 0 (0.0%) | 0 (0.0%) |
| 6:30 AM to 6:59 AM | 0 (0.0%) | 0 (0.0%) |
| 7:00 AM to 7:29 AM | 2 (100.0%) | 9 (75.0%) |
| 7:30 AM to 7:59 AM | 0 (0.0%) | 0 (0.0%) |
| 8:00 AM to 8:29 AM | 0 (0.0%) | 0 (0.0%) |
| 8:30 AM to 8:59 AM | 0 (0.0%) | 0 (0.0%) |
| 9:00 AM to 9:59 AM | 0 (0.0%) | 0 (0.0%) |
| 10:00 AM to 10:59 AM | 0 (0.0%) | 0 (0.0%) |
| 11:00 AM to 11:59 AM | 0 (0.0%) | 0 (0.0%) |
| 12:00 PM to 3:59 PM | 0 (0.0%) | 0 (0.0%) |
| 4:00 PM to 11:59 PM | 0 (0.0%) | 0 (0.0%) |
| Total | 2 (100.0%) | 12 (100.0%) |
Housing Occupancy in Mayersville
Occupancy by Ownership in Mayersville
Of the total 125 dwellings in Mayersville, owner-occupied units account for 33 (26.4%), while renter-occupied units make up 92 (73.6%).
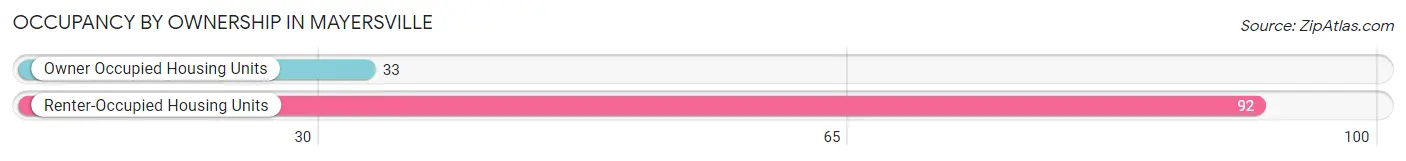
| Occupancy | # Housing Units | % Housing Units |
| Owner Occupied Housing Units | 33 | 26.4% |
| Renter-Occupied Housing Units | 92 | 73.6% |
| Total Occupied Housing Units | 125 | 100.0% |
Occupancy by Household Size in Mayersville
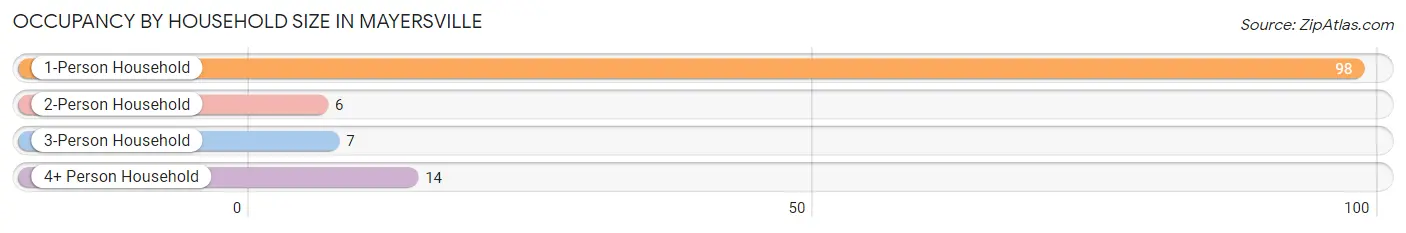
| Household Size | # Housing Units | % Housing Units |
| 1-Person Household | 98 | 78.4% |
| 2-Person Household | 6 | 4.8% |
| 3-Person Household | 7 | 5.6% |
| 4+ Person Household | 14 | 11.2% |
| Total Housing Units | 125 | 100.0% |
Occupancy by Ownership by Household Size in Mayersville
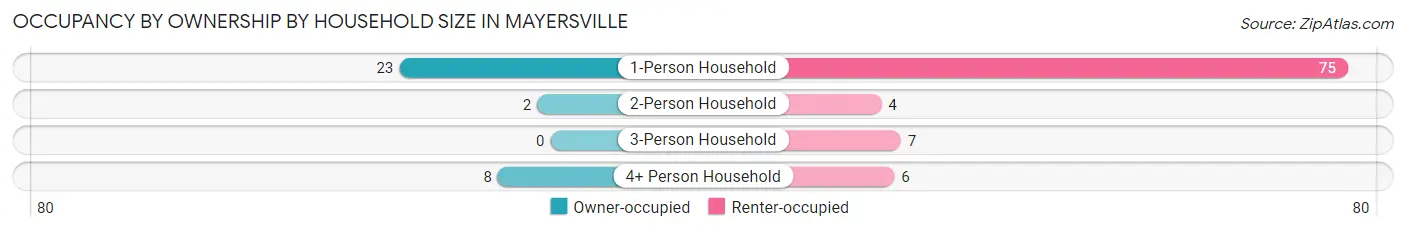
| Household Size | Owner-occupied | Renter-occupied |
| 1-Person Household | 23 (23.5%) | 75 (76.5%) |
| 2-Person Household | 2 (33.3%) | 4 (66.7%) |
| 3-Person Household | 0 (0.0%) | 7 (100.0%) |
| 4+ Person Household | 8 (57.1%) | 6 (42.9%) |
| Total Housing Units | 33 (26.4%) | 92 (73.6%) |
Occupancy by Educational Attainment in Mayersville
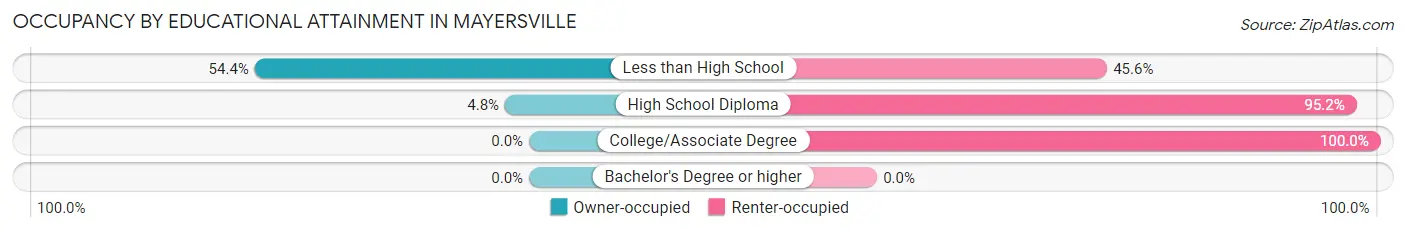
| Household Size | Owner-occupied | Renter-occupied |
| Less than High School | 31 (54.4%) | 26 (45.6%) |
| High School Diploma | 2 (4.8%) | 40 (95.2%) |
| College/Associate Degree | 0 (0.0%) | 26 (100.0%) |
| Bachelor's Degree or higher | 0 (0.0%) | 0 (0.0%) |
Occupancy by Age of Householder in Mayersville
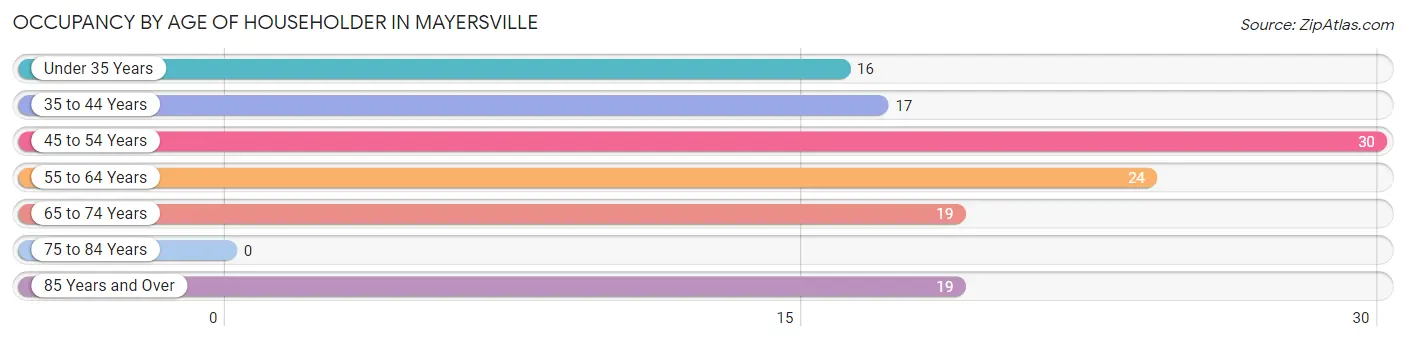
| Age Bracket | # Households | % Households |
| Under 35 Years | 16 | 12.8% |
| 35 to 44 Years | 17 | 13.6% |
| 45 to 54 Years | 30 | 24.0% |
| 55 to 64 Years | 24 | 19.2% |
| 65 to 74 Years | 19 | 15.2% |
| 75 to 84 Years | 0 | 0.0% |
| 85 Years and Over | 19 | 15.2% |
| Total | 125 | 100.0% |
Housing Finances in Mayersville
Median Income by Occupancy in Mayersville
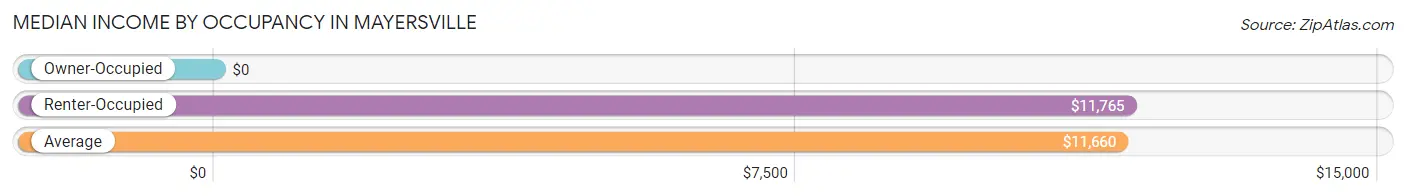
| Occupancy Type | # Households | Median Income |
| Owner-Occupied | 33 (26.4%) | $0 |
| Renter-Occupied | 92 (73.6%) | $11,765 |
| Average | 125 (100.0%) | $11,660 |
Occupancy by Householder Income Bracket in Mayersville
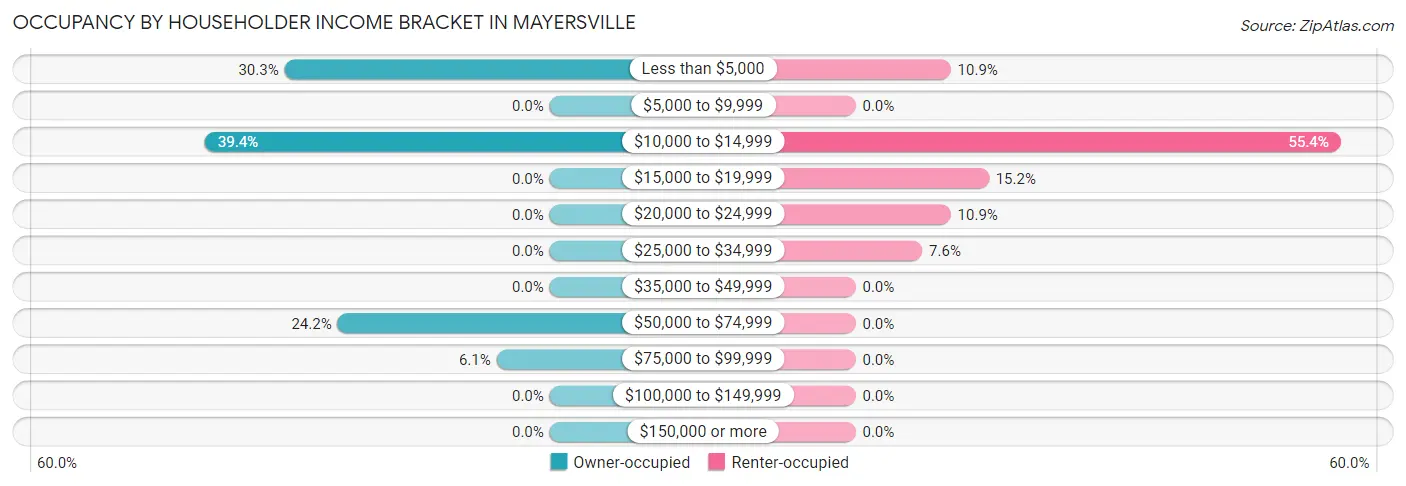
| Income Bracket | Owner-occupied | Renter-occupied |
| Less than $5,000 | 10 (30.3%) | 10 (10.9%) |
| $5,000 to $9,999 | 0 (0.0%) | 0 (0.0%) |
| $10,000 to $14,999 | 13 (39.4%) | 51 (55.4%) |
| $15,000 to $19,999 | 0 (0.0%) | 14 (15.2%) |
| $20,000 to $24,999 | 0 (0.0%) | 10 (10.9%) |
| $25,000 to $34,999 | 0 (0.0%) | 7 (7.6%) |
| $35,000 to $49,999 | 0 (0.0%) | 0 (0.0%) |
| $50,000 to $74,999 | 8 (24.2%) | 0 (0.0%) |
| $75,000 to $99,999 | 2 (6.1%) | 0 (0.0%) |
| $100,000 to $149,999 | 0 (0.0%) | 0 (0.0%) |
| $150,000 or more | 0 (0.0%) | 0 (0.0%) |
| Total | 33 (100.0%) | 92 (100.0%) |
Monthly Housing Cost Tiers in Mayersville
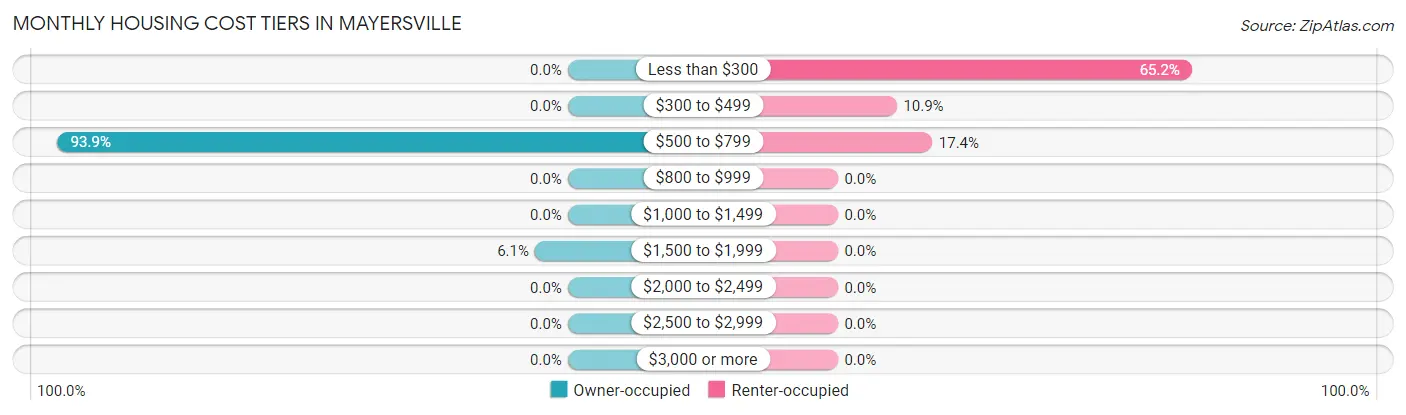
| Monthly Cost | Owner-occupied | Renter-occupied |
| Less than $300 | 0 (0.0%) | 60 (65.2%) |
| $300 to $499 | 0 (0.0%) | 10 (10.9%) |
| $500 to $799 | 31 (93.9%) | 16 (17.4%) |
| $800 to $999 | 0 (0.0%) | 0 (0.0%) |
| $1,000 to $1,499 | 0 (0.0%) | 0 (0.0%) |
| $1,500 to $1,999 | 2 (6.1%) | 0 (0.0%) |
| $2,000 to $2,499 | 0 (0.0%) | 0 (0.0%) |
| $2,500 to $2,999 | 0 (0.0%) | 0 (0.0%) |
| $3,000 or more | 0 (0.0%) | 0 (0.0%) |
| Total | 33 (100.0%) | 92 (100.0%) |
Physical Housing Characteristics in Mayersville
Housing Structures in Mayersville
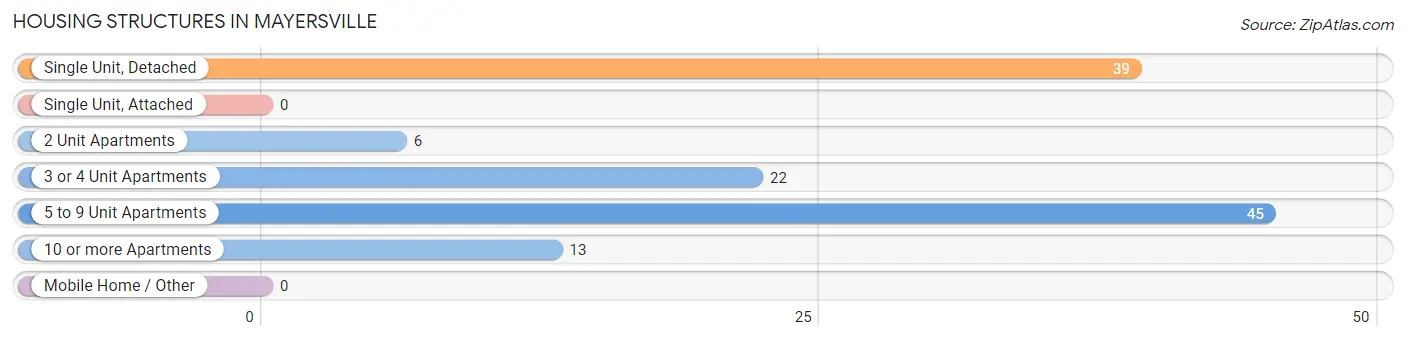
| Structure Type | # Housing Units | % Housing Units |
| Single Unit, Detached | 39 | 31.2% |
| Single Unit, Attached | 0 | 0.0% |
| 2 Unit Apartments | 6 | 4.8% |
| 3 or 4 Unit Apartments | 22 | 17.6% |
| 5 to 9 Unit Apartments | 45 | 36.0% |
| 10 or more Apartments | 13 | 10.4% |
| Mobile Home / Other | 0 | 0.0% |
| Total | 125 | 100.0% |
Housing Structures by Occupancy in Mayersville
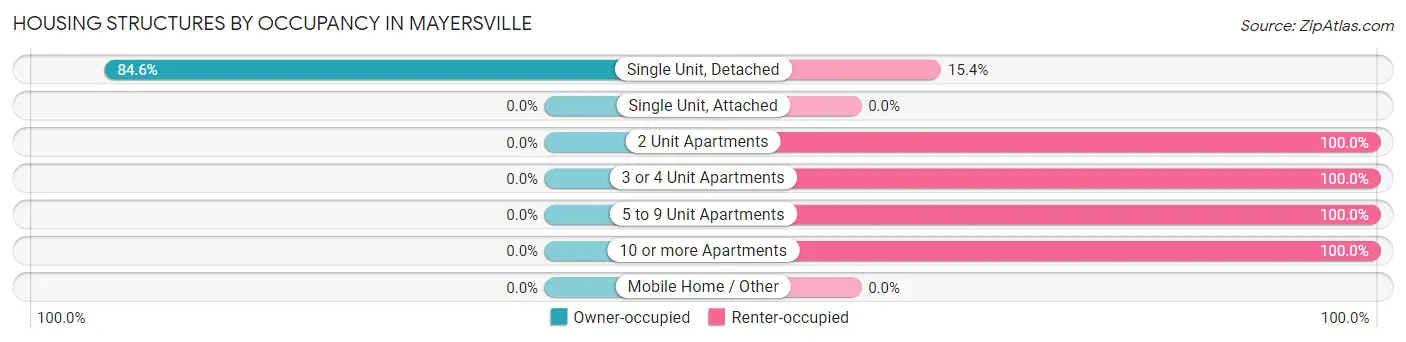
| Structure Type | Owner-occupied | Renter-occupied |
| Single Unit, Detached | 33 (84.6%) | 6 (15.4%) |
| Single Unit, Attached | 0 (0.0%) | 0 (0.0%) |
| 2 Unit Apartments | 0 (0.0%) | 6 (100.0%) |
| 3 or 4 Unit Apartments | 0 (0.0%) | 22 (100.0%) |
| 5 to 9 Unit Apartments | 0 (0.0%) | 45 (100.0%) |
| 10 or more Apartments | 0 (0.0%) | 13 (100.0%) |
| Mobile Home / Other | 0 (0.0%) | 0 (0.0%) |
| Total | 33 (26.4%) | 92 (73.6%) |
Housing Structures by Number of Rooms in Mayersville
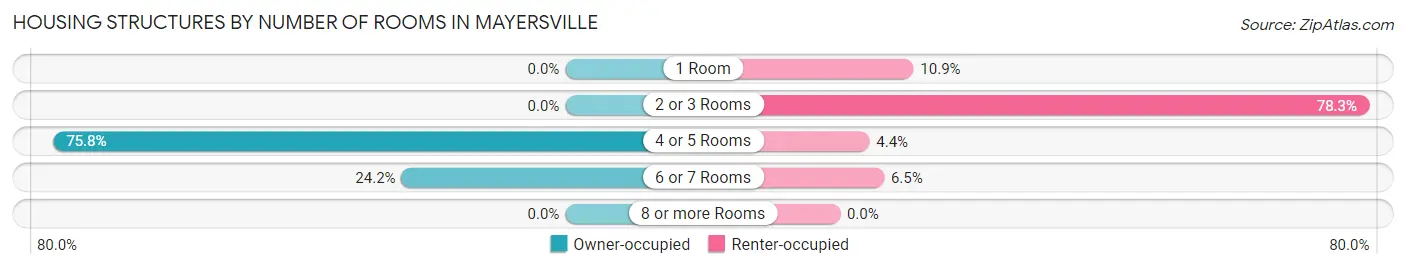
| Number of Rooms | Owner-occupied | Renter-occupied |
| 1 Room | 0 (0.0%) | 10 (10.9%) |
| 2 or 3 Rooms | 0 (0.0%) | 72 (78.3%) |
| 4 or 5 Rooms | 25 (75.8%) | 4 (4.3%) |
| 6 or 7 Rooms | 8 (24.2%) | 6 (6.5%) |
| 8 or more Rooms | 0 (0.0%) | 0 (0.0%) |
| Total | 33 (100.0%) | 92 (100.0%) |
Housing Structure by Heating Type in Mayersville
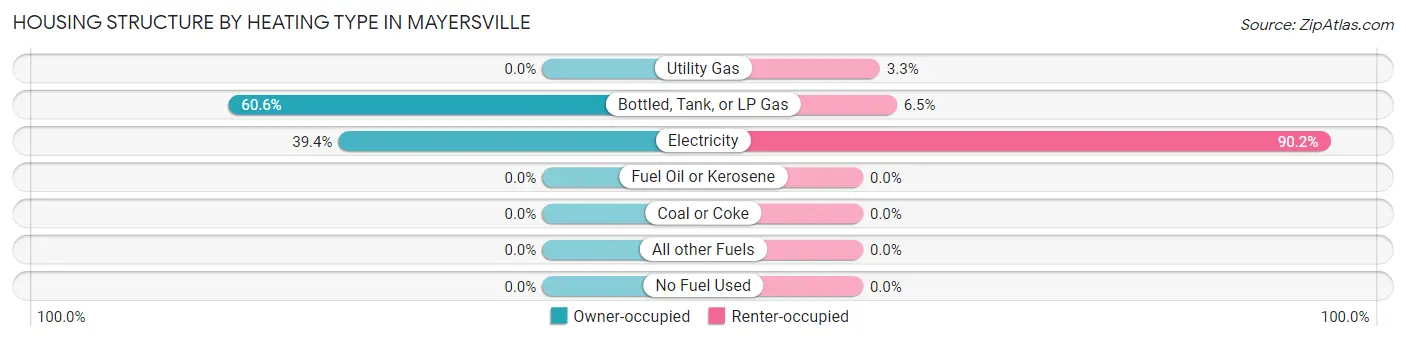
| Heating Type | Owner-occupied | Renter-occupied |
| Utility Gas | 0 (0.0%) | 3 (3.3%) |
| Bottled, Tank, or LP Gas | 20 (60.6%) | 6 (6.5%) |
| Electricity | 13 (39.4%) | 83 (90.2%) |
| Fuel Oil or Kerosene | 0 (0.0%) | 0 (0.0%) |
| Coal or Coke | 0 (0.0%) | 0 (0.0%) |
| All other Fuels | 0 (0.0%) | 0 (0.0%) |
| No Fuel Used | 0 (0.0%) | 0 (0.0%) |
| Total | 33 (100.0%) | 92 (100.0%) |
Household Vehicle Usage in Mayersville
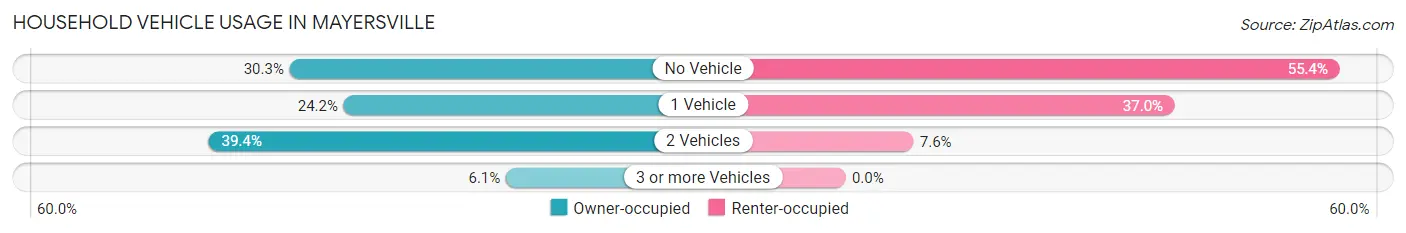
| Vehicles per Household | Owner-occupied | Renter-occupied |
| No Vehicle | 10 (30.3%) | 51 (55.4%) |
| 1 Vehicle | 8 (24.2%) | 34 (37.0%) |
| 2 Vehicles | 13 (39.4%) | 7 (7.6%) |
| 3 or more Vehicles | 2 (6.1%) | 0 (0.0%) |
| Total | 33 (100.0%) | 92 (100.0%) |
Real Estate & Mortgages in Mayersville
Real Estate and Mortgage Overview in Mayersville
| Characteristic | Without Mortgage | With Mortgage |
| Housing Units | 31 | 2 |
| Median Property Value | $92,500 | $0 |
| Median Household Income | - | - |
| Monthly Housing Costs | $574 | $0 |
| Real Estate Taxes | - | - |
Property Value by Mortgage Status in Mayersville
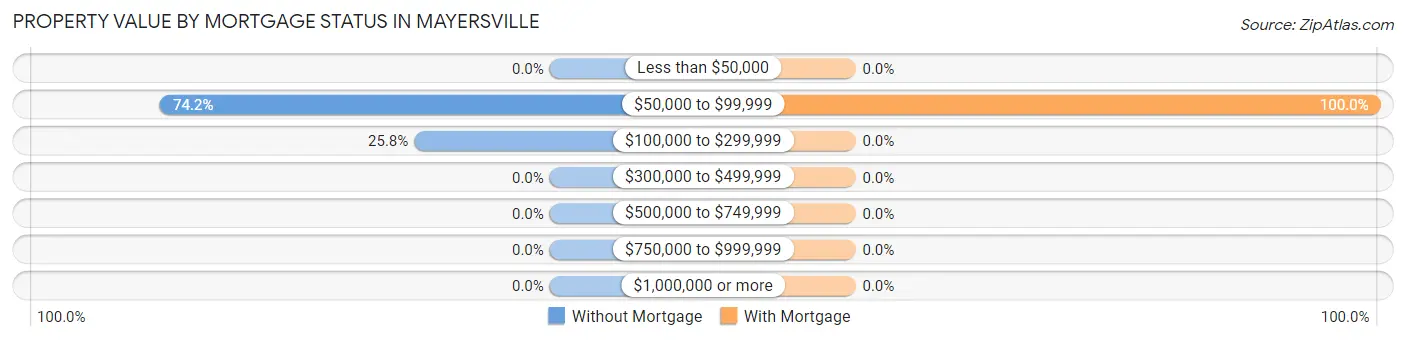
| Property Value | Without Mortgage | With Mortgage |
| Less than $50,000 | 0 (0.0%) | 0 (0.0%) |
| $50,000 to $99,999 | 23 (74.2%) | 2 (100.0%) |
| $100,000 to $299,999 | 8 (25.8%) | 0 (0.0%) |
| $300,000 to $499,999 | 0 (0.0%) | 0 (0.0%) |
| $500,000 to $749,999 | 0 (0.0%) | 0 (0.0%) |
| $750,000 to $999,999 | 0 (0.0%) | 0 (0.0%) |
| $1,000,000 or more | 0 (0.0%) | 0 (0.0%) |
| Total | 31 (100.0%) | 2 (100.0%) |
Household Income by Mortgage Status in Mayersville
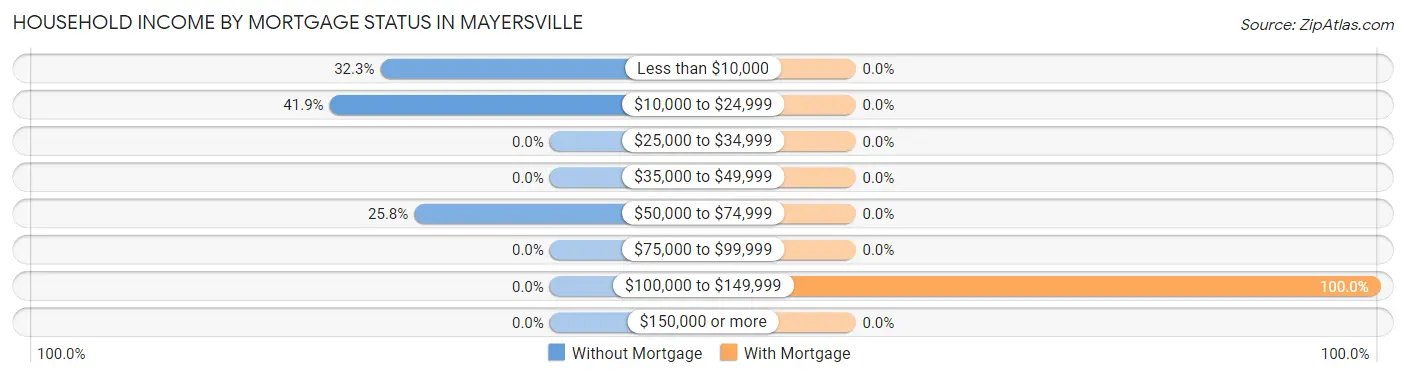
| Household Income | Without Mortgage | With Mortgage |
| Less than $10,000 | 10 (32.3%) | 0 (0.0%) |
| $10,000 to $24,999 | 13 (41.9%) | 0 (0.0%) |
| $25,000 to $34,999 | 0 (0.0%) | 0 (0.0%) |
| $35,000 to $49,999 | 0 (0.0%) | 0 (0.0%) |
| $50,000 to $74,999 | 8 (25.8%) | 0 (0.0%) |
| $75,000 to $99,999 | 0 (0.0%) | 0 (0.0%) |
| $100,000 to $149,999 | 0 (0.0%) | 2 (100.0%) |
| $150,000 or more | 0 (0.0%) | 0 (0.0%) |
| Total | 31 (100.0%) | 2 (100.0%) |
Property Value to Household Income Ratio in Mayersville
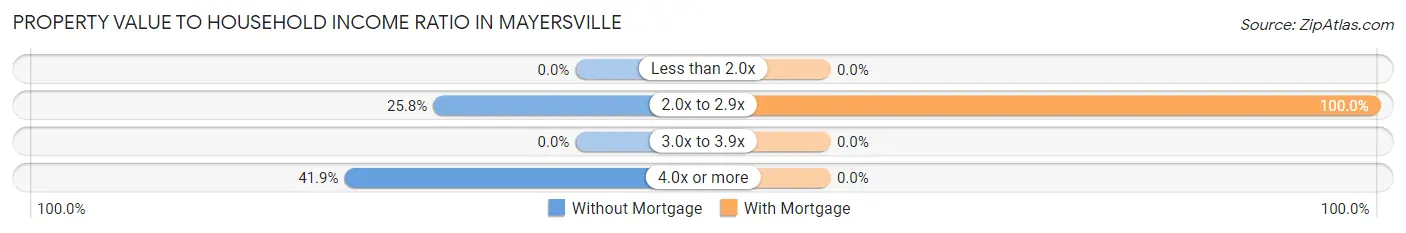
| Value-to-Income Ratio | Without Mortgage | With Mortgage |
| Less than 2.0x | 0 (0.0%) | 0 (0.0%) |
| 2.0x to 2.9x | 8 (25.8%) | 2 (100.0%) |
| 3.0x to 3.9x | 0 (0.0%) | 0 (0.0%) |
| 4.0x or more | 13 (41.9%) | 0 (0.0%) |
| Total | 31 (100.0%) | 2 (100.0%) |
Real Estate Taxes by Mortgage Status in Mayersville
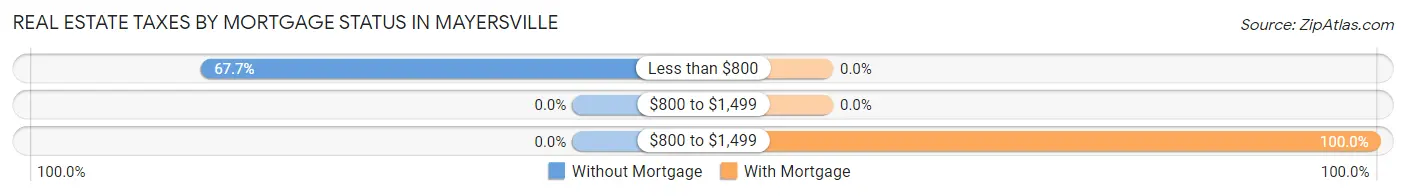
| Property Taxes | Without Mortgage | With Mortgage |
| Less than $800 | 21 (67.7%) | 0 (0.0%) |
| $800 to $1,499 | 0 (0.0%) | 0 (0.0%) |
| $800 to $1,499 | 0 (0.0%) | 2 (100.0%) |
| Total | 31 (100.0%) | 2 (100.0%) |
Health & Disability in Mayersville
Health Insurance Coverage by Age in Mayersville
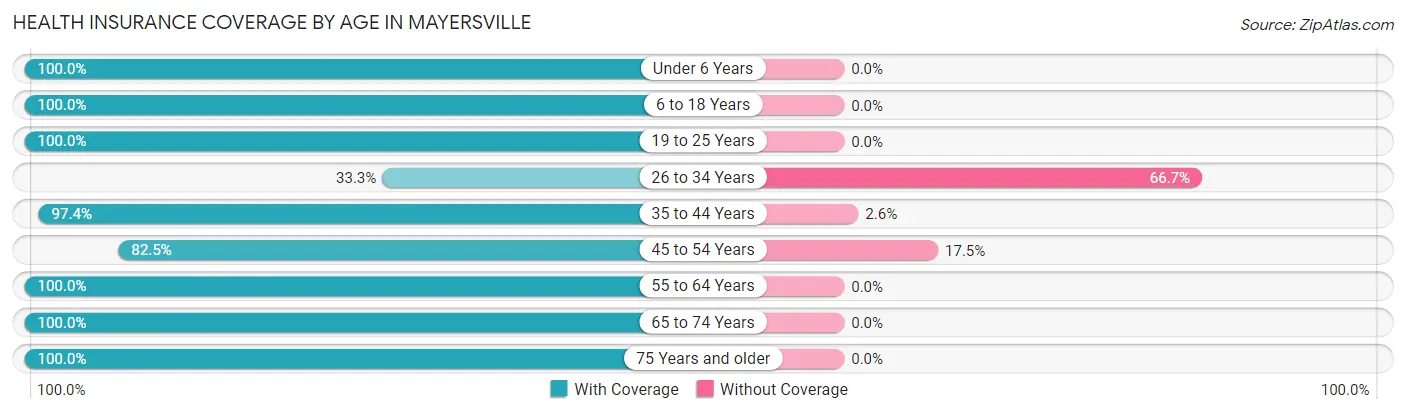
| Age Bracket | With Coverage | Without Coverage |
| Under 6 Years | 6 (100.0%) | 0 (0.0%) |
| 6 to 18 Years | 47 (100.0%) | 0 (0.0%) |
| 19 to 25 Years | 24 (100.0%) | 0 (0.0%) |
| 26 to 34 Years | 6 (33.3%) | 12 (66.7%) |
| 35 to 44 Years | 37 (97.4%) | 1 (2.6%) |
| 45 to 54 Years | 33 (82.5%) | 7 (17.5%) |
| 55 to 64 Years | 31 (100.0%) | 0 (0.0%) |
| 65 to 74 Years | 19 (100.0%) | 0 (0.0%) |
| 75 Years and older | 19 (100.0%) | 0 (0.0%) |
| Total | 222 (91.7%) | 20 (8.3%) |
Health Insurance Coverage by Citizenship Status in Mayersville
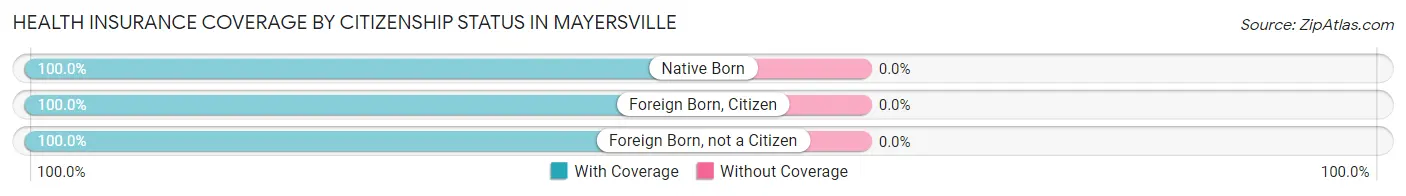
| Citizenship Status | With Coverage | Without Coverage |
| Native Born | 6 (100.0%) | 0 (0.0%) |
| Foreign Born, Citizen | 47 (100.0%) | 0 (0.0%) |
| Foreign Born, not a Citizen | 24 (100.0%) | 0 (0.0%) |
Health Insurance Coverage by Household Income in Mayersville
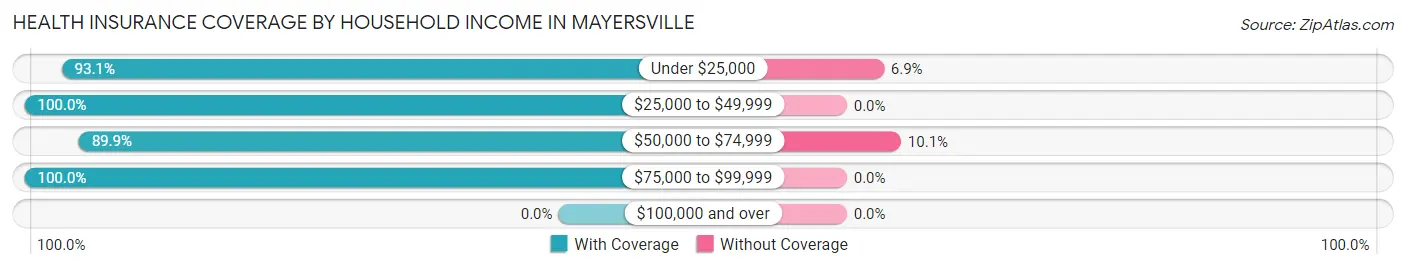
| Household Income | With Coverage | Without Coverage |
| Under $25,000 | 134 (93.1%) | 10 (6.9%) |
| $25,000 to $49,999 | 19 (100.0%) | 0 (0.0%) |
| $50,000 to $74,999 | 62 (89.9%) | 7 (10.1%) |
| $75,000 to $99,999 | 5 (100.0%) | 0 (0.0%) |
| $100,000 and over | 0 (0.0%) | 0 (0.0%) |
Public vs Private Health Insurance Coverage by Age in Mayersville
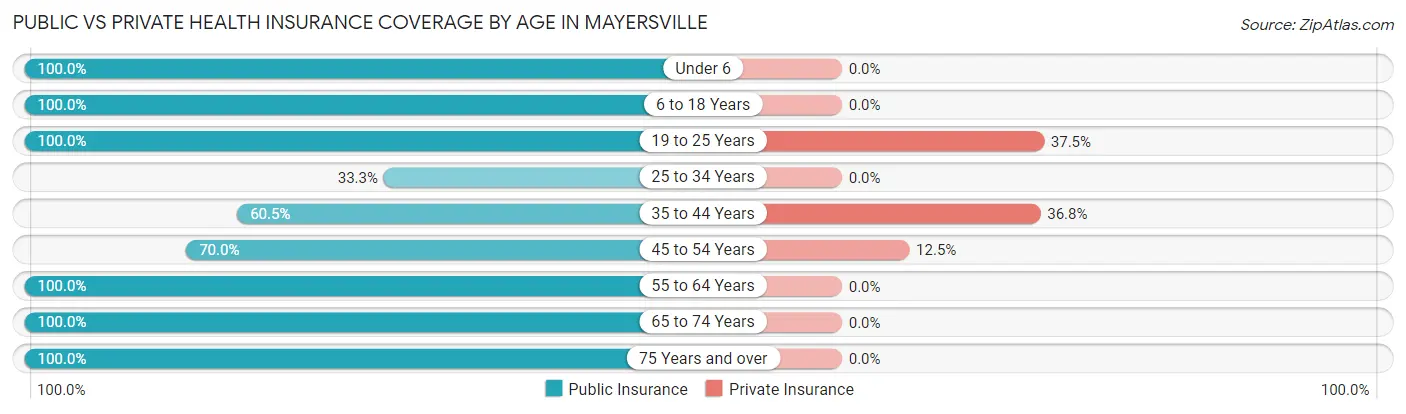
| Age Bracket | Public Insurance | Private Insurance |
| Under 6 | 6 (100.0%) | 0 (0.0%) |
| 6 to 18 Years | 47 (100.0%) | 0 (0.0%) |
| 19 to 25 Years | 24 (100.0%) | 9 (37.5%) |
| 25 to 34 Years | 6 (33.3%) | 0 (0.0%) |
| 35 to 44 Years | 23 (60.5%) | 14 (36.8%) |
| 45 to 54 Years | 28 (70.0%) | 5 (12.5%) |
| 55 to 64 Years | 31 (100.0%) | 0 (0.0%) |
| 65 to 74 Years | 19 (100.0%) | 0 (0.0%) |
| 75 Years and over | 19 (100.0%) | 0 (0.0%) |
| Total | 203 (83.9%) | 28 (11.6%) |
Disability Status by Sex by Age in Mayersville
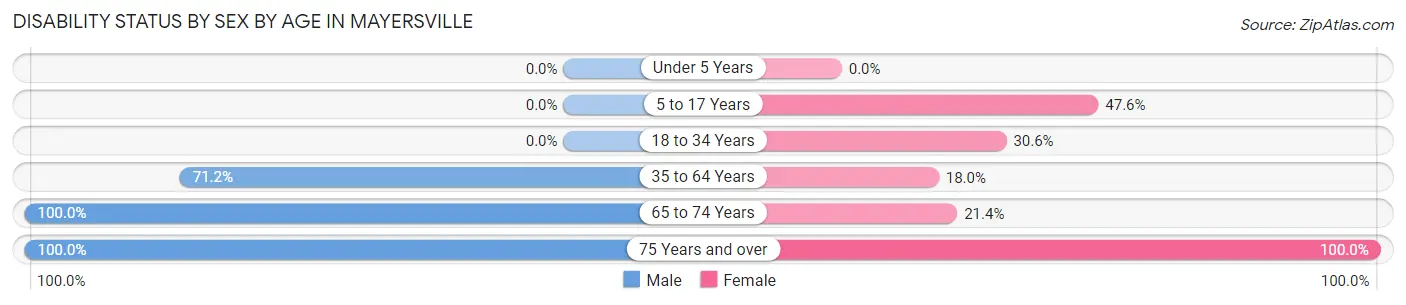
| Age Bracket | Male | Female |
| Under 5 Years | 0 (0.0%) | 0 (0.0%) |
| 5 to 17 Years | 0 (0.0%) | 10 (47.6%) |
| 18 to 34 Years | 0 (0.0%) | 11 (30.6%) |
| 35 to 64 Years | 42 (71.2%) | 9 (18.0%) |
| 65 to 74 Years | 5 (100.0%) | 3 (21.4%) |
| 75 Years and over | 13 (100.0%) | 6 (100.0%) |
Disability Class by Sex by Age in Mayersville
Disability Class: Hearing Difficulty
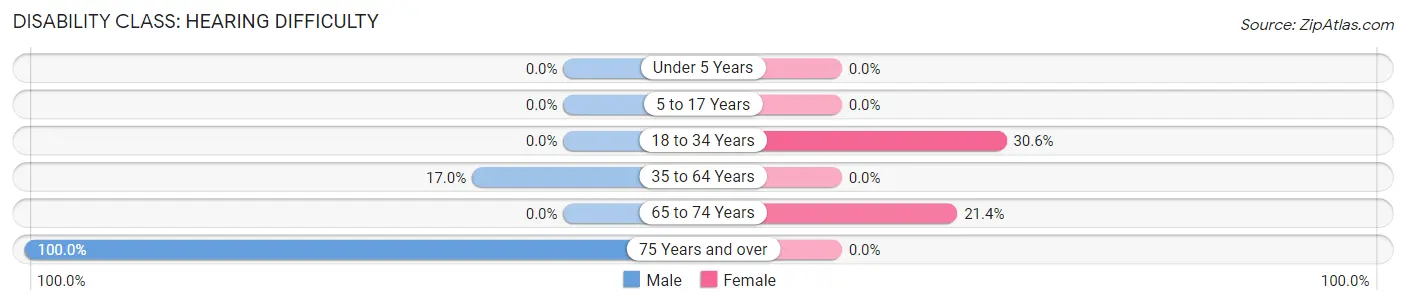
| Age Bracket | Male | Female |
| Under 5 Years | 0 (0.0%) | 0 (0.0%) |
| 5 to 17 Years | 0 (0.0%) | 0 (0.0%) |
| 18 to 34 Years | 0 (0.0%) | 11 (30.6%) |
| 35 to 64 Years | 10 (17.0%) | 0 (0.0%) |
| 65 to 74 Years | 0 (0.0%) | 3 (21.4%) |
| 75 Years and over | 13 (100.0%) | 0 (0.0%) |
Disability Class: Vision Difficulty
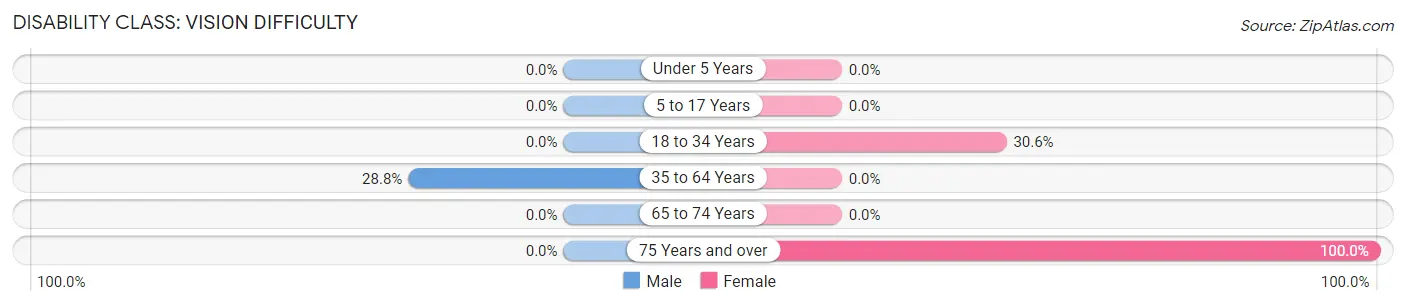
| Age Bracket | Male | Female |
| Under 5 Years | 0 (0.0%) | 0 (0.0%) |
| 5 to 17 Years | 0 (0.0%) | 0 (0.0%) |
| 18 to 34 Years | 0 (0.0%) | 11 (30.6%) |
| 35 to 64 Years | 17 (28.8%) | 0 (0.0%) |
| 65 to 74 Years | 0 (0.0%) | 0 (0.0%) |
| 75 Years and over | 0 (0.0%) | 6 (100.0%) |
Disability Class: Cognitive Difficulty
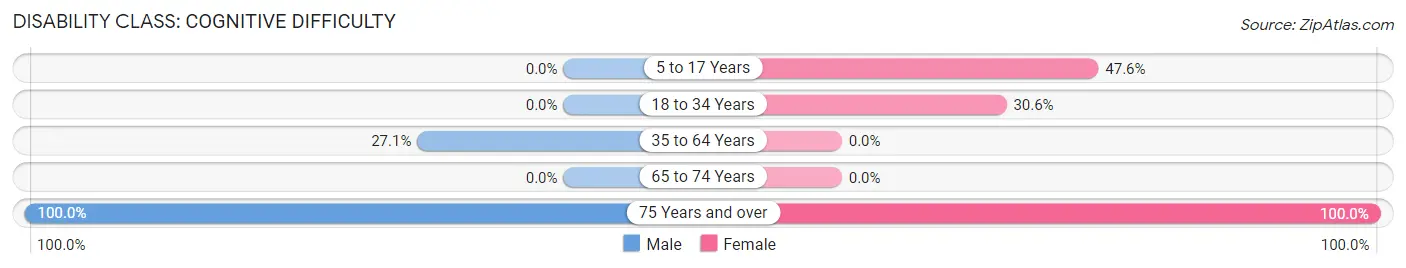
| Age Bracket | Male | Female |
| 5 to 17 Years | 0 (0.0%) | 10 (47.6%) |
| 18 to 34 Years | 0 (0.0%) | 11 (30.6%) |
| 35 to 64 Years | 16 (27.1%) | 0 (0.0%) |
| 65 to 74 Years | 0 (0.0%) | 0 (0.0%) |
| 75 Years and over | 13 (100.0%) | 6 (100.0%) |
Disability Class: Ambulatory Difficulty
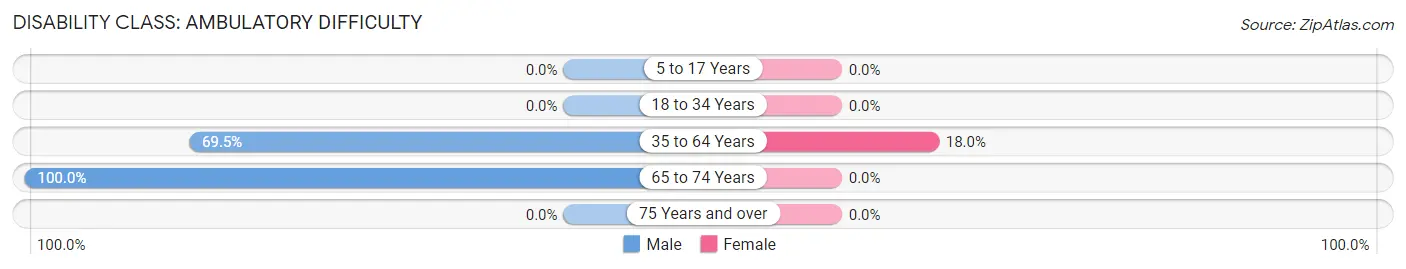
| Age Bracket | Male | Female |
| 5 to 17 Years | 0 (0.0%) | 0 (0.0%) |
| 18 to 34 Years | 0 (0.0%) | 0 (0.0%) |
| 35 to 64 Years | 41 (69.5%) | 9 (18.0%) |
| 65 to 74 Years | 5 (100.0%) | 0 (0.0%) |
| 75 Years and over | 0 (0.0%) | 0 (0.0%) |
Disability Class: Self-Care Difficulty
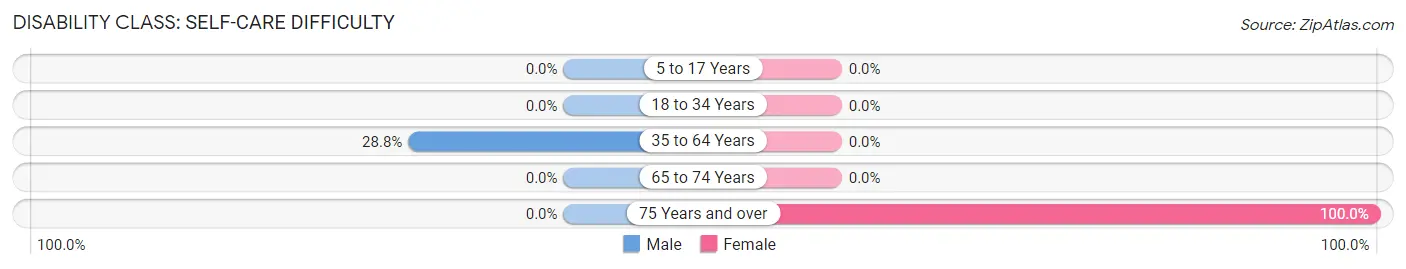
| Age Bracket | Male | Female |
| 5 to 17 Years | 0 (0.0%) | 0 (0.0%) |
| 18 to 34 Years | 0 (0.0%) | 0 (0.0%) |
| 35 to 64 Years | 17 (28.8%) | 0 (0.0%) |
| 65 to 74 Years | 0 (0.0%) | 0 (0.0%) |
| 75 Years and over | 0 (0.0%) | 6 (100.0%) |
Technology Access in Mayersville
Computing Device Access in Mayersville
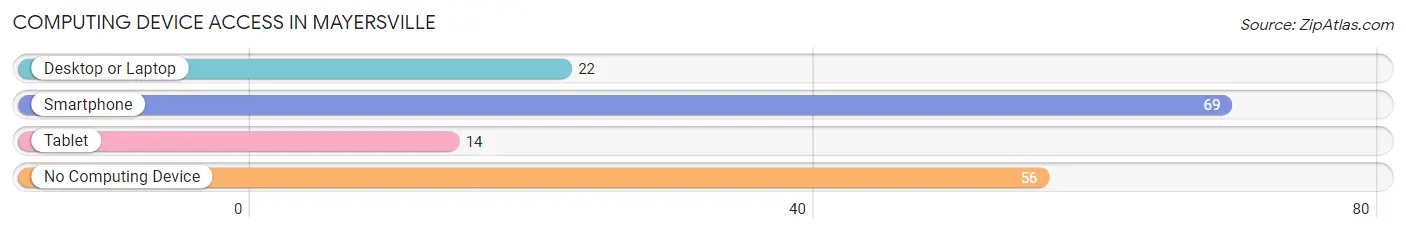
| Device Type | # Households | % Households |
| Desktop or Laptop | 22 | 17.6% |
| Smartphone | 69 | 55.2% |
| Tablet | 14 | 11.2% |
| No Computing Device | 56 | 44.8% |
| Total | 125 | 100.0% |
Internet Access in Mayersville
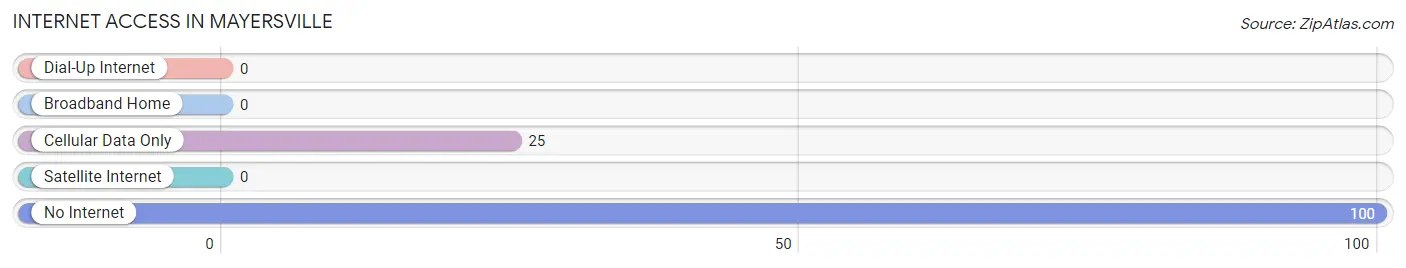
| Internet Type | # Households | % Households |
| Dial-Up Internet | 0 | 0.0% |
| Broadband Home | 0 | 0.0% |
| Cellular Data Only | 25 | 20.0% |
| Satellite Internet | 0 | 0.0% |
| No Internet | 100 | 80.0% |
| Total | 125 | 100.0% |
Mayersville Summary
Mayersville is a small town located in the heart of the Mississippi Delta, in Issaquena County, Mississippi. It is situated on the banks of the Mississippi River, about 25 miles south of Vicksburg. The town was founded in 1837 and named after the Mayers family, who were among the first settlers in the area.
History
Mayersville was founded in 1837 by the Mayers family, who were among the first settlers in the area. The town was originally known as Mayersville Station, as it was a stop on the Mississippi Central Railroad. The town was incorporated in 1848 and the first post office was established in 1849.
The town was a major cotton shipping center during the 19th century, and the population grew rapidly. By the early 20th century, the town had become a center for the lumber industry, with several sawmills located in the area.
In the late 20th century, the town began to decline as the lumber industry moved away and the population decreased. However, the town has seen a resurgence in recent years, with new businesses and industries moving into the area.
Geography
Mayersville is located in the heart of the Mississippi Delta, in Issaquena County, Mississippi. It is situated on the banks of the Mississippi River, about 25 miles south of Vicksburg. The town is surrounded by flat, fertile farmland, and is located in the Yazoo-Mississippi Delta region.
The climate in Mayersville is humid subtropical, with hot, humid summers and mild winters. The average annual temperature is around 70°F (21°C), and the average annual precipitation is around 50 inches (127 cm).
Economy
The economy of Mayersville is largely based on agriculture and forestry. The town is home to several large farms, and the surrounding area is known for its cotton, soybeans, corn, and other crops. The town is also home to several sawmills and lumber companies, which provide jobs for many of the town’s residents.
In addition, the town is home to several small businesses, including restaurants, stores, and other services. The town is also home to a small airport, which provides transportation to and from the area.
Demographics
As of the 2010 census, the population of Mayersville was 1,093. The racial makeup of the town was 79.3% African American, 19.2% White, 0.3% Native American, 0.2% Asian, and 0.9% from other races. The median household income was $25,938, and the median family income was $31,250.
The town is served by the Issaquena County School District, which includes two elementary schools, one middle school, and one high school. The town is also home to a branch of the Mississippi Delta Community College.
Conclusion
Mayersville is a small town located in the heart of the Mississippi Delta, in Issaquena County, Mississippi. It was founded in 1837 and has a long history of agriculture and forestry. The town has seen a resurgence in recent years, with new businesses and industries moving into the area. The population of Mayersville is largely African American, and the town is served by the Issaquena County School District. The town is also home to a small airport, which provides transportation to and from the area.
Common Questions
What is Per Capita Income in Mayersville?
Per Capita income in Mayersville is $10,105.
What is the Median Household income in Mayersville?
Median Household Income in Mayersville is $11,660.
What is Inequality or Gini Index in Mayersville?
Inequality or Gini Index in Mayersville is 0.48.
What is the Total Population of Mayersville?
Total Population of Mayersville is 242.
What is the Total Male Population of Mayersville?
Total Male Population of Mayersville is 115.
What is the Total Female Population of Mayersville?
Total Female Population of Mayersville is 127.
What is the Ratio of Males per 100 Females in Mayersville?
There are 90.55 Males per 100 Females in Mayersville.
What is the Ratio of Females per 100 Males in Mayersville?
There are 110.43 Females per 100 Males in Mayersville.
What is the Median Population Age in Mayersville?
Median Population Age in Mayersville is 43.5 Years.
What is the Average Family Size in Mayersville
Average Family Size in Mayersville is 4.9 People.
What is the Average Household Size in Mayersville
Average Household Size in Mayersville is 1.9 People.
How Large is the Labor Force in Mayersville?
There are 46 People in the Labor Forcein in Mayersville.
What is the Percentage of People in the Labor Force in Mayersville?
22.2% of People are in the Labor Force in Mayersville.
What is the Unemployment Rate in Mayersville?
Unemployment Rate in Mayersville is 54.3%.