Winstonville, MS Map & Demographics
Winstonville Map
Winstonville Overview
$20,075
PER CAPITA INCOME
$61,250
AVG FAMILY INCOME
$50,000
AVG HOUSEHOLD INCOME
0.33
INEQUALITY / GINI INDEX
105
TOTAL POPULATION
57
MALE POPULATION
48
FEMALE POPULATION
118.75
MALES / 100 FEMALES
84.21
FEMALES / 100 MALES
51.5
MEDIAN AGE
2.9
AVG FAMILY SIZE
2.8
AVG HOUSEHOLD SIZE
48
LABOR FORCE [ PEOPLE ]
50.5%
PERCENT IN LABOR FORCE
Winstonville Zip Codes
Winstonville Area Codes
Income in Winstonville
Income Overview in Winstonville
Per Capita Income in Winstonville is $20,075, while median incomes of families and households are $61,250 and $50,000 respectively.
| Characteristic | Number | Measure |
| Per Capita Income | 105 | $20,075 |
| Median Family Income | 34 | $61,250 |
| Mean Family Income | 34 | $57,453 |
| Median Household Income | 38 | $50,000 |
| Mean Household Income | 38 | $53,061 |
| Income Deficit | 34 | $0 |
| Wage / Income Gap (%) | 105 | 0.00% |
| Wage / Income Gap ($) | 105 | 100.00¢ per $1 |
| Gini / Inequality Index | 105 | 0.33 |
Earnings by Sex in Winstonville
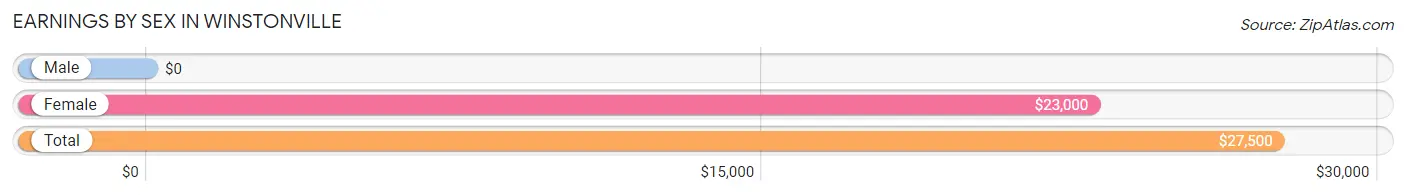
| Sex | Number | Average Earnings |
| Male | 26 (54.2%) | $0 |
| Female | 22 (45.8%) | $23,000 |
| Total | 48 (100.0%) | $27,500 |
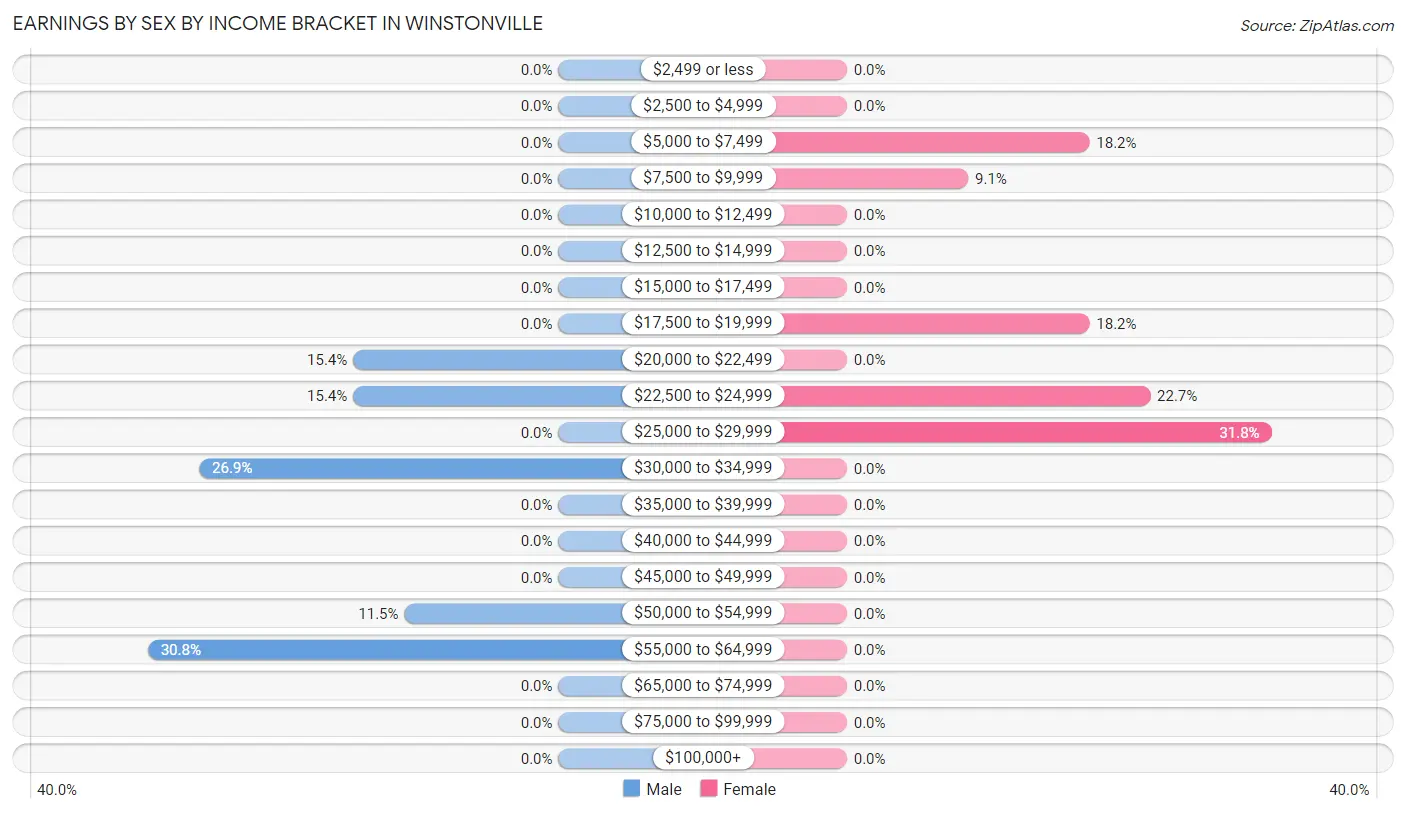
Earnings by Sex by Income Bracket in Winstonville
The most common earnings brackets in Winstonville are $55,000 to $64,999 for men (8 | 30.8%) and $25,000 to $29,999 for women (7 | 31.8%).
| Income | Male | Female |
| $2,499 or less | 0 (0.0%) | 0 (0.0%) |
| $2,500 to $4,999 | 0 (0.0%) | 0 (0.0%) |
| $5,000 to $7,499 | 0 (0.0%) | 4 (18.2%) |
| $7,500 to $9,999 | 0 (0.0%) | 2 (9.1%) |
| $10,000 to $12,499 | 0 (0.0%) | 0 (0.0%) |
| $12,500 to $14,999 | 0 (0.0%) | 0 (0.0%) |
| $15,000 to $17,499 | 0 (0.0%) | 0 (0.0%) |
| $17,500 to $19,999 | 0 (0.0%) | 4 (18.2%) |
| $20,000 to $22,499 | 4 (15.4%) | 0 (0.0%) |
| $22,500 to $24,999 | 4 (15.4%) | 5 (22.7%) |
| $25,000 to $29,999 | 0 (0.0%) | 7 (31.8%) |
| $30,000 to $34,999 | 7 (26.9%) | 0 (0.0%) |
| $35,000 to $39,999 | 0 (0.0%) | 0 (0.0%) |
| $40,000 to $44,999 | 0 (0.0%) | 0 (0.0%) |
| $45,000 to $49,999 | 0 (0.0%) | 0 (0.0%) |
| $50,000 to $54,999 | 3 (11.5%) | 0 (0.0%) |
| $55,000 to $64,999 | 8 (30.8%) | 0 (0.0%) |
| $65,000 to $74,999 | 0 (0.0%) | 0 (0.0%) |
| $75,000 to $99,999 | 0 (0.0%) | 0 (0.0%) |
| $100,000+ | 0 (0.0%) | 0 (0.0%) |
| Total | 26 (100.0%) | 22 (100.0%) |
Earnings by Sex by Educational Attainment in Winstonville
| Educational Attainment | Male Income | Female Income |
| Less than High School | - | - |
| High School Diploma | - | - |
| College or Associate's Degree | - | - |
| Bachelor's Degree | - | - |
| Graduate Degree | - | - |
| Total | $53,750 | $23,000 |
Family Income in Winstonville
Family Income Brackets in Winstonville
According to the Winstonville family income data, there are 14 families falling into the $75,000 to $99,999 income range, which is the most common income bracket and makes up 41.2% of all families.
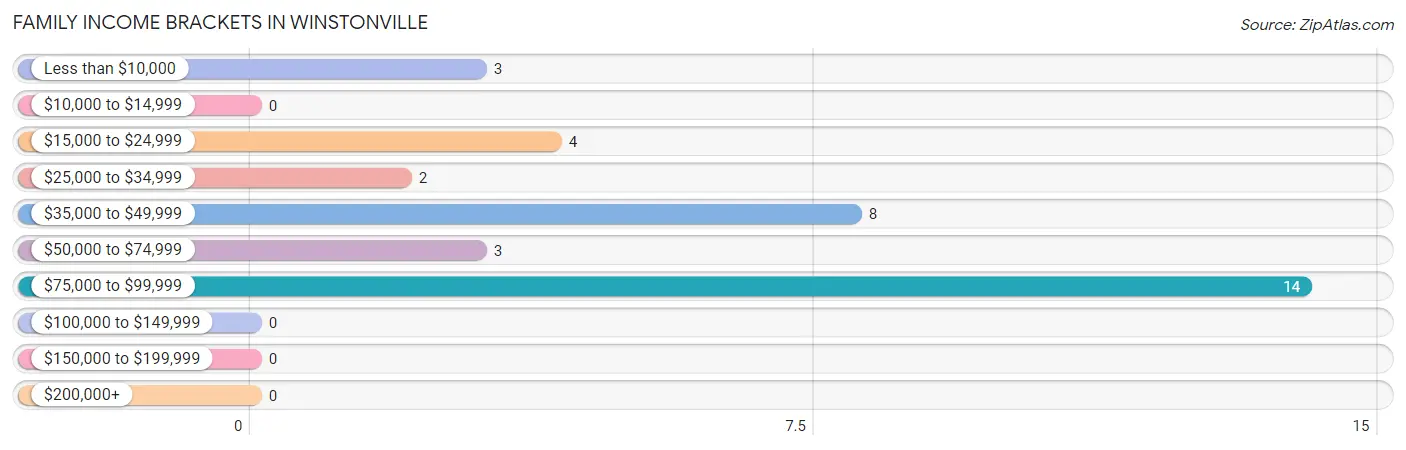
| Income Bracket | # Families | % Families |
| Less than $10,000 | 3 | 8.8% |
| $10,000 to $14,999 | 0 | 0.0% |
| $15,000 to $24,999 | 4 | 11.8% |
| $25,000 to $34,999 | 2 | 5.9% |
| $35,000 to $49,999 | 8 | 23.5% |
| $50,000 to $74,999 | 3 | 8.8% |
| $75,000 to $99,999 | 14 | 41.2% |
| $100,000 to $149,999 | 0 | 0.0% |
| $150,000 to $199,999 | 0 | 0.0% |
| $200,000+ | 0 | 0.0% |
Family Income by Famaliy Size in Winstonville
| Income Bracket | # Families | Median Income |
| 2-Person Families | 25 (73.5%) | $0 |
| 3-Person Families | 4 (11.8%) | $0 |
| 4-Person Families | 4 (11.8%) | $0 |
| 5-Person Families | 1 (2.9%) | $0 |
| 6-Person Families | 0 (0.0%) | $0 |
| 7+ Person Families | 0 (0.0%) | $0 |
| Total | 34 (100.0%) | $61,250 |
Family Income by Number of Earners in Winstonville
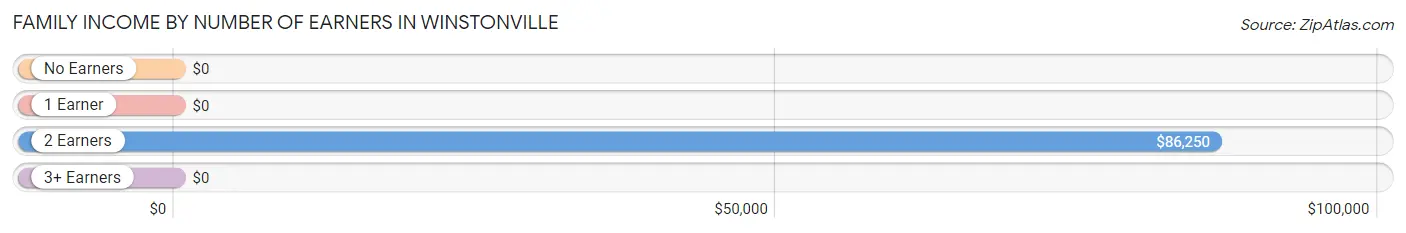
| Number of Earners | # Families | Median Income |
| No Earners | 12 (35.3%) | $0 |
| 1 Earner | 3 (8.8%) | $0 |
| 2 Earners | 19 (55.9%) | $86,250 |
| 3+ Earners | 0 (0.0%) | $0 |
| Total | 34 (100.0%) | $61,250 |
Household Income in Winstonville
Household Income Brackets in Winstonville
With 14 households falling in the category, the $75,000 to $99,999 income range is the most frequent in Winstonville, accounting for 36.8% of all households.
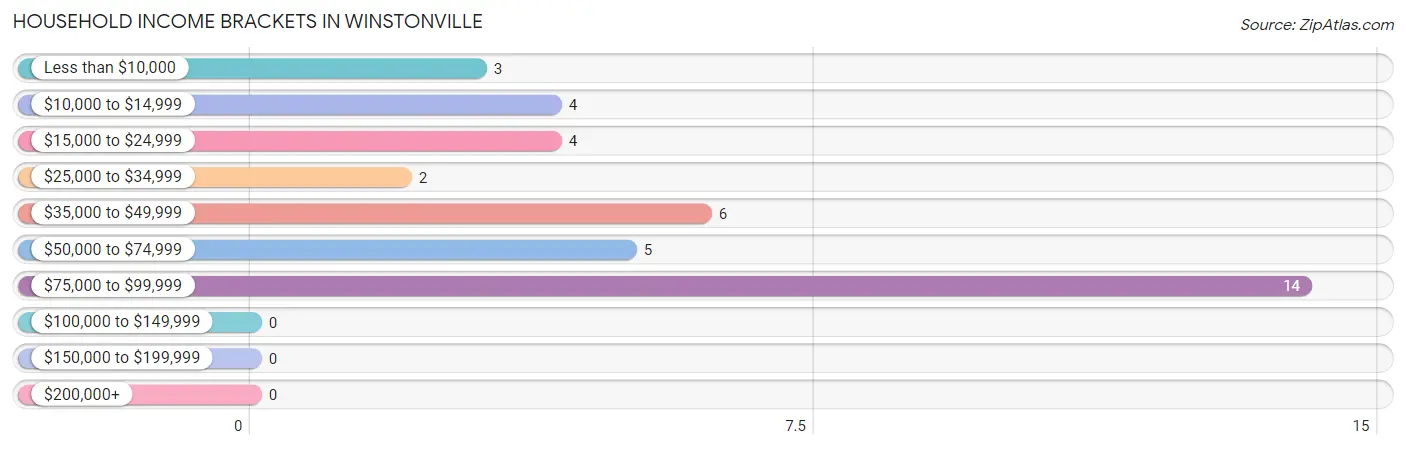
| Income Bracket | # Households | % Households |
| Less than $10,000 | 3 | 7.9% |
| $10,000 to $14,999 | 4 | 10.5% |
| $15,000 to $24,999 | 4 | 10.5% |
| $25,000 to $34,999 | 2 | 5.3% |
| $35,000 to $49,999 | 6 | 15.8% |
| $50,000 to $74,999 | 5 | 13.2% |
| $75,000 to $99,999 | 14 | 36.8% |
| $100,000 to $149,999 | 0 | 0.0% |
| $150,000 to $199,999 | 0 | 0.0% |
| $200,000+ | 0 | 0.0% |
Household Income by Householder Age in Winstonville
The median household income in Winstonville is $50,000, with the highest median household income of $56,875 found in the 65+ years age bracket for the primary householder. A total of 7 households (18.4%) fall into this category.
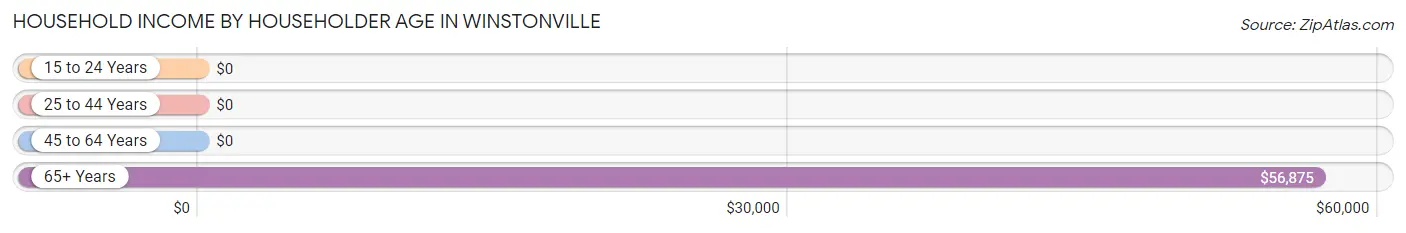
| Income Bracket | # Households | Median Income |
| 15 to 24 Years | 0 (0.0%) | $0 |
| 25 to 44 Years | 10 (26.3%) | $0 |
| 45 to 64 Years | 21 (55.3%) | $0 |
| 65+ Years | 7 (18.4%) | $56,875 |
| Total | 38 (100.0%) | $50,000 |
Poverty in Winstonville
Income Below Poverty by Sex and Age in Winstonville
With 21.0% poverty level for males and 37.5% for females among the residents of Winstonville, 55 to 64 year old males and 75 year old and over females are the most vulnerable to poverty, with 4 males (50.0%) and 7 females (100.0%) in their respective age groups living below the poverty level.
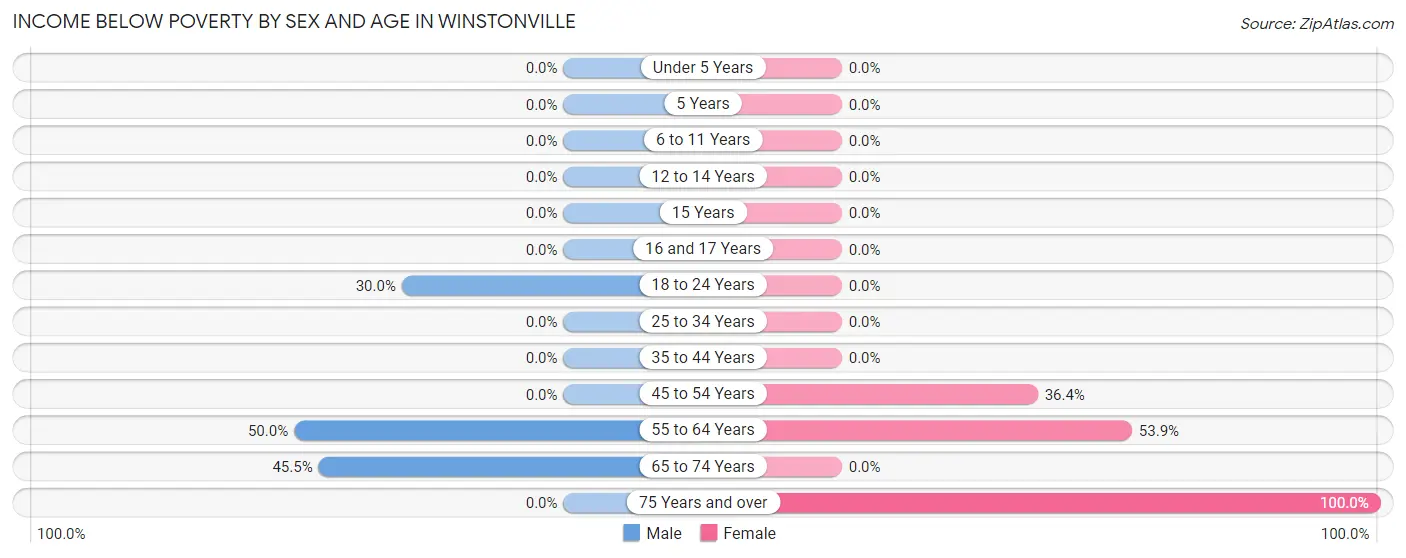
| Age Bracket | Male | Female |
| Under 5 Years | 0 (0.0%) | 0 (0.0%) |
| 5 Years | 0 (0.0%) | 0 (0.0%) |
| 6 to 11 Years | 0 (0.0%) | 0 (0.0%) |
| 12 to 14 Years | 0 (0.0%) | 0 (0.0%) |
| 15 Years | 0 (0.0%) | 0 (0.0%) |
| 16 and 17 Years | 0 (0.0%) | 0 (0.0%) |
| 18 to 24 Years | 3 (30.0%) | 0 (0.0%) |
| 25 to 34 Years | 0 (0.0%) | 0 (0.0%) |
| 35 to 44 Years | 0 (0.0%) | 0 (0.0%) |
| 45 to 54 Years | 0 (0.0%) | 4 (36.4%) |
| 55 to 64 Years | 4 (50.0%) | 7 (53.8%) |
| 65 to 74 Years | 5 (45.5%) | 0 (0.0%) |
| 75 Years and over | 0 (0.0%) | 7 (100.0%) |
| Total | 12 (21.0%) | 18 (37.5%) |
Income Above Poverty by Sex and Age in Winstonville
According to the poverty statistics in Winstonville, males aged 12 to 14 years and females aged 16 and 17 years are the age groups that are most secure financially, with 100.0% of males and 100.0% of females in these age groups living above the poverty line.
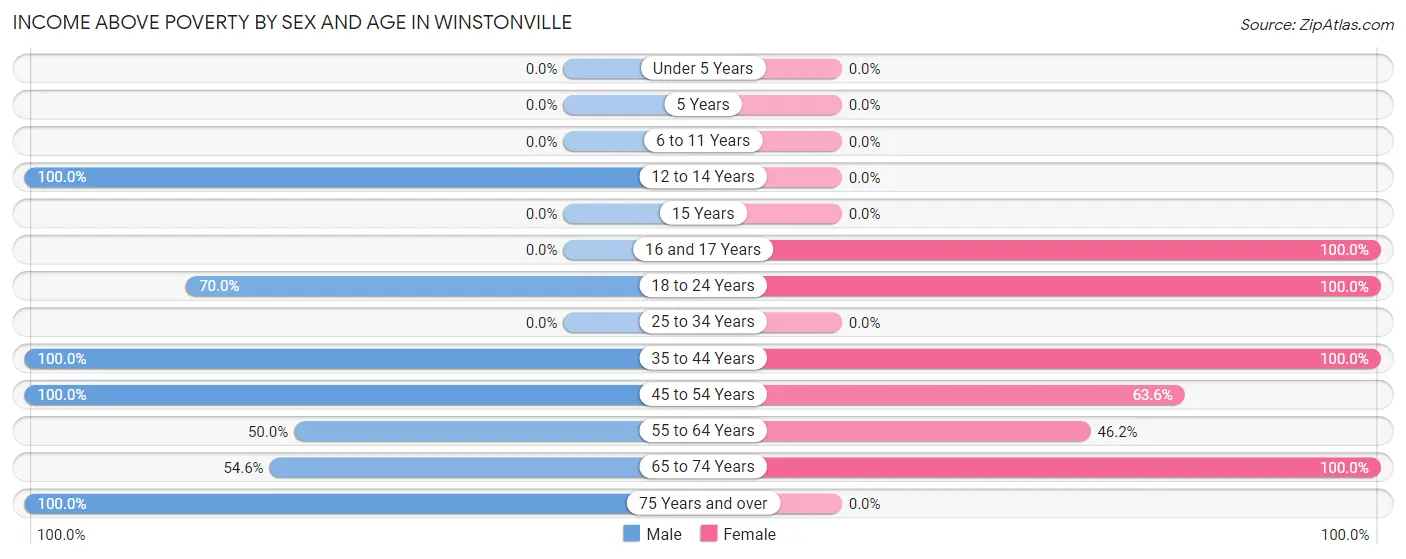
| Age Bracket | Male | Female |
| Under 5 Years | 0 (0.0%) | 0 (0.0%) |
| 5 Years | 0 (0.0%) | 0 (0.0%) |
| 6 to 11 Years | 0 (0.0%) | 0 (0.0%) |
| 12 to 14 Years | 10 (100.0%) | 0 (0.0%) |
| 15 Years | 0 (0.0%) | 0 (0.0%) |
| 16 and 17 Years | 0 (0.0%) | 6 (100.0%) |
| 18 to 24 Years | 7 (70.0%) | 2 (100.0%) |
| 25 to 34 Years | 0 (0.0%) | 0 (0.0%) |
| 35 to 44 Years | 12 (100.0%) | 6 (100.0%) |
| 45 to 54 Years | 4 (100.0%) | 7 (63.6%) |
| 55 to 64 Years | 4 (50.0%) | 6 (46.2%) |
| 65 to 74 Years | 6 (54.5%) | 3 (100.0%) |
| 75 Years and over | 2 (100.0%) | 0 (0.0%) |
| Total | 45 (78.9%) | 30 (62.5%) |
Income Below Poverty Among Married-Couple Families in Winstonville
The poverty statistics for married-couple families in Winstonville show that 18.2% or 4 of the total 22 families live below the poverty line. Families with no children have the highest poverty rate of 23.5%, comprising of 4 families. On the other hand, families with 1 or 2 children have the lowest poverty rate of 0.0%, which includes 0 families.
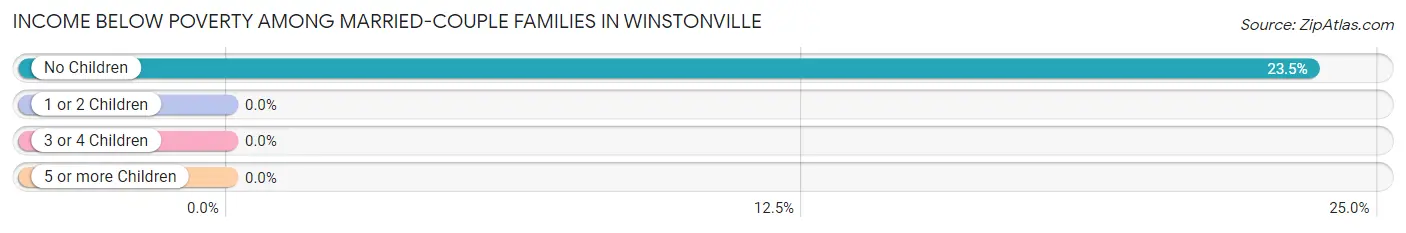
| Children | Above Poverty | Below Poverty |
| No Children | 13 (76.5%) | 4 (23.5%) |
| 1 or 2 Children | 5 (100.0%) | 0 (0.0%) |
| 3 or 4 Children | 0 (0.0%) | 0 (0.0%) |
| 5 or more Children | 0 (0.0%) | 0 (0.0%) |
| Total | 18 (81.8%) | 4 (18.2%) |
Income Below Poverty Among Single-Parent Households in Winstonville
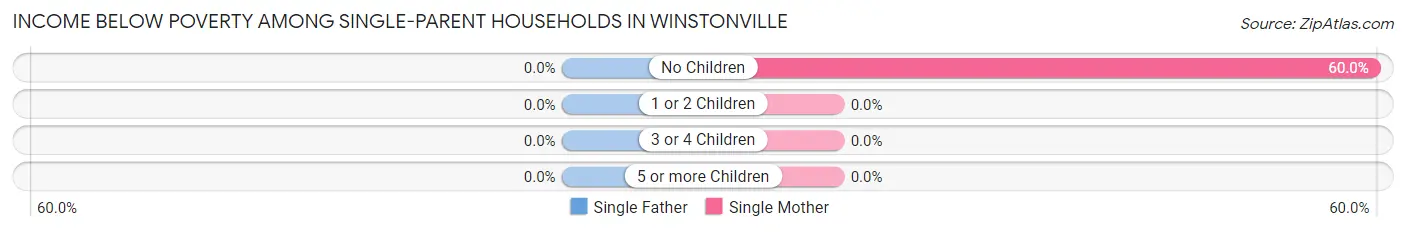
| Children | Single Father | Single Mother |
| No Children | 0 (0.0%) | 3 (60.0%) |
| 1 or 2 Children | 0 (0.0%) | 0 (0.0%) |
| 3 or 4 Children | 0 (0.0%) | 0 (0.0%) |
| 5 or more Children | 0 (0.0%) | 0 (0.0%) |
| Total | 0 (0.0%) | 3 (60.0%) |
Income Below Poverty Among Married-Couple vs Single-Parent Households in Winstonville
The poverty data for Winstonville shows that 4 of the married-couple family households (18.2%) and 3 of the single-parent households (25.0%) are living below the poverty level. Within the married-couple family households, those with no children have the highest poverty rate, with 4 households (23.5%) falling below the poverty line. Among the single-parent households, those with no children have the highest poverty rate, with 3 household (30.0%) living below poverty.
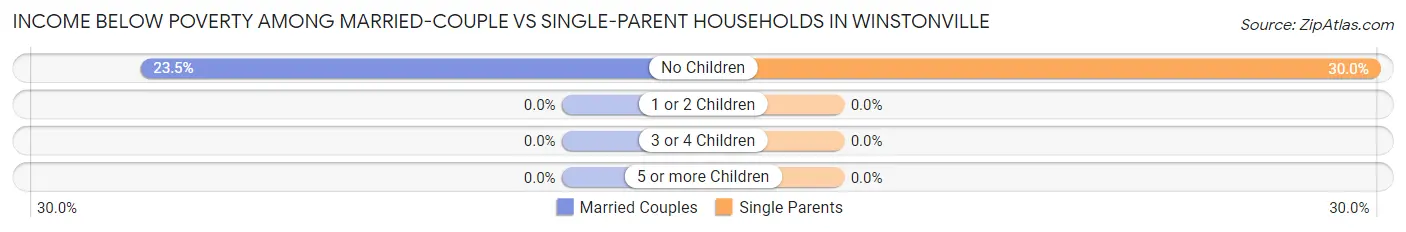
| Children | Married-Couple Families | Single-Parent Households |
| No Children | 4 (23.5%) | 3 (30.0%) |
| 1 or 2 Children | 0 (0.0%) | 0 (0.0%) |
| 3 or 4 Children | 0 (0.0%) | 0 (0.0%) |
| 5 or more Children | 0 (0.0%) | 0 (0.0%) |
| Total | 4 (18.2%) | 3 (25.0%) |
Race in Winstonville
The most populous races in Winstonville are Black / African American (104 | 99.1%), and Some other Race (1 | 0.9%).
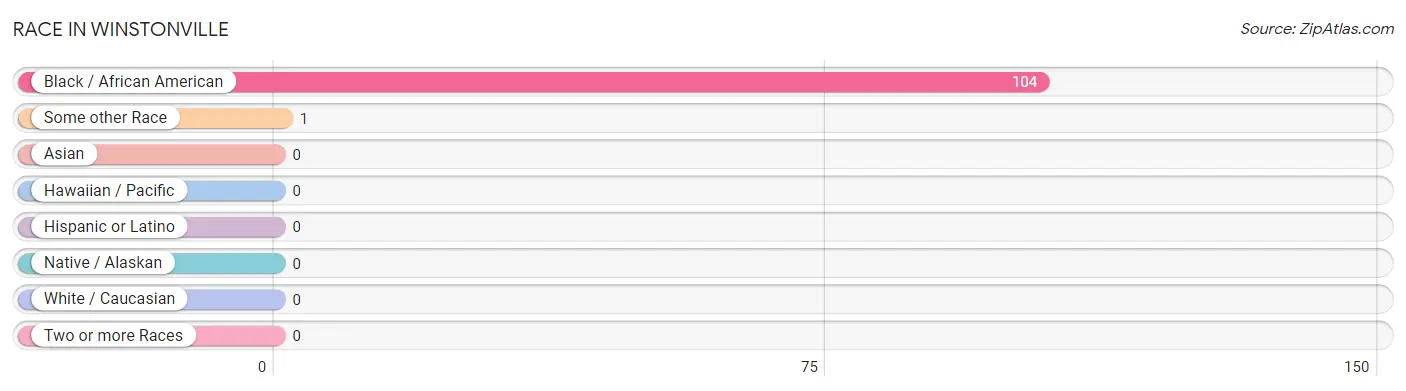
| Race | # Population | % Population |
| Asian | 0 | 0.0% |
| Black / African American | 104 | 99.1% |
| Hawaiian / Pacific | 0 | 0.0% |
| Hispanic or Latino | 0 | 0.0% |
| Native / Alaskan | 0 | 0.0% |
| White / Caucasian | 0 | 0.0% |
| Two or more Races | 0 | 0.0% |
| Some other Race | 1 | 0.9% |
| Total | 105 | 100.0% |
Ancestry in Winstonville
The most populous ancestries reported in Winstonville are , and American (18 | 17.1%), together accounting for 17.1% of all Winstonville residents.

| Ancestry | # Population | % Population |
| American | 18 | 17.1% | View All 1 Rows |
Immigrants in Winstonville

| Immigration Origin | # Population | % Population | View All 0 Rows |
Sex and Age in Winstonville
Sex and Age in Winstonville
The most populous age groups in Winstonville are 35 to 39 Years (12 | 21.0%) for men and 50 to 54 Years (8 | 16.7%) for women.
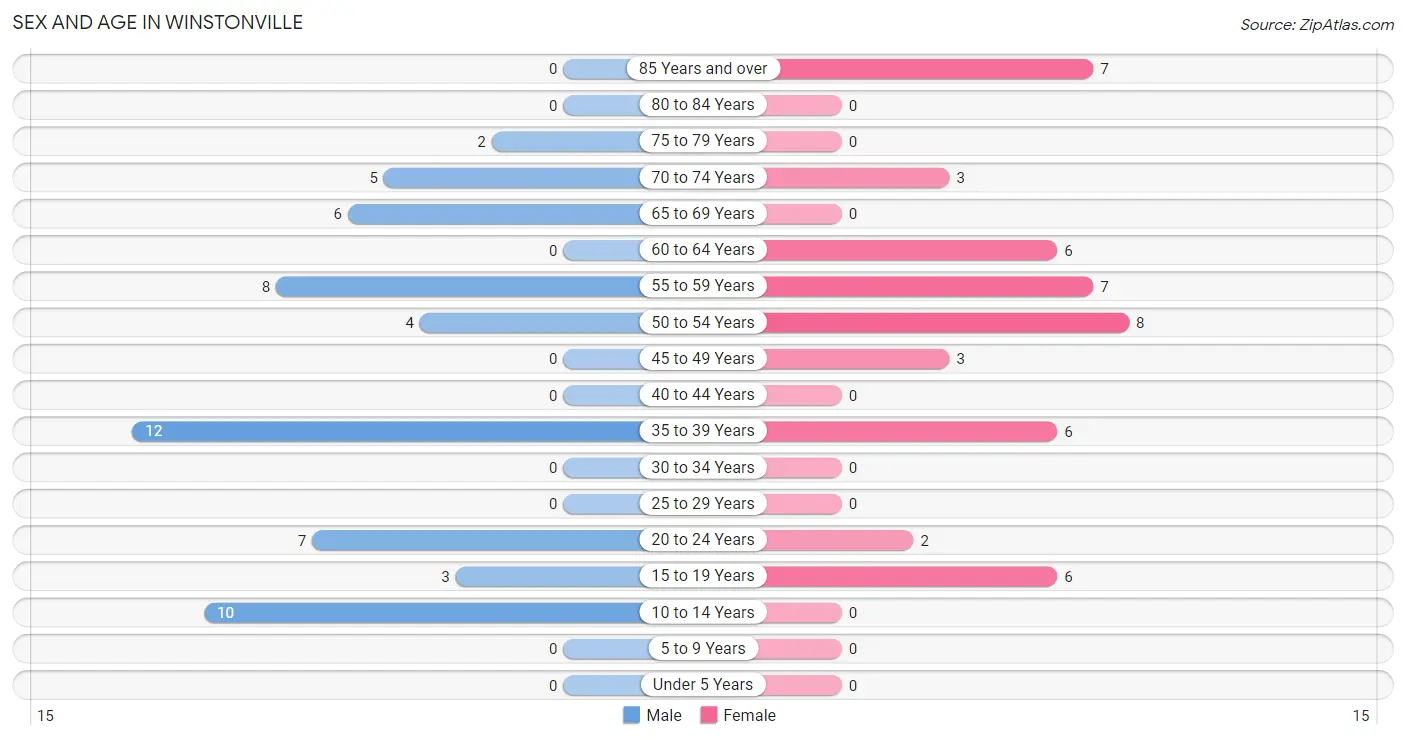
| Age Bracket | Male | Female |
| Under 5 Years | 0 (0.0%) | 0 (0.0%) |
| 5 to 9 Years | 0 (0.0%) | 0 (0.0%) |
| 10 to 14 Years | 10 (17.5%) | 0 (0.0%) |
| 15 to 19 Years | 3 (5.3%) | 6 (12.5%) |
| 20 to 24 Years | 7 (12.3%) | 2 (4.2%) |
| 25 to 29 Years | 0 (0.0%) | 0 (0.0%) |
| 30 to 34 Years | 0 (0.0%) | 0 (0.0%) |
| 35 to 39 Years | 12 (21.0%) | 6 (12.5%) |
| 40 to 44 Years | 0 (0.0%) | 0 (0.0%) |
| 45 to 49 Years | 0 (0.0%) | 3 (6.2%) |
| 50 to 54 Years | 4 (7.0%) | 8 (16.7%) |
| 55 to 59 Years | 8 (14.0%) | 7 (14.6%) |
| 60 to 64 Years | 0 (0.0%) | 6 (12.5%) |
| 65 to 69 Years | 6 (10.5%) | 0 (0.0%) |
| 70 to 74 Years | 5 (8.8%) | 3 (6.2%) |
| 75 to 79 Years | 2 (3.5%) | 0 (0.0%) |
| 80 to 84 Years | 0 (0.0%) | 0 (0.0%) |
| 85 Years and over | 0 (0.0%) | 7 (14.6%) |
| Total | 57 (100.0%) | 48 (100.0%) |
Families and Households in Winstonville
Median Family Size in Winstonville
The median family size in Winstonville is 2.85 persons per family, with single male/father families (7 | 20.6%) accounting for the largest median family size of 3.14 persons per family. On the other hand, single female/mother families (5 | 14.7%) represent the smallest median family size with 2.40 persons per family.
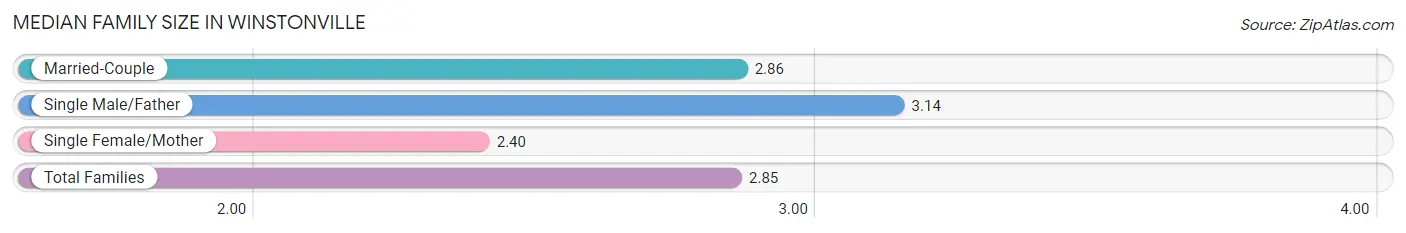
| Family Type | # Families | Family Size |
| Married-Couple | 22 (64.7%) | 2.86 |
| Single Male/Father | 7 (20.6%) | 3.14 |
| Single Female/Mother | 5 (14.7%) | 2.40 |
| Total Families | 34 (100.0%) | 2.85 |
Median Household Size in Winstonville
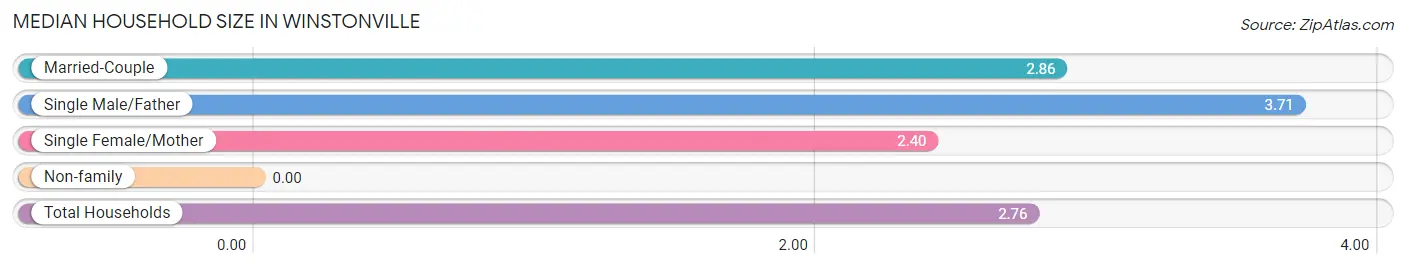
| Household Type | # Households | Household Size |
| Married-Couple | 22 (57.9%) | 2.86 |
| Single Male/Father | 7 (18.4%) | 3.71 |
| Single Female/Mother | 5 (13.2%) | 2.40 |
| Non-family | 4 (10.5%) | - |
| Total Households | 38 (100.0%) | 2.76 |
Household Size by Marriage Status in Winstonville
Out of a total of 38 households in Winstonville, 34 (89.5%) are family households, while 4 (10.5%) are nonfamily households. The most numerous type of family households are 2-person households, comprising 23, and the most common type of nonfamily households are 1-person households, comprising 4.
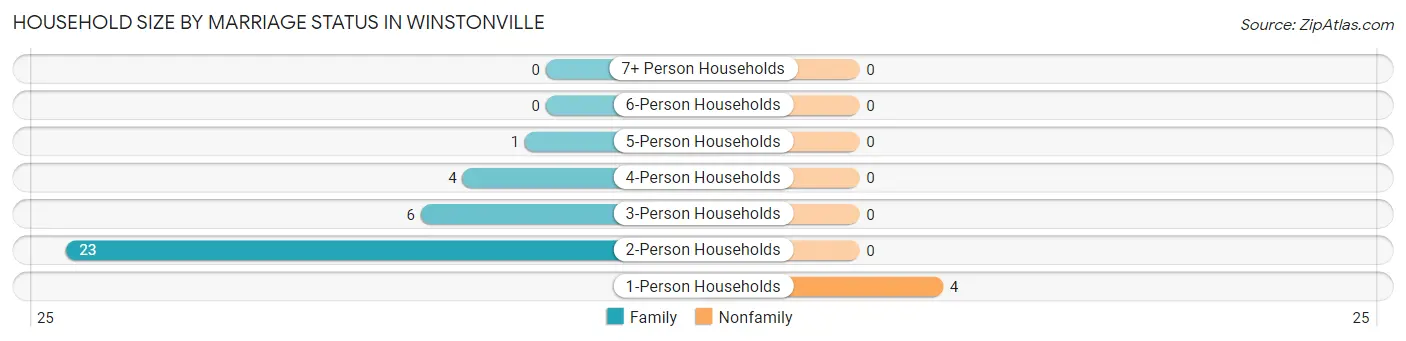
| Household Size | Family Households | Nonfamily Households |
| 1-Person Households | - | 4 (10.5%) |
| 2-Person Households | 23 (60.5%) | 0 (0.0%) |
| 3-Person Households | 6 (15.8%) | 0 (0.0%) |
| 4-Person Households | 4 (10.5%) | 0 (0.0%) |
| 5-Person Households | 1 (2.6%) | 0 (0.0%) |
| 6-Person Households | 0 (0.0%) | 0 (0.0%) |
| 7+ Person Households | 0 (0.0%) | 0 (0.0%) |
| Total | 34 (89.5%) | 4 (10.5%) |
Female Fertility in Winstonville
Fertility by Age in Winstonville
Average fertility rate in Winstonville is 56.0 births per 1,000 women. Women in the age bracket of 35 to 50 years have the highest fertility rate with 100.0 births per 1,000 women. Women in the age bracket of 35 to 50 years acount for 100.0% of all women with births.
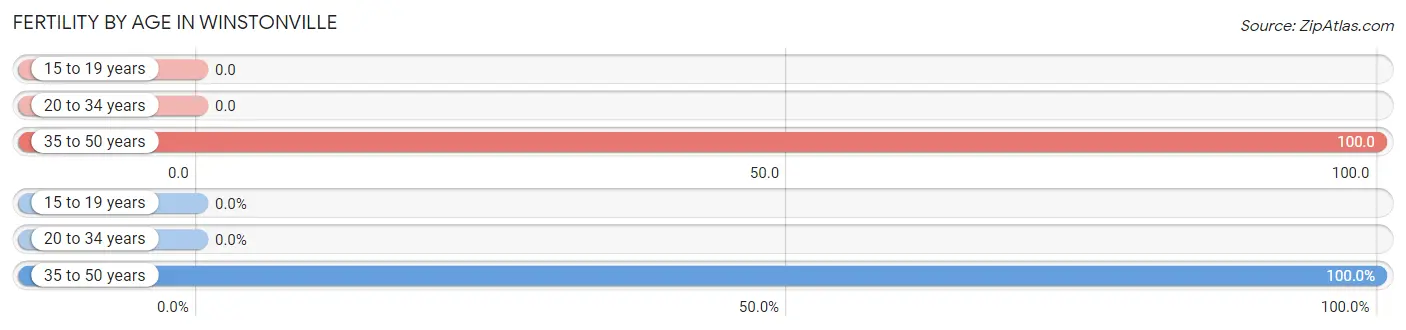
| Age Bracket | Women with Births | Births / 1,000 Women |
| 15 to 19 years | 0 (0.0%) | 0.0 |
| 20 to 34 years | 0 (0.0%) | 0.0 |
| 35 to 50 years | 1 (100.0%) | 100.0 |
| Total | 1 (100.0%) | 56.0 |
Fertility by Age by Marriage Status in Winstonville
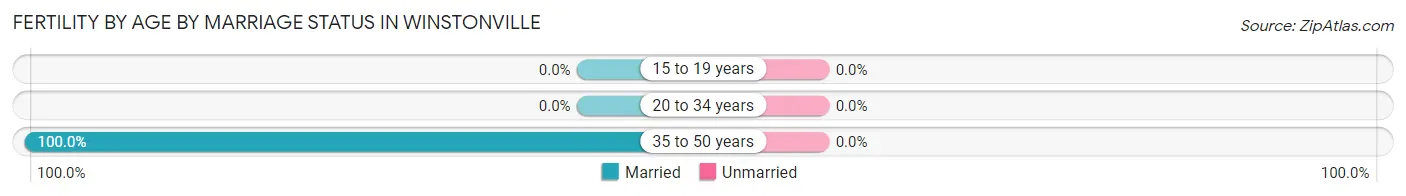
| Age Bracket | Married | Unmarried |
| 15 to 19 years | 0 (0.0%) | 0 (0.0%) |
| 20 to 34 years | 0 (0.0%) | 0 (0.0%) |
| 35 to 50 years | 1 (100.0%) | 0 (0.0%) |
| Total | 1 (100.0%) | 0 (0.0%) |
Fertility by Education in Winstonville
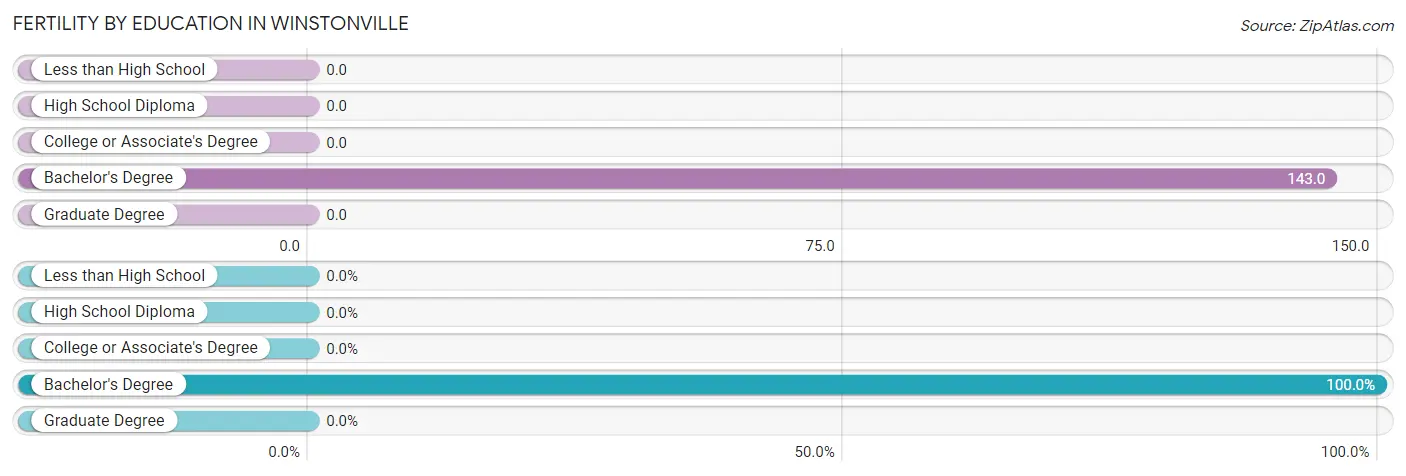
| Educational Attainment | Women with Births | Births / 1,000 Women |
| Less than High School | 0 (0.0%) | 0.0 |
| High School Diploma | 0 (0.0%) | 0.0 |
| College or Associate's Degree | 0 (0.0%) | 0.0 |
| Bachelor's Degree | 1 (100.0%) | 143.0 |
| Graduate Degree | 0 (0.0%) | 0.0 |
| Total | 1 (100.0%) | 56.0 |
Fertility by Education by Marriage Status in Winstonville
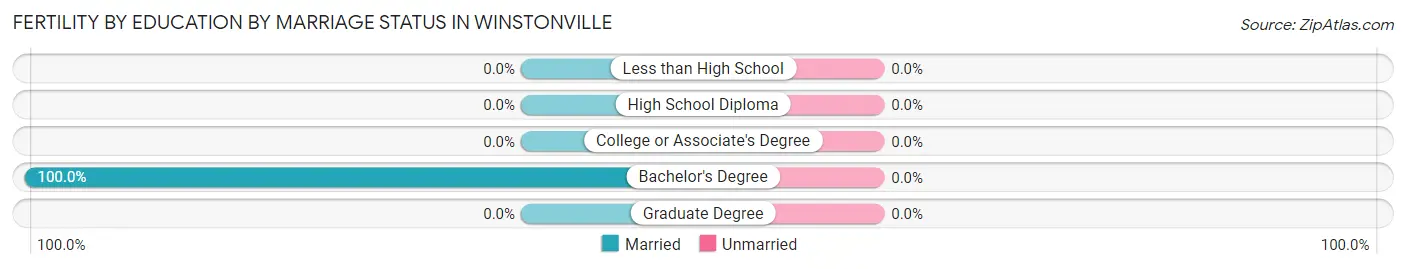
| Educational Attainment | Married | Unmarried |
| Less than High School | 0 (0.0%) | 0 (0.0%) |
| High School Diploma | 0 (0.0%) | 0 (0.0%) |
| College or Associate's Degree | 0 (0.0%) | 0 (0.0%) |
| Bachelor's Degree | 1 (100.0%) | 0 (0.0%) |
| Graduate Degree | 0 (0.0%) | 0 (0.0%) |
| Total | 1 (100.0%) | 0 (0.0%) |
Employment Characteristics in Winstonville
Employment by Class of Employer in Winstonville
Among the 48 employed individuals in Winstonville, private company employees (33 | 68.8%), and state government employees (15 | 31.2%) make up the most common classes of employment.
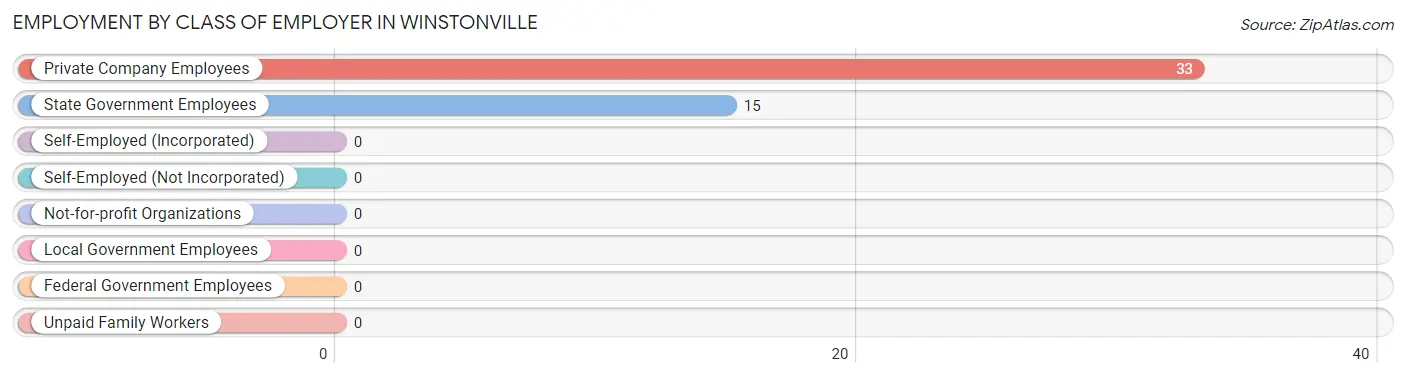
| Employer Class | # Employees | % Employees |
| Private Company Employees | 33 | 68.8% |
| Self-Employed (Incorporated) | 0 | 0.0% |
| Self-Employed (Not Incorporated) | 0 | 0.0% |
| Not-for-profit Organizations | 0 | 0.0% |
| Local Government Employees | 0 | 0.0% |
| State Government Employees | 15 | 31.2% |
| Federal Government Employees | 0 | 0.0% |
| Unpaid Family Workers | 0 | 0.0% |
| Total | 48 | 100.0% |
Employment Status by Age in Winstonville
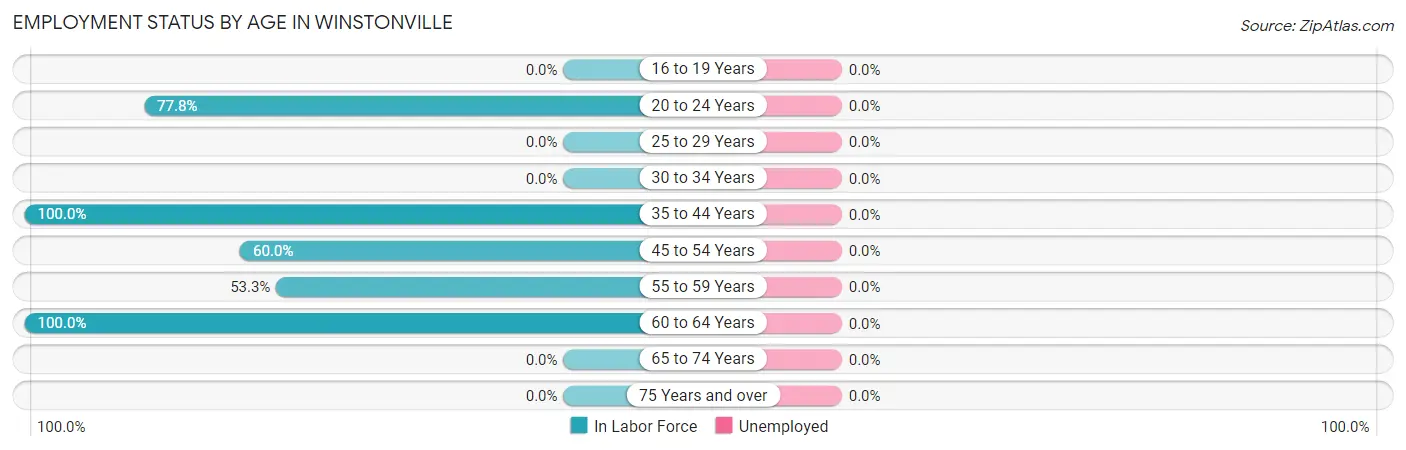
| Age Bracket | In Labor Force | Unemployed |
| 16 to 19 Years | 0 (0.0%) | 0 (0.0%) |
| 20 to 24 Years | 7 (77.8%) | 0 (0.0%) |
| 25 to 29 Years | 0 (0.0%) | 0 (0.0%) |
| 30 to 34 Years | 0 (0.0%) | 0 (0.0%) |
| 35 to 44 Years | 18 (100.0%) | 0 (0.0%) |
| 45 to 54 Years | 9 (60.0%) | 0 (0.0%) |
| 55 to 59 Years | 8 (53.3%) | 0 (0.0%) |
| 60 to 64 Years | 6 (100.0%) | 0 (0.0%) |
| 65 to 74 Years | 0 (0.0%) | 0 (0.0%) |
| 75 Years and over | 0 (0.0%) | 0 (0.0%) |
| Total | 48 (50.5%) | 0 (0.0%) |
Employment Status by Educational Attainment in Winstonville
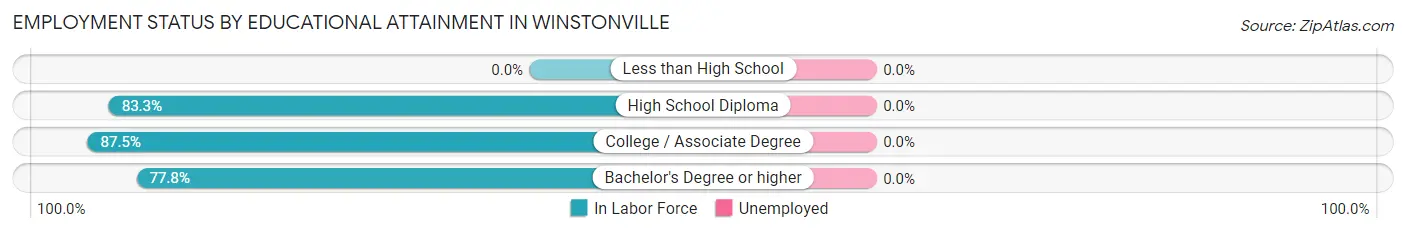
| Educational Attainment | In Labor Force | Unemployed |
| Less than High School | 0 (0.0%) | 0 (0.0%) |
| High School Diploma | 20 (83.3%) | 0 (0.0%) |
| College / Associate Degree | 7 (87.5%) | 0 (0.0%) |
| Bachelor's Degree or higher | 14 (77.8%) | 0 (0.0%) |
| Total | 41 (75.9%) | 0 (0.0%) |
Employment Occupations by Sex in Winstonville
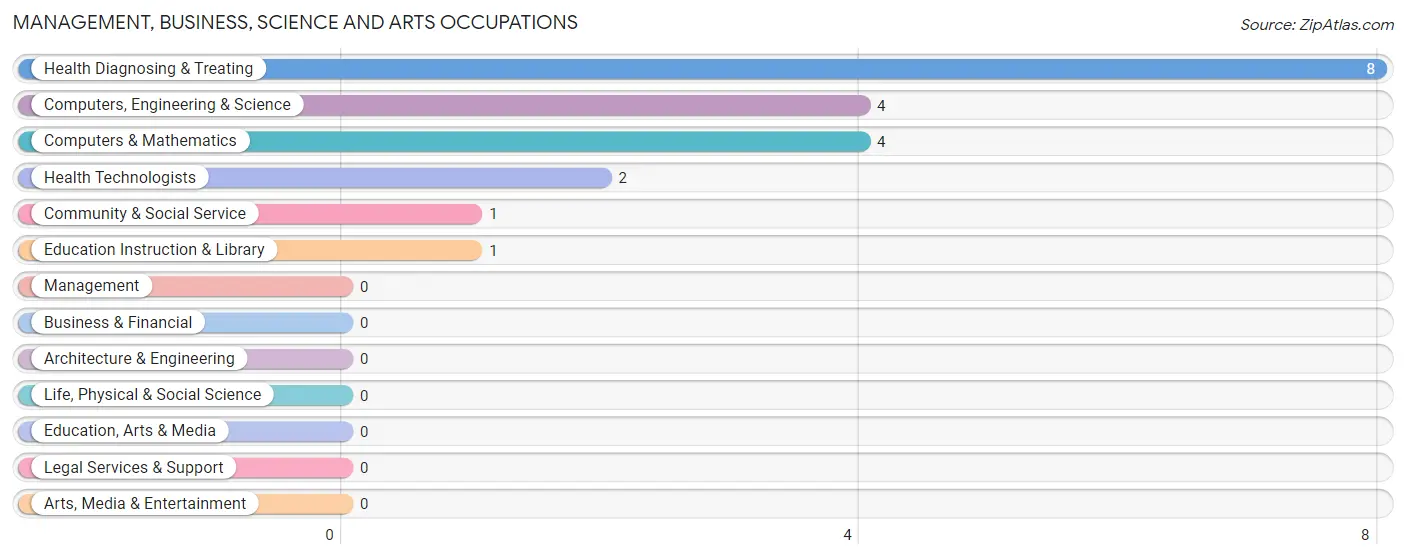
Management, Business, Science and Arts Occupations
The most common Management, Business, Science and Arts occupations in Winstonville are Health Diagnosing & Treating (8 | 16.7%), Computers, Engineering & Science (4 | 8.3%), Computers & Mathematics (4 | 8.3%), Health Technologists (2 | 4.2%), and Community & Social Service (1 | 2.1%).
Management, Business, Science and Arts Occupations by Sex
Within the Management, Business, Science and Arts occupations in Winstonville, the most male-oriented occupations are Computers, Engineering & Science (100.0%), and Computers & Mathematics (100.0%), while the most female-oriented occupations are Community & Social Service (100.0%), Education Instruction & Library (100.0%), and Health Diagnosing & Treating (100.0%).
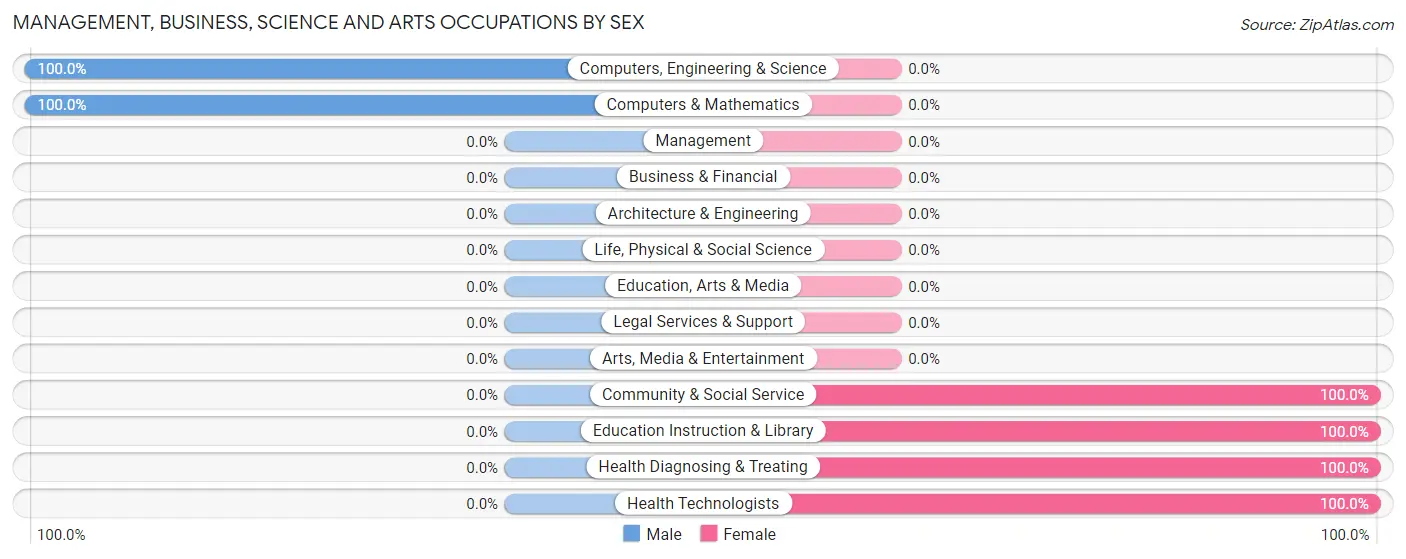
| Occupation | Male | Female |
| Management | 0 (0.0%) | 0 (0.0%) |
| Business & Financial | 0 (0.0%) | 0 (0.0%) |
| Computers, Engineering & Science | 4 (100.0%) | 0 (0.0%) |
| Computers & Mathematics | 4 (100.0%) | 0 (0.0%) |
| Architecture & Engineering | 0 (0.0%) | 0 (0.0%) |
| Life, Physical & Social Science | 0 (0.0%) | 0 (0.0%) |
| Community & Social Service | 0 (0.0%) | 1 (100.0%) |
| Education, Arts & Media | 0 (0.0%) | 0 (0.0%) |
| Legal Services & Support | 0 (0.0%) | 0 (0.0%) |
| Education Instruction & Library | 0 (0.0%) | 1 (100.0%) |
| Arts, Media & Entertainment | 0 (0.0%) | 0 (0.0%) |
| Health Diagnosing & Treating | 0 (0.0%) | 8 (100.0%) |
| Health Technologists | 0 (0.0%) | 2 (100.0%) |
| Total (Category) | 4 (30.8%) | 9 (69.2%) |
| Total (Overall) | 26 (54.2%) | 22 (45.8%) |
Services Occupations
The most common Services occupations in Winstonville are Security & Protection (7 | 14.6%), Food Preparation & Serving (7 | 14.6%), Firefighting & Prevention (4 | 8.3%), Law Enforcement (3 | 6.2%), and Cleaning & Maintenance (3 | 6.2%).
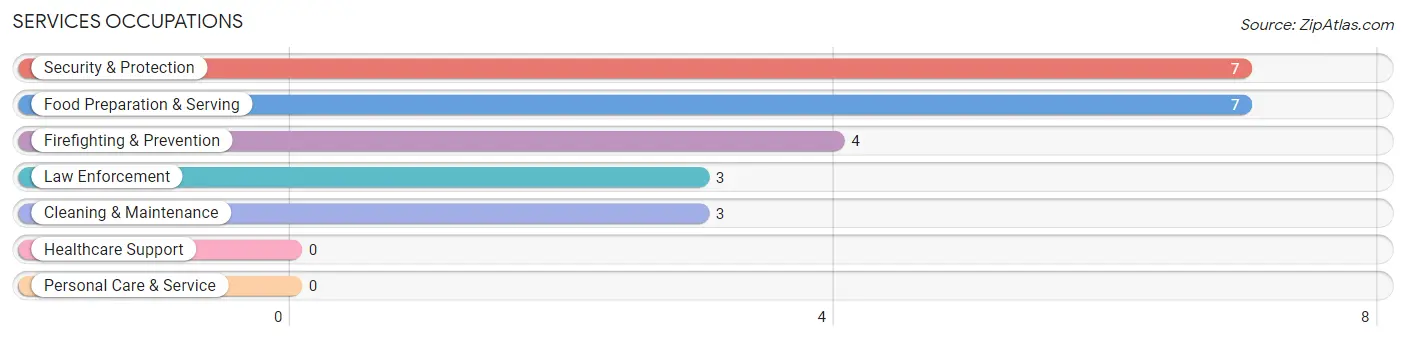
Services Occupations by Sex
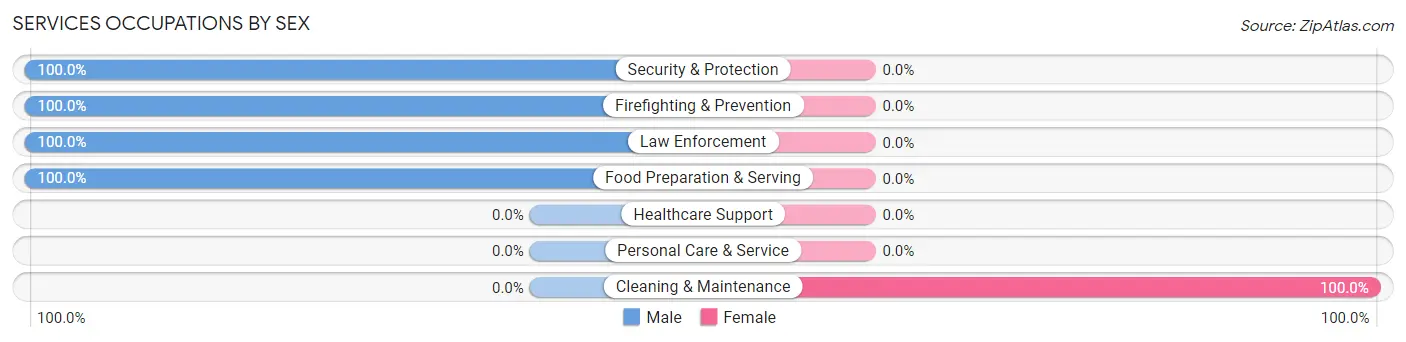
| Occupation | Male | Female |
| Healthcare Support | 0 (0.0%) | 0 (0.0%) |
| Security & Protection | 7 (100.0%) | 0 (0.0%) |
| Firefighting & Prevention | 4 (100.0%) | 0 (0.0%) |
| Law Enforcement | 3 (100.0%) | 0 (0.0%) |
| Food Preparation & Serving | 7 (100.0%) | 0 (0.0%) |
| Cleaning & Maintenance | 0 (0.0%) | 3 (100.0%) |
| Personal Care & Service | 0 (0.0%) | 0 (0.0%) |
| Total (Category) | 14 (82.4%) | 3 (17.6%) |
| Total (Overall) | 26 (54.2%) | 22 (45.8%) |
Sales and Office Occupations
The most common Sales and Office occupations in Winstonville are , and Sales & Related (2 | 4.2%).
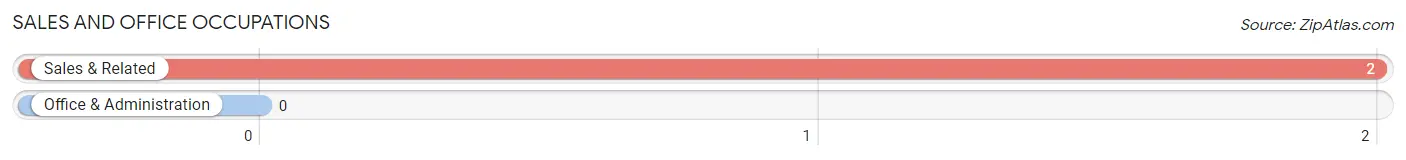
Sales and Office Occupations by Sex
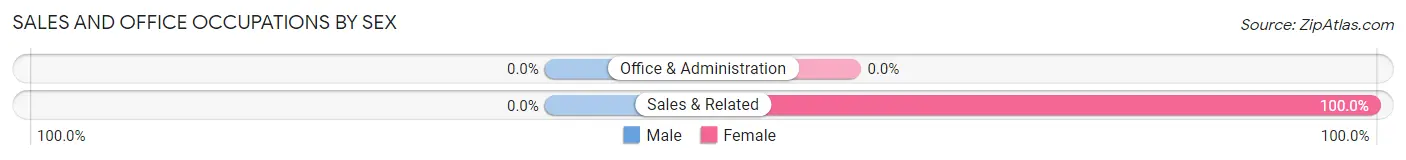
| Occupation | Male | Female |
| Sales & Related | 0 (0.0%) | 2 (100.0%) |
| Office & Administration | 0 (0.0%) | 0 (0.0%) |
| Total (Category) | 0 (0.0%) | 2 (100.0%) |
| Total (Overall) | 26 (54.2%) | 22 (45.8%) |
Natural Resources, Construction and Maintenance Occupations
Natural Resources, Construction and Maintenance Occupations by Sex
| Occupation | Male | Female |
| Farming, Fishing & Forestry | 0 (0.0%) | 0 (0.0%) |
| Construction & Extraction | 0 (0.0%) | 0 (0.0%) |
| Installation, Maintenance & Repair | 0 (0.0%) | 0 (0.0%) |
| Total (Category) | 0 (0.0%) | 0 (0.0%) |
| Total (Overall) | 26 (54.2%) | 22 (45.8%) |
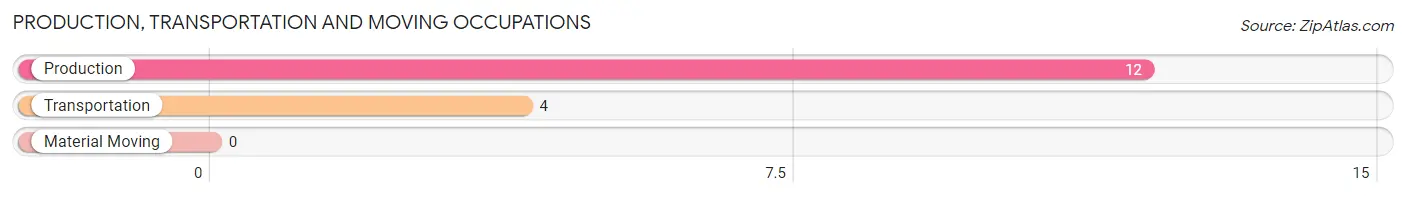
Production, Transportation and Moving Occupations
The most common Production, Transportation and Moving occupations in Winstonville are Production (12 | 25.0%), and Transportation (4 | 8.3%).
Production, Transportation and Moving Occupations by Sex
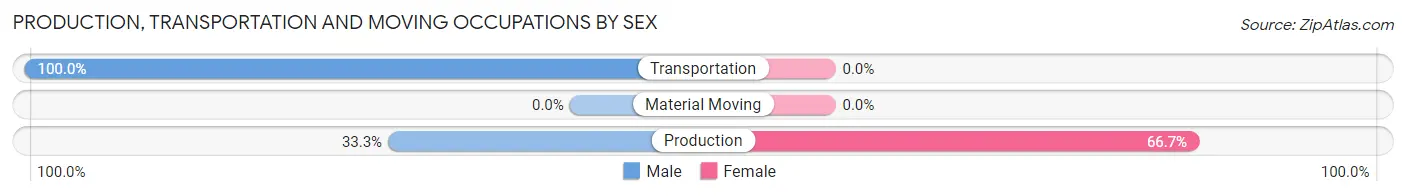
| Occupation | Male | Female |
| Production | 4 (33.3%) | 8 (66.7%) |
| Transportation | 4 (100.0%) | 0 (0.0%) |
| Material Moving | 0 (0.0%) | 0 (0.0%) |
| Total (Category) | 8 (50.0%) | 8 (50.0%) |
| Total (Overall) | 26 (54.2%) | 22 (45.8%) |
Employment Industries by Sex in Winstonville
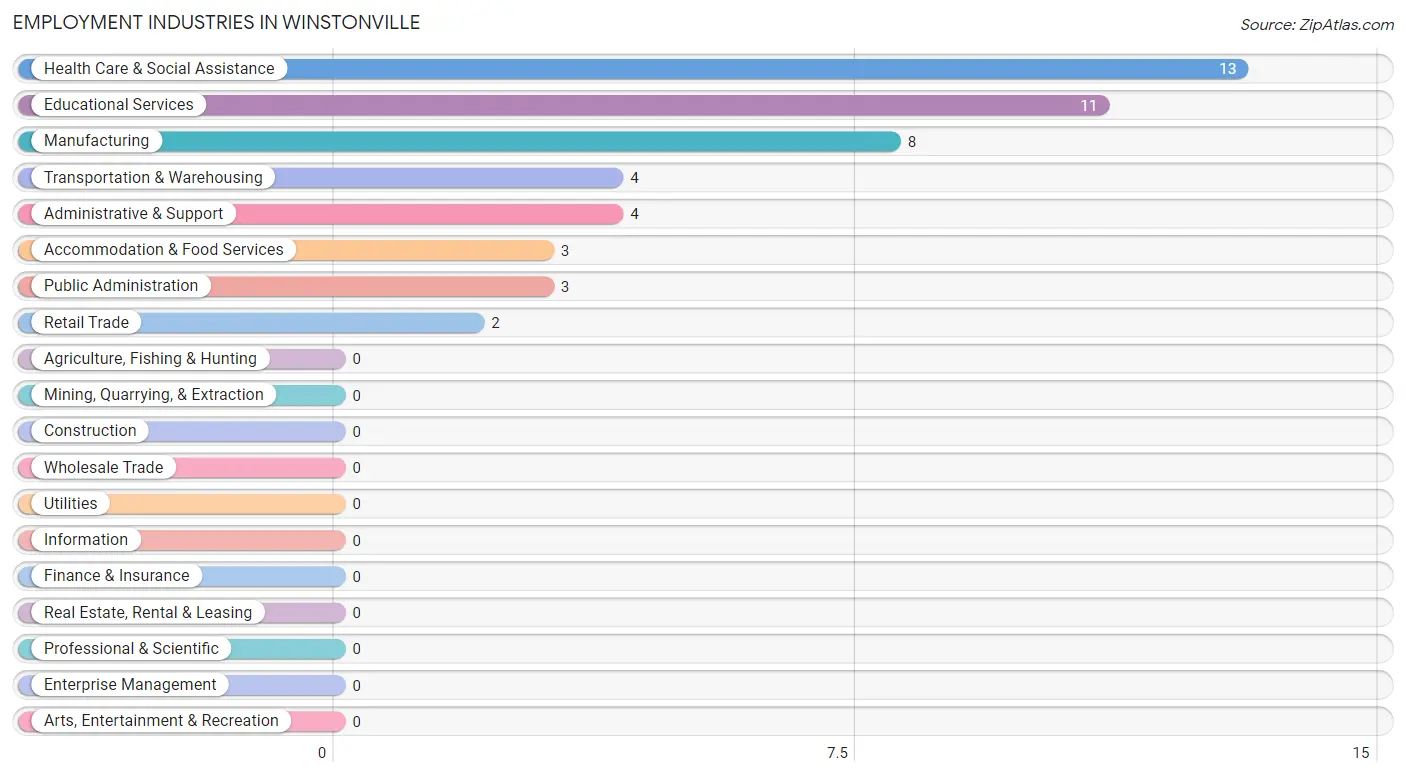
Employment Industries in Winstonville
The major employment industries in Winstonville include Health Care & Social Assistance (13 | 27.1%), Educational Services (11 | 22.9%), Manufacturing (8 | 16.7%), Transportation & Warehousing (4 | 8.3%), and Administrative & Support (4 | 8.3%).
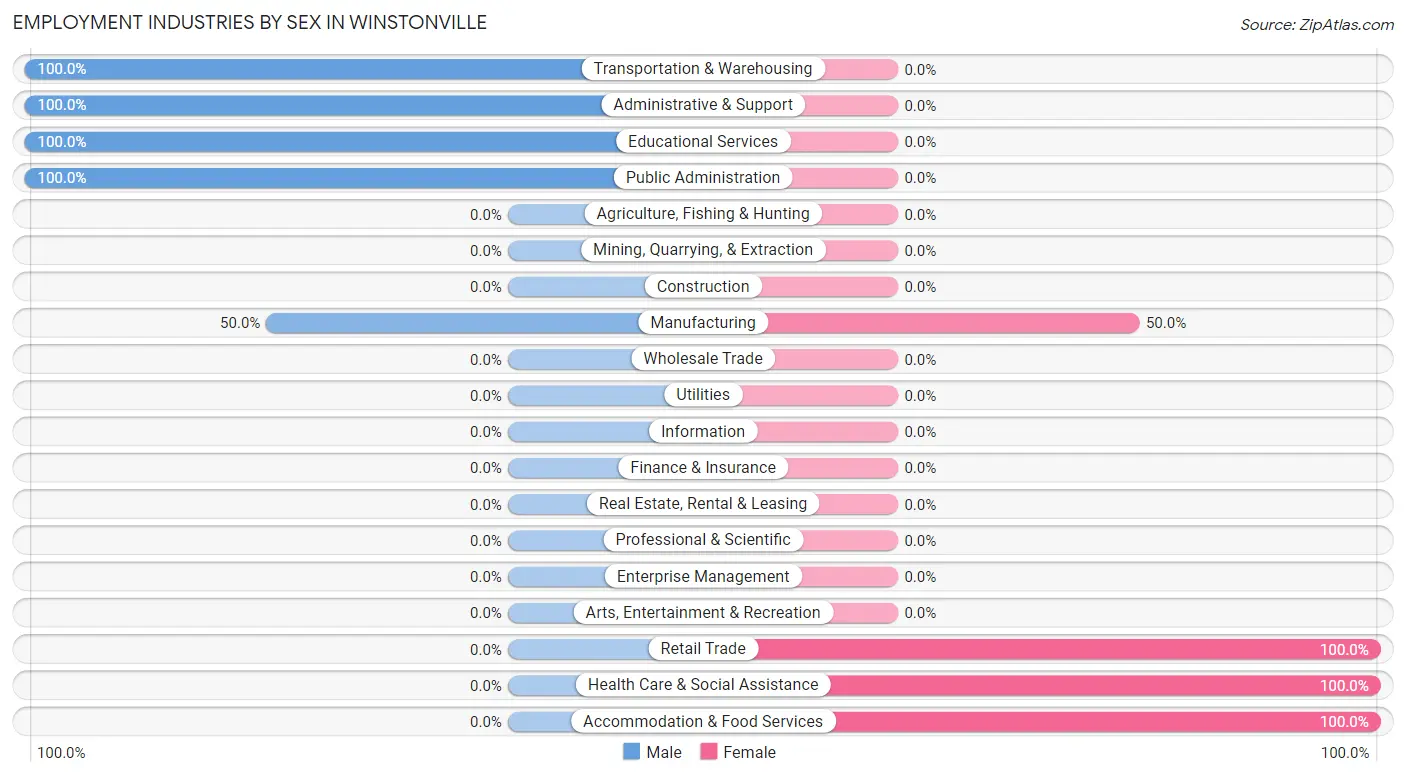
Employment Industries by Sex in Winstonville
The Winstonville industries that see more men than women are Transportation & Warehousing (100.0%), Administrative & Support (100.0%), and Educational Services (100.0%), whereas the industries that tend to have a higher number of women are Retail Trade (100.0%), Health Care & Social Assistance (100.0%), and Accommodation & Food Services (100.0%).
| Industry | Male | Female |
| Agriculture, Fishing & Hunting | 0 (0.0%) | 0 (0.0%) |
| Mining, Quarrying, & Extraction | 0 (0.0%) | 0 (0.0%) |
| Construction | 0 (0.0%) | 0 (0.0%) |
| Manufacturing | 4 (50.0%) | 4 (50.0%) |
| Wholesale Trade | 0 (0.0%) | 0 (0.0%) |
| Retail Trade | 0 (0.0%) | 2 (100.0%) |
| Transportation & Warehousing | 4 (100.0%) | 0 (0.0%) |
| Utilities | 0 (0.0%) | 0 (0.0%) |
| Information | 0 (0.0%) | 0 (0.0%) |
| Finance & Insurance | 0 (0.0%) | 0 (0.0%) |
| Real Estate, Rental & Leasing | 0 (0.0%) | 0 (0.0%) |
| Professional & Scientific | 0 (0.0%) | 0 (0.0%) |
| Enterprise Management | 0 (0.0%) | 0 (0.0%) |
| Administrative & Support | 4 (100.0%) | 0 (0.0%) |
| Educational Services | 11 (100.0%) | 0 (0.0%) |
| Health Care & Social Assistance | 0 (0.0%) | 13 (100.0%) |
| Arts, Entertainment & Recreation | 0 (0.0%) | 0 (0.0%) |
| Accommodation & Food Services | 0 (0.0%) | 3 (100.0%) |
| Public Administration | 3 (100.0%) | 0 (0.0%) |
| Total | 26 (54.2%) | 22 (45.8%) |
Education in Winstonville
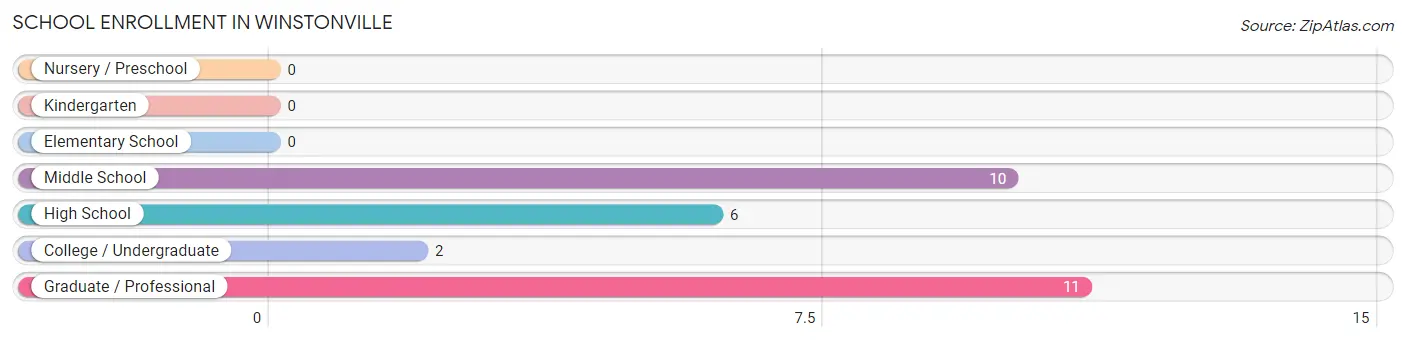
School Enrollment in Winstonville
The most common levels of schooling among the 29 students in Winstonville are graduate / professional (11 | 37.9%), middle school (10 | 34.5%), and high school (6 | 20.7%).
| School Level | # Students | % Students |
| Nursery / Preschool | 0 | 0.0% |
| Kindergarten | 0 | 0.0% |
| Elementary School | 0 | 0.0% |
| Middle School | 10 | 34.5% |
| High School | 6 | 20.7% |
| College / Undergraduate | 2 | 6.9% |
| Graduate / Professional | 11 | 37.9% |
| Total | 29 | 100.0% |
School Enrollment by Age by Funding Source in Winstonville
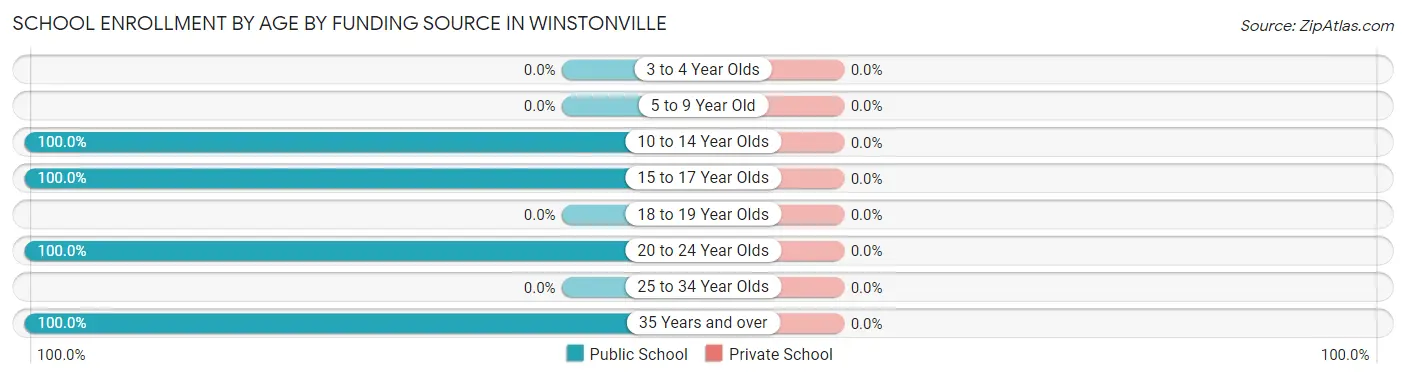
| Age Bracket | Public School | Private School |
| 3 to 4 Year Olds | 0 (0.0%) | 0 (0.0%) |
| 5 to 9 Year Old | 0 (0.0%) | 0 (0.0%) |
| 10 to 14 Year Olds | 10 (100.0%) | 0 (0.0%) |
| 15 to 17 Year Olds | 6 (100.0%) | 0 (0.0%) |
| 18 to 19 Year Olds | 0 (0.0%) | 0 (0.0%) |
| 20 to 24 Year Olds | 2 (100.0%) | 0 (0.0%) |
| 25 to 34 Year Olds | 0 (0.0%) | 0 (0.0%) |
| 35 Years and over | 11 (100.0%) | 0 (0.0%) |
| Total | 29 (100.0%) | 0 (0.0%) |
Educational Attainment by Field of Study in Winstonville
Education (11 | 39.3%), business (5 | 17.9%), psychology (4 | 14.3%), engineering (4 | 14.3%), and arts & humanities (4 | 14.3%) are the most common fields of study among 28 individuals in Winstonville who have obtained a bachelor's degree or higher.
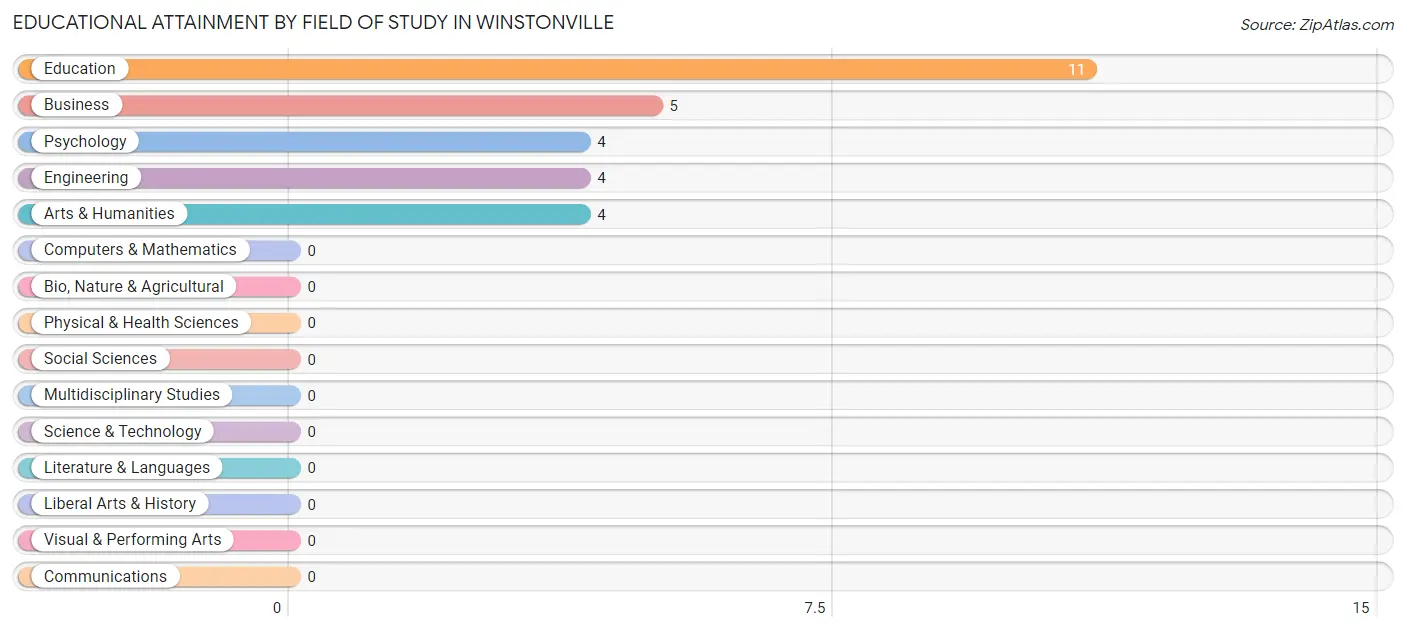
| Field of Study | # Graduates | % Graduates |
| Computers & Mathematics | 0 | 0.0% |
| Bio, Nature & Agricultural | 0 | 0.0% |
| Physical & Health Sciences | 0 | 0.0% |
| Psychology | 4 | 14.3% |
| Social Sciences | 0 | 0.0% |
| Engineering | 4 | 14.3% |
| Multidisciplinary Studies | 0 | 0.0% |
| Science & Technology | 0 | 0.0% |
| Business | 5 | 17.9% |
| Education | 11 | 39.3% |
| Literature & Languages | 0 | 0.0% |
| Liberal Arts & History | 0 | 0.0% |
| Visual & Performing Arts | 0 | 0.0% |
| Communications | 0 | 0.0% |
| Arts & Humanities | 4 | 14.3% |
| Total | 28 | 100.0% |
Transportation & Commute in Winstonville
Vehicle Availability by Sex in Winstonville
The most prevalent vehicle ownership categories in Winstonville are males with 2 vehicles (12, accounting for 46.2%) and females with 2 vehicles (15, making up 54.5%).
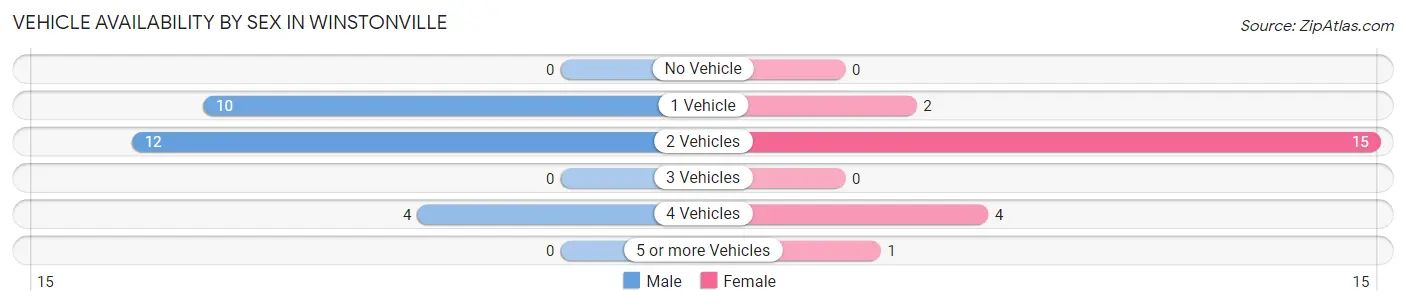
| Vehicles Available | Male | Female |
| No Vehicle | 0 (0.0%) | 0 (0.0%) |
| 1 Vehicle | 10 (38.5%) | 2 (9.1%) |
| 2 Vehicles | 12 (46.2%) | 15 (68.2%) |
| 3 Vehicles | 0 (0.0%) | 0 (0.0%) |
| 4 Vehicles | 4 (15.4%) | 4 (18.2%) |
| 5 or more Vehicles | 0 (0.0%) | 1 (4.5%) |
| Total | 26 (100.0%) | 22 (100.0%) |
Commute Time in Winstonville
The most frequently occuring commute durations in Winstonville are 15 to 19 minutes (17 commuters, 35.4%), 5 to 9 minutes (16 commuters, 33.3%), and 10 to 14 minutes (7 commuters, 14.6%).
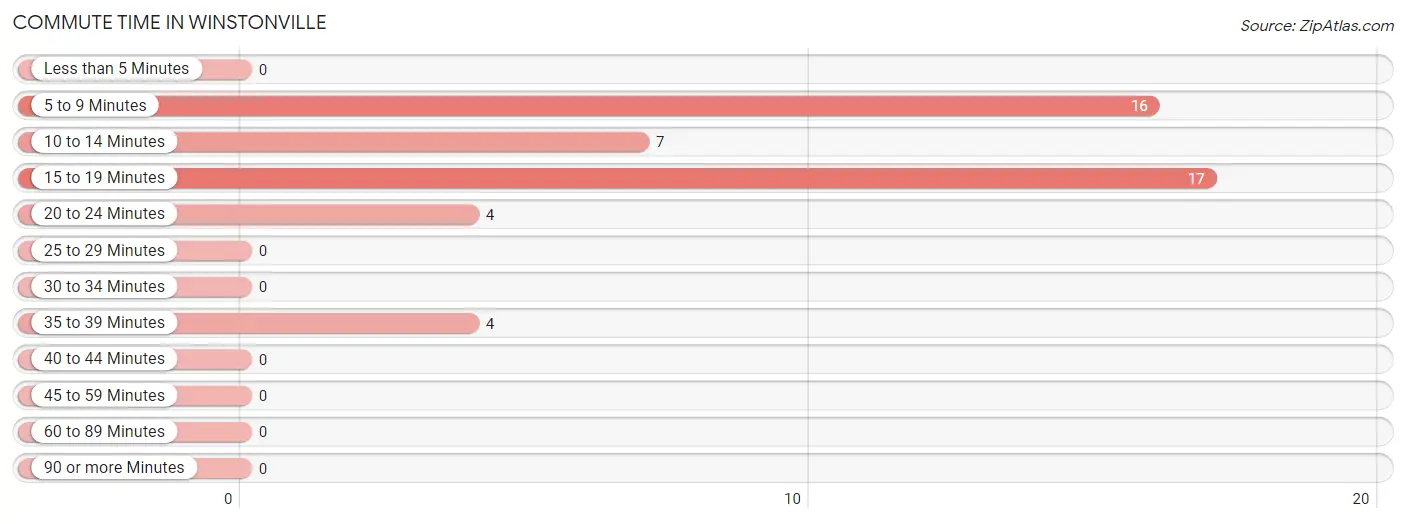
| Commute Time | # Commuters | % Commuters |
| Less than 5 Minutes | 0 | 0.0% |
| 5 to 9 Minutes | 16 | 33.3% |
| 10 to 14 Minutes | 7 | 14.6% |
| 15 to 19 Minutes | 17 | 35.4% |
| 20 to 24 Minutes | 4 | 8.3% |
| 25 to 29 Minutes | 0 | 0.0% |
| 30 to 34 Minutes | 0 | 0.0% |
| 35 to 39 Minutes | 4 | 8.3% |
| 40 to 44 Minutes | 0 | 0.0% |
| 45 to 59 Minutes | 0 | 0.0% |
| 60 to 89 Minutes | 0 | 0.0% |
| 90 or more Minutes | 0 | 0.0% |
Commute Time by Sex in Winstonville
The most common commute times in Winstonville are 5 to 9 minutes (10 commuters, 38.5%) for males and 15 to 19 minutes (9 commuters, 40.9%) for females.
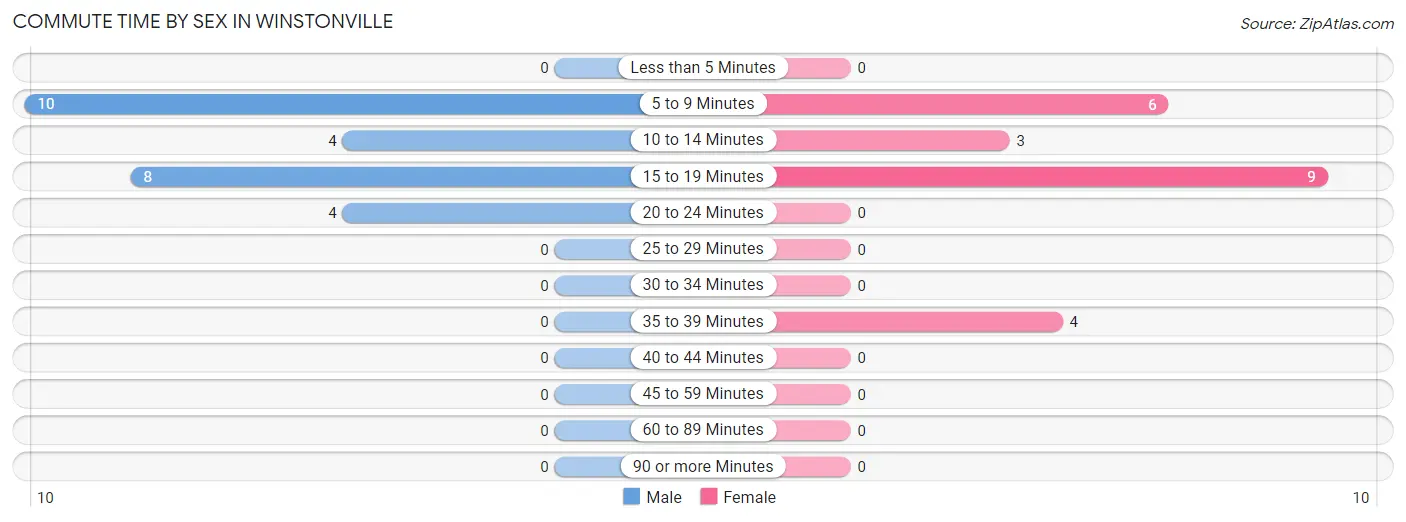
| Commute Time | Male | Female |
| Less than 5 Minutes | 0 (0.0%) | 0 (0.0%) |
| 5 to 9 Minutes | 10 (38.5%) | 6 (27.3%) |
| 10 to 14 Minutes | 4 (15.4%) | 3 (13.6%) |
| 15 to 19 Minutes | 8 (30.8%) | 9 (40.9%) |
| 20 to 24 Minutes | 4 (15.4%) | 0 (0.0%) |
| 25 to 29 Minutes | 0 (0.0%) | 0 (0.0%) |
| 30 to 34 Minutes | 0 (0.0%) | 0 (0.0%) |
| 35 to 39 Minutes | 0 (0.0%) | 4 (18.2%) |
| 40 to 44 Minutes | 0 (0.0%) | 0 (0.0%) |
| 45 to 59 Minutes | 0 (0.0%) | 0 (0.0%) |
| 60 to 89 Minutes | 0 (0.0%) | 0 (0.0%) |
| 90 or more Minutes | 0 (0.0%) | 0 (0.0%) |
Time of Departure to Work by Sex in Winstonville
The most frequent times of departure to work in Winstonville are 6:30 AM to 6:59 AM (11, 42.3%) for males and 7:00 AM to 7:29 AM (10, 45.5%) for females.
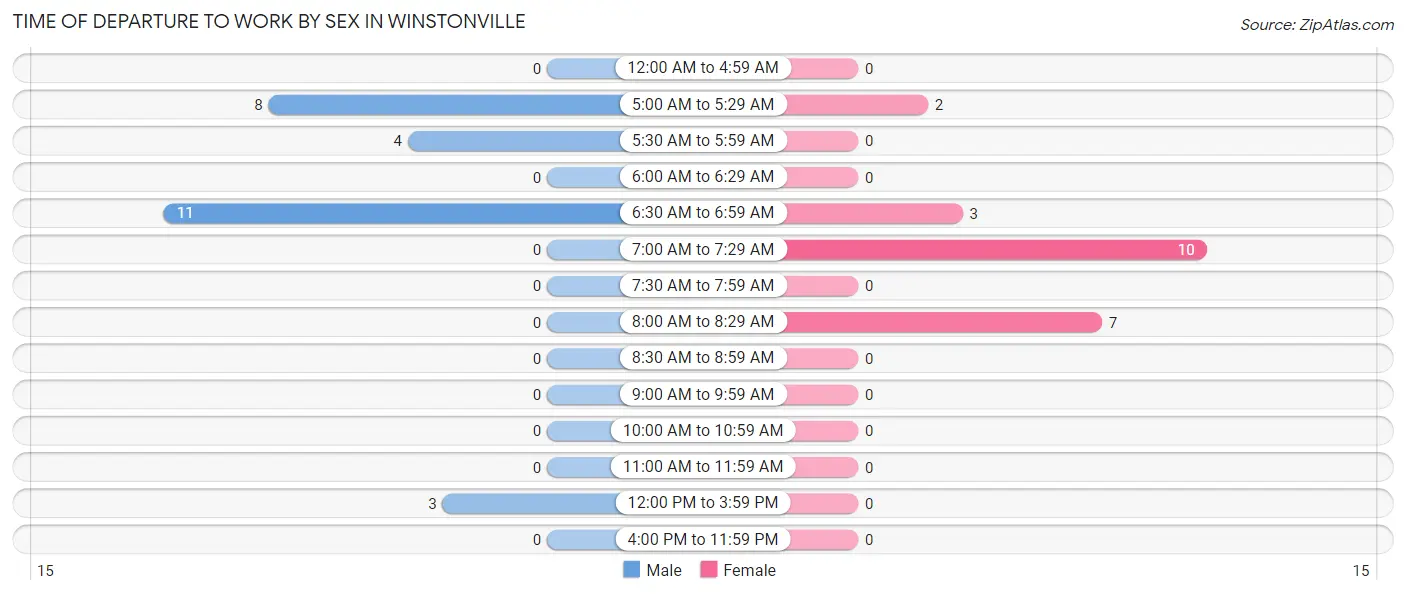
| Time of Departure | Male | Female |
| 12:00 AM to 4:59 AM | 0 (0.0%) | 0 (0.0%) |
| 5:00 AM to 5:29 AM | 8 (30.8%) | 2 (9.1%) |
| 5:30 AM to 5:59 AM | 4 (15.4%) | 0 (0.0%) |
| 6:00 AM to 6:29 AM | 0 (0.0%) | 0 (0.0%) |
| 6:30 AM to 6:59 AM | 11 (42.3%) | 3 (13.6%) |
| 7:00 AM to 7:29 AM | 0 (0.0%) | 10 (45.5%) |
| 7:30 AM to 7:59 AM | 0 (0.0%) | 0 (0.0%) |
| 8:00 AM to 8:29 AM | 0 (0.0%) | 7 (31.8%) |
| 8:30 AM to 8:59 AM | 0 (0.0%) | 0 (0.0%) |
| 9:00 AM to 9:59 AM | 0 (0.0%) | 0 (0.0%) |
| 10:00 AM to 10:59 AM | 0 (0.0%) | 0 (0.0%) |
| 11:00 AM to 11:59 AM | 0 (0.0%) | 0 (0.0%) |
| 12:00 PM to 3:59 PM | 3 (11.5%) | 0 (0.0%) |
| 4:00 PM to 11:59 PM | 0 (0.0%) | 0 (0.0%) |
| Total | 26 (100.0%) | 22 (100.0%) |
Housing Occupancy in Winstonville
Occupancy by Ownership in Winstonville
Of the total 38 dwellings in Winstonville, owner-occupied units account for 26 (68.4%), while renter-occupied units make up 12 (31.6%).
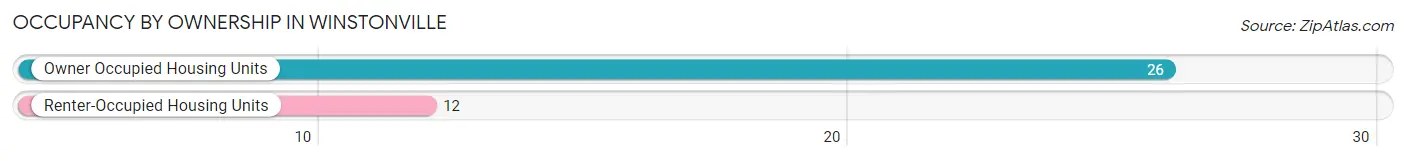
| Occupancy | # Housing Units | % Housing Units |
| Owner Occupied Housing Units | 26 | 68.4% |
| Renter-Occupied Housing Units | 12 | 31.6% |
| Total Occupied Housing Units | 38 | 100.0% |
Occupancy by Household Size in Winstonville
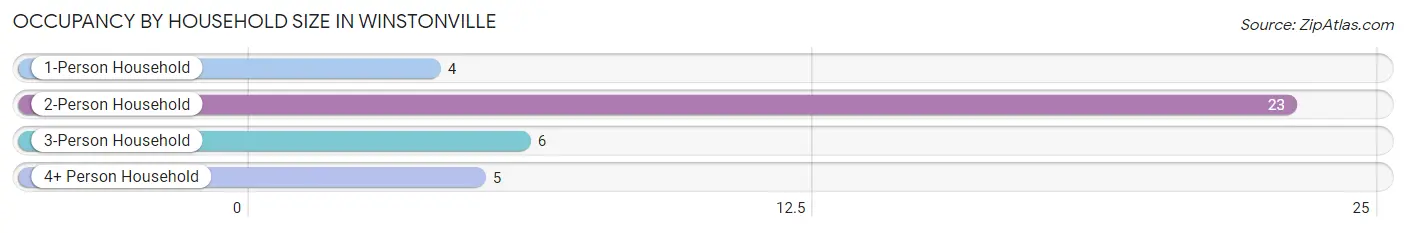
| Household Size | # Housing Units | % Housing Units |
| 1-Person Household | 4 | 10.5% |
| 2-Person Household | 23 | 60.5% |
| 3-Person Household | 6 | 15.8% |
| 4+ Person Household | 5 | 13.2% |
| Total Housing Units | 38 | 100.0% |
Occupancy by Ownership by Household Size in Winstonville
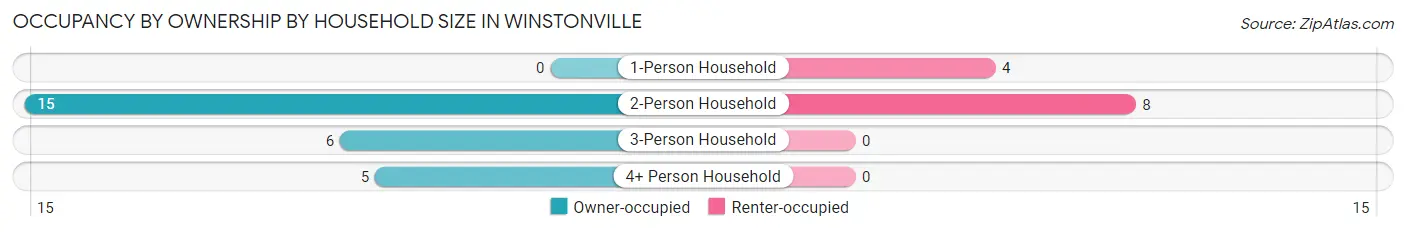
| Household Size | Owner-occupied | Renter-occupied |
| 1-Person Household | 0 (0.0%) | 4 (100.0%) |
| 2-Person Household | 15 (65.2%) | 8 (34.8%) |
| 3-Person Household | 6 (100.0%) | 0 (0.0%) |
| 4+ Person Household | 5 (100.0%) | 0 (0.0%) |
| Total Housing Units | 26 (68.4%) | 12 (31.6%) |
Occupancy by Educational Attainment in Winstonville
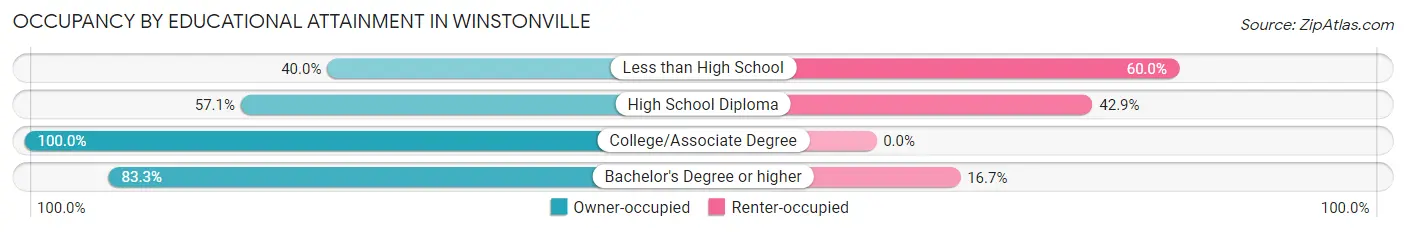
| Household Size | Owner-occupied | Renter-occupied |
| Less than High School | 2 (40.0%) | 3 (60.0%) |
| High School Diploma | 8 (57.1%) | 6 (42.9%) |
| College/Associate Degree | 1 (100.0%) | 0 (0.0%) |
| Bachelor's Degree or higher | 15 (83.3%) | 3 (16.7%) |
Occupancy by Age of Householder in Winstonville
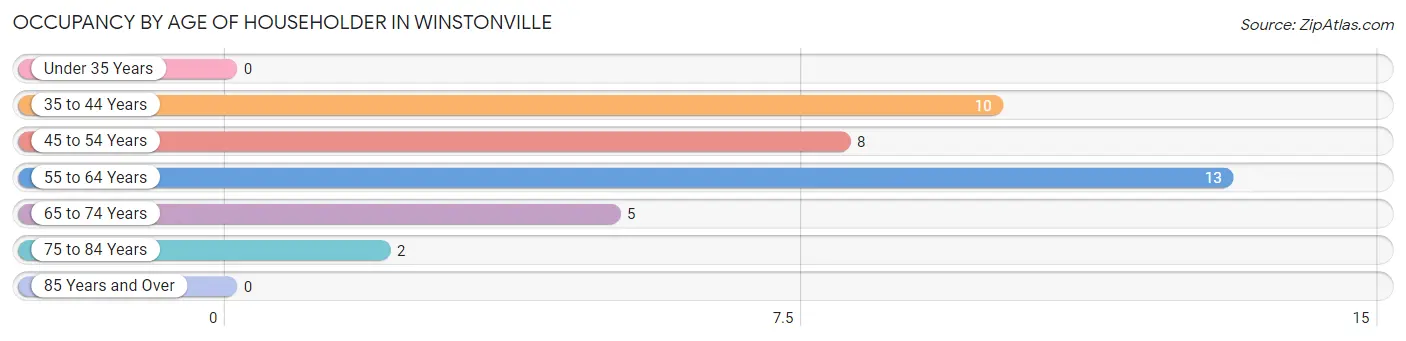
| Age Bracket | # Households | % Households |
| Under 35 Years | 0 | 0.0% |
| 35 to 44 Years | 10 | 26.3% |
| 45 to 54 Years | 8 | 21.0% |
| 55 to 64 Years | 13 | 34.2% |
| 65 to 74 Years | 5 | 13.2% |
| 75 to 84 Years | 2 | 5.3% |
| 85 Years and Over | 0 | 0.0% |
| Total | 38 | 100.0% |
Housing Finances in Winstonville
Median Income by Occupancy in Winstonville
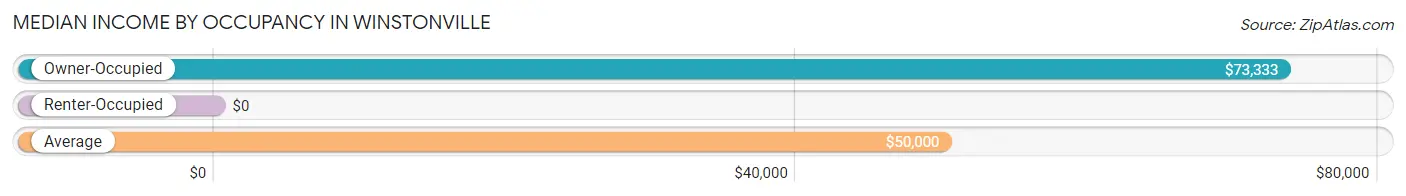
| Occupancy Type | # Households | Median Income |
| Owner-Occupied | 26 (68.4%) | $73,333 |
| Renter-Occupied | 12 (31.6%) | $0 |
| Average | 38 (100.0%) | $50,000 |
Occupancy by Householder Income Bracket in Winstonville
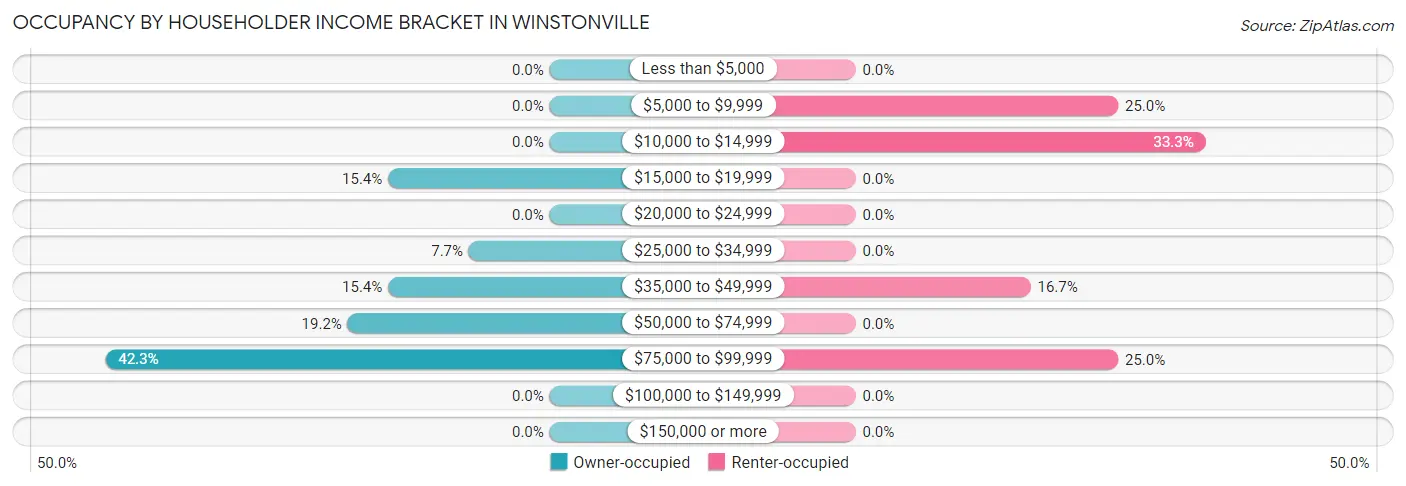
| Income Bracket | Owner-occupied | Renter-occupied |
| Less than $5,000 | 0 (0.0%) | 0 (0.0%) |
| $5,000 to $9,999 | 0 (0.0%) | 3 (25.0%) |
| $10,000 to $14,999 | 0 (0.0%) | 4 (33.3%) |
| $15,000 to $19,999 | 4 (15.4%) | 0 (0.0%) |
| $20,000 to $24,999 | 0 (0.0%) | 0 (0.0%) |
| $25,000 to $34,999 | 2 (7.7%) | 0 (0.0%) |
| $35,000 to $49,999 | 4 (15.4%) | 2 (16.7%) |
| $50,000 to $74,999 | 5 (19.2%) | 0 (0.0%) |
| $75,000 to $99,999 | 11 (42.3%) | 3 (25.0%) |
| $100,000 to $149,999 | 0 (0.0%) | 0 (0.0%) |
| $150,000 or more | 0 (0.0%) | 0 (0.0%) |
| Total | 26 (100.0%) | 12 (100.0%) |
Monthly Housing Cost Tiers in Winstonville
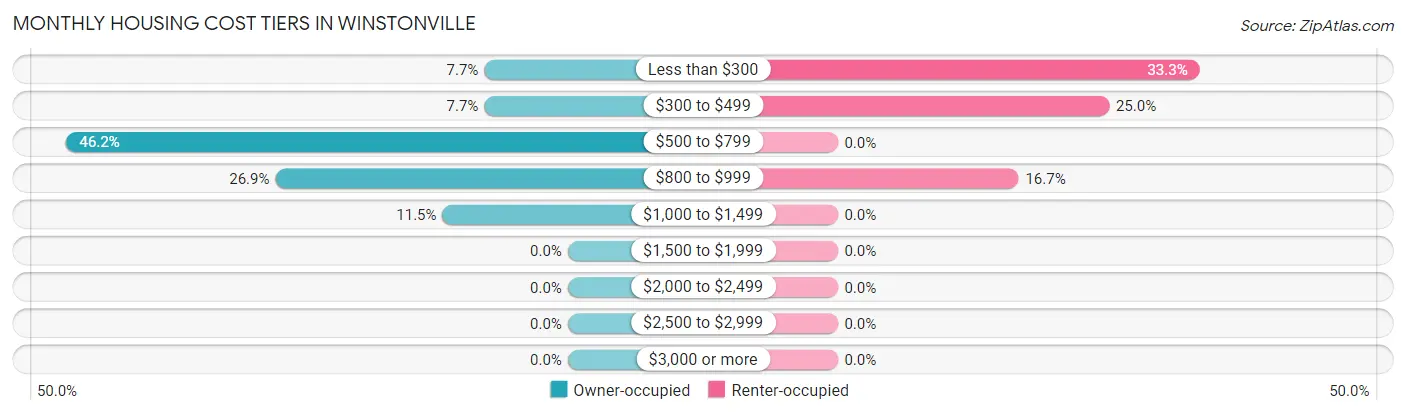
| Monthly Cost | Owner-occupied | Renter-occupied |
| Less than $300 | 2 (7.7%) | 4 (33.3%) |
| $300 to $499 | 2 (7.7%) | 3 (25.0%) |
| $500 to $799 | 12 (46.2%) | 0 (0.0%) |
| $800 to $999 | 7 (26.9%) | 2 (16.7%) |
| $1,000 to $1,499 | 3 (11.5%) | 0 (0.0%) |
| $1,500 to $1,999 | 0 (0.0%) | 0 (0.0%) |
| $2,000 to $2,499 | 0 (0.0%) | 0 (0.0%) |
| $2,500 to $2,999 | 0 (0.0%) | 0 (0.0%) |
| $3,000 or more | 0 (0.0%) | 0 (0.0%) |
| Total | 26 (100.0%) | 12 (100.0%) |
Physical Housing Characteristics in Winstonville
Housing Structures in Winstonville
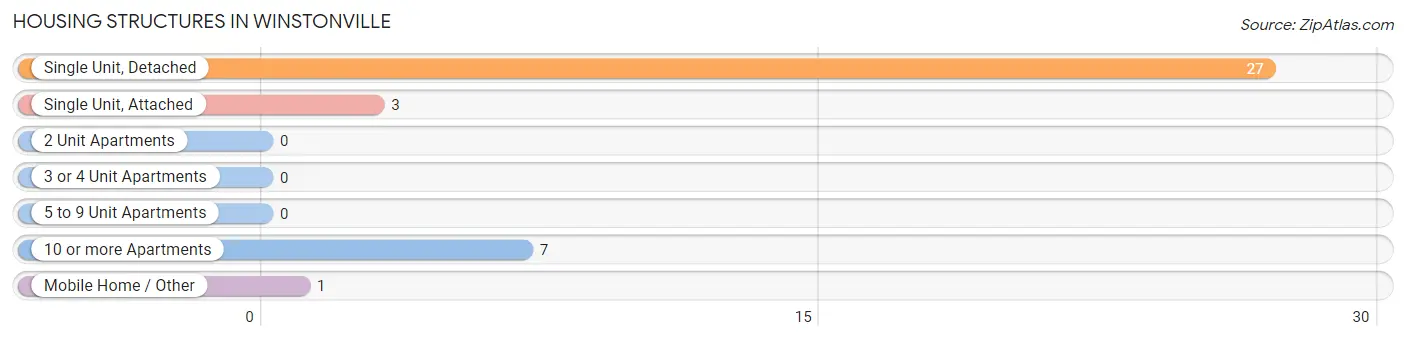
| Structure Type | # Housing Units | % Housing Units |
| Single Unit, Detached | 27 | 71.1% |
| Single Unit, Attached | 3 | 7.9% |
| 2 Unit Apartments | 0 | 0.0% |
| 3 or 4 Unit Apartments | 0 | 0.0% |
| 5 to 9 Unit Apartments | 0 | 0.0% |
| 10 or more Apartments | 7 | 18.4% |
| Mobile Home / Other | 1 | 2.6% |
| Total | 38 | 100.0% |
Housing Structures by Occupancy in Winstonville
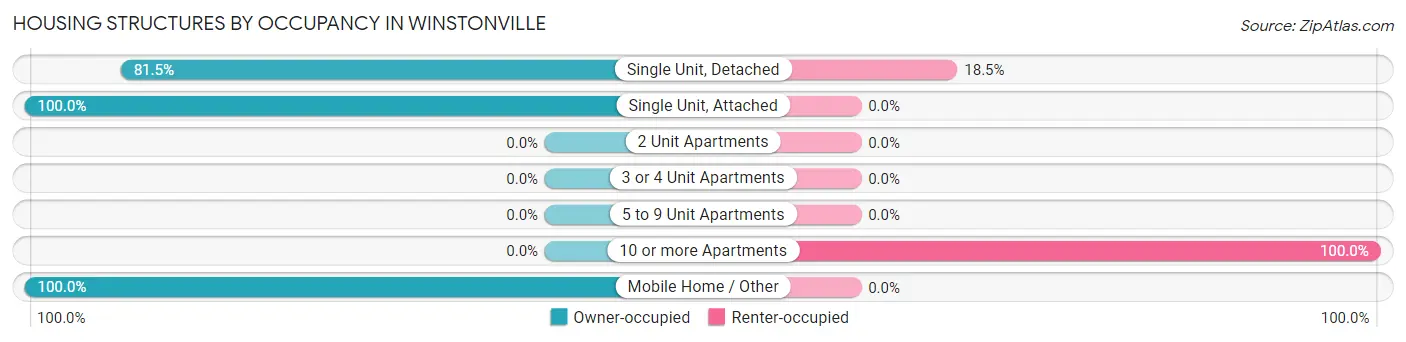
| Structure Type | Owner-occupied | Renter-occupied |
| Single Unit, Detached | 22 (81.5%) | 5 (18.5%) |
| Single Unit, Attached | 3 (100.0%) | 0 (0.0%) |
| 2 Unit Apartments | 0 (0.0%) | 0 (0.0%) |
| 3 or 4 Unit Apartments | 0 (0.0%) | 0 (0.0%) |
| 5 to 9 Unit Apartments | 0 (0.0%) | 0 (0.0%) |
| 10 or more Apartments | 0 (0.0%) | 7 (100.0%) |
| Mobile Home / Other | 1 (100.0%) | 0 (0.0%) |
| Total | 26 (68.4%) | 12 (31.6%) |
Housing Structures by Number of Rooms in Winstonville
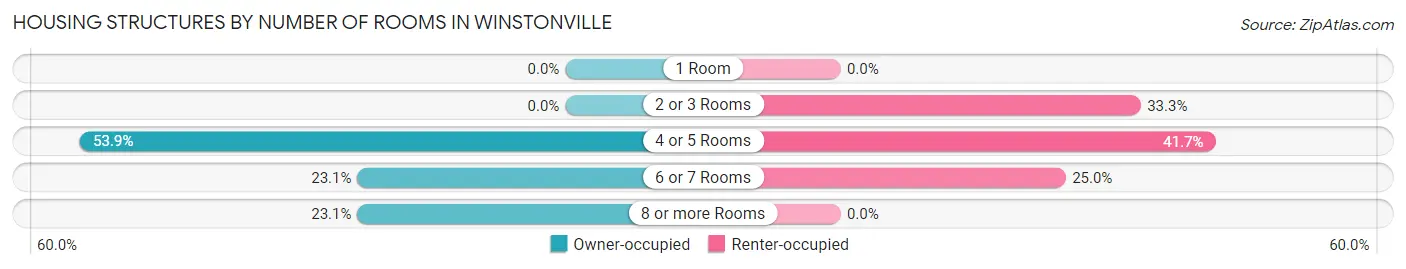
| Number of Rooms | Owner-occupied | Renter-occupied |
| 1 Room | 0 (0.0%) | 0 (0.0%) |
| 2 or 3 Rooms | 0 (0.0%) | 4 (33.3%) |
| 4 or 5 Rooms | 14 (53.8%) | 5 (41.7%) |
| 6 or 7 Rooms | 6 (23.1%) | 3 (25.0%) |
| 8 or more Rooms | 6 (23.1%) | 0 (0.0%) |
| Total | 26 (100.0%) | 12 (100.0%) |
Housing Structure by Heating Type in Winstonville
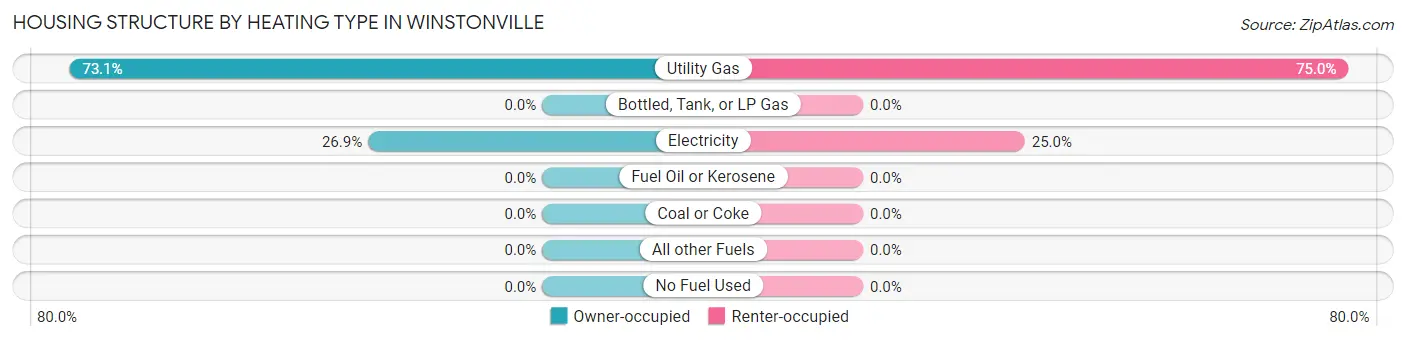
| Heating Type | Owner-occupied | Renter-occupied |
| Utility Gas | 19 (73.1%) | 9 (75.0%) |
| Bottled, Tank, or LP Gas | 0 (0.0%) | 0 (0.0%) |
| Electricity | 7 (26.9%) | 3 (25.0%) |
| Fuel Oil or Kerosene | 0 (0.0%) | 0 (0.0%) |
| Coal or Coke | 0 (0.0%) | 0 (0.0%) |
| All other Fuels | 0 (0.0%) | 0 (0.0%) |
| No Fuel Used | 0 (0.0%) | 0 (0.0%) |
| Total | 26 (100.0%) | 12 (100.0%) |
Household Vehicle Usage in Winstonville
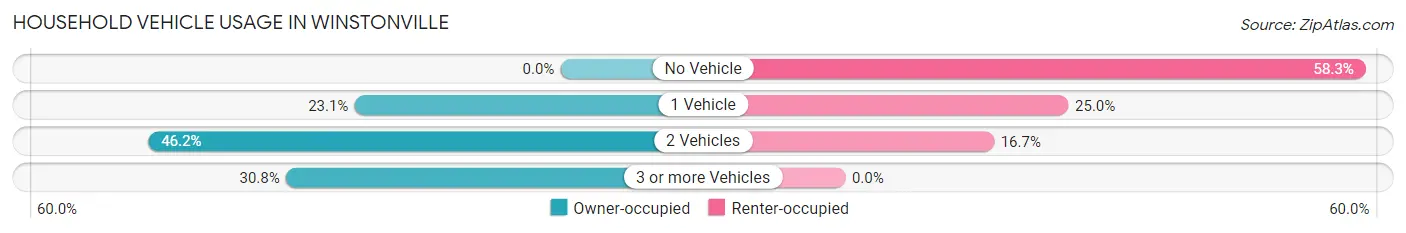
| Vehicles per Household | Owner-occupied | Renter-occupied |
| No Vehicle | 0 (0.0%) | 7 (58.3%) |
| 1 Vehicle | 6 (23.1%) | 3 (25.0%) |
| 2 Vehicles | 12 (46.2%) | 2 (16.7%) |
| 3 or more Vehicles | 8 (30.8%) | 0 (0.0%) |
| Total | 26 (100.0%) | 12 (100.0%) |
Real Estate & Mortgages in Winstonville
Real Estate and Mortgage Overview in Winstonville
| Characteristic | Without Mortgage | With Mortgage |
| Housing Units | 16 | 10 |
| Median Property Value | $112,500 | $0 |
| Median Household Income | $43,750 | $0 |
| Monthly Housing Costs | $550 | $0 |
| Real Estate Taxes | - | - |
Property Value by Mortgage Status in Winstonville
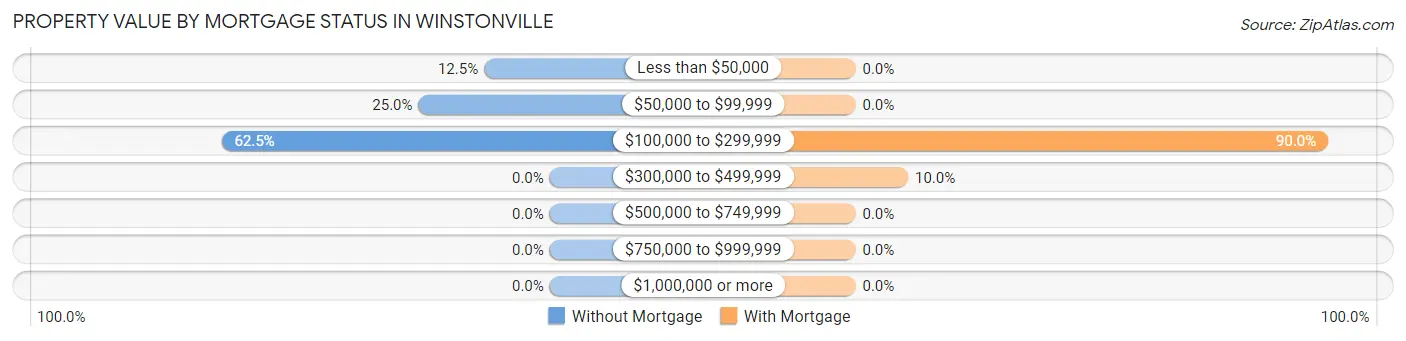
| Property Value | Without Mortgage | With Mortgage |
| Less than $50,000 | 2 (12.5%) | 0 (0.0%) |
| $50,000 to $99,999 | 4 (25.0%) | 0 (0.0%) |
| $100,000 to $299,999 | 10 (62.5%) | 9 (90.0%) |
| $300,000 to $499,999 | 0 (0.0%) | 1 (10.0%) |
| $500,000 to $749,999 | 0 (0.0%) | 0 (0.0%) |
| $750,000 to $999,999 | 0 (0.0%) | 0 (0.0%) |
| $1,000,000 or more | 0 (0.0%) | 0 (0.0%) |
| Total | 16 (100.0%) | 10 (100.0%) |
Household Income by Mortgage Status in Winstonville
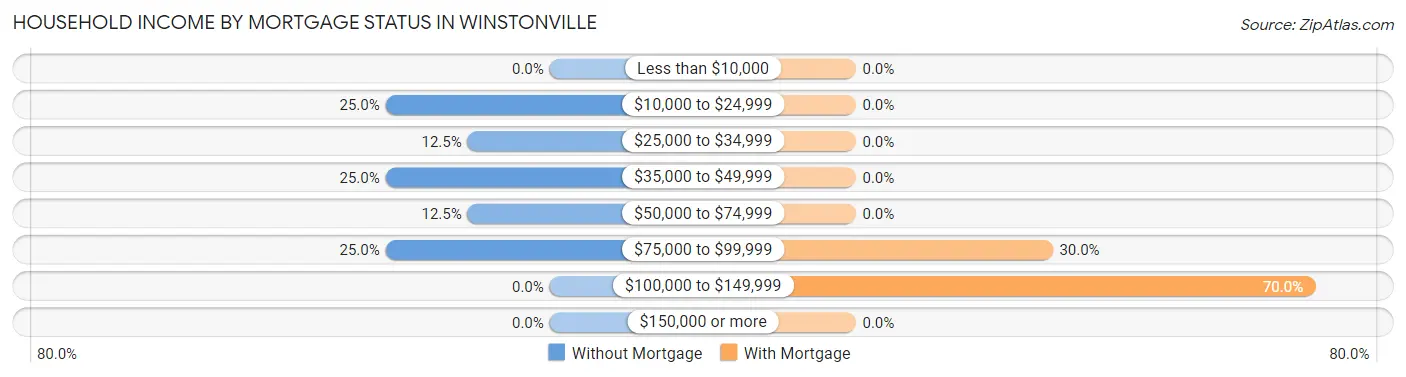
| Household Income | Without Mortgage | With Mortgage |
| Less than $10,000 | 0 (0.0%) | 0 (0.0%) |
| $10,000 to $24,999 | 4 (25.0%) | 0 (0.0%) |
| $25,000 to $34,999 | 2 (12.5%) | 0 (0.0%) |
| $35,000 to $49,999 | 4 (25.0%) | 0 (0.0%) |
| $50,000 to $74,999 | 2 (12.5%) | 0 (0.0%) |
| $75,000 to $99,999 | 4 (25.0%) | 3 (30.0%) |
| $100,000 to $149,999 | 0 (0.0%) | 7 (70.0%) |
| $150,000 or more | 0 (0.0%) | 0 (0.0%) |
| Total | 16 (100.0%) | 10 (100.0%) |
Property Value to Household Income Ratio in Winstonville
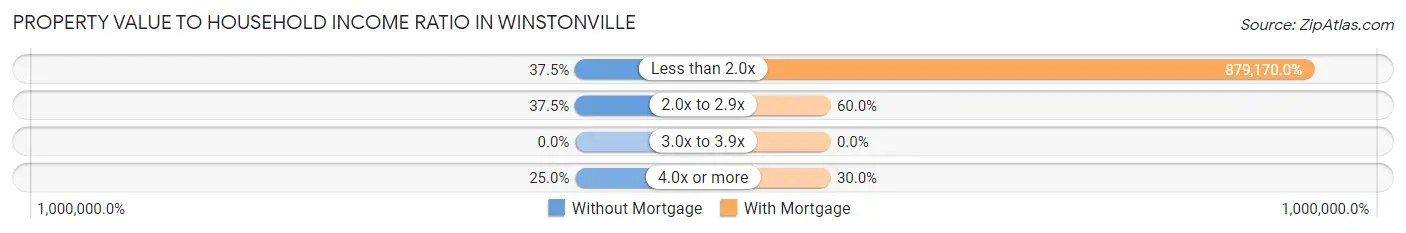
| Value-to-Income Ratio | Without Mortgage | With Mortgage |
| Less than 2.0x | 6 (37.5%) | 87,917 (879,170.0%) |
| 2.0x to 2.9x | 6 (37.5%) | 6 (60.0%) |
| 3.0x to 3.9x | 0 (0.0%) | 0 (0.0%) |
| 4.0x or more | 4 (25.0%) | 3 (30.0%) |
| Total | 16 (100.0%) | 10 (100.0%) |
Real Estate Taxes by Mortgage Status in Winstonville
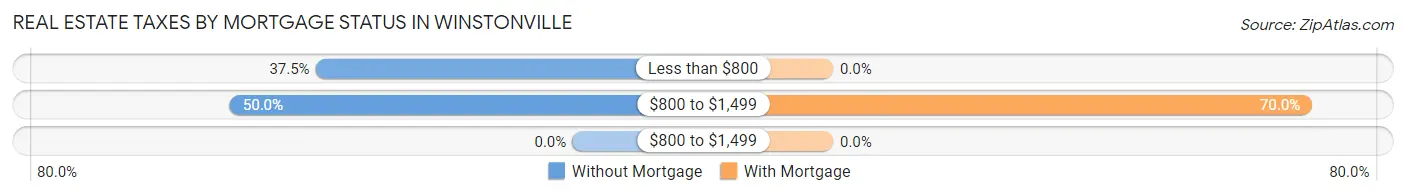
| Property Taxes | Without Mortgage | With Mortgage |
| Less than $800 | 6 (37.5%) | 0 (0.0%) |
| $800 to $1,499 | 8 (50.0%) | 7 (70.0%) |
| $800 to $1,499 | 0 (0.0%) | 0 (0.0%) |
| Total | 16 (100.0%) | 10 (100.0%) |
Health & Disability in Winstonville
Health Insurance Coverage by Age in Winstonville
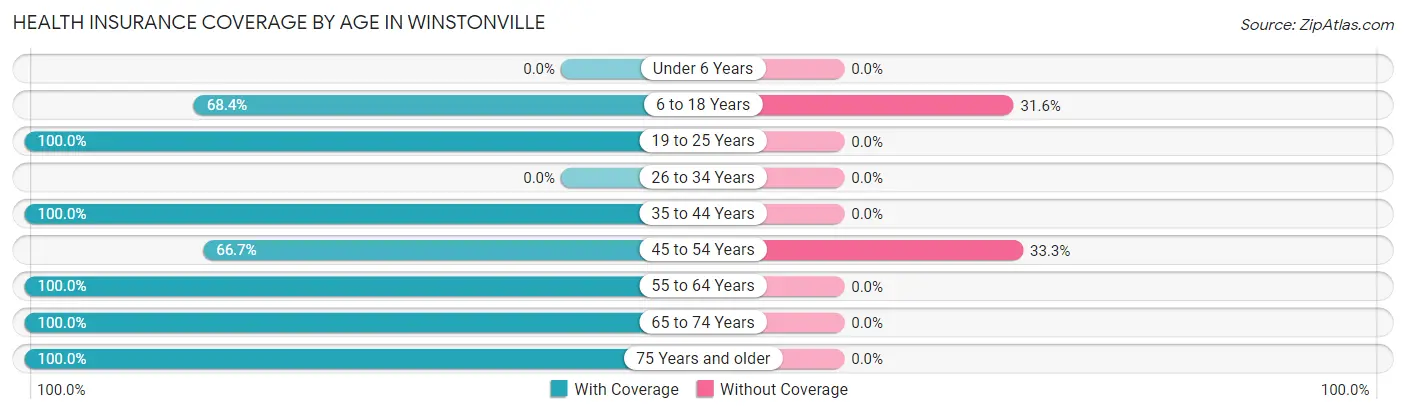
| Age Bracket | With Coverage | Without Coverage |
| Under 6 Years | 0 (0.0%) | 0 (0.0%) |
| 6 to 18 Years | 13 (68.4%) | 6 (31.6%) |
| 19 to 25 Years | 9 (100.0%) | 0 (0.0%) |
| 26 to 34 Years | 0 (0.0%) | 0 (0.0%) |
| 35 to 44 Years | 18 (100.0%) | 0 (0.0%) |
| 45 to 54 Years | 10 (66.7%) | 5 (33.3%) |
| 55 to 64 Years | 21 (100.0%) | 0 (0.0%) |
| 65 to 74 Years | 14 (100.0%) | 0 (0.0%) |
| 75 Years and older | 9 (100.0%) | 0 (0.0%) |
| Total | 94 (89.5%) | 11 (10.5%) |
Health Insurance Coverage by Citizenship Status in Winstonville
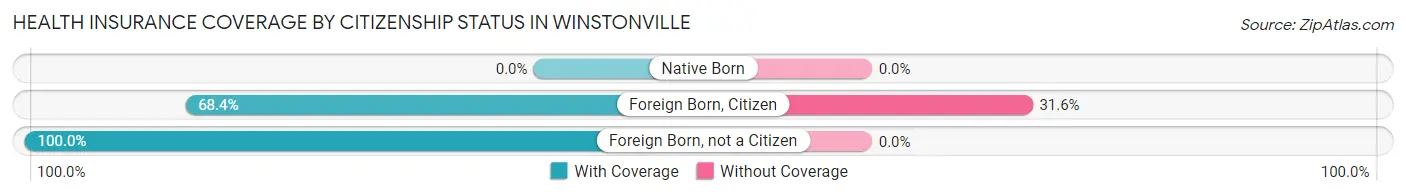
| Citizenship Status | With Coverage | Without Coverage |
| Native Born | 0 (0.0%) | 0 (0.0%) |
| Foreign Born, Citizen | 13 (68.4%) | 6 (31.6%) |
| Foreign Born, not a Citizen | 9 (100.0%) | 0 (0.0%) |
Health Insurance Coverage by Household Income in Winstonville
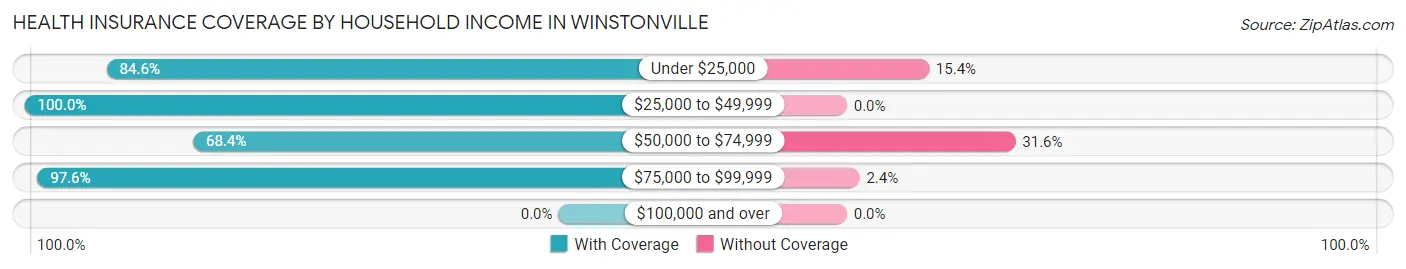
| Household Income | With Coverage | Without Coverage |
| Under $25,000 | 22 (84.6%) | 4 (15.4%) |
| $25,000 to $49,999 | 18 (100.0%) | 0 (0.0%) |
| $50,000 to $74,999 | 13 (68.4%) | 6 (31.6%) |
| $75,000 to $99,999 | 41 (97.6%) | 1 (2.4%) |
| $100,000 and over | 0 (0.0%) | 0 (0.0%) |
Public vs Private Health Insurance Coverage by Age in Winstonville
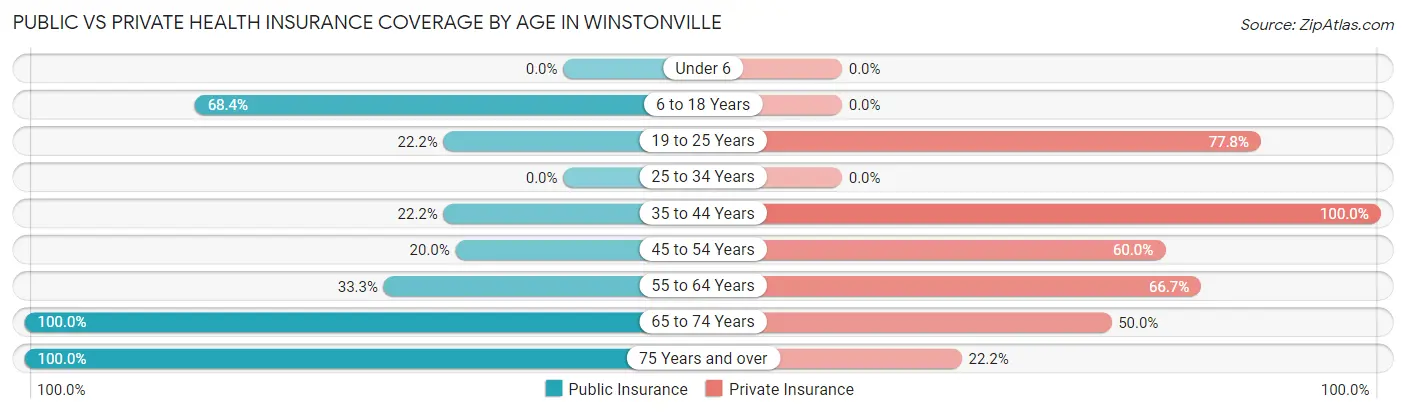
| Age Bracket | Public Insurance | Private Insurance |
| Under 6 | 0 (0.0%) | 0 (0.0%) |
| 6 to 18 Years | 13 (68.4%) | 0 (0.0%) |
| 19 to 25 Years | 2 (22.2%) | 7 (77.8%) |
| 25 to 34 Years | 0 (0.0%) | 0 (0.0%) |
| 35 to 44 Years | 4 (22.2%) | 18 (100.0%) |
| 45 to 54 Years | 3 (20.0%) | 9 (60.0%) |
| 55 to 64 Years | 7 (33.3%) | 14 (66.7%) |
| 65 to 74 Years | 14 (100.0%) | 7 (50.0%) |
| 75 Years and over | 9 (100.0%) | 2 (22.2%) |
| Total | 52 (49.5%) | 57 (54.3%) |
Disability Status by Sex by Age in Winstonville
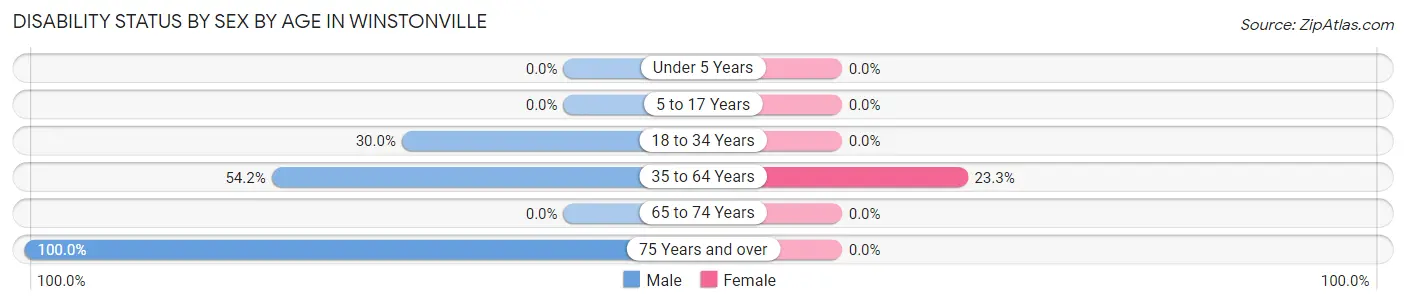
| Age Bracket | Male | Female |
| Under 5 Years | 0 (0.0%) | 0 (0.0%) |
| 5 to 17 Years | 0 (0.0%) | 0 (0.0%) |
| 18 to 34 Years | 3 (30.0%) | 0 (0.0%) |
| 35 to 64 Years | 13 (54.2%) | 7 (23.3%) |
| 65 to 74 Years | 0 (0.0%) | 0 (0.0%) |
| 75 Years and over | 2 (100.0%) | 0 (0.0%) |
Disability Class by Sex by Age in Winstonville
Disability Class: Hearing Difficulty
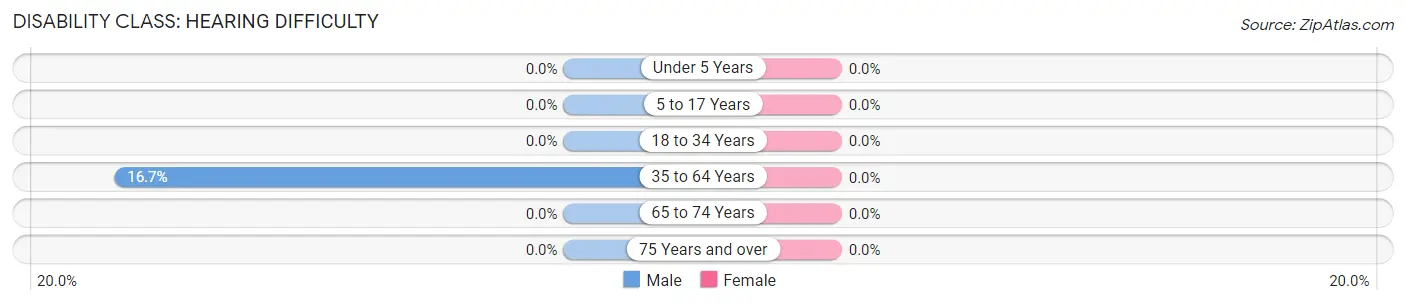
| Age Bracket | Male | Female |
| Under 5 Years | 0 (0.0%) | 0 (0.0%) |
| 5 to 17 Years | 0 (0.0%) | 0 (0.0%) |
| 18 to 34 Years | 0 (0.0%) | 0 (0.0%) |
| 35 to 64 Years | 4 (16.7%) | 0 (0.0%) |
| 65 to 74 Years | 0 (0.0%) | 0 (0.0%) |
| 75 Years and over | 0 (0.0%) | 0 (0.0%) |
Disability Class: Vision Difficulty
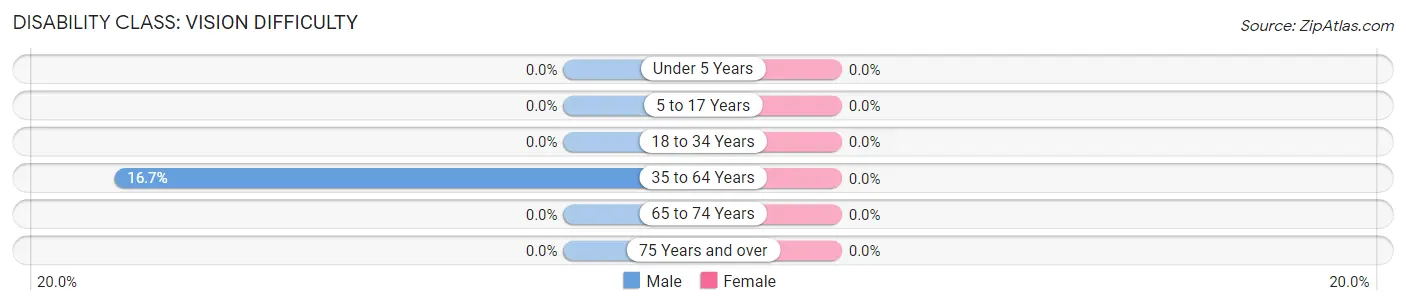
| Age Bracket | Male | Female |
| Under 5 Years | 0 (0.0%) | 0 (0.0%) |
| 5 to 17 Years | 0 (0.0%) | 0 (0.0%) |
| 18 to 34 Years | 0 (0.0%) | 0 (0.0%) |
| 35 to 64 Years | 4 (16.7%) | 0 (0.0%) |
| 65 to 74 Years | 0 (0.0%) | 0 (0.0%) |
| 75 Years and over | 0 (0.0%) | 0 (0.0%) |
Disability Class: Cognitive Difficulty
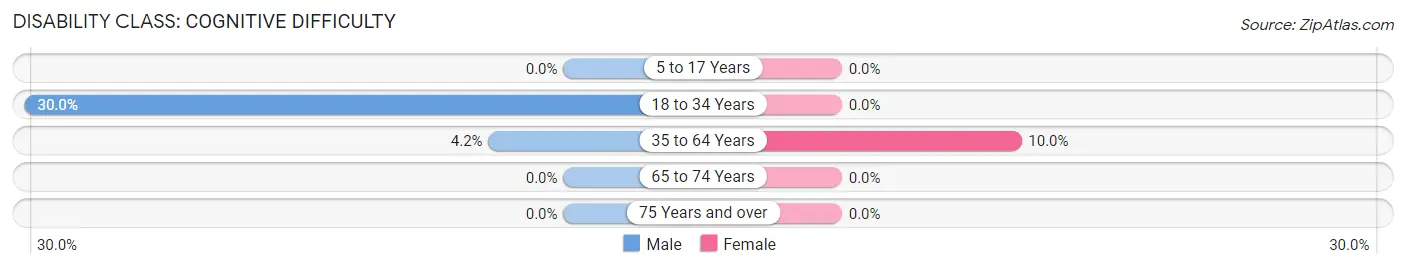
| Age Bracket | Male | Female |
| 5 to 17 Years | 0 (0.0%) | 0 (0.0%) |
| 18 to 34 Years | 3 (30.0%) | 0 (0.0%) |
| 35 to 64 Years | 1 (4.2%) | 3 (10.0%) |
| 65 to 74 Years | 0 (0.0%) | 0 (0.0%) |
| 75 Years and over | 0 (0.0%) | 0 (0.0%) |
Disability Class: Ambulatory Difficulty
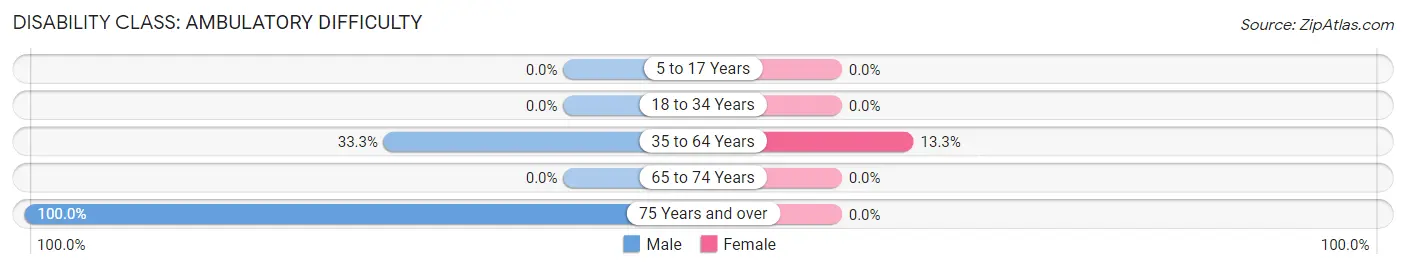
| Age Bracket | Male | Female |
| 5 to 17 Years | 0 (0.0%) | 0 (0.0%) |
| 18 to 34 Years | 0 (0.0%) | 0 (0.0%) |
| 35 to 64 Years | 8 (33.3%) | 4 (13.3%) |
| 65 to 74 Years | 0 (0.0%) | 0 (0.0%) |
| 75 Years and over | 2 (100.0%) | 0 (0.0%) |
Disability Class: Self-Care Difficulty
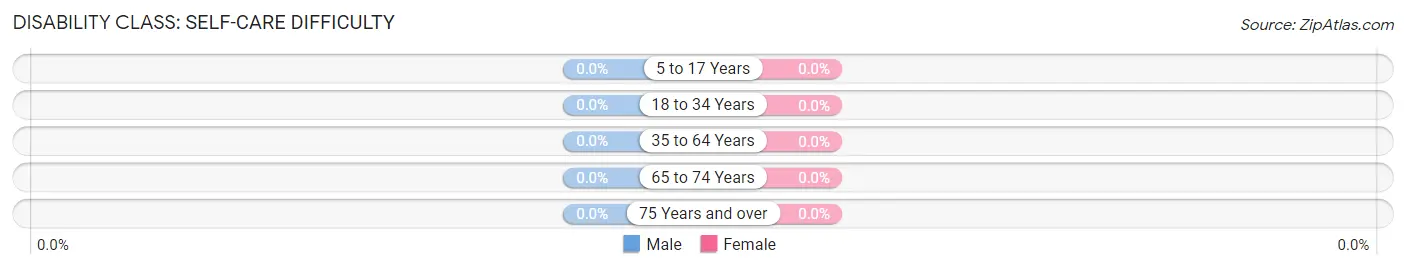
| Age Bracket | Male | Female |
| 5 to 17 Years | 0 (0.0%) | 0 (0.0%) |
| 18 to 34 Years | 0 (0.0%) | 0 (0.0%) |
| 35 to 64 Years | 0 (0.0%) | 0 (0.0%) |
| 65 to 74 Years | 0 (0.0%) | 0 (0.0%) |
| 75 Years and over | 0 (0.0%) | 0 (0.0%) |
Technology Access in Winstonville
Computing Device Access in Winstonville
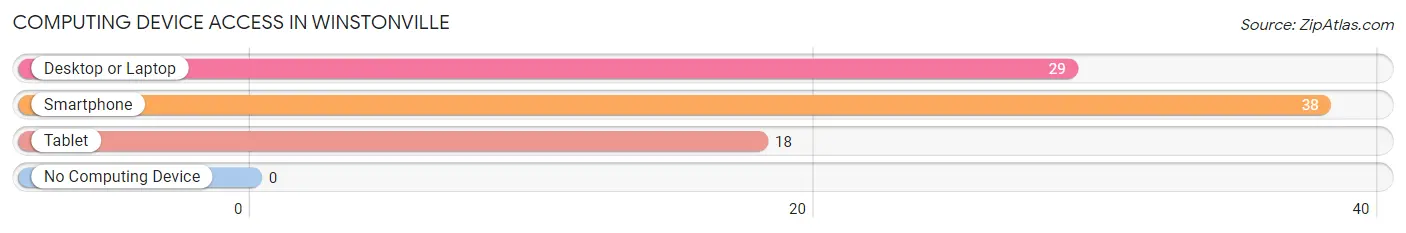
| Device Type | # Households | % Households |
| Desktop or Laptop | 29 | 76.3% |
| Smartphone | 38 | 100.0% |
| Tablet | 18 | 47.4% |
| No Computing Device | 0 | 0.0% |
| Total | 38 | 100.0% |
Internet Access in Winstonville
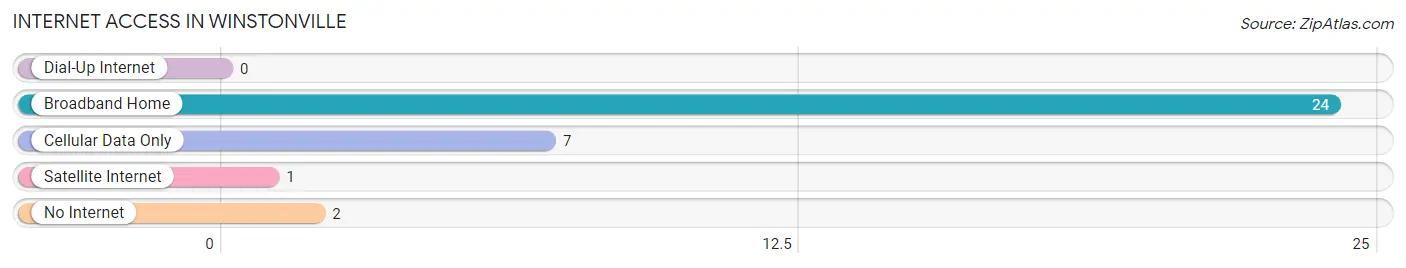
| Internet Type | # Households | % Households |
| Dial-Up Internet | 0 | 0.0% |
| Broadband Home | 24 | 63.2% |
| Cellular Data Only | 7 | 18.4% |
| Satellite Internet | 1 | 2.6% |
| No Internet | 2 | 5.3% |
| Total | 38 | 100.0% |
Winstonville Summary
Winstonville is a small unincorporated community located in Bolivar County, Mississippi. It is situated on the banks of the Mississippi River, approximately 10 miles south of the county seat of Cleveland. The population of Winstonville was estimated to be around 500 in 2000.
History
Winstonville was founded in 1871 by former slaves who had been freed after the Civil War. The town was named after a prominent African-American leader, William Winston, who was a leader in the local African-American community. Winstonville was a thriving community in the late 19th and early 20th centuries, with a population of over 1,000 people. The town was home to several businesses, including a general store, a blacksmith shop, a cotton gin, and a sawmill.
In the early 20th century, Winstonville was a center of African-American culture and education. The town was home to several churches, including the First Baptist Church, which was founded in 1872. The town also had a school, the Winstonville Colored School, which was established in 1891. The school was the first public school for African-Americans in Bolivar County.
Geography
Winstonville is located in the northwest corner of Bolivar County, Mississippi. It is situated on the banks of the Mississippi River, approximately 10 miles south of the county seat of Cleveland. The town is located in the Mississippi Delta region, which is characterized by flat, fertile land and numerous rivers and streams. The town is surrounded by agricultural land, primarily used for cotton and soybean production.
Economy
The economy of Winstonville is largely based on agriculture. The town is surrounded by agricultural land, primarily used for cotton and soybean production. The town also has several small businesses, including a general store, a blacksmith shop, and a sawmill.
Demographics
As of the 2000 census, the population of Winstonville was estimated to be around 500. The racial makeup of the town was 97.2% African American, 1.6% White, and 1.2% from other races. The median household income was $17,500, and the median family income was $19,000. The per capita income was $7,500. The poverty rate was 44.2%.
Conclusion
Winstonville is a small unincorporated community located in Bolivar County, Mississippi. It was founded in 1871 by former slaves who had been freed after the Civil War. The town was a thriving community in the late 19th and early 20th centuries, with a population of over 1,000 people. The economy of Winstonville is largely based on agriculture, and the town is surrounded by agricultural land, primarily used for cotton and soybean production. As of the 2000 census, the population of Winstonville was estimated to be around 500. The racial makeup of the town was 97.2% African American, 1.6% White, and 1.2% from other races. The median household income was $17,500, and the poverty rate was 44.2%.
Common Questions
What is Per Capita Income in Winstonville?
Per Capita income in Winstonville is $20,075.
What is the Median Family Income in Winstonville?
Median Family Income in Winstonville is $61,250.
What is the Median Household income in Winstonville?
Median Household Income in Winstonville is $50,000.
What is Inequality or Gini Index in Winstonville?
Inequality or Gini Index in Winstonville is 0.33.
What is the Total Population of Winstonville?
Total Population of Winstonville is 105.
What is the Total Male Population of Winstonville?
Total Male Population of Winstonville is 57.
What is the Total Female Population of Winstonville?
Total Female Population of Winstonville is 48.
What is the Ratio of Males per 100 Females in Winstonville?
There are 118.75 Males per 100 Females in Winstonville.
What is the Ratio of Females per 100 Males in Winstonville?
There are 84.21 Females per 100 Males in Winstonville.
What is the Median Population Age in Winstonville?
Median Population Age in Winstonville is 51.5 Years.
What is the Average Family Size in Winstonville
Average Family Size in Winstonville is 2.9 People.
What is the Average Household Size in Winstonville
Average Household Size in Winstonville is 2.8 People.
How Large is the Labor Force in Winstonville?
There are 48 People in the Labor Forcein in Winstonville.
What is the Percentage of People in the Labor Force in Winstonville?
50.5% of People are in the Labor Force in Winstonville.