North Tunica, MS Map & Demographics
North Tunica Map
North Tunica Overview
$12,763
PER CAPITA INCOME
0.61
INEQUALITY / GINI INDEX
941
TOTAL POPULATION
314
MALE POPULATION
627
FEMALE POPULATION
50.08
MALES / 100 FEMALES
199.68
FEMALES / 100 MALES
37.0
MEDIAN AGE
4.5
AVG FAMILY SIZE
2.8
AVG HOUSEHOLD SIZE
489
LABOR FORCE [ PEOPLE ]
66.0%
PERCENT IN LABOR FORCE
66.3%
UNEMPLOYMENT RATE
Income in North Tunica
Income Overview in North Tunica
| Characteristic | Number | Measure |
| Per Capita Income | 941 | $12,763 |
| Median Family Income | 166 | $0 |
| Mean Family Income | 166 | $49,455 |
| Median Household Income | 325 | $0 |
| Mean Household Income | 325 | $33,551 |
| Income Deficit | 166 | $0 |
| Wage / Income Gap (%) | 941 | 0.00% |
| Wage / Income Gap ($) | 941 | 100.00¢ per $1 |
| Gini / Inequality Index | 941 | 0.61 |
Earnings by Sex in North Tunica
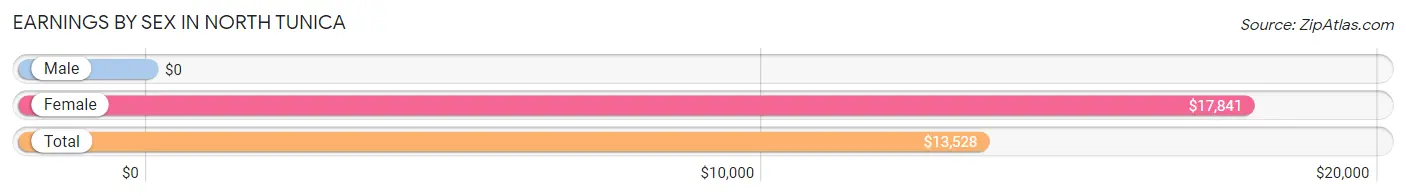
| Sex | Number | Average Earnings |
| Male | 174 (47.1%) | $0 |
| Female | 195 (52.8%) | $17,841 |
| Total | 369 (100.0%) | $13,528 |
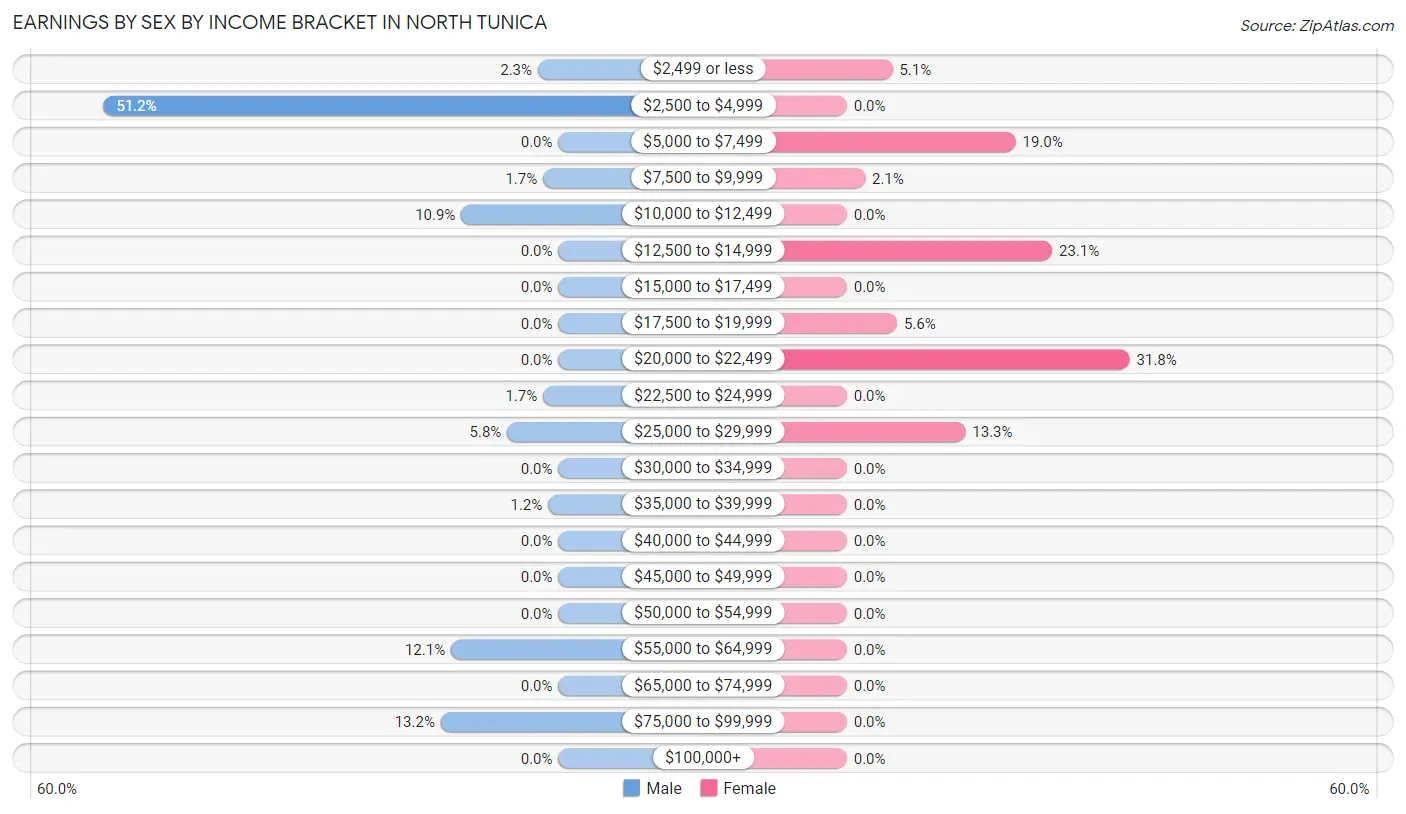
Earnings by Sex by Income Bracket in North Tunica
The most common earnings brackets in North Tunica are $2,500 to $4,999 for men (89 | 51.1%) and $20,000 to $22,499 for women (62 | 31.8%).
| Income | Male | Female |
| $2,499 or less | 4 (2.3%) | 10 (5.1%) |
| $2,500 to $4,999 | 89 (51.1%) | 0 (0.0%) |
| $5,000 to $7,499 | 0 (0.0%) | 37 (19.0%) |
| $7,500 to $9,999 | 3 (1.7%) | 4 (2.1%) |
| $10,000 to $12,499 | 19 (10.9%) | 0 (0.0%) |
| $12,500 to $14,999 | 0 (0.0%) | 45 (23.1%) |
| $15,000 to $17,499 | 0 (0.0%) | 0 (0.0%) |
| $17,500 to $19,999 | 0 (0.0%) | 11 (5.6%) |
| $20,000 to $22,499 | 0 (0.0%) | 62 (31.8%) |
| $22,500 to $24,999 | 3 (1.7%) | 0 (0.0%) |
| $25,000 to $29,999 | 10 (5.8%) | 26 (13.3%) |
| $30,000 to $34,999 | 0 (0.0%) | 0 (0.0%) |
| $35,000 to $39,999 | 2 (1.1%) | 0 (0.0%) |
| $40,000 to $44,999 | 0 (0.0%) | 0 (0.0%) |
| $45,000 to $49,999 | 0 (0.0%) | 0 (0.0%) |
| $50,000 to $54,999 | 0 (0.0%) | 0 (0.0%) |
| $55,000 to $64,999 | 21 (12.1%) | 0 (0.0%) |
| $65,000 to $74,999 | 0 (0.0%) | 0 (0.0%) |
| $75,000 to $99,999 | 23 (13.2%) | 0 (0.0%) |
| $100,000+ | 0 (0.0%) | 0 (0.0%) |
| Total | 174 (100.0%) | 195 (100.0%) |
Earnings by Sex by Educational Attainment in North Tunica
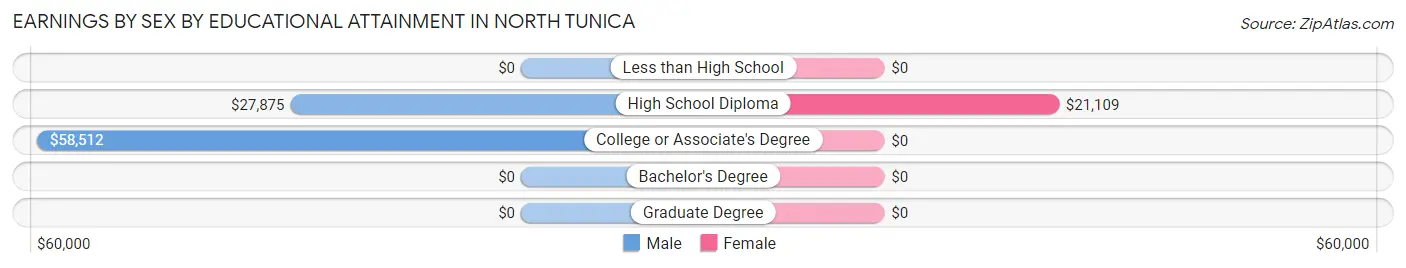
| Educational Attainment | Male Income | Female Income |
| Less than High School | - | - |
| High School Diploma | $27,875 | $21,109 |
| College or Associate's Degree | $58,512 | $0 |
| Bachelor's Degree | - | - |
| Graduate Degree | - | - |
| Total | - | - |
Family Income in North Tunica
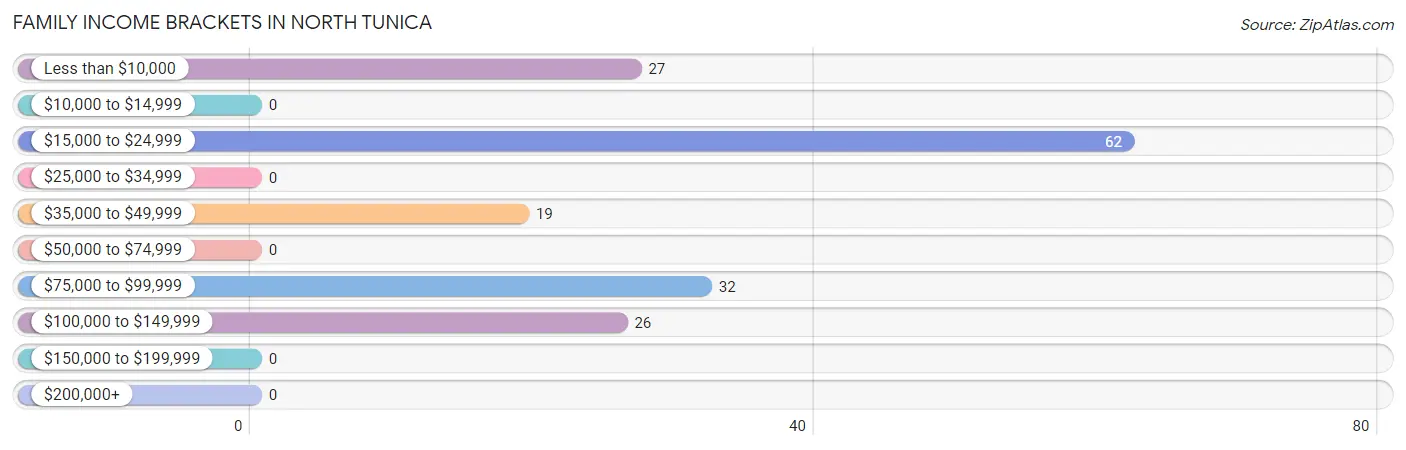
Family Income Brackets in North Tunica
According to the North Tunica family income data, there are 62 families falling into the $15,000 to $24,999 income range, which is the most common income bracket and makes up 37.3% of all families.
| Income Bracket | # Families | % Families |
| Less than $10,000 | 27 | 16.3% |
| $10,000 to $14,999 | 0 | 0.0% |
| $15,000 to $24,999 | 62 | 37.3% |
| $25,000 to $34,999 | 0 | 0.0% |
| $35,000 to $49,999 | 19 | 11.4% |
| $50,000 to $74,999 | 0 | 0.0% |
| $75,000 to $99,999 | 32 | 19.3% |
| $100,000 to $149,999 | 26 | 15.7% |
| $150,000 to $199,999 | 0 | 0.0% |
| $200,000+ | 0 | 0.0% |
Family Income by Famaliy Size in North Tunica
| Income Bracket | # Families | Median Income |
| 2-Person Families | 83 (50.0%) | $0 |
| 3-Person Families | 27 (16.3%) | $0 |
| 4-Person Families | 11 (6.6%) | $0 |
| 5-Person Families | 0 (0.0%) | $0 |
| 6-Person Families | 19 (11.5%) | $0 |
| 7+ Person Families | 26 (15.7%) | $0 |
| Total | 166 (100.0%) | $0 |
Family Income by Number of Earners in North Tunica
| Number of Earners | # Families | Median Income |
| No Earners | 27 (16.3%) | $0 |
| 1 Earner | 94 (56.6%) | $0 |
| 2 Earners | 0 (0.0%) | $0 |
| 3+ Earners | 45 (27.1%) | $0 |
| Total | 166 (100.0%) | $0 |
Household Income in North Tunica
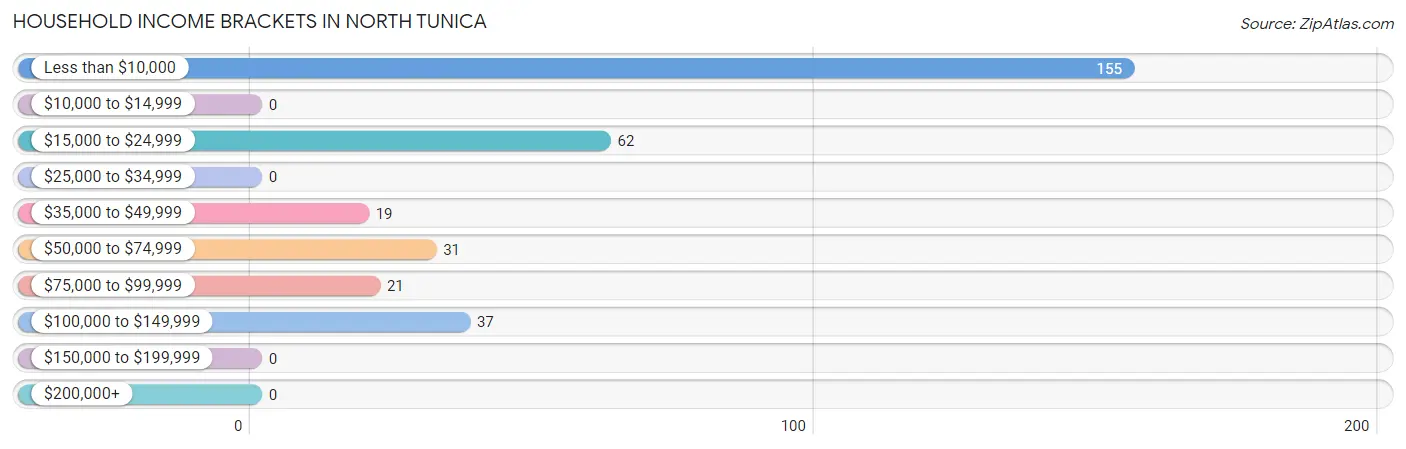
Household Income Brackets in North Tunica
With 155 households falling in the category, the less than $10,000 income range is the most frequent in North Tunica, accounting for 47.7% of all households.
| Income Bracket | # Households | % Households |
| Less than $10,000 | 155 | 47.7% |
| $10,000 to $14,999 | 0 | 0.0% |
| $15,000 to $24,999 | 62 | 19.1% |
| $25,000 to $34,999 | 0 | 0.0% |
| $35,000 to $49,999 | 19 | 5.8% |
| $50,000 to $74,999 | 31 | 9.5% |
| $75,000 to $99,999 | 21 | 6.5% |
| $100,000 to $149,999 | 37 | 11.4% |
| $150,000 to $199,999 | 0 | 0.0% |
| $200,000+ | 0 | 0.0% |
Household Income by Householder Age in North Tunica
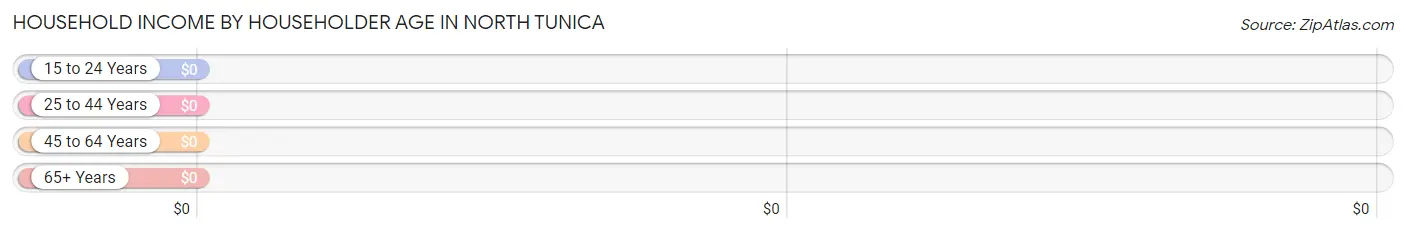
| Income Bracket | # Households | Median Income |
| 15 to 24 Years | 0 (0.0%) | $0 |
| 25 to 44 Years | 147 (45.2%) | $0 |
| 45 to 64 Years | 114 (35.1%) | $0 |
| 65+ Years | 64 (19.7%) | $0 |
| Total | 325 (100.0%) | $0 |
Poverty in North Tunica
Income Below Poverty by Sex and Age in North Tunica
With 8.4% poverty level for males and 33.7% for females among the residents of North Tunica, 35 to 44 year old males and under 5 year old females are the most vulnerable to poverty, with 21 males (38.9%) and 36 females (100.0%) in their respective age groups living below the poverty level.
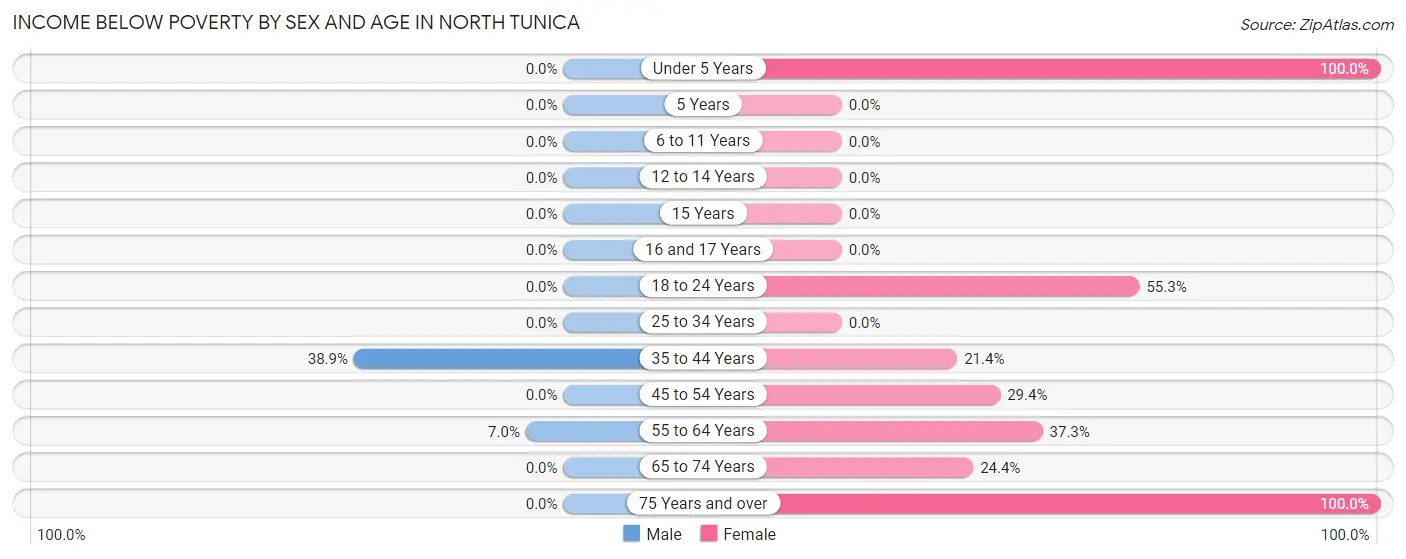
| Age Bracket | Male | Female |
| Under 5 Years | 0 (0.0%) | 36 (100.0%) |
| 5 Years | 0 (0.0%) | 0 (0.0%) |
| 6 to 11 Years | 0 (0.0%) | 0 (0.0%) |
| 12 to 14 Years | 0 (0.0%) | 0 (0.0%) |
| 15 Years | 0 (0.0%) | 0 (0.0%) |
| 16 and 17 Years | 0 (0.0%) | 0 (0.0%) |
| 18 to 24 Years | 0 (0.0%) | 42 (55.3%) |
| 25 to 34 Years | 0 (0.0%) | 0 (0.0%) |
| 35 to 44 Years | 21 (38.9%) | 27 (21.4%) |
| 45 to 54 Years | 0 (0.0%) | 30 (29.4%) |
| 55 to 64 Years | 3 (7.0%) | 41 (37.3%) |
| 65 to 74 Years | 0 (0.0%) | 10 (24.4%) |
| 75 Years and over | 0 (0.0%) | 23 (100.0%) |
| Total | 24 (8.4%) | 209 (33.7%) |
Income Above Poverty by Sex and Age in North Tunica
According to the poverty statistics in North Tunica, males aged 5 years and females aged 6 to 11 years are the age groups that are most secure financially, with 100.0% of males and 100.0% of females in these age groups living above the poverty line.
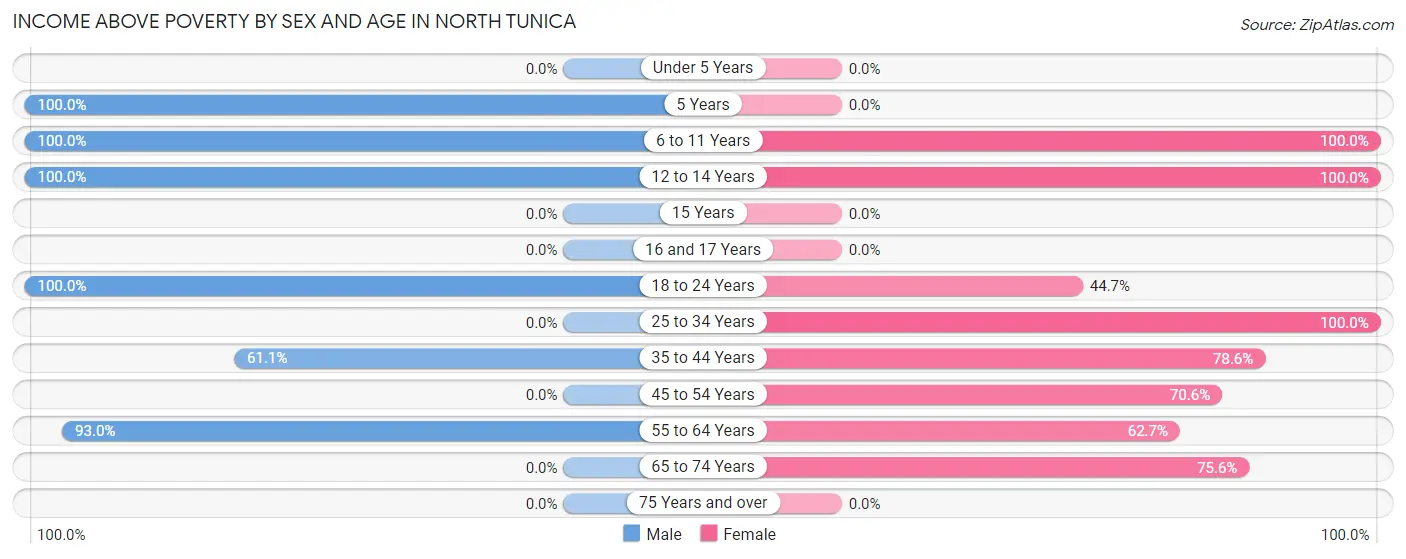
| Age Bracket | Male | Female |
| Under 5 Years | 0 (0.0%) | 0 (0.0%) |
| 5 Years | 32 (100.0%) | 0 (0.0%) |
| 6 to 11 Years | 27 (100.0%) | 50 (100.0%) |
| 12 to 14 Years | 44 (100.0%) | 11 (100.0%) |
| 15 Years | 0 (0.0%) | 0 (0.0%) |
| 16 and 17 Years | 0 (0.0%) | 0 (0.0%) |
| 18 to 24 Years | 87 (100.0%) | 34 (44.7%) |
| 25 to 34 Years | 0 (0.0%) | 45 (100.0%) |
| 35 to 44 Years | 33 (61.1%) | 99 (78.6%) |
| 45 to 54 Years | 0 (0.0%) | 72 (70.6%) |
| 55 to 64 Years | 40 (93.0%) | 69 (62.7%) |
| 65 to 74 Years | 0 (0.0%) | 31 (75.6%) |
| 75 Years and over | 0 (0.0%) | 0 (0.0%) |
| Total | 263 (91.6%) | 411 (66.3%) |
Income Below Poverty Among Married-Couple Families in North Tunica
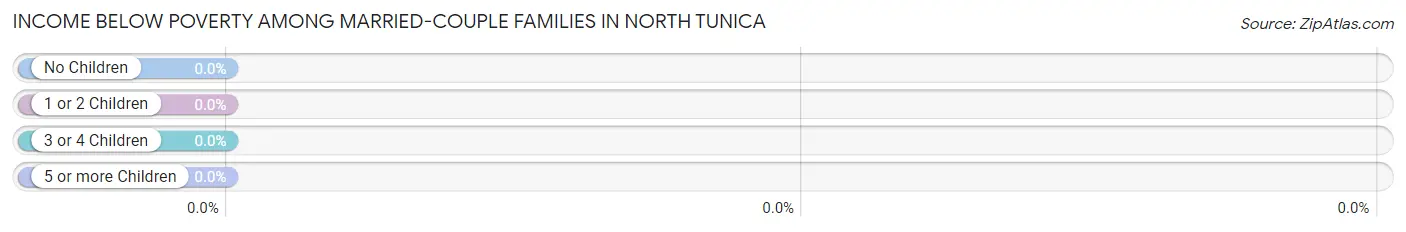
| Children | Above Poverty | Below Poverty |
| No Children | 21 (100.0%) | 0 (0.0%) |
| 1 or 2 Children | 19 (100.0%) | 0 (0.0%) |
| 3 or 4 Children | 26 (100.0%) | 0 (0.0%) |
| 5 or more Children | 0 (0.0%) | 0 (0.0%) |
| Total | 66 (100.0%) | 0 (0.0%) |
Income Below Poverty Among Single-Parent Households in North Tunica
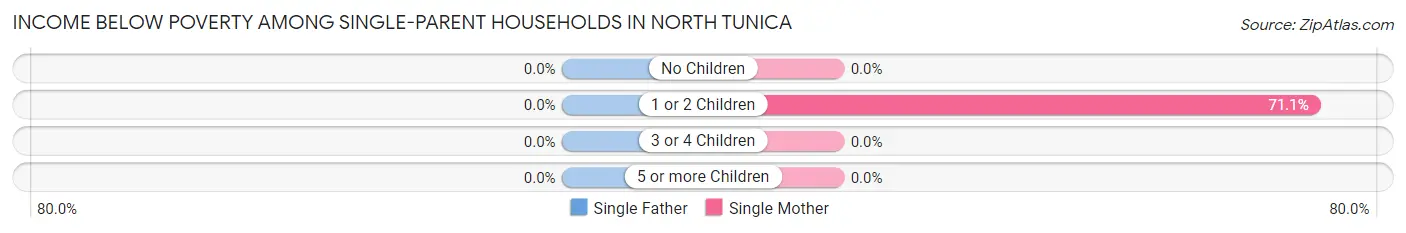
| Children | Single Father | Single Mother |
| No Children | 0 (0.0%) | 0 (0.0%) |
| 1 or 2 Children | 0 (0.0%) | 27 (71.1%) |
| 3 or 4 Children | 0 (0.0%) | 0 (0.0%) |
| 5 or more Children | 0 (0.0%) | 0 (0.0%) |
| Total | 0 (0.0%) | 27 (27.0%) |
Income Below Poverty Among Married-Couple vs Single-Parent Households in North Tunica
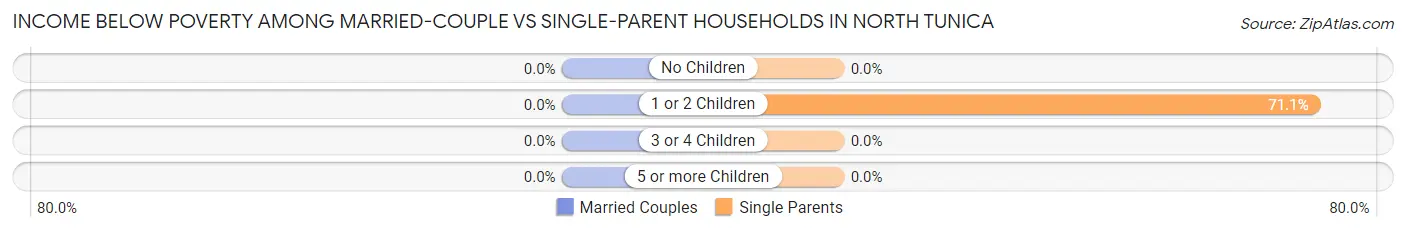
| Children | Married-Couple Families | Single-Parent Households |
| No Children | 0 (0.0%) | 0 (0.0%) |
| 1 or 2 Children | 0 (0.0%) | 27 (71.1%) |
| 3 or 4 Children | 0 (0.0%) | 0 (0.0%) |
| 5 or more Children | 0 (0.0%) | 0 (0.0%) |
| Total | 0 (0.0%) | 27 (27.0%) |
Race in North Tunica
The most populous races in North Tunica are Black / African American (934 | 99.3%), and White / Caucasian (7 | 0.7%).
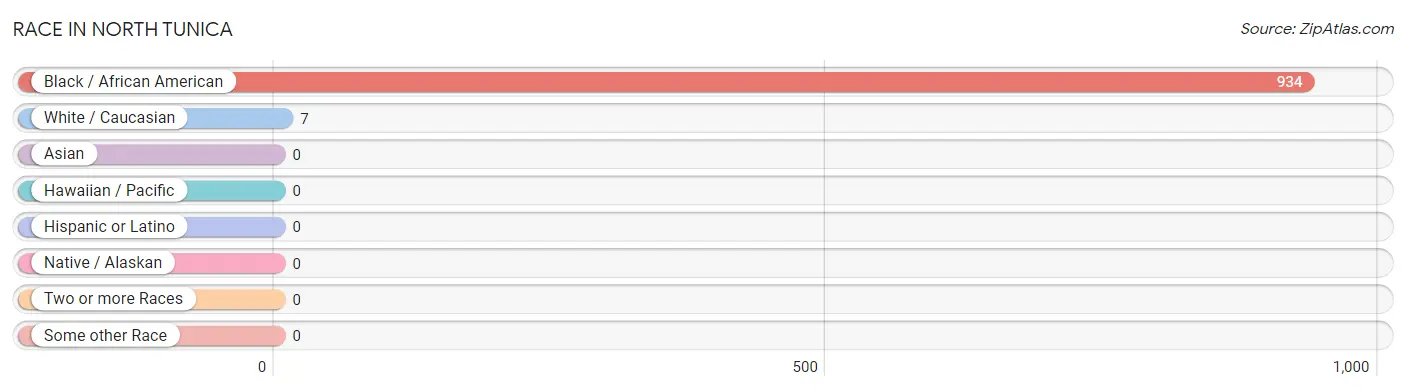
| Race | # Population | % Population |
| Asian | 0 | 0.0% |
| Black / African American | 934 | 99.3% |
| Hawaiian / Pacific | 0 | 0.0% |
| Hispanic or Latino | 0 | 0.0% |
| Native / Alaskan | 0 | 0.0% |
| White / Caucasian | 7 | 0.7% |
| Two or more Races | 0 | 0.0% |
| Some other Race | 0 | 0.0% |
| Total | 941 | 100.0% |
Ancestry in North Tunica
The most populous ancestries reported in North Tunica are African (4 | 0.4%), Subsaharan African (4 | 0.4%), English (3 | 0.3%), and German (2 | 0.2%), together accounting for 1.4% of all North Tunica residents.
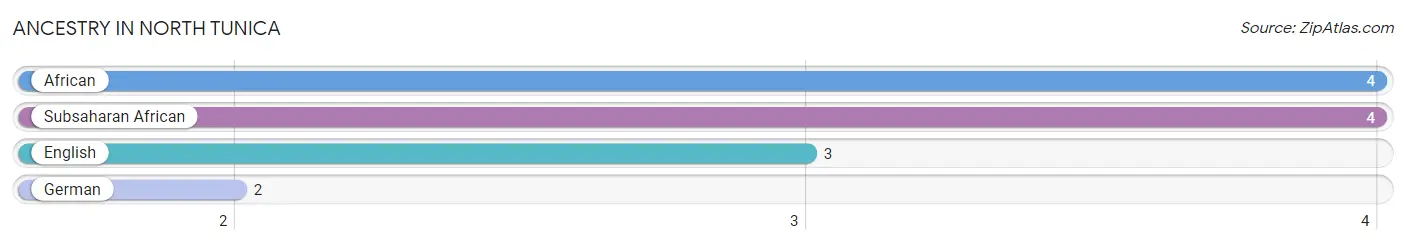
| Ancestry | # Population | % Population |
| African | 4 | 0.4% |
| English | 3 | 0.3% |
| German | 2 | 0.2% |
| Subsaharan African | 4 | 0.4% | View All 4 Rows |
Immigrants in North Tunica

| Immigration Origin | # Population | % Population | View All 0 Rows |
Sex and Age in North Tunica
Sex and Age in North Tunica
The most populous age groups in North Tunica are 20 to 24 Years (92 | 29.3%) for men and 35 to 39 Years (92 | 14.7%) for women.
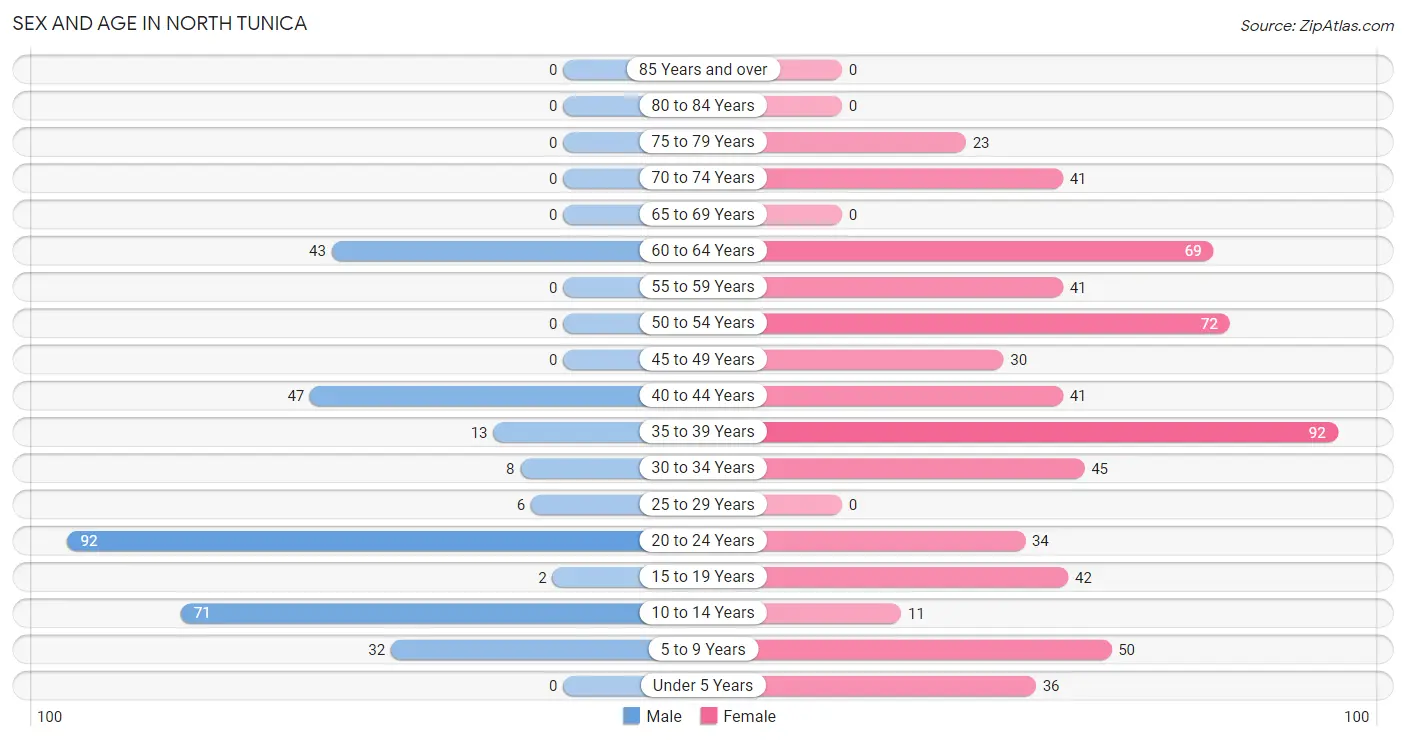
| Age Bracket | Male | Female |
| Under 5 Years | 0 (0.0%) | 36 (5.7%) |
| 5 to 9 Years | 32 (10.2%) | 50 (8.0%) |
| 10 to 14 Years | 71 (22.6%) | 11 (1.8%) |
| 15 to 19 Years | 2 (0.6%) | 42 (6.7%) |
| 20 to 24 Years | 92 (29.3%) | 34 (5.4%) |
| 25 to 29 Years | 6 (1.9%) | 0 (0.0%) |
| 30 to 34 Years | 8 (2.5%) | 45 (7.2%) |
| 35 to 39 Years | 13 (4.1%) | 92 (14.7%) |
| 40 to 44 Years | 47 (15.0%) | 41 (6.5%) |
| 45 to 49 Years | 0 (0.0%) | 30 (4.8%) |
| 50 to 54 Years | 0 (0.0%) | 72 (11.5%) |
| 55 to 59 Years | 0 (0.0%) | 41 (6.5%) |
| 60 to 64 Years | 43 (13.7%) | 69 (11.0%) |
| 65 to 69 Years | 0 (0.0%) | 0 (0.0%) |
| 70 to 74 Years | 0 (0.0%) | 41 (6.5%) |
| 75 to 79 Years | 0 (0.0%) | 23 (3.7%) |
| 80 to 84 Years | 0 (0.0%) | 0 (0.0%) |
| 85 Years and over | 0 (0.0%) | 0 (0.0%) |
| Total | 314 (100.0%) | 627 (100.0%) |
Families and Households in North Tunica
Median Family Size in North Tunica
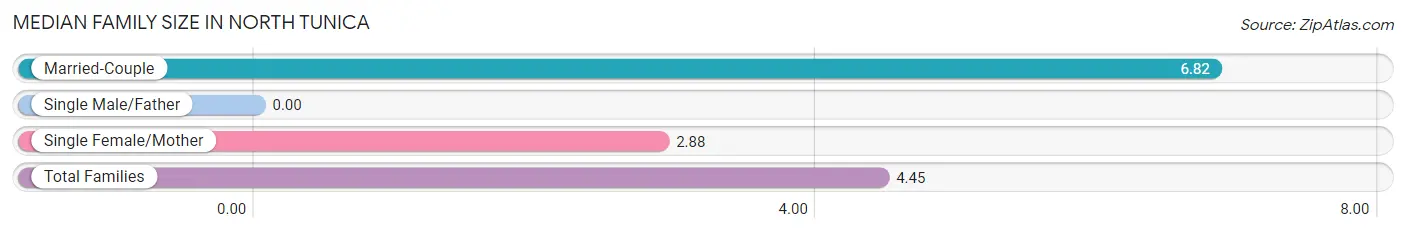
| Family Type | # Families | Family Size |
| Married-Couple | 66 (39.8%) | 6.82 |
| Single Male/Father | 0 (0.0%) | - |
| Single Female/Mother | 100 (60.2%) | 2.88 |
| Total Families | 166 (100.0%) | 4.45 |
Median Household Size in North Tunica
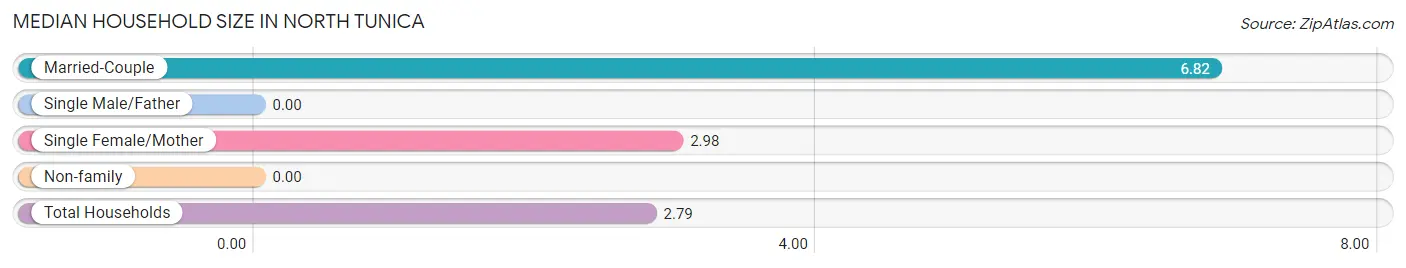
| Household Type | # Households | Household Size |
| Married-Couple | 66 (20.3%) | 6.82 |
| Single Male/Father | 0 (0.0%) | - |
| Single Female/Mother | 100 (30.8%) | 2.98 |
| Non-family | 159 (48.9%) | - |
| Total Households | 325 (100.0%) | 2.79 |
Household Size by Marriage Status in North Tunica
Out of a total of 325 households in North Tunica, 166 (51.1%) are family households, while 159 (48.9%) are nonfamily households. The most numerous type of family households are 2-person households, comprising 83, and the most common type of nonfamily households are 1-person households, comprising 159.
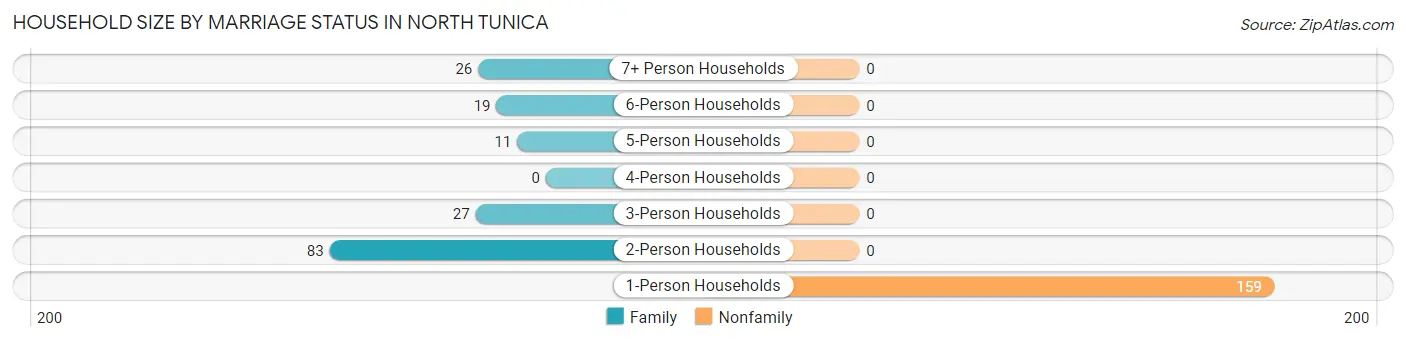
| Household Size | Family Households | Nonfamily Households |
| 1-Person Households | - | 159 (48.9%) |
| 2-Person Households | 83 (25.5%) | 0 (0.0%) |
| 3-Person Households | 27 (8.3%) | 0 (0.0%) |
| 4-Person Households | 0 (0.0%) | 0 (0.0%) |
| 5-Person Households | 11 (3.4%) | 0 (0.0%) |
| 6-Person Households | 19 (5.9%) | 0 (0.0%) |
| 7+ Person Households | 26 (8.0%) | 0 (0.0%) |
| Total | 166 (51.1%) | 159 (48.9%) |
Female Fertility in North Tunica
Fertility by Age in North Tunica
| Age Bracket | Women with Births | Births / 1,000 Women |
| 15 to 19 years | 0 (0.0%) | 0.0 |
| 20 to 34 years | 0 (0.0%) | 0.0 |
| 35 to 50 years | 0 (0.0%) | 0.0 |
| Total | 0 (0.0%) | 0.0 |
Fertility by Age by Marriage Status in North Tunica
| Age Bracket | Married | Unmarried |
| 15 to 19 years | 0 (0.0%) | 0 (0.0%) |
| 20 to 34 years | 0 (0.0%) | 0 (0.0%) |
| 35 to 50 years | 0 (0.0%) | 0 (0.0%) |
| Total | 0 (0.0%) | 0 (0.0%) |
Fertility by Education in North Tunica
| Educational Attainment | Women with Births | Births / 1,000 Women |
| Less than High School | 0 (0.0%) | 0.0 |
| High School Diploma | 0 (0.0%) | 0.0 |
| College or Associate's Degree | 0 (0.0%) | 0.0 |
| Bachelor's Degree | 0 (0.0%) | 0.0 |
| Graduate Degree | 0 (0.0%) | 0.0 |
| Total | 0 (0.0%) | 0.0 |
Fertility by Education by Marriage Status in North Tunica
| Educational Attainment | Married | Unmarried |
| Less than High School | 0 (0.0%) | 0 (0.0%) |
| High School Diploma | 0 (0.0%) | 0 (0.0%) |
| College or Associate's Degree | 0 (0.0%) | 0 (0.0%) |
| Bachelor's Degree | 0 (0.0%) | 0 (0.0%) |
| Graduate Degree | 0 (0.0%) | 0 (0.0%) |
| Total | 0 (0.0%) | 0 (0.0%) |
Employment Characteristics in North Tunica
Employment by Class of Employer in North Tunica
Among the 165 employed individuals in North Tunica, state government employees (49 | 29.7%), local government employees (45 | 27.3%), and private company employees (42 | 25.5%) make up the most common classes of employment.
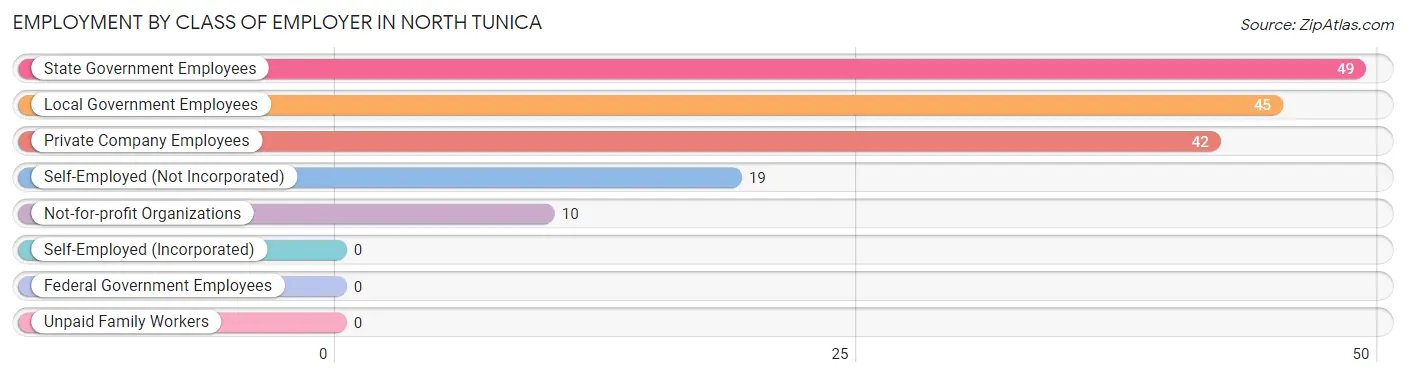
| Employer Class | # Employees | % Employees |
| Private Company Employees | 42 | 25.5% |
| Self-Employed (Incorporated) | 0 | 0.0% |
| Self-Employed (Not Incorporated) | 19 | 11.5% |
| Not-for-profit Organizations | 10 | 6.1% |
| Local Government Employees | 45 | 27.3% |
| State Government Employees | 49 | 29.7% |
| Federal Government Employees | 0 | 0.0% |
| Unpaid Family Workers | 0 | 0.0% |
| Total | 165 | 100.0% |
Employment Status by Age in North Tunica
According to the labor force statistics for North Tunica, out of the total population over 16 years of age (741), 66.0% or 489 individuals are in the labor force, with 66.3% or 324 of them unemployed. The age group with the highest labor force participation rate is 20 to 24 years, with 96.0% or 121 individuals in the labor force. Within the labor force, the 16 to 19 years age range has the highest percentage of unemployed individuals, with 100.0% or 42 of them being unemployed.
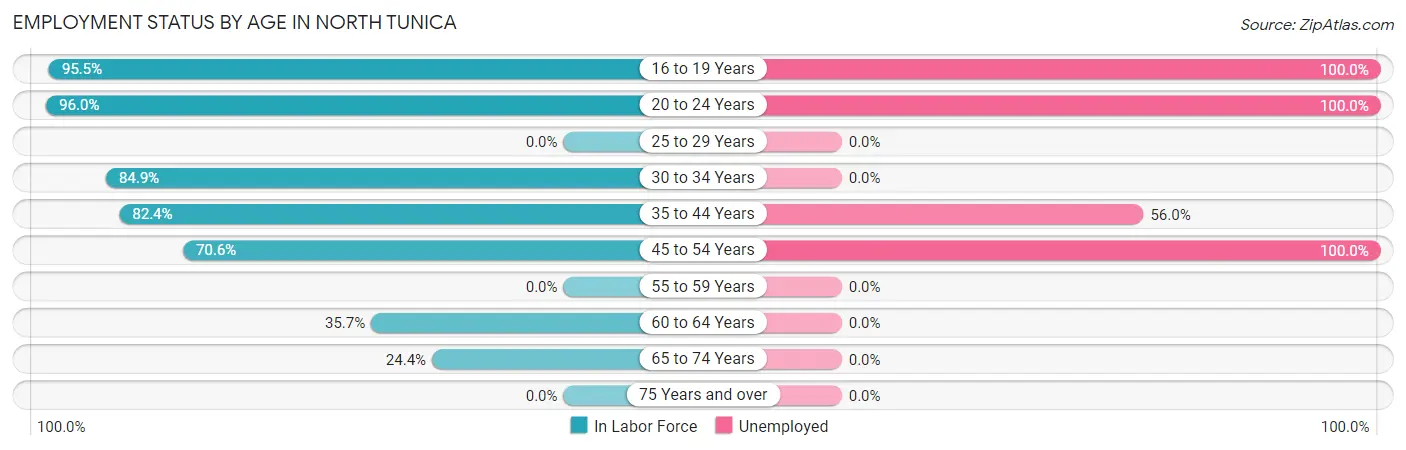
| Age Bracket | In Labor Force | Unemployed |
| 16 to 19 Years | 42 (95.5%) | 42 (100.0%) |
| 20 to 24 Years | 121 (96.0%) | 121 (100.0%) |
| 25 to 29 Years | 0 (0.0%) | 0 (0.0%) |
| 30 to 34 Years | 45 (84.9%) | 0 (0.0%) |
| 35 to 44 Years | 159 (82.4%) | 89 (56.0%) |
| 45 to 54 Years | 72 (70.6%) | 72 (100.0%) |
| 55 to 59 Years | 0 (0.0%) | 0 (0.0%) |
| 60 to 64 Years | 40 (35.7%) | 0 (0.0%) |
| 65 to 74 Years | 10 (24.4%) | 0 (0.0%) |
| 75 Years and over | 0 (0.0%) | 0 (0.0%) |
| Total | 489 (66.0%) | 324 (66.3%) |
Employment Status by Educational Attainment in North Tunica
According to labor force statistics for North Tunica, 62.3% of individuals (316) out of the total population between 25 and 64 years of age (507) are in the labor force, with 50.9% or 161 of them being unemployed. The group with the highest labor force participation rate are those with the educational attainment of bachelor's degree or higher, with 100.0% or 60 individuals in the labor force. Within the labor force, individuals with high school diploma education have the highest percentage of unemployment, with 93.1% or 134 of them being unemployed.
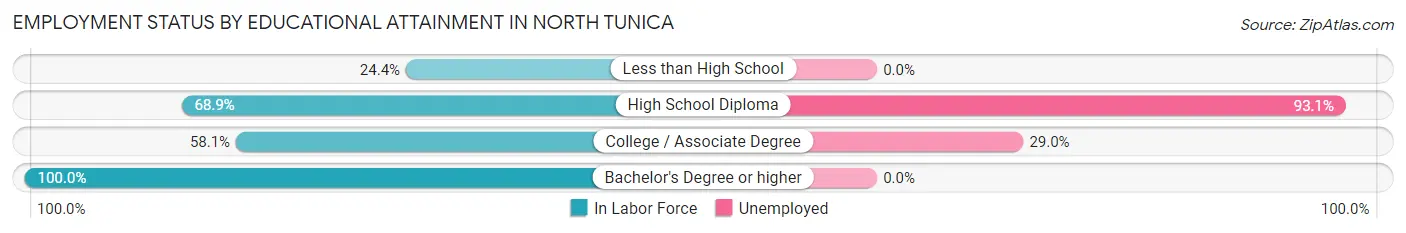
| Educational Attainment | In Labor Force | Unemployed |
| Less than High School | 19 (24.4%) | 0 (0.0%) |
| High School Diploma | 144 (68.9%) | 195 (93.1%) |
| College / Associate Degree | 93 (58.1%) | 46 (29.0%) |
| Bachelor's Degree or higher | 60 (100.0%) | 0 (0.0%) |
| Total | 316 (62.3%) | 258 (50.9%) |
Employment Occupations by Sex in North Tunica
Management, Business, Science and Arts Occupations
The most common Management, Business, Science and Arts occupations in North Tunica are Community & Social Service (94 | 57.0%), and Education Instruction & Library (94 | 57.0%).
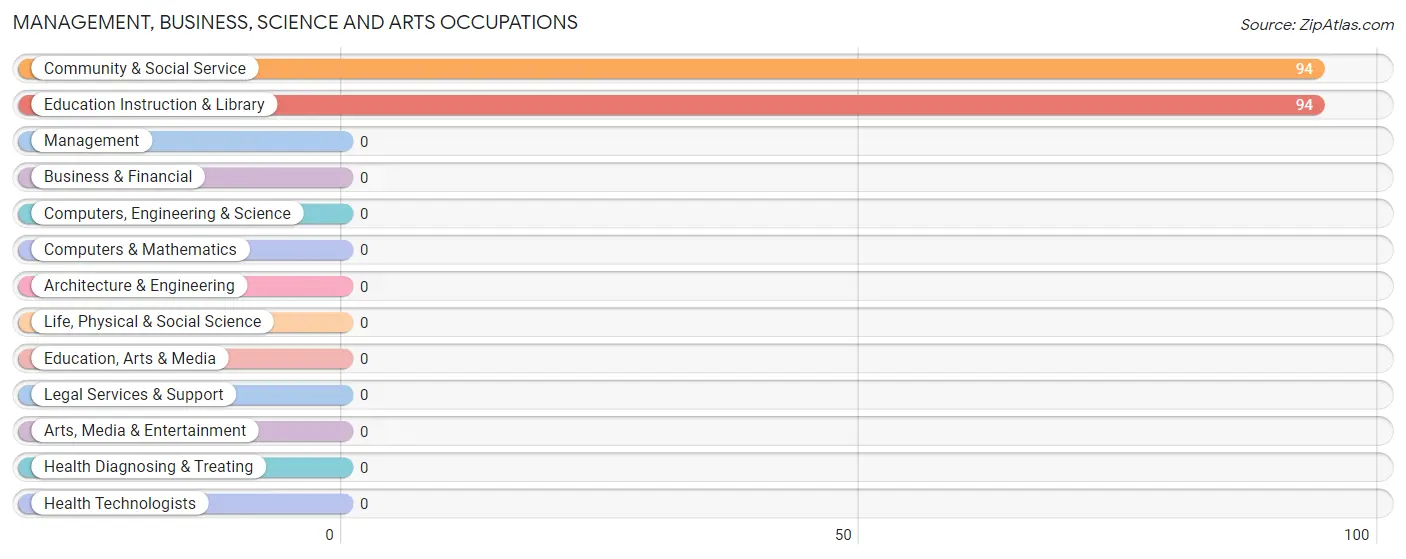
Management, Business, Science and Arts Occupations by Sex
Within the Management, Business, Science and Arts occupations in North Tunica, the most male-oriented occupations are Community & Social Service (24.5%), and Education Instruction & Library (24.5%), while the most female-oriented occupations are Community & Social Service (75.5%), and Education Instruction & Library (75.5%).
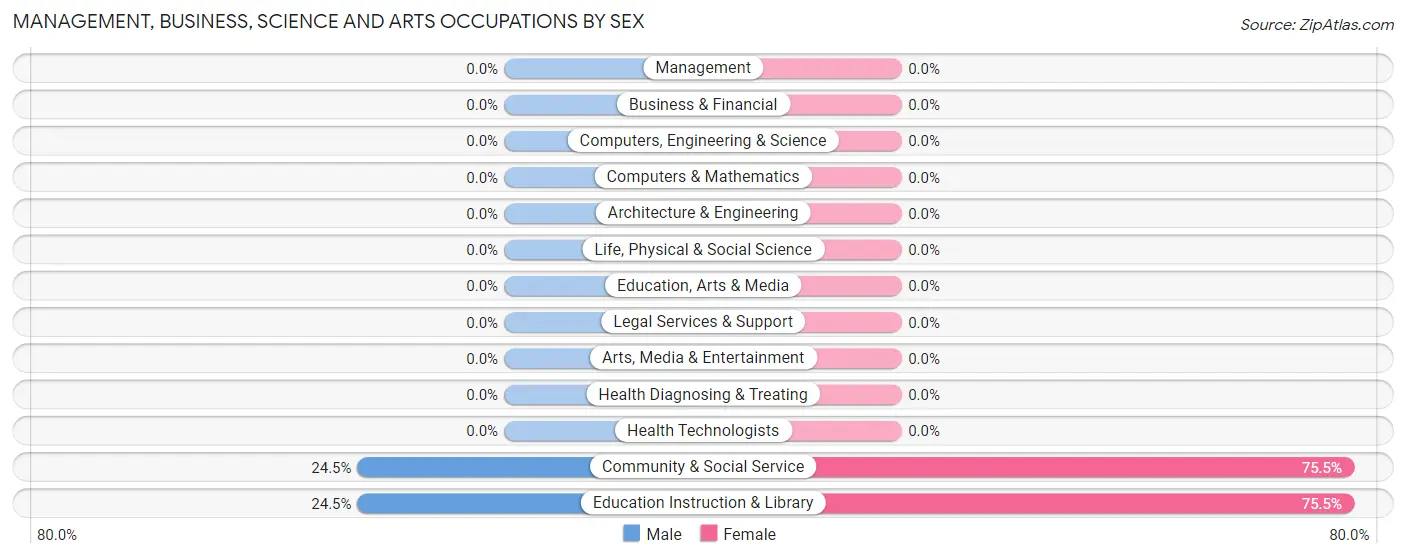
| Occupation | Male | Female |
| Management | 0 (0.0%) | 0 (0.0%) |
| Business & Financial | 0 (0.0%) | 0 (0.0%) |
| Computers, Engineering & Science | 0 (0.0%) | 0 (0.0%) |
| Computers & Mathematics | 0 (0.0%) | 0 (0.0%) |
| Architecture & Engineering | 0 (0.0%) | 0 (0.0%) |
| Life, Physical & Social Science | 0 (0.0%) | 0 (0.0%) |
| Community & Social Service | 23 (24.5%) | 71 (75.5%) |
| Education, Arts & Media | 0 (0.0%) | 0 (0.0%) |
| Legal Services & Support | 0 (0.0%) | 0 (0.0%) |
| Education Instruction & Library | 23 (24.5%) | 71 (75.5%) |
| Arts, Media & Entertainment | 0 (0.0%) | 0 (0.0%) |
| Health Diagnosing & Treating | 0 (0.0%) | 0 (0.0%) |
| Health Technologists | 0 (0.0%) | 0 (0.0%) |
| Total (Category) | 23 (24.5%) | 71 (75.5%) |
| Total (Overall) | 73 (44.2%) | 92 (55.8%) |
Services Occupations
The most common Services occupations in North Tunica are , and Food Preparation & Serving (29 | 17.6%).
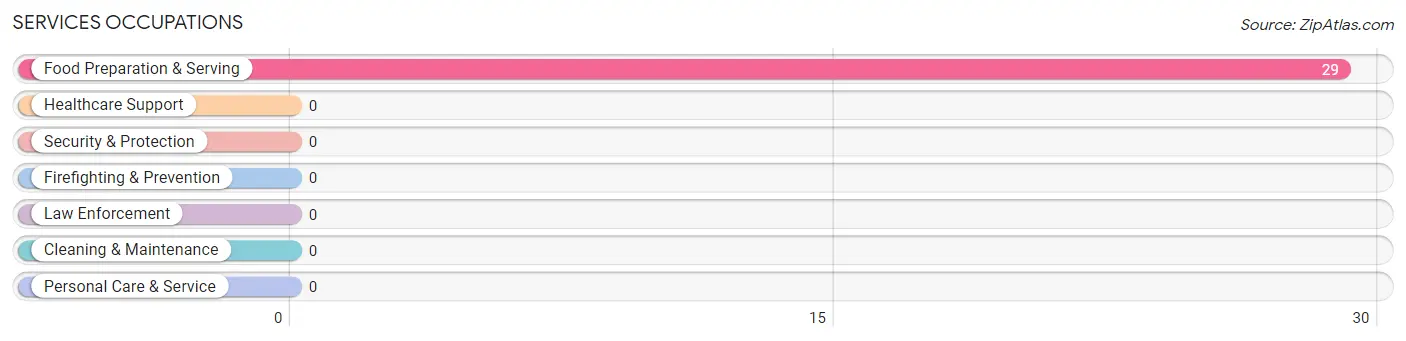
Services Occupations by Sex
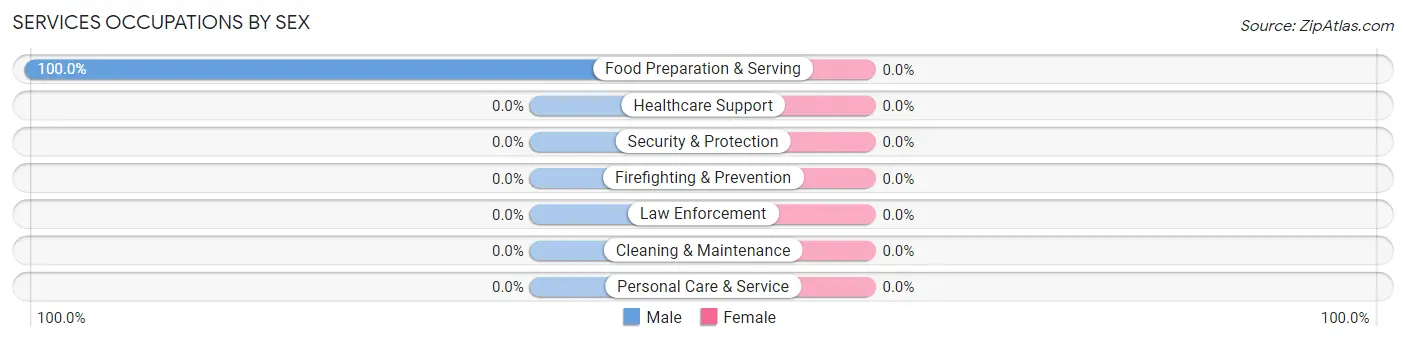
| Occupation | Male | Female |
| Healthcare Support | 0 (0.0%) | 0 (0.0%) |
| Security & Protection | 0 (0.0%) | 0 (0.0%) |
| Firefighting & Prevention | 0 (0.0%) | 0 (0.0%) |
| Law Enforcement | 0 (0.0%) | 0 (0.0%) |
| Food Preparation & Serving | 29 (100.0%) | 0 (0.0%) |
| Cleaning & Maintenance | 0 (0.0%) | 0 (0.0%) |
| Personal Care & Service | 0 (0.0%) | 0 (0.0%) |
| Total (Category) | 29 (100.0%) | 0 (0.0%) |
| Total (Overall) | 73 (44.2%) | 92 (55.8%) |
Sales and Office Occupations
The most common Sales and Office occupations in North Tunica are , and Office & Administration (21 | 12.7%).
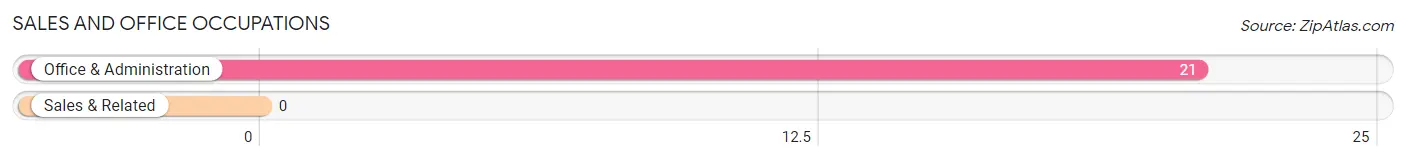
Sales and Office Occupations by Sex
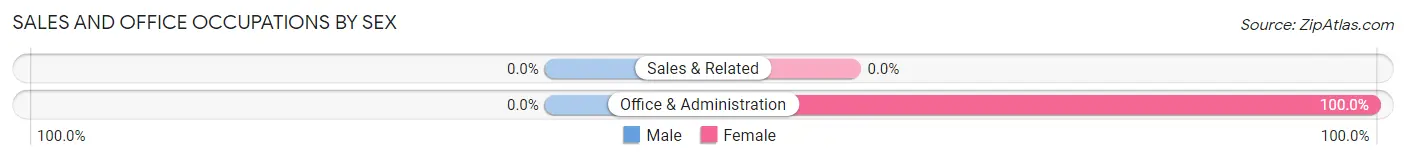
| Occupation | Male | Female |
| Sales & Related | 0 (0.0%) | 0 (0.0%) |
| Office & Administration | 0 (0.0%) | 21 (100.0%) |
| Total (Category) | 0 (0.0%) | 21 (100.0%) |
| Total (Overall) | 73 (44.2%) | 92 (55.8%) |
Natural Resources, Construction and Maintenance Occupations
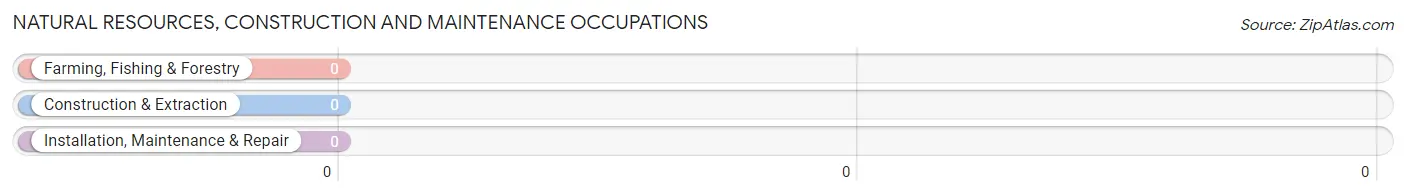
Natural Resources, Construction and Maintenance Occupations by Sex
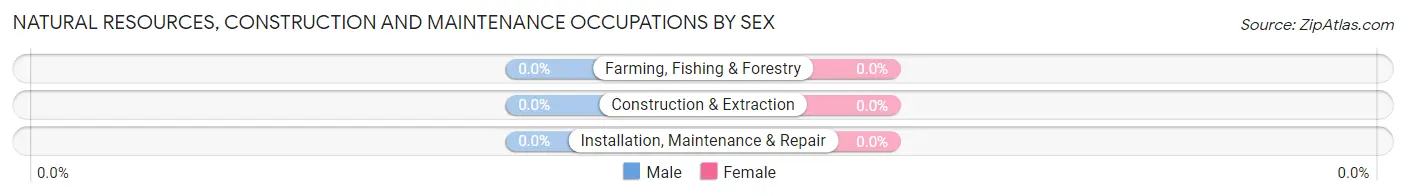
| Occupation | Male | Female |
| Farming, Fishing & Forestry | 0 (0.0%) | 0 (0.0%) |
| Construction & Extraction | 0 (0.0%) | 0 (0.0%) |
| Installation, Maintenance & Repair | 0 (0.0%) | 0 (0.0%) |
| Total (Category) | 0 (0.0%) | 0 (0.0%) |
| Total (Overall) | 73 (44.2%) | 92 (55.8%) |
Production, Transportation and Moving Occupations
The most common Production, Transportation and Moving occupations in North Tunica are , and Production (21 | 12.7%).
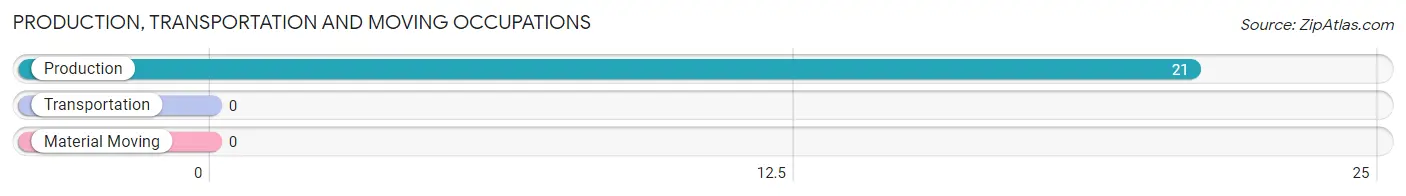
Production, Transportation and Moving Occupations by Sex
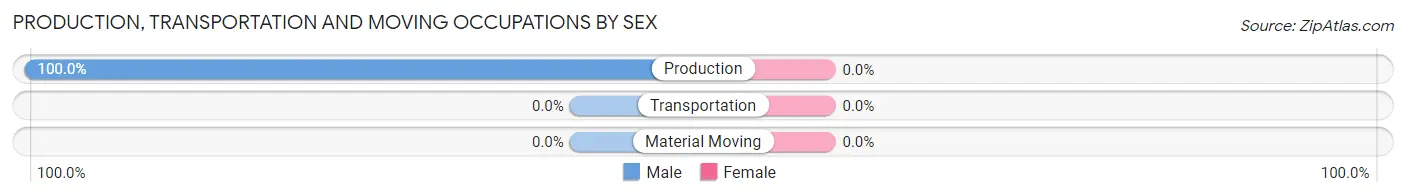
| Occupation | Male | Female |
| Production | 21 (100.0%) | 0 (0.0%) |
| Transportation | 0 (0.0%) | 0 (0.0%) |
| Material Moving | 0 (0.0%) | 0 (0.0%) |
| Total (Category) | 21 (100.0%) | 0 (0.0%) |
| Total (Overall) | 73 (44.2%) | 92 (55.8%) |
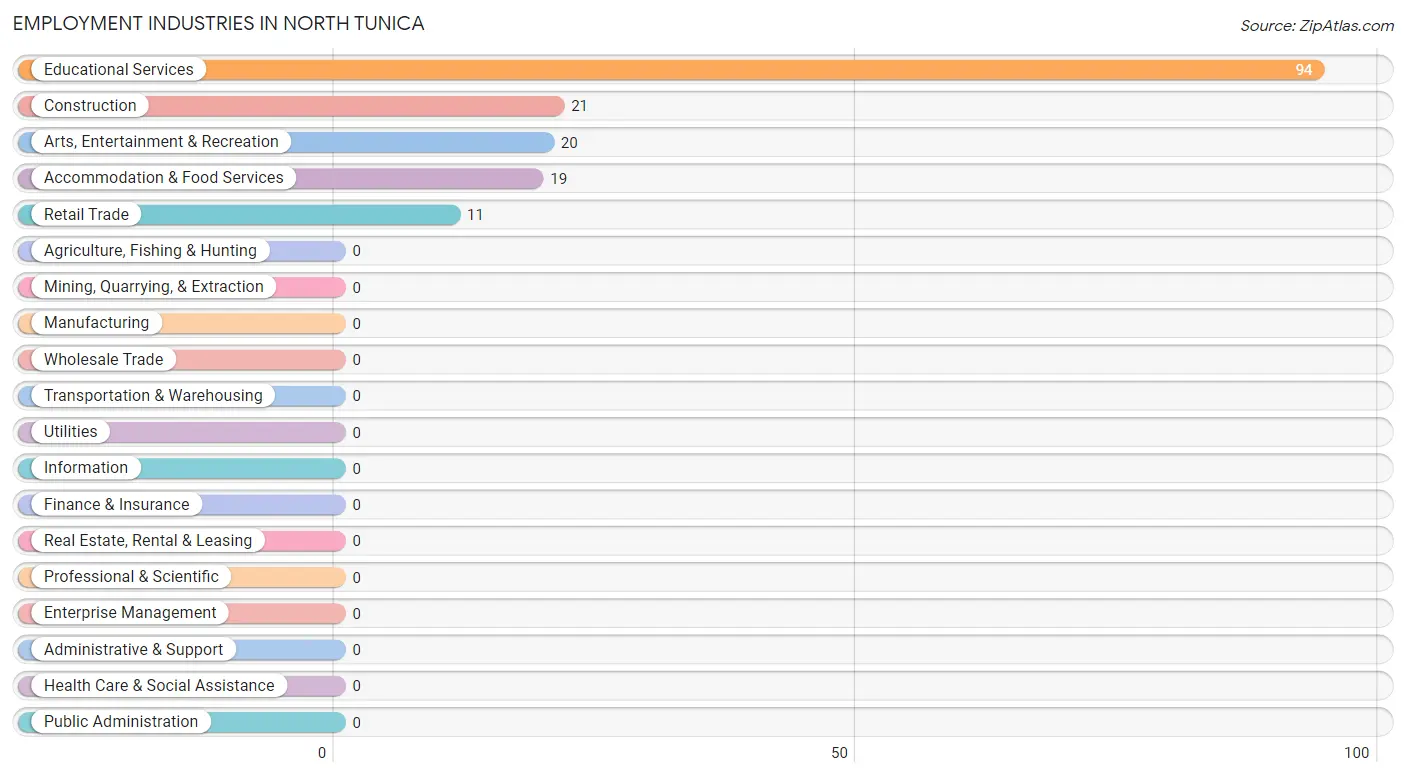
Employment Industries by Sex in North Tunica
Employment Industries in North Tunica
The major employment industries in North Tunica include Educational Services (94 | 57.0%), Construction (21 | 12.7%), Arts, Entertainment & Recreation (20 | 12.1%), Accommodation & Food Services (19 | 11.5%), and Retail Trade (11 | 6.7%).
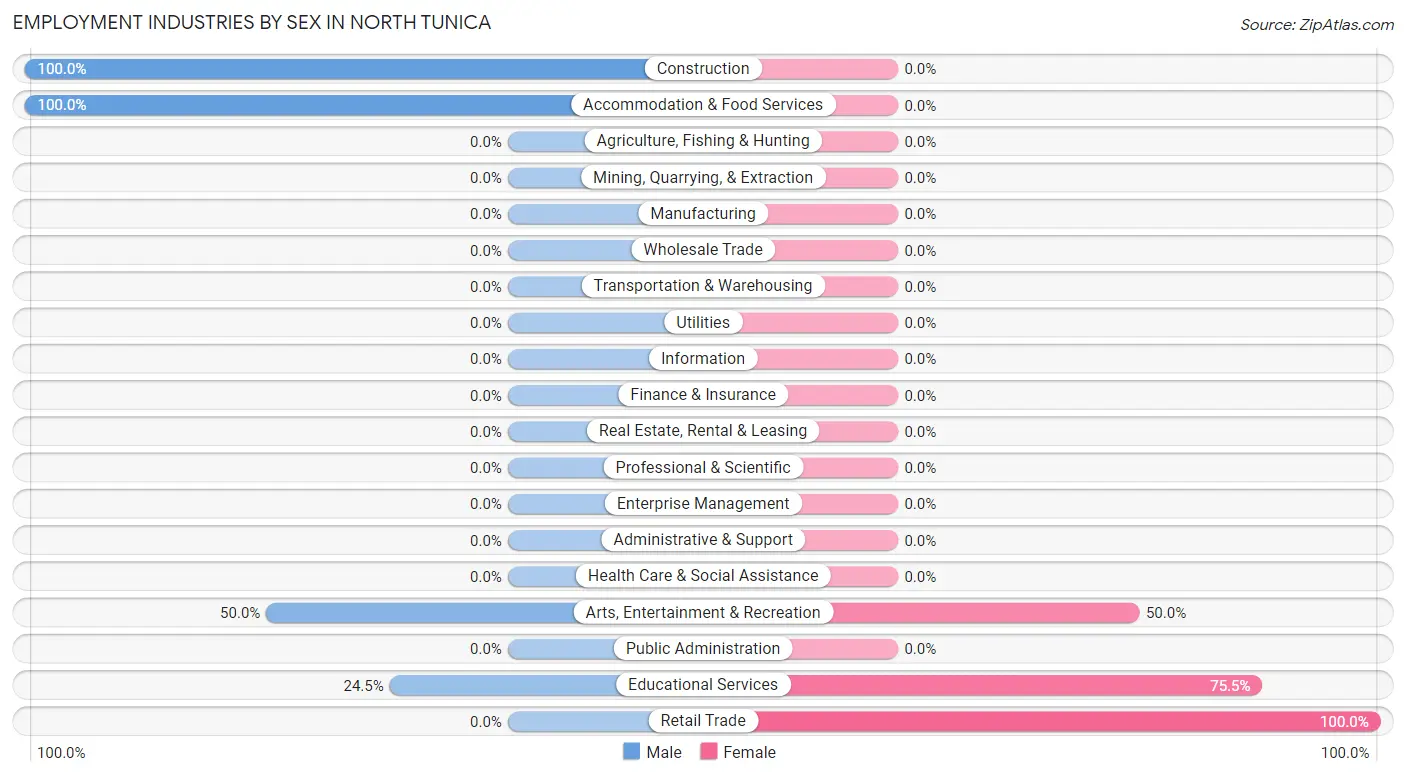
Employment Industries by Sex in North Tunica
The North Tunica industries that see more men than women are Construction (100.0%), Accommodation & Food Services (100.0%), and Arts, Entertainment & Recreation (50.0%), whereas the industries that tend to have a higher number of women are Retail Trade (100.0%), Educational Services (75.5%), and Arts, Entertainment & Recreation (50.0%).
| Industry | Male | Female |
| Agriculture, Fishing & Hunting | 0 (0.0%) | 0 (0.0%) |
| Mining, Quarrying, & Extraction | 0 (0.0%) | 0 (0.0%) |
| Construction | 21 (100.0%) | 0 (0.0%) |
| Manufacturing | 0 (0.0%) | 0 (0.0%) |
| Wholesale Trade | 0 (0.0%) | 0 (0.0%) |
| Retail Trade | 0 (0.0%) | 11 (100.0%) |
| Transportation & Warehousing | 0 (0.0%) | 0 (0.0%) |
| Utilities | 0 (0.0%) | 0 (0.0%) |
| Information | 0 (0.0%) | 0 (0.0%) |
| Finance & Insurance | 0 (0.0%) | 0 (0.0%) |
| Real Estate, Rental & Leasing | 0 (0.0%) | 0 (0.0%) |
| Professional & Scientific | 0 (0.0%) | 0 (0.0%) |
| Enterprise Management | 0 (0.0%) | 0 (0.0%) |
| Administrative & Support | 0 (0.0%) | 0 (0.0%) |
| Educational Services | 23 (24.5%) | 71 (75.5%) |
| Health Care & Social Assistance | 0 (0.0%) | 0 (0.0%) |
| Arts, Entertainment & Recreation | 10 (50.0%) | 10 (50.0%) |
| Accommodation & Food Services | 19 (100.0%) | 0 (0.0%) |
| Public Administration | 0 (0.0%) | 0 (0.0%) |
| Total | 73 (44.2%) | 92 (55.8%) |
Education in North Tunica
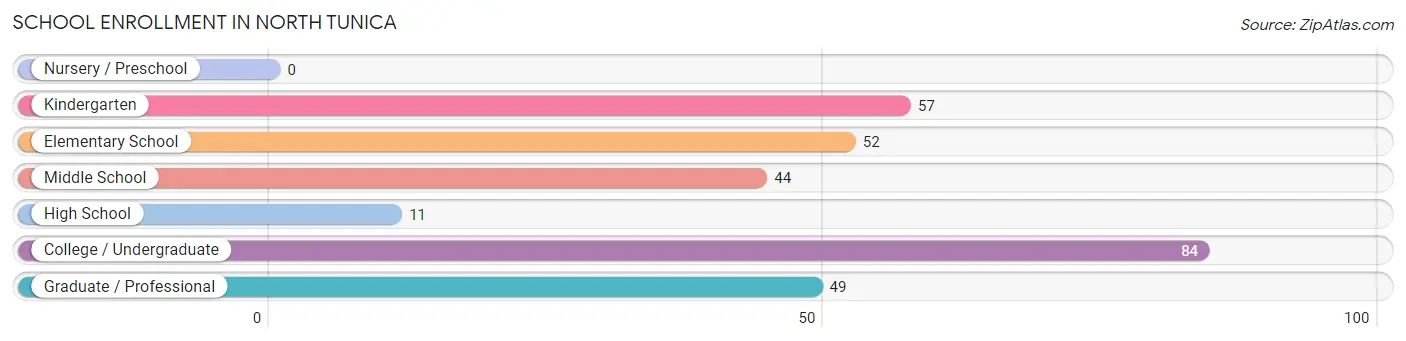
School Enrollment in North Tunica
The most common levels of schooling among the 297 students in North Tunica are college / undergraduate (84 | 28.3%), kindergarten (57 | 19.2%), and elementary school (52 | 17.5%).
| School Level | # Students | % Students |
| Nursery / Preschool | 0 | 0.0% |
| Kindergarten | 57 | 19.2% |
| Elementary School | 52 | 17.5% |
| Middle School | 44 | 14.8% |
| High School | 11 | 3.7% |
| College / Undergraduate | 84 | 28.3% |
| Graduate / Professional | 49 | 16.5% |
| Total | 297 | 100.0% |
School Enrollment by Age by Funding Source in North Tunica
Out of a total of 297 students who are enrolled in schools in North Tunica, 49 (16.5%) attend a private institution, while the remaining 248 (83.5%) are enrolled in public schools. The age group of 35 years and over has the highest likelihood of being enrolled in private schools, with 49 (83.1% in the age bracket) enrolled. Conversely, the age group of 5 to 9 year old has the lowest likelihood of being enrolled in a private school, with 82 (100.0% in the age bracket) attending a public institution.
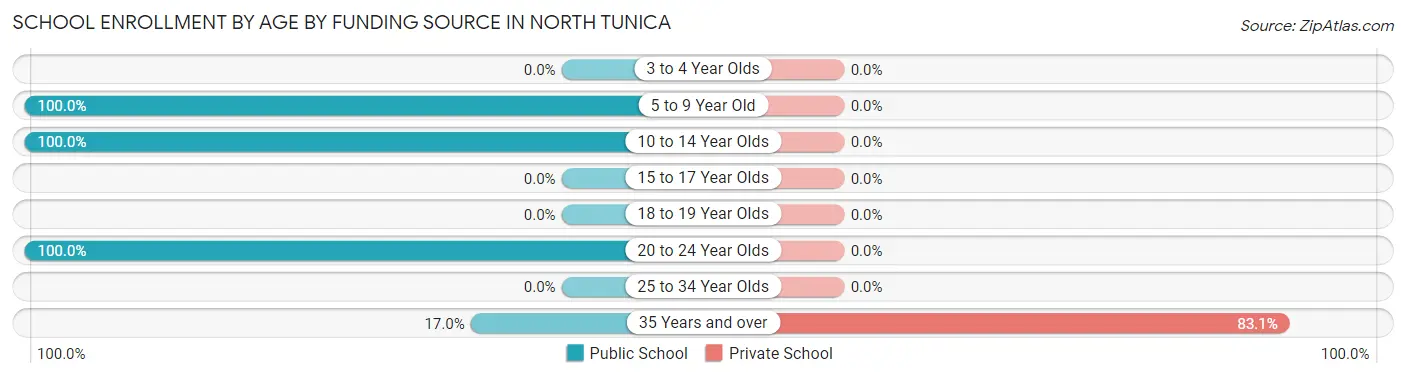
| Age Bracket | Public School | Private School |
| 3 to 4 Year Olds | 0 (0.0%) | 0 (0.0%) |
| 5 to 9 Year Old | 82 (100.0%) | 0 (0.0%) |
| 10 to 14 Year Olds | 82 (100.0%) | 0 (0.0%) |
| 15 to 17 Year Olds | 0 (0.0%) | 0 (0.0%) |
| 18 to 19 Year Olds | 0 (0.0%) | 0 (0.0%) |
| 20 to 24 Year Olds | 74 (100.0%) | 0 (0.0%) |
| 25 to 34 Year Olds | 0 (0.0%) | 0 (0.0%) |
| 35 Years and over | 10 (17.0%) | 49 (83.1%) |
| Total | 248 (83.5%) | 49 (16.5%) |
Educational Attainment by Field of Study in North Tunica
Education (54 | 53.5%), literature & languages (26 | 25.7%), business (11 | 10.9%), and liberal arts & history (10 | 9.9%) are the most common fields of study among 101 individuals in North Tunica who have obtained a bachelor's degree or higher.
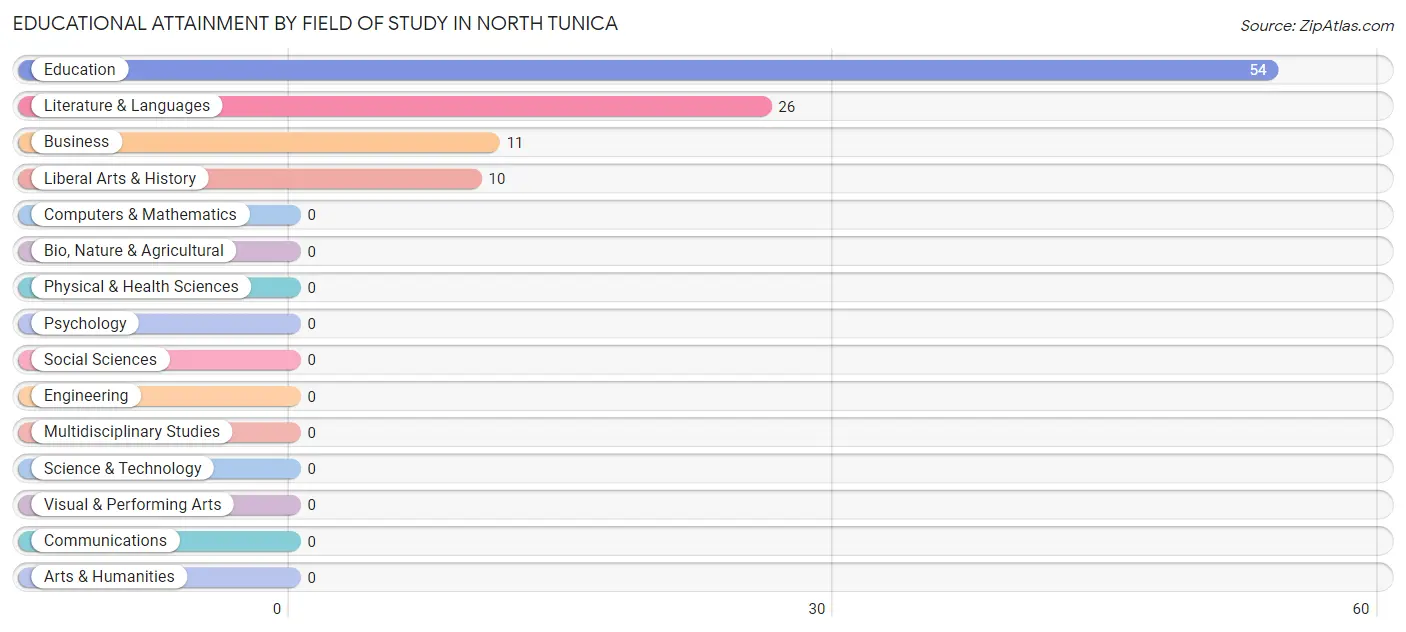
| Field of Study | # Graduates | % Graduates |
| Computers & Mathematics | 0 | 0.0% |
| Bio, Nature & Agricultural | 0 | 0.0% |
| Physical & Health Sciences | 0 | 0.0% |
| Psychology | 0 | 0.0% |
| Social Sciences | 0 | 0.0% |
| Engineering | 0 | 0.0% |
| Multidisciplinary Studies | 0 | 0.0% |
| Science & Technology | 0 | 0.0% |
| Business | 11 | 10.9% |
| Education | 54 | 53.5% |
| Literature & Languages | 26 | 25.7% |
| Liberal Arts & History | 10 | 9.9% |
| Visual & Performing Arts | 0 | 0.0% |
| Communications | 0 | 0.0% |
| Arts & Humanities | 0 | 0.0% |
| Total | 101 | 100.0% |
Transportation & Commute in North Tunica
Vehicle Availability by Sex in North Tunica
The most prevalent vehicle ownership categories in North Tunica are males with 2 vehicles (40, accounting for 54.8%) and females with 2 vehicles (55, making up 43.5%).
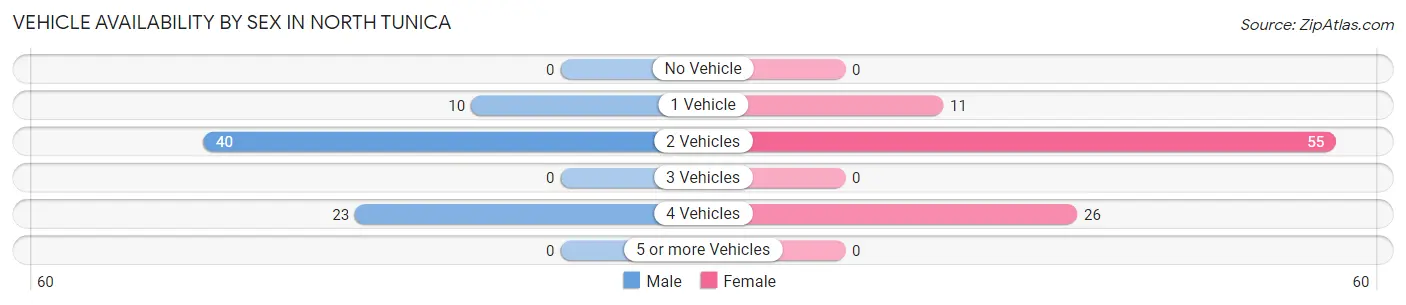
| Vehicles Available | Male | Female |
| No Vehicle | 0 (0.0%) | 0 (0.0%) |
| 1 Vehicle | 10 (13.7%) | 11 (12.0%) |
| 2 Vehicles | 40 (54.8%) | 55 (59.8%) |
| 3 Vehicles | 0 (0.0%) | 0 (0.0%) |
| 4 Vehicles | 23 (31.5%) | 26 (28.3%) |
| 5 or more Vehicles | 0 (0.0%) | 0 (0.0%) |
| Total | 73 (100.0%) | 92 (100.0%) |
Commute Time in North Tunica
The most frequently occuring commute durations in North Tunica are 30 to 34 minutes (64 commuters, 38.8%), 5 to 9 minutes (49 commuters, 29.7%), and 15 to 19 minutes (21 commuters, 12.7%).
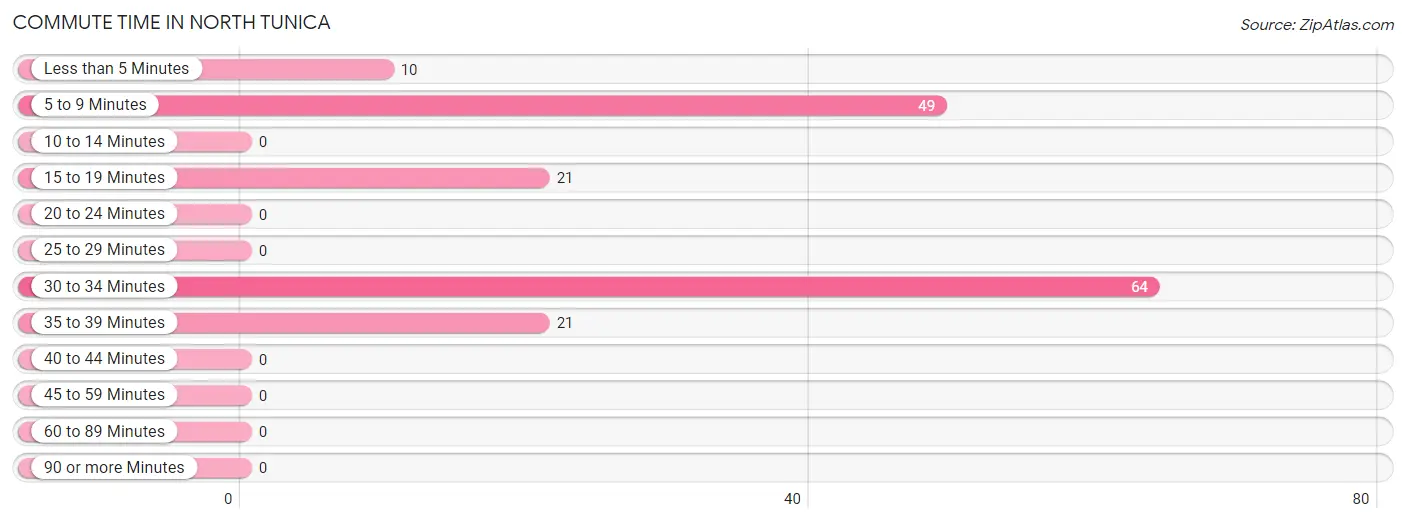
| Commute Time | # Commuters | % Commuters |
| Less than 5 Minutes | 10 | 6.1% |
| 5 to 9 Minutes | 49 | 29.7% |
| 10 to 14 Minutes | 0 | 0.0% |
| 15 to 19 Minutes | 21 | 12.7% |
| 20 to 24 Minutes | 0 | 0.0% |
| 25 to 29 Minutes | 0 | 0.0% |
| 30 to 34 Minutes | 64 | 38.8% |
| 35 to 39 Minutes | 21 | 12.7% |
| 40 to 44 Minutes | 0 | 0.0% |
| 45 to 59 Minutes | 0 | 0.0% |
| 60 to 89 Minutes | 0 | 0.0% |
| 90 or more Minutes | 0 | 0.0% |
Commute Time by Sex in North Tunica
The most common commute times in North Tunica are 5 to 9 minutes (23 commuters, 31.5%) for males and 30 to 34 minutes (45 commuters, 48.9%) for females.
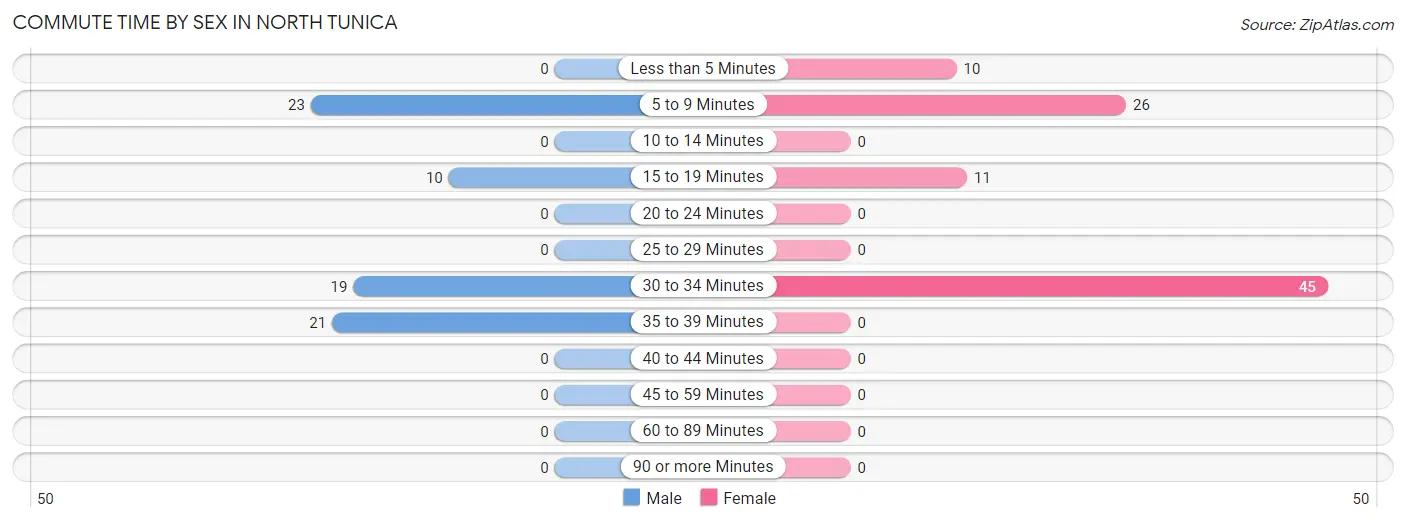
| Commute Time | Male | Female |
| Less than 5 Minutes | 0 (0.0%) | 10 (10.9%) |
| 5 to 9 Minutes | 23 (31.5%) | 26 (28.3%) |
| 10 to 14 Minutes | 0 (0.0%) | 0 (0.0%) |
| 15 to 19 Minutes | 10 (13.7%) | 11 (12.0%) |
| 20 to 24 Minutes | 0 (0.0%) | 0 (0.0%) |
| 25 to 29 Minutes | 0 (0.0%) | 0 (0.0%) |
| 30 to 34 Minutes | 19 (26.0%) | 45 (48.9%) |
| 35 to 39 Minutes | 21 (28.8%) | 0 (0.0%) |
| 40 to 44 Minutes | 0 (0.0%) | 0 (0.0%) |
| 45 to 59 Minutes | 0 (0.0%) | 0 (0.0%) |
| 60 to 89 Minutes | 0 (0.0%) | 0 (0.0%) |
| 90 or more Minutes | 0 (0.0%) | 0 (0.0%) |
Time of Departure to Work by Sex in North Tunica
The most frequent times of departure to work in North Tunica are 6:30 AM to 6:59 AM (23, 31.5%) for males and 7:00 AM to 7:29 AM (55, 59.8%) for females.
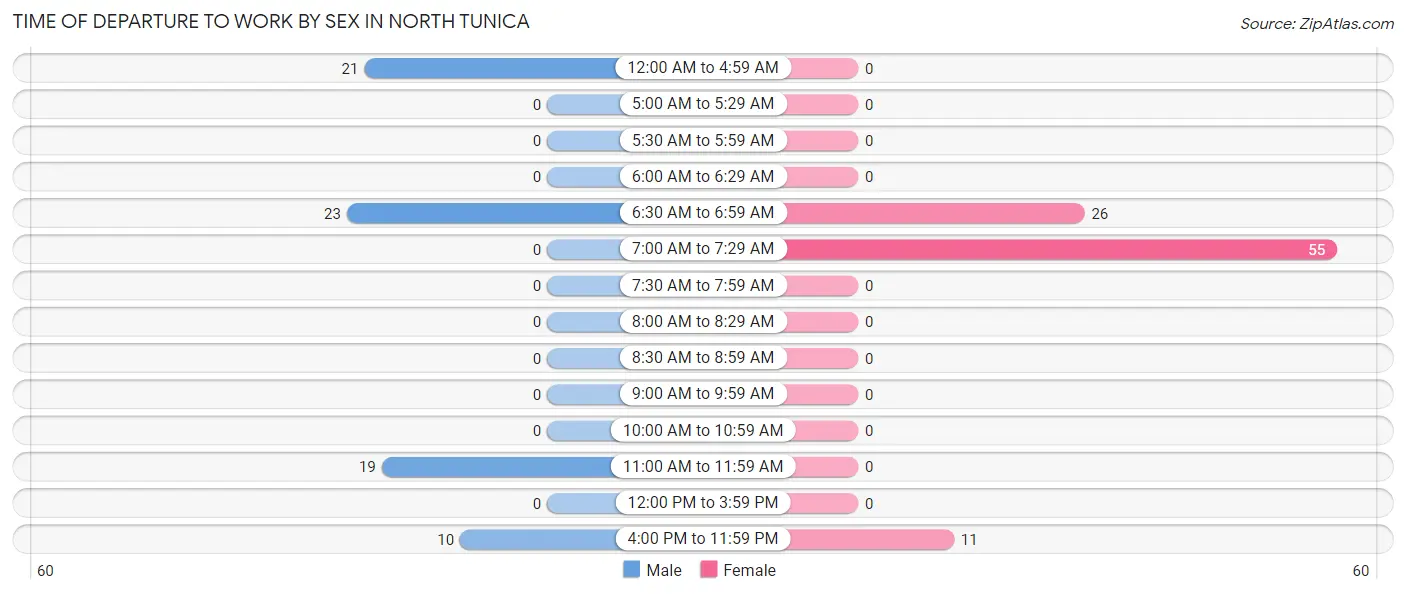
| Time of Departure | Male | Female |
| 12:00 AM to 4:59 AM | 21 (28.8%) | 0 (0.0%) |
| 5:00 AM to 5:29 AM | 0 (0.0%) | 0 (0.0%) |
| 5:30 AM to 5:59 AM | 0 (0.0%) | 0 (0.0%) |
| 6:00 AM to 6:29 AM | 0 (0.0%) | 0 (0.0%) |
| 6:30 AM to 6:59 AM | 23 (31.5%) | 26 (28.3%) |
| 7:00 AM to 7:29 AM | 0 (0.0%) | 55 (59.8%) |
| 7:30 AM to 7:59 AM | 0 (0.0%) | 0 (0.0%) |
| 8:00 AM to 8:29 AM | 0 (0.0%) | 0 (0.0%) |
| 8:30 AM to 8:59 AM | 0 (0.0%) | 0 (0.0%) |
| 9:00 AM to 9:59 AM | 0 (0.0%) | 0 (0.0%) |
| 10:00 AM to 10:59 AM | 0 (0.0%) | 0 (0.0%) |
| 11:00 AM to 11:59 AM | 19 (26.0%) | 0 (0.0%) |
| 12:00 PM to 3:59 PM | 0 (0.0%) | 0 (0.0%) |
| 4:00 PM to 11:59 PM | 10 (13.7%) | 11 (12.0%) |
| Total | 73 (100.0%) | 92 (100.0%) |
Housing Occupancy in North Tunica
Occupancy by Ownership in North Tunica
Of the total 325 dwellings in North Tunica, owner-occupied units account for 161 (49.5%), while renter-occupied units make up 164 (50.5%).
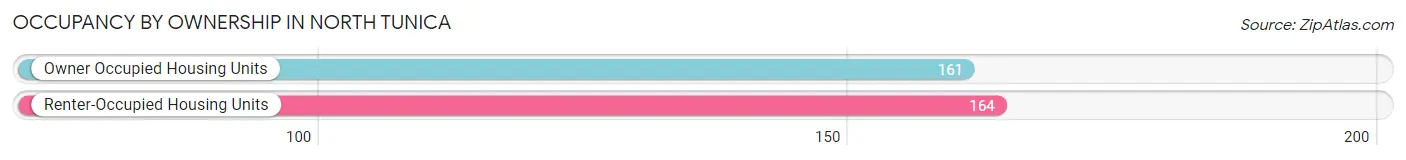
| Occupancy | # Housing Units | % Housing Units |
| Owner Occupied Housing Units | 161 | 49.5% |
| Renter-Occupied Housing Units | 164 | 50.5% |
| Total Occupied Housing Units | 325 | 100.0% |
Occupancy by Household Size in North Tunica
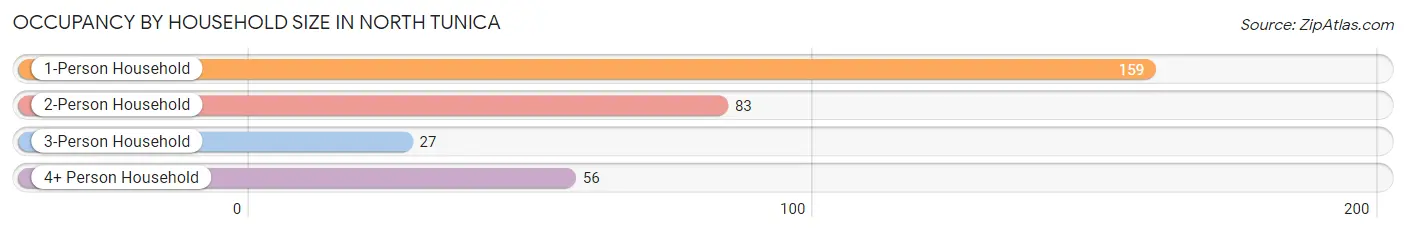
| Household Size | # Housing Units | % Housing Units |
| 1-Person Household | 159 | 48.9% |
| 2-Person Household | 83 | 25.5% |
| 3-Person Household | 27 | 8.3% |
| 4+ Person Household | 56 | 17.2% |
| Total Housing Units | 325 | 100.0% |
Occupancy by Ownership by Household Size in North Tunica
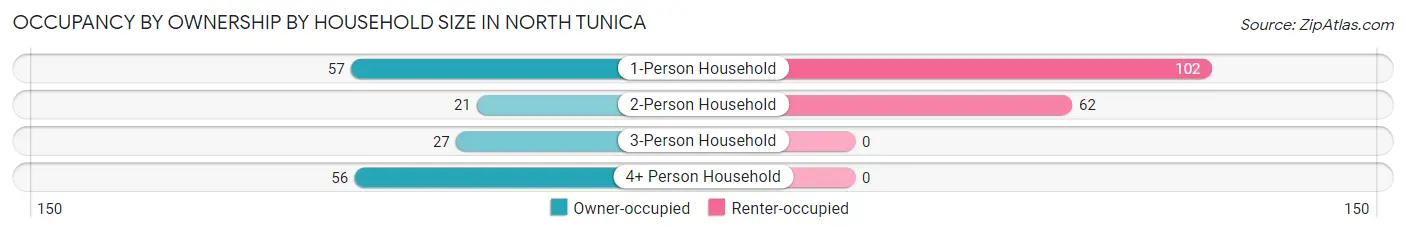
| Household Size | Owner-occupied | Renter-occupied |
| 1-Person Household | 57 (35.8%) | 102 (64.1%) |
| 2-Person Household | 21 (25.3%) | 62 (74.7%) |
| 3-Person Household | 27 (100.0%) | 0 (0.0%) |
| 4+ Person Household | 56 (100.0%) | 0 (0.0%) |
| Total Housing Units | 161 (49.5%) | 164 (50.5%) |
Occupancy by Educational Attainment in North Tunica
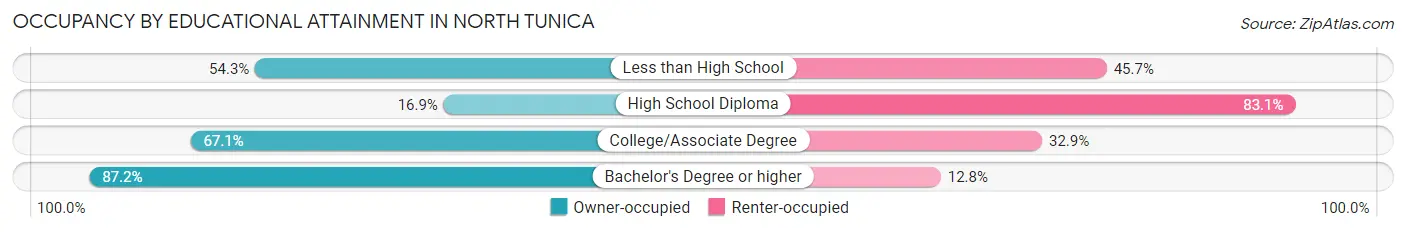
| Household Size | Owner-occupied | Renter-occupied |
| Less than High School | 19 (54.3%) | 16 (45.7%) |
| High School Diploma | 23 (16.9%) | 113 (83.1%) |
| College/Associate Degree | 51 (67.1%) | 25 (32.9%) |
| Bachelor's Degree or higher | 68 (87.2%) | 10 (12.8%) |
Occupancy by Age of Householder in North Tunica
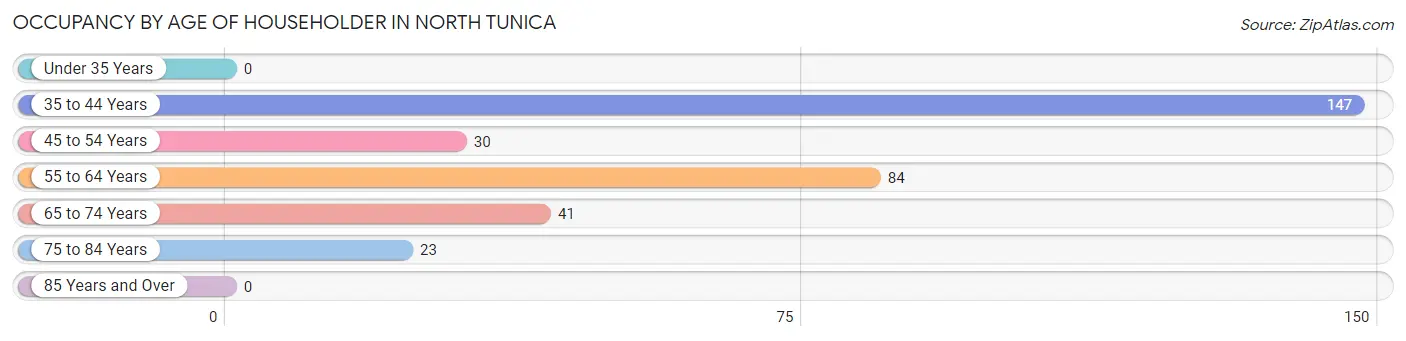
| Age Bracket | # Households | % Households |
| Under 35 Years | 0 | 0.0% |
| 35 to 44 Years | 147 | 45.2% |
| 45 to 54 Years | 30 | 9.2% |
| 55 to 64 Years | 84 | 25.9% |
| 65 to 74 Years | 41 | 12.6% |
| 75 to 84 Years | 23 | 7.1% |
| 85 Years and Over | 0 | 0.0% |
| Total | 325 | 100.0% |
Housing Finances in North Tunica
Median Income by Occupancy in North Tunica
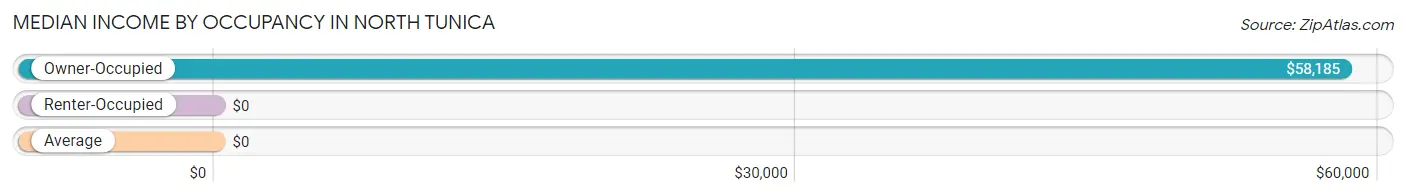
| Occupancy Type | # Households | Median Income |
| Owner-Occupied | 161 (49.5%) | $58,185 |
| Renter-Occupied | 164 (50.5%) | $0 |
| Average | 325 (100.0%) | $0 |
Occupancy by Householder Income Bracket in North Tunica
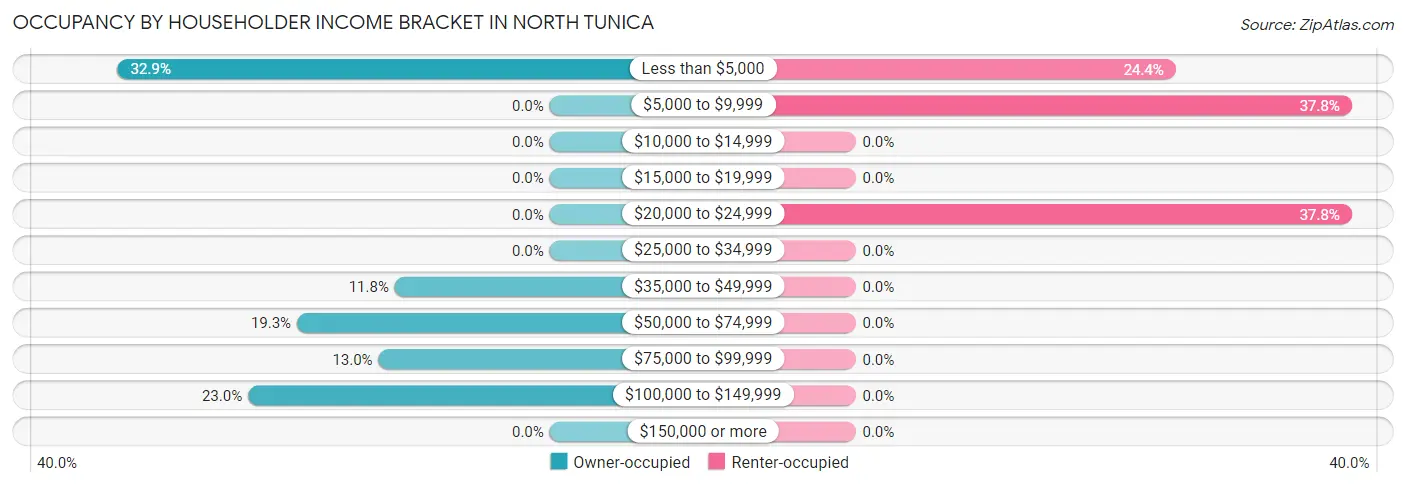
| Income Bracket | Owner-occupied | Renter-occupied |
| Less than $5,000 | 53 (32.9%) | 40 (24.4%) |
| $5,000 to $9,999 | 0 (0.0%) | 62 (37.8%) |
| $10,000 to $14,999 | 0 (0.0%) | 0 (0.0%) |
| $15,000 to $19,999 | 0 (0.0%) | 0 (0.0%) |
| $20,000 to $24,999 | 0 (0.0%) | 62 (37.8%) |
| $25,000 to $34,999 | 0 (0.0%) | 0 (0.0%) |
| $35,000 to $49,999 | 19 (11.8%) | 0 (0.0%) |
| $50,000 to $74,999 | 31 (19.3%) | 0 (0.0%) |
| $75,000 to $99,999 | 21 (13.0%) | 0 (0.0%) |
| $100,000 to $149,999 | 37 (23.0%) | 0 (0.0%) |
| $150,000 or more | 0 (0.0%) | 0 (0.0%) |
| Total | 161 (100.0%) | 164 (100.0%) |
Monthly Housing Cost Tiers in North Tunica
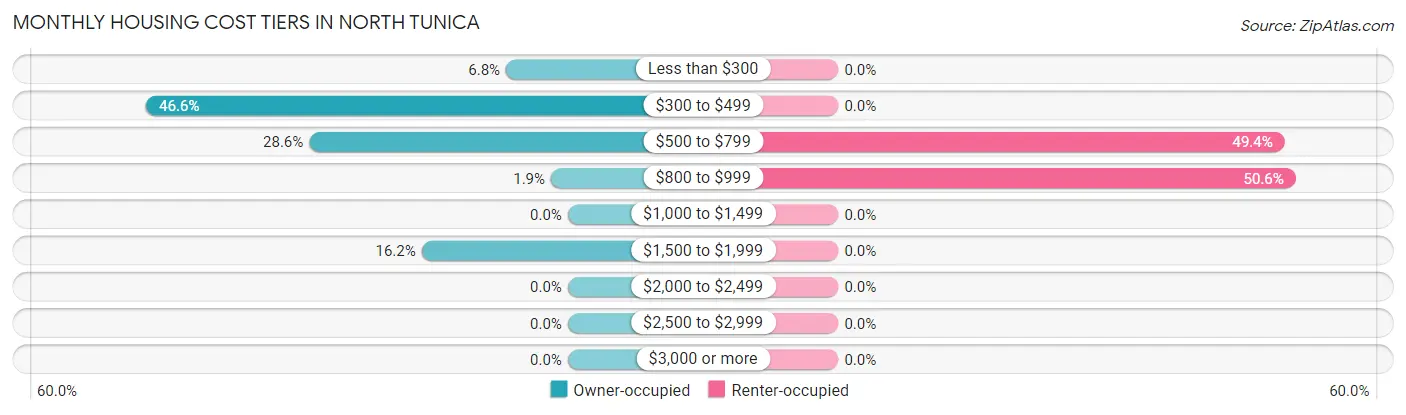
| Monthly Cost | Owner-occupied | Renter-occupied |
| Less than $300 | 11 (6.8%) | 0 (0.0%) |
| $300 to $499 | 75 (46.6%) | 0 (0.0%) |
| $500 to $799 | 46 (28.6%) | 81 (49.4%) |
| $800 to $999 | 3 (1.9%) | 83 (50.6%) |
| $1,000 to $1,499 | 0 (0.0%) | 0 (0.0%) |
| $1,500 to $1,999 | 26 (16.2%) | 0 (0.0%) |
| $2,000 to $2,499 | 0 (0.0%) | 0 (0.0%) |
| $2,500 to $2,999 | 0 (0.0%) | 0 (0.0%) |
| $3,000 or more | 0 (0.0%) | 0 (0.0%) |
| Total | 161 (100.0%) | 164 (100.0%) |
Physical Housing Characteristics in North Tunica
Housing Structures in North Tunica
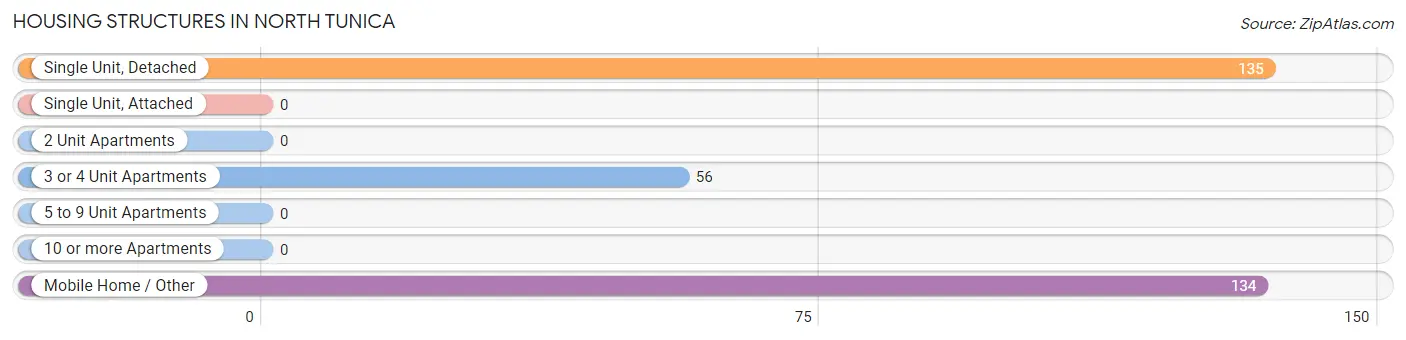
| Structure Type | # Housing Units | % Housing Units |
| Single Unit, Detached | 135 | 41.5% |
| Single Unit, Attached | 0 | 0.0% |
| 2 Unit Apartments | 0 | 0.0% |
| 3 or 4 Unit Apartments | 56 | 17.2% |
| 5 to 9 Unit Apartments | 0 | 0.0% |
| 10 or more Apartments | 0 | 0.0% |
| Mobile Home / Other | 134 | 41.2% |
| Total | 325 | 100.0% |
Housing Structures by Occupancy in North Tunica
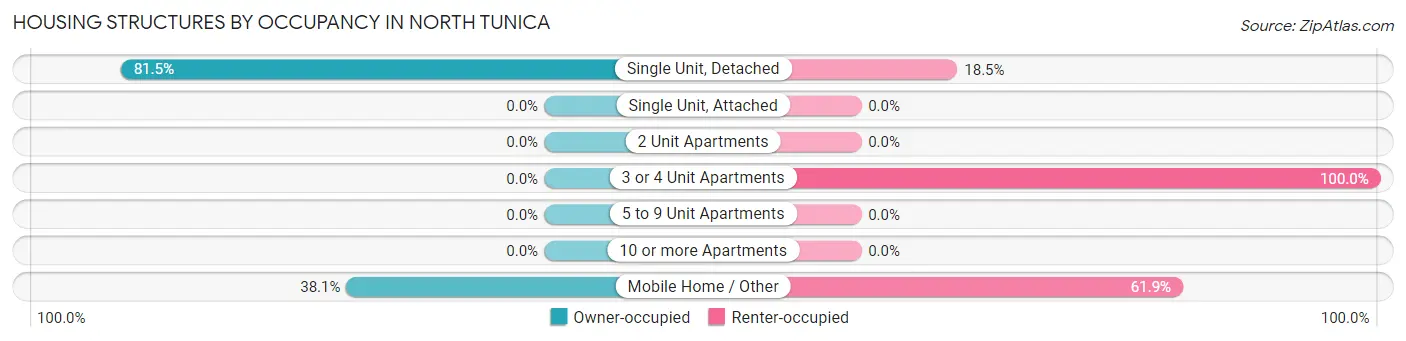
| Structure Type | Owner-occupied | Renter-occupied |
| Single Unit, Detached | 110 (81.5%) | 25 (18.5%) |
| Single Unit, Attached | 0 (0.0%) | 0 (0.0%) |
| 2 Unit Apartments | 0 (0.0%) | 0 (0.0%) |
| 3 or 4 Unit Apartments | 0 (0.0%) | 56 (100.0%) |
| 5 to 9 Unit Apartments | 0 (0.0%) | 0 (0.0%) |
| 10 or more Apartments | 0 (0.0%) | 0 (0.0%) |
| Mobile Home / Other | 51 (38.1%) | 83 (61.9%) |
| Total | 161 (49.5%) | 164 (50.5%) |
Housing Structures by Number of Rooms in North Tunica
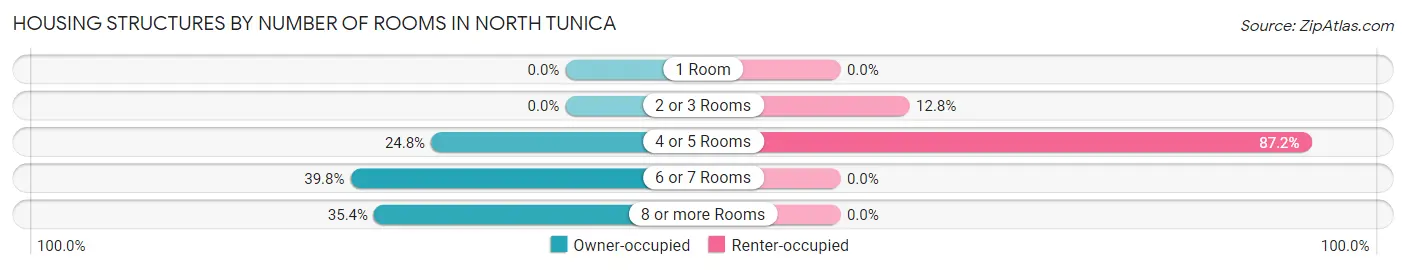
| Number of Rooms | Owner-occupied | Renter-occupied |
| 1 Room | 0 (0.0%) | 0 (0.0%) |
| 2 or 3 Rooms | 0 (0.0%) | 21 (12.8%) |
| 4 or 5 Rooms | 40 (24.8%) | 143 (87.2%) |
| 6 or 7 Rooms | 64 (39.8%) | 0 (0.0%) |
| 8 or more Rooms | 57 (35.4%) | 0 (0.0%) |
| Total | 161 (100.0%) | 164 (100.0%) |
Housing Structure by Heating Type in North Tunica
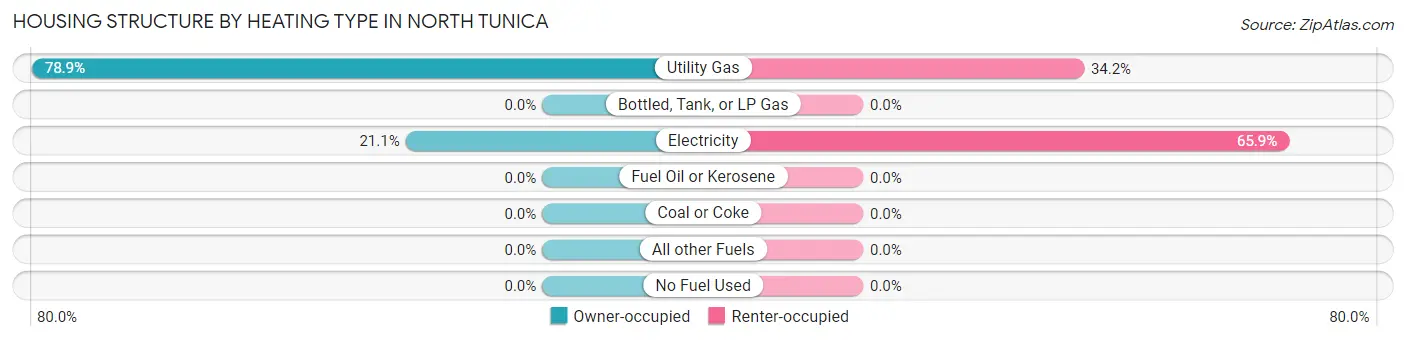
| Heating Type | Owner-occupied | Renter-occupied |
| Utility Gas | 127 (78.9%) | 56 (34.2%) |
| Bottled, Tank, or LP Gas | 0 (0.0%) | 0 (0.0%) |
| Electricity | 34 (21.1%) | 108 (65.8%) |
| Fuel Oil or Kerosene | 0 (0.0%) | 0 (0.0%) |
| Coal or Coke | 0 (0.0%) | 0 (0.0%) |
| All other Fuels | 0 (0.0%) | 0 (0.0%) |
| No Fuel Used | 0 (0.0%) | 0 (0.0%) |
| Total | 161 (100.0%) | 164 (100.0%) |
Household Vehicle Usage in North Tunica
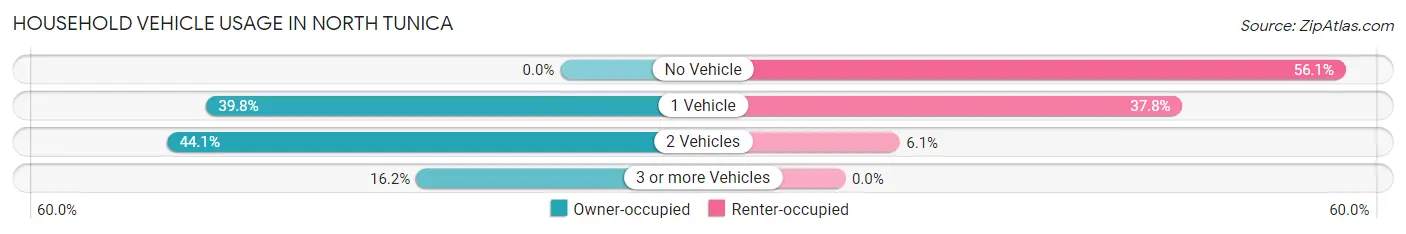
| Vehicles per Household | Owner-occupied | Renter-occupied |
| No Vehicle | 0 (0.0%) | 92 (56.1%) |
| 1 Vehicle | 64 (39.8%) | 62 (37.8%) |
| 2 Vehicles | 71 (44.1%) | 10 (6.1%) |
| 3 or more Vehicles | 26 (16.2%) | 0 (0.0%) |
| Total | 161 (100.0%) | 164 (100.0%) |
Real Estate & Mortgages in North Tunica
Real Estate and Mortgage Overview in North Tunica
| Characteristic | Without Mortgage | With Mortgage |
| Housing Units | 105 | 56 |
| Median Property Value | $80,500 | $73,300 |
| Median Household Income | $58,347 | $0 |
| Monthly Housing Costs | $338 | $0 |
| Real Estate Taxes | $347 | $0 |
Property Value by Mortgage Status in North Tunica
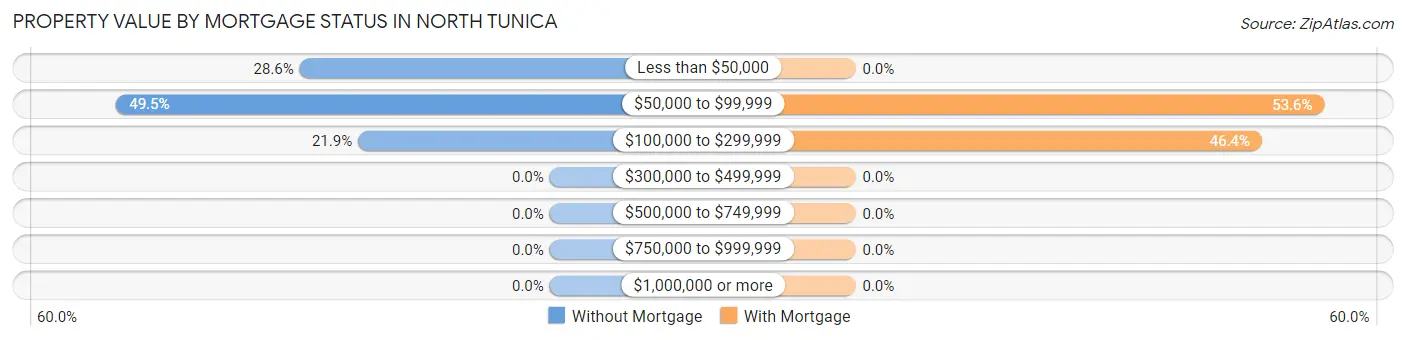
| Property Value | Without Mortgage | With Mortgage |
| Less than $50,000 | 30 (28.6%) | 0 (0.0%) |
| $50,000 to $99,999 | 52 (49.5%) | 30 (53.6%) |
| $100,000 to $299,999 | 23 (21.9%) | 26 (46.4%) |
| $300,000 to $499,999 | 0 (0.0%) | 0 (0.0%) |
| $500,000 to $749,999 | 0 (0.0%) | 0 (0.0%) |
| $750,000 to $999,999 | 0 (0.0%) | 0 (0.0%) |
| $1,000,000 or more | 0 (0.0%) | 0 (0.0%) |
| Total | 105 (100.0%) | 56 (100.0%) |
Household Income by Mortgage Status in North Tunica
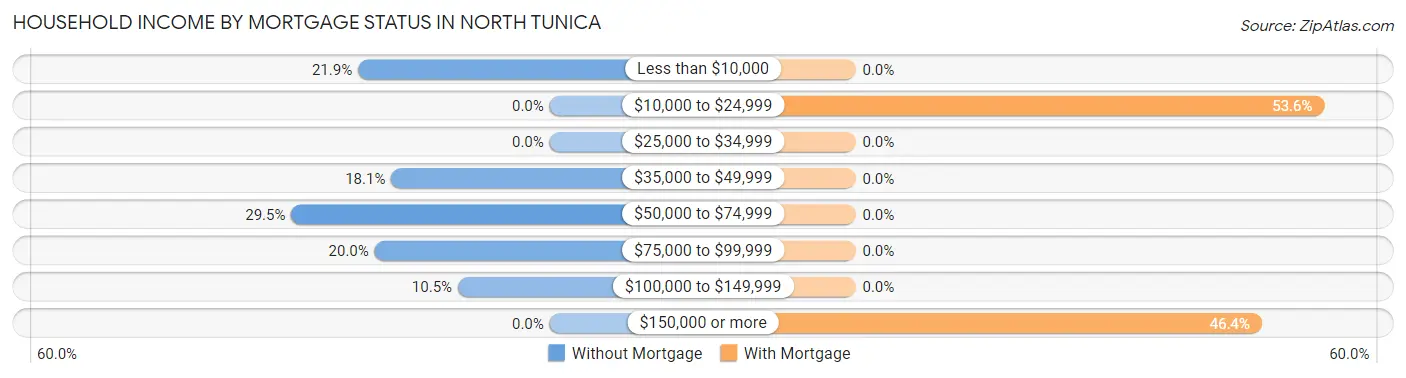
| Household Income | Without Mortgage | With Mortgage |
| Less than $10,000 | 23 (21.9%) | 0 (0.0%) |
| $10,000 to $24,999 | 0 (0.0%) | 30 (53.6%) |
| $25,000 to $34,999 | 0 (0.0%) | 0 (0.0%) |
| $35,000 to $49,999 | 19 (18.1%) | 0 (0.0%) |
| $50,000 to $74,999 | 31 (29.5%) | 0 (0.0%) |
| $75,000 to $99,999 | 21 (20.0%) | 0 (0.0%) |
| $100,000 to $149,999 | 11 (10.5%) | 0 (0.0%) |
| $150,000 or more | 0 (0.0%) | 26 (46.4%) |
| Total | 105 (100.0%) | 56 (100.0%) |
Property Value to Household Income Ratio in North Tunica
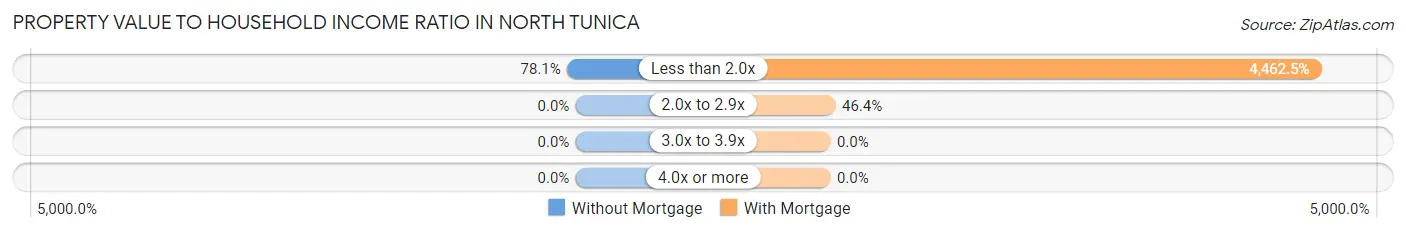
| Value-to-Income Ratio | Without Mortgage | With Mortgage |
| Less than 2.0x | 82 (78.1%) | 2,499 (4,462.5%) |
| 2.0x to 2.9x | 0 (0.0%) | 26 (46.4%) |
| 3.0x to 3.9x | 0 (0.0%) | 0 (0.0%) |
| 4.0x or more | 0 (0.0%) | 0 (0.0%) |
| Total | 105 (100.0%) | 56 (100.0%) |
Real Estate Taxes by Mortgage Status in North Tunica
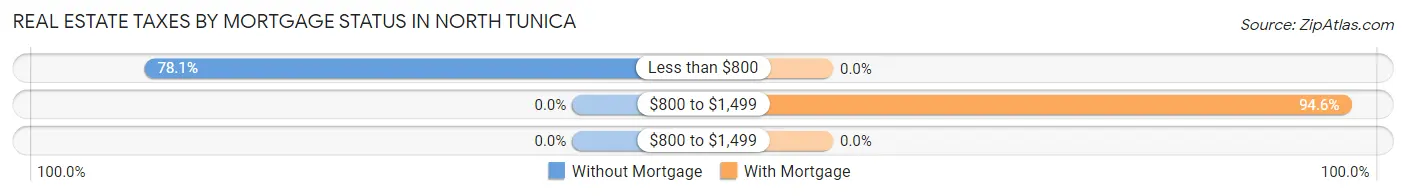
| Property Taxes | Without Mortgage | With Mortgage |
| Less than $800 | 82 (78.1%) | 0 (0.0%) |
| $800 to $1,499 | 0 (0.0%) | 53 (94.6%) |
| $800 to $1,499 | 0 (0.0%) | 0 (0.0%) |
| Total | 105 (100.0%) | 56 (100.0%) |
Health & Disability in North Tunica
Health Insurance Coverage by Age in North Tunica
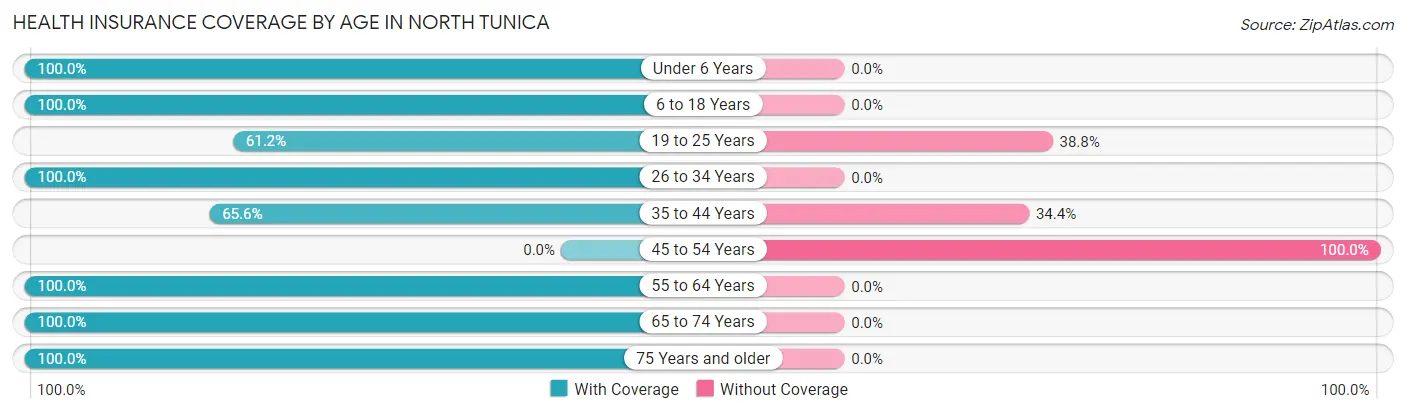
| Age Bracket | With Coverage | Without Coverage |
| Under 6 Years | 68 (100.0%) | 0 (0.0%) |
| 6 to 18 Years | 174 (100.0%) | 0 (0.0%) |
| 19 to 25 Years | 74 (61.2%) | 47 (38.8%) |
| 26 to 34 Years | 45 (100.0%) | 0 (0.0%) |
| 35 to 44 Years | 118 (65.6%) | 62 (34.4%) |
| 45 to 54 Years | 0 (0.0%) | 102 (100.0%) |
| 55 to 64 Years | 153 (100.0%) | 0 (0.0%) |
| 65 to 74 Years | 41 (100.0%) | 0 (0.0%) |
| 75 Years and older | 23 (100.0%) | 0 (0.0%) |
| Total | 696 (76.7%) | 211 (23.3%) |
Health Insurance Coverage by Citizenship Status in North Tunica
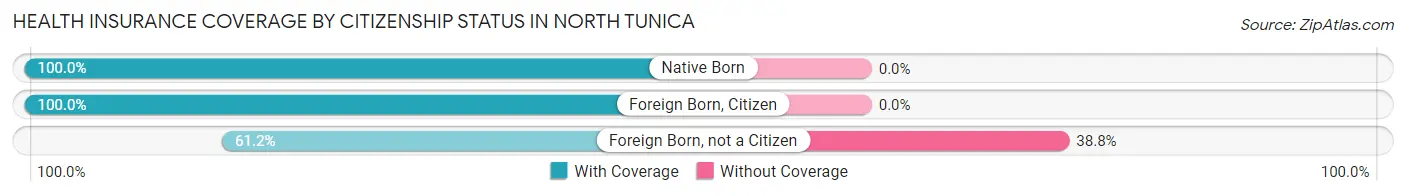
| Citizenship Status | With Coverage | Without Coverage |
| Native Born | 68 (100.0%) | 0 (0.0%) |
| Foreign Born, Citizen | 174 (100.0%) | 0 (0.0%) |
| Foreign Born, not a Citizen | 74 (61.2%) | 47 (38.8%) |
Health Insurance Coverage by Household Income in North Tunica
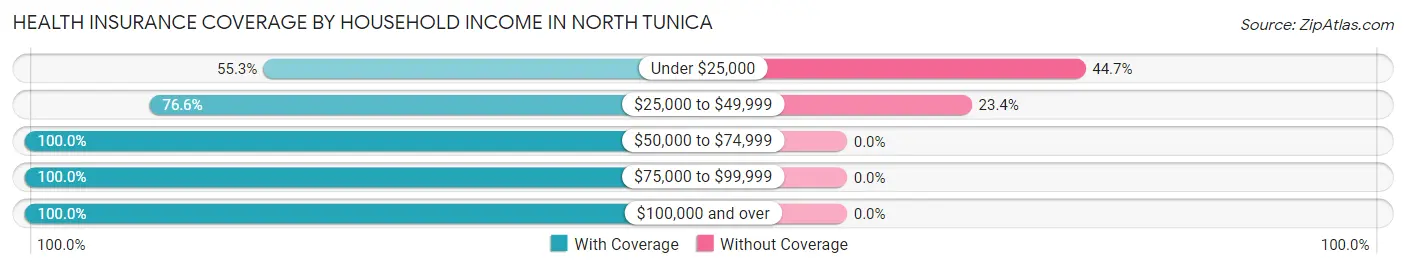
| Household Income | With Coverage | Without Coverage |
| Under $25,000 | 203 (55.3%) | 164 (44.7%) |
| $25,000 to $49,999 | 154 (76.6%) | 47 (23.4%) |
| $50,000 to $74,999 | 31 (100.0%) | 0 (0.0%) |
| $75,000 to $99,999 | 49 (100.0%) | 0 (0.0%) |
| $100,000 and over | 259 (100.0%) | 0 (0.0%) |
Public vs Private Health Insurance Coverage by Age in North Tunica
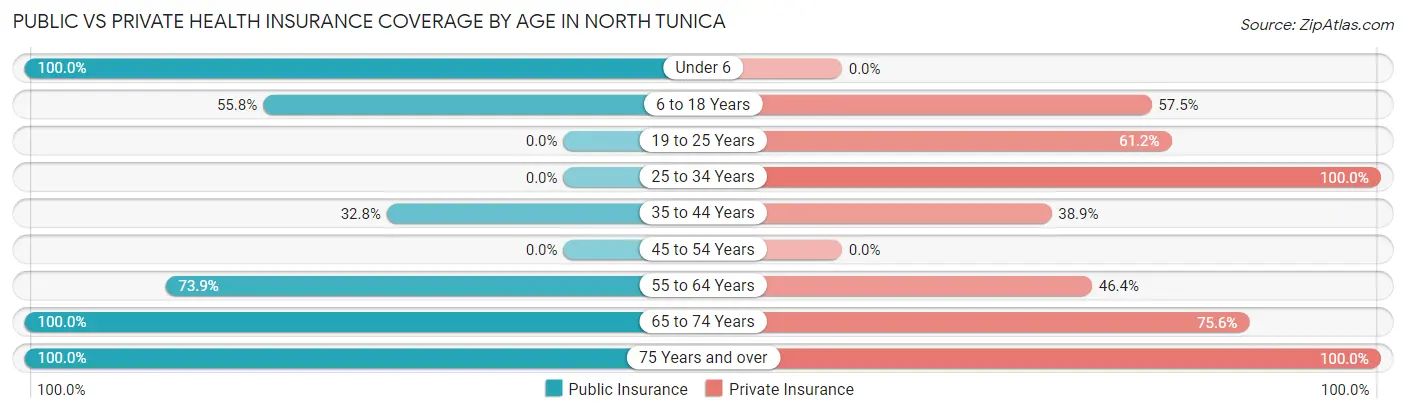
| Age Bracket | Public Insurance | Private Insurance |
| Under 6 | 68 (100.0%) | 0 (0.0%) |
| 6 to 18 Years | 97 (55.7%) | 100 (57.5%) |
| 19 to 25 Years | 0 (0.0%) | 74 (61.2%) |
| 25 to 34 Years | 0 (0.0%) | 45 (100.0%) |
| 35 to 44 Years | 59 (32.8%) | 70 (38.9%) |
| 45 to 54 Years | 0 (0.0%) | 0 (0.0%) |
| 55 to 64 Years | 113 (73.9%) | 71 (46.4%) |
| 65 to 74 Years | 41 (100.0%) | 31 (75.6%) |
| 75 Years and over | 23 (100.0%) | 23 (100.0%) |
| Total | 401 (44.2%) | 414 (45.6%) |
Disability Status by Sex by Age in North Tunica
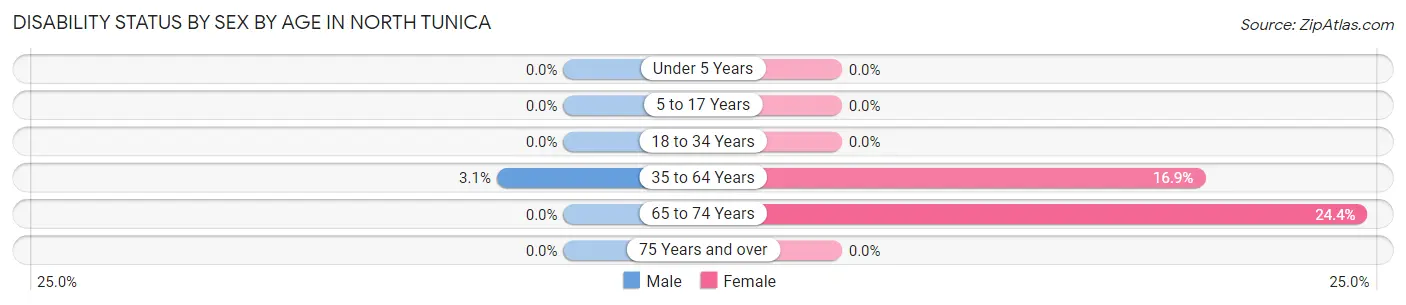
| Age Bracket | Male | Female |
| Under 5 Years | 0 (0.0%) | 0 (0.0%) |
| 5 to 17 Years | 0 (0.0%) | 0 (0.0%) |
| 18 to 34 Years | 0 (0.0%) | 0 (0.0%) |
| 35 to 64 Years | 3 (3.1%) | 57 (16.9%) |
| 65 to 74 Years | 0 (0.0%) | 10 (24.4%) |
| 75 Years and over | 0 (0.0%) | 0 (0.0%) |
Disability Class by Sex by Age in North Tunica
Disability Class: Hearing Difficulty
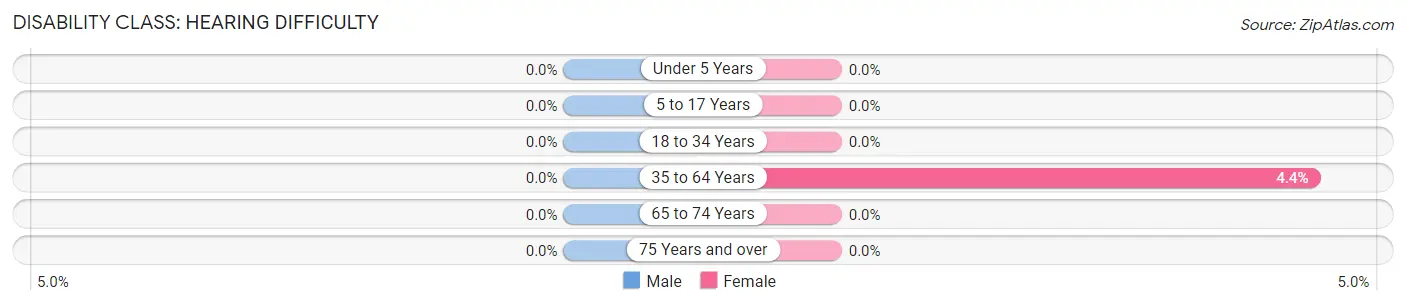
| Age Bracket | Male | Female |
| Under 5 Years | 0 (0.0%) | 0 (0.0%) |
| 5 to 17 Years | 0 (0.0%) | 0 (0.0%) |
| 18 to 34 Years | 0 (0.0%) | 0 (0.0%) |
| 35 to 64 Years | 0 (0.0%) | 15 (4.4%) |
| 65 to 74 Years | 0 (0.0%) | 0 (0.0%) |
| 75 Years and over | 0 (0.0%) | 0 (0.0%) |
Disability Class: Vision Difficulty
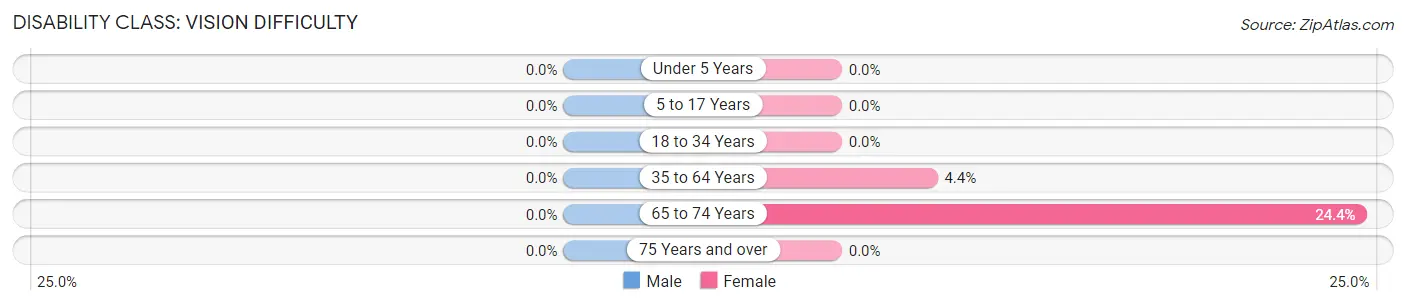
| Age Bracket | Male | Female |
| Under 5 Years | 0 (0.0%) | 0 (0.0%) |
| 5 to 17 Years | 0 (0.0%) | 0 (0.0%) |
| 18 to 34 Years | 0 (0.0%) | 0 (0.0%) |
| 35 to 64 Years | 0 (0.0%) | 15 (4.4%) |
| 65 to 74 Years | 0 (0.0%) | 10 (24.4%) |
| 75 Years and over | 0 (0.0%) | 0 (0.0%) |
Disability Class: Cognitive Difficulty
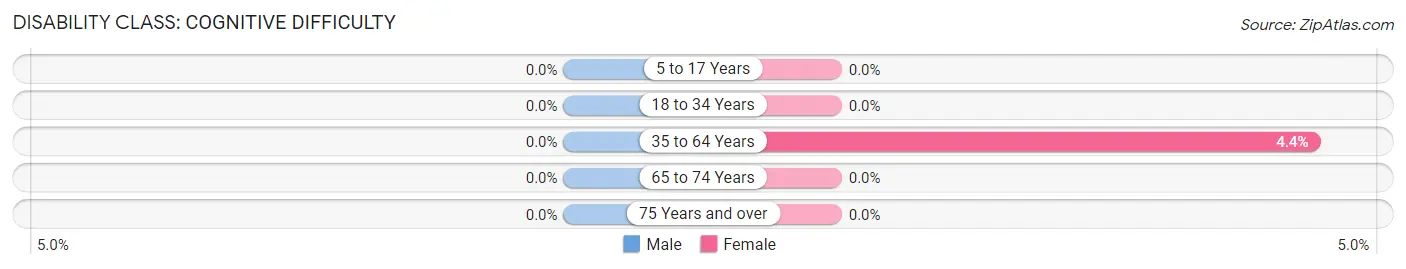
| Age Bracket | Male | Female |
| 5 to 17 Years | 0 (0.0%) | 0 (0.0%) |
| 18 to 34 Years | 0 (0.0%) | 0 (0.0%) |
| 35 to 64 Years | 0 (0.0%) | 15 (4.4%) |
| 65 to 74 Years | 0 (0.0%) | 0 (0.0%) |
| 75 Years and over | 0 (0.0%) | 0 (0.0%) |
Disability Class: Ambulatory Difficulty
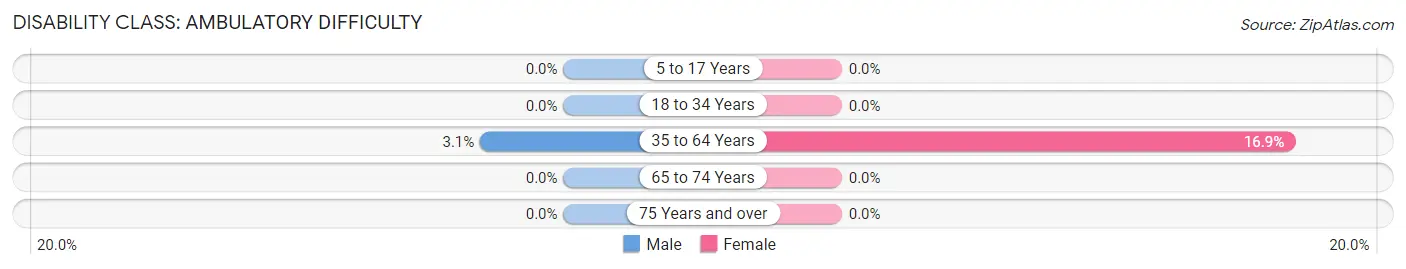
| Age Bracket | Male | Female |
| 5 to 17 Years | 0 (0.0%) | 0 (0.0%) |
| 18 to 34 Years | 0 (0.0%) | 0 (0.0%) |
| 35 to 64 Years | 3 (3.1%) | 57 (16.9%) |
| 65 to 74 Years | 0 (0.0%) | 0 (0.0%) |
| 75 Years and over | 0 (0.0%) | 0 (0.0%) |
Disability Class: Self-Care Difficulty
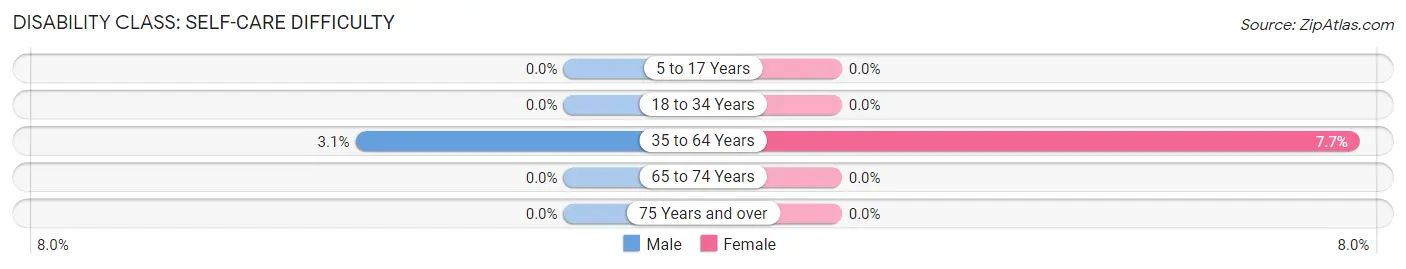
| Age Bracket | Male | Female |
| 5 to 17 Years | 0 (0.0%) | 0 (0.0%) |
| 18 to 34 Years | 0 (0.0%) | 0 (0.0%) |
| 35 to 64 Years | 3 (3.1%) | 26 (7.7%) |
| 65 to 74 Years | 0 (0.0%) | 0 (0.0%) |
| 75 Years and over | 0 (0.0%) | 0 (0.0%) |
Technology Access in North Tunica
Computing Device Access in North Tunica
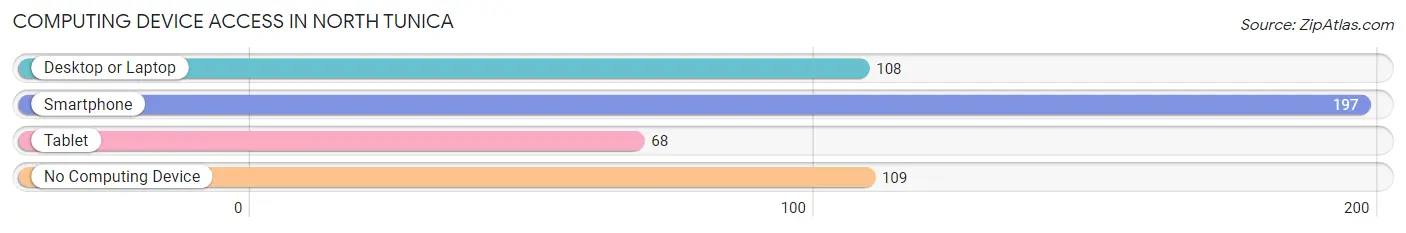
| Device Type | # Households | % Households |
| Desktop or Laptop | 108 | 33.2% |
| Smartphone | 197 | 60.6% |
| Tablet | 68 | 20.9% |
| No Computing Device | 109 | 33.5% |
| Total | 325 | 100.0% |
Internet Access in North Tunica
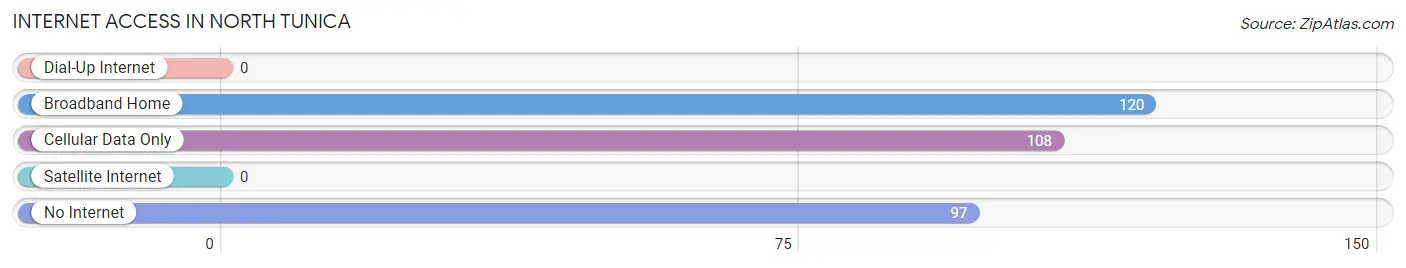
| Internet Type | # Households | % Households |
| Dial-Up Internet | 0 | 0.0% |
| Broadband Home | 120 | 36.9% |
| Cellular Data Only | 108 | 33.2% |
| Satellite Internet | 0 | 0.0% |
| No Internet | 97 | 29.8% |
| Total | 325 | 100.0% |
North Tunica Summary
Tunica, Mississippi is a small town located in the northwest corner of the state, just south of Memphis, Tennessee. It is part of the larger Tunica County, which is home to a population of about 10,000 people. The town of Tunica was founded in 1836 and has a rich history of cotton production, gambling, and blues music.
Geography
Tunica is located in the northwest corner of Mississippi, just south of Memphis, Tennessee. It is part of the larger Tunica County, which is home to a population of about 10,000 people. The town of Tunica is situated on the banks of the Mississippi River, and is surrounded by the Yazoo River to the east and the Coldwater River to the west. The town is located in the Mississippi Delta, a region of the state known for its flat, fertile land and rich soil. The area is also known for its hot, humid summers and mild winters.
Economy
Tunica’s economy is largely based on agriculture, with cotton being the primary crop. The town is also home to several casinos, which have become a major source of revenue for the area. The casinos have helped to bring in tourists and create jobs in the area. In addition, Tunica is home to several manufacturing plants, including a paper mill and a furniture factory.
Demographics
As of the 2010 census, the population of Tunica was 8,547. The racial makeup of the town was 79.3% African American, 19.2% White, 0.3% Native American, 0.2% Asian, and 0.9% from other races. The median household income was $25,945, and the median age was 36.
History
Tunica was founded in 1836 by a group of settlers from Tennessee. The town was named after the Tunica Indians, who had lived in the area for centuries before the settlers arrived. The town quickly grew and became a center for cotton production. During the Civil War, the town was occupied by Union forces, and the cotton industry was destroyed. After the war, the town was rebuilt and the cotton industry was revived.
In the early 20th century, Tunica became known as a center for blues music. Musicians such as Robert Johnson, Muddy Waters, and B.B. King all performed in the town. In the late 20th century, the town became known for its gambling industry, with several casinos opening in the area. Today, Tunica is a popular tourist destination, with its casinos, blues music, and rich history.
Common Questions
What is Per Capita Income in North Tunica?
Per Capita income in North Tunica is $12,763.
What is Inequality or Gini Index in North Tunica?
Inequality or Gini Index in North Tunica is 0.61.
What is the Total Population of North Tunica?
Total Population of North Tunica is 941.
What is the Total Male Population of North Tunica?
Total Male Population of North Tunica is 314.
What is the Total Female Population of North Tunica?
Total Female Population of North Tunica is 627.
What is the Ratio of Males per 100 Females in North Tunica?
There are 50.08 Males per 100 Females in North Tunica.
What is the Ratio of Females per 100 Males in North Tunica?
There are 199.68 Females per 100 Males in North Tunica.
What is the Median Population Age in North Tunica?
Median Population Age in North Tunica is 37.0 Years.
What is the Average Family Size in North Tunica
Average Family Size in North Tunica is 4.5 People.
What is the Average Household Size in North Tunica
Average Household Size in North Tunica is 2.8 People.
How Large is the Labor Force in North Tunica?
There are 489 People in the Labor Forcein in North Tunica.
What is the Percentage of People in the Labor Force in North Tunica?
66.0% of People are in the Labor Force in North Tunica.
What is the Unemployment Rate in North Tunica?
Unemployment Rate in North Tunica is 66.3%.