St Martin, MS Map & Demographics
St Martin Map
St Martin Overview
$23,022
PER CAPITA INCOME
$65,262
AVG FAMILY INCOME
$49,484
AVG HOUSEHOLD INCOME
31.4%
WAGE / INCOME GAP [ % ]
68.6¢/ $1
WAGE / INCOME GAP [ $ ]
0.36
INEQUALITY / GINI INDEX
7,843
TOTAL POPULATION
3,646
MALE POPULATION
4,197
FEMALE POPULATION
86.87
MALES / 100 FEMALES
115.11
FEMALES / 100 MALES
38.0
MEDIAN AGE
3.9
AVG FAMILY SIZE
2.7
AVG HOUSEHOLD SIZE
3,634
LABOR FORCE [ PEOPLE ]
56.4%
PERCENT IN LABOR FORCE
5.6%
UNEMPLOYMENT RATE
Income in St Martin
Income Overview in St Martin
Per Capita Income in St Martin is $23,022, while median incomes of families and households are $65,262 and $49,484 respectively.
| Characteristic | Number | Measure |
| Per Capita Income | 7,843 | $23,022 |
| Median Family Income | 1,579 | $65,262 |
| Mean Family Income | 1,579 | $71,185 |
| Median Household Income | 2,917 | $49,484 |
| Mean Household Income | 2,917 | $59,298 |
| Income Deficit | 1,579 | $0 |
| Wage / Income Gap (%) | 7,843 | 31.44% |
| Wage / Income Gap ($) | 7,843 | 68.56¢ per $1 |
| Gini / Inequality Index | 7,843 | 0.36 |
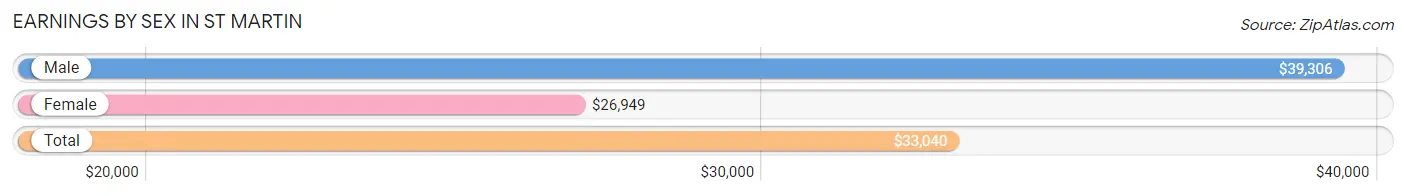
Earnings by Sex in St Martin
Average Earnings in St Martin are $33,040, $39,306 for men and $26,949 for women, a difference of 31.4%.
| Sex | Number | Average Earnings |
| Male | 1,981 (54.4%) | $39,306 |
| Female | 1,661 (45.6%) | $26,949 |
| Total | 3,642 (100.0%) | $33,040 |
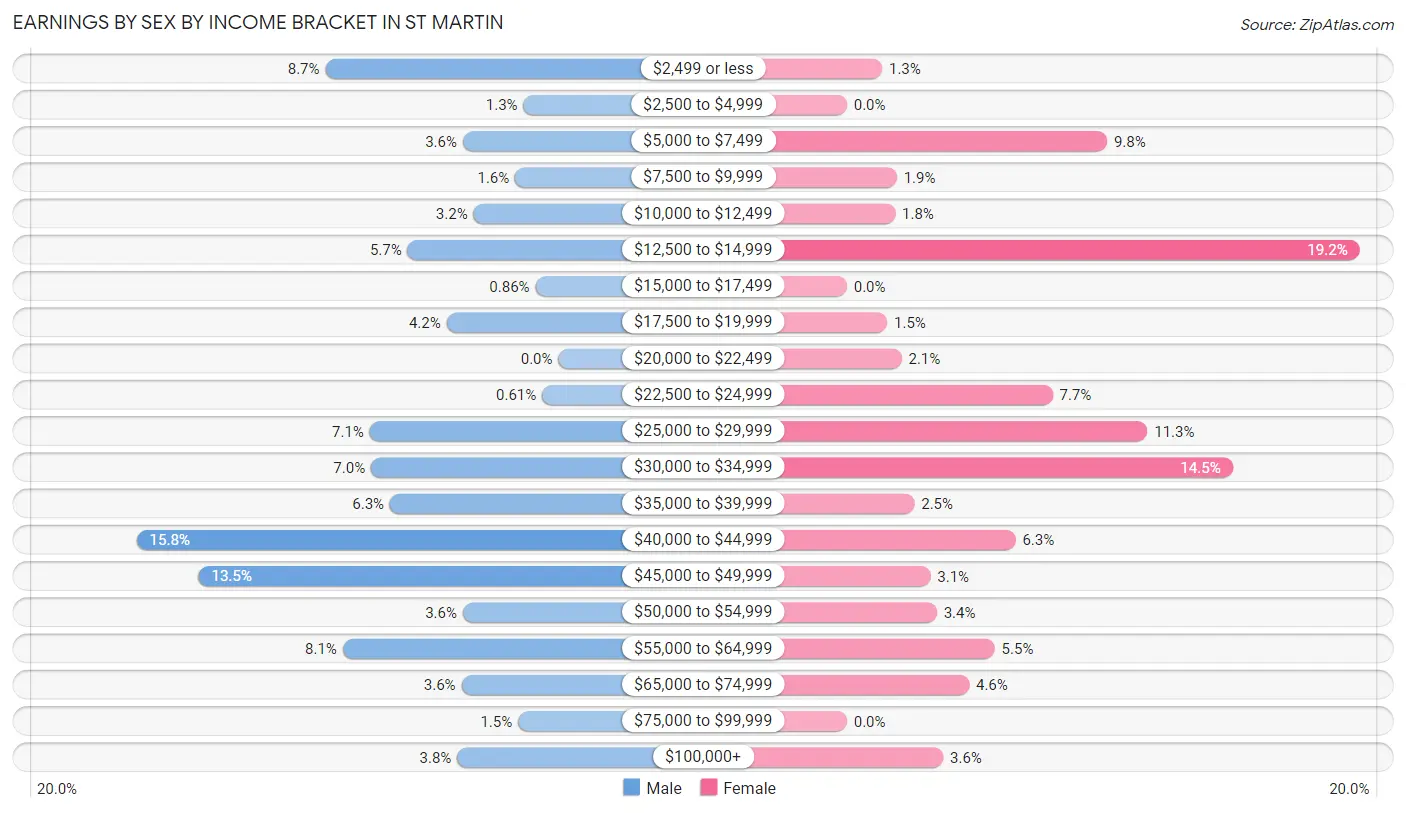
Earnings by Sex by Income Bracket in St Martin
The most common earnings brackets in St Martin are $40,000 to $44,999 for men (313 | 15.8%) and $12,500 to $14,999 for women (319 | 19.2%).
| Income | Male | Female |
| $2,499 or less | 173 (8.7%) | 22 (1.3%) |
| $2,500 to $4,999 | 26 (1.3%) | 0 (0.0%) |
| $5,000 to $7,499 | 71 (3.6%) | 162 (9.8%) |
| $7,500 to $9,999 | 32 (1.6%) | 31 (1.9%) |
| $10,000 to $12,499 | 63 (3.2%) | 30 (1.8%) |
| $12,500 to $14,999 | 112 (5.7%) | 319 (19.2%) |
| $15,000 to $17,499 | 17 (0.9%) | 0 (0.0%) |
| $17,500 to $19,999 | 83 (4.2%) | 25 (1.5%) |
| $20,000 to $22,499 | 0 (0.0%) | 34 (2.1%) |
| $22,500 to $24,999 | 12 (0.6%) | 128 (7.7%) |
| $25,000 to $29,999 | 140 (7.1%) | 187 (11.3%) |
| $30,000 to $34,999 | 139 (7.0%) | 240 (14.4%) |
| $35,000 to $39,999 | 125 (6.3%) | 42 (2.5%) |
| $40,000 to $44,999 | 313 (15.8%) | 105 (6.3%) |
| $45,000 to $49,999 | 267 (13.5%) | 52 (3.1%) |
| $50,000 to $54,999 | 71 (3.6%) | 56 (3.4%) |
| $55,000 to $64,999 | 160 (8.1%) | 92 (5.5%) |
| $65,000 to $74,999 | 72 (3.6%) | 76 (4.6%) |
| $75,000 to $99,999 | 30 (1.5%) | 0 (0.0%) |
| $100,000+ | 75 (3.8%) | 60 (3.6%) |
| Total | 1,981 (100.0%) | 1,661 (100.0%) |
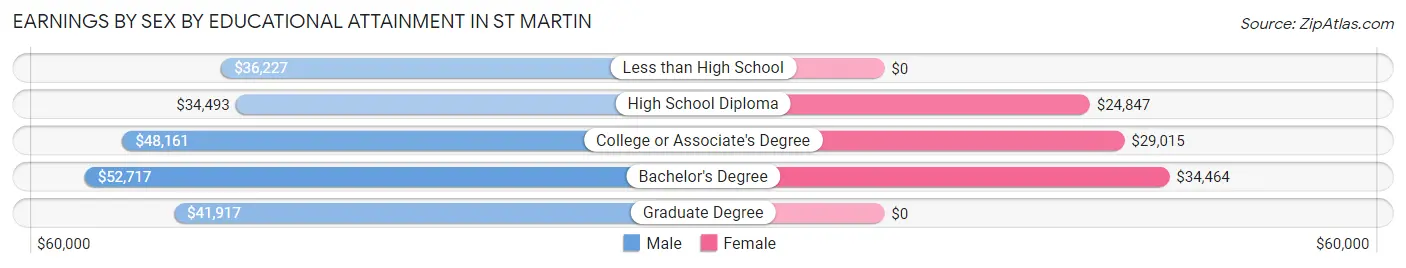
Earnings by Sex by Educational Attainment in St Martin
Average earnings in St Martin are $41,674 for men and $29,221 for women, a difference of 29.9%. Men with an educational attainment of bachelor's degree enjoy the highest average annual earnings of $52,717, while those with high school diploma education earn the least with $34,493. Women with an educational attainment of bachelor's degree earn the most with the average annual earnings of $34,464, while those with high school diploma education have the smallest earnings of $24,847.
| Educational Attainment | Male Income | Female Income |
| Less than High School | $36,227 | $0 |
| High School Diploma | $34,493 | $24,847 |
| College or Associate's Degree | $48,161 | $29,015 |
| Bachelor's Degree | $52,717 | $34,464 |
| Graduate Degree | $41,917 | $0 |
| Total | $41,674 | $29,221 |
Family Income in St Martin
Family Income Brackets in St Martin
According to the St Martin family income data, there are 591 families falling into the $50,000 to $74,999 income range, which is the most common income bracket and makes up 37.4% of all families.
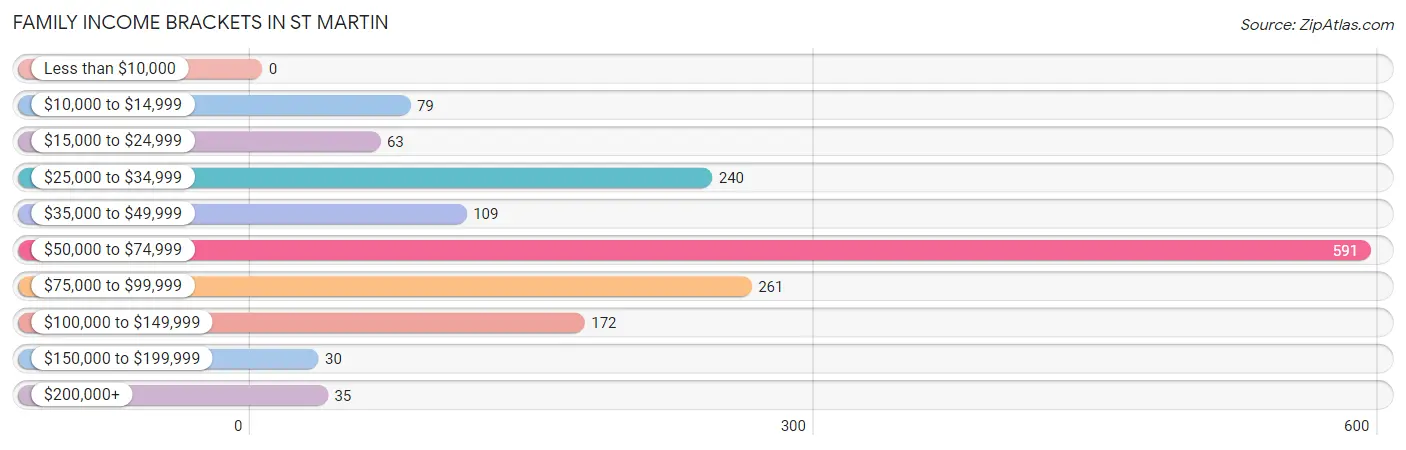
| Income Bracket | # Families | % Families |
| Less than $10,000 | 0 | 0.0% |
| $10,000 to $14,999 | 79 | 5.0% |
| $15,000 to $24,999 | 63 | 4.0% |
| $25,000 to $34,999 | 240 | 15.2% |
| $35,000 to $49,999 | 109 | 6.9% |
| $50,000 to $74,999 | 591 | 37.4% |
| $75,000 to $99,999 | 261 | 16.5% |
| $100,000 to $149,999 | 172 | 10.9% |
| $150,000 to $199,999 | 30 | 1.9% |
| $200,000+ | 35 | 2.2% |
Family Income by Famaliy Size in St Martin
3-person families (465 | 29.4%) account for the highest median family income in St Martin with $74,962 per family, while 2-person families (590 | 37.4%) have the highest median income of $27,880 per family member.
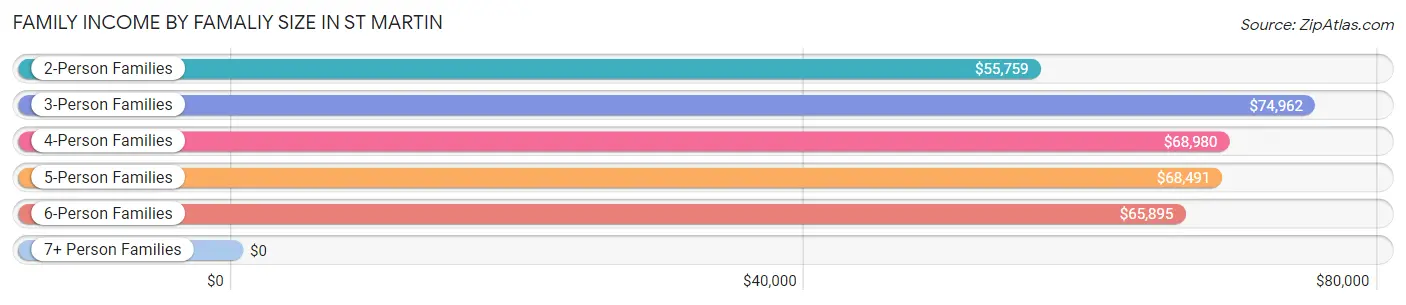
| Income Bracket | # Families | Median Income |
| 2-Person Families | 590 (37.4%) | $55,759 |
| 3-Person Families | 465 (29.4%) | $74,962 |
| 4-Person Families | 139 (8.8%) | $68,980 |
| 5-Person Families | 191 (12.1%) | $68,491 |
| 6-Person Families | 122 (7.7%) | $65,895 |
| 7+ Person Families | 72 (4.6%) | $0 |
| Total | 1,579 (100.0%) | $65,262 |
Family Income by Number of Earners in St Martin
The median family income in St Martin is $65,262, with families comprising 2 earners (351) having the highest median family income of $78,393, while families with no earners (222) have the lowest median family income of $37,045, accounting for 22.2% and 14.1% of families, respectively.
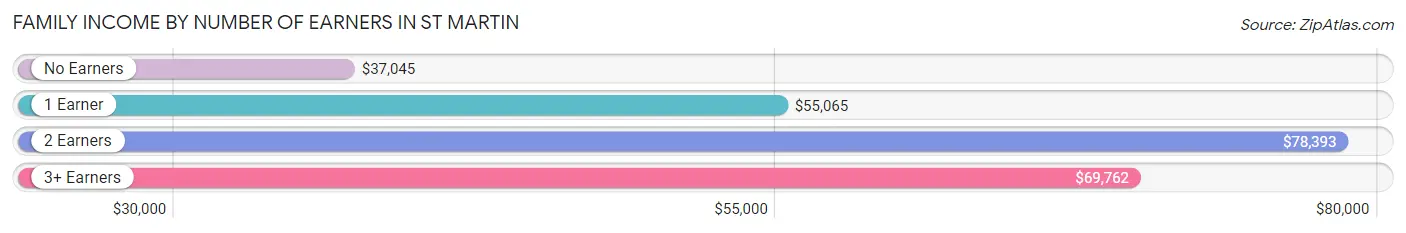
| Number of Earners | # Families | Median Income |
| No Earners | 222 (14.1%) | $37,045 |
| 1 Earner | 693 (43.9%) | $55,065 |
| 2 Earners | 351 (22.2%) | $78,393 |
| 3+ Earners | 313 (19.8%) | $69,762 |
| Total | 1,579 (100.0%) | $65,262 |
Household Income in St Martin
Household Income Brackets in St Martin
With 779 households falling in the category, the $50,000 to $74,999 income range is the most frequent in St Martin, accounting for 26.7% of all households. In contrast, only 35 households (1.2%) fall into the $150,000 to $199,999 income bracket, making it the least populous group.
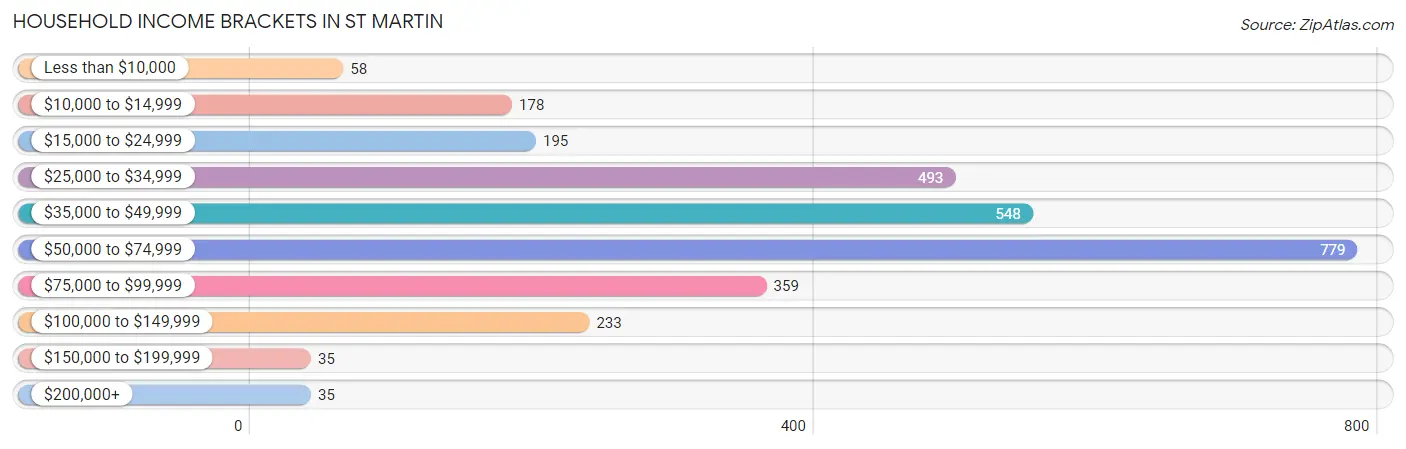
| Income Bracket | # Households | % Households |
| Less than $10,000 | 58 | 2.0% |
| $10,000 to $14,999 | 178 | 6.1% |
| $15,000 to $24,999 | 195 | 6.7% |
| $25,000 to $34,999 | 493 | 16.9% |
| $35,000 to $49,999 | 548 | 18.8% |
| $50,000 to $74,999 | 779 | 26.7% |
| $75,000 to $99,999 | 359 | 12.3% |
| $100,000 to $149,999 | 233 | 8.0% |
| $150,000 to $199,999 | 35 | 1.2% |
| $200,000+ | 35 | 1.2% |
Household Income by Householder Age in St Martin
The median household income in St Martin is $49,484, with the highest median household income of $55,109 found in the 25 to 44 years age bracket for the primary householder. A total of 1,016 households (34.8%) fall into this category. Meanwhile, the 15 to 24 years age bracket for the primary householder has the lowest median household income of $44,464, with 121 households (4.2%) in this group.
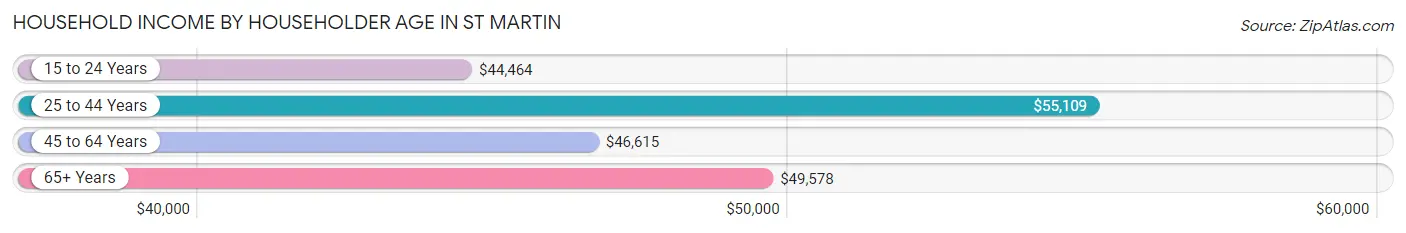
| Income Bracket | # Households | Median Income |
| 15 to 24 Years | 121 (4.2%) | $44,464 |
| 25 to 44 Years | 1,016 (34.8%) | $55,109 |
| 45 to 64 Years | 1,059 (36.3%) | $46,615 |
| 65+ Years | 721 (24.7%) | $49,578 |
| Total | 2,917 (100.0%) | $49,484 |
Poverty in St Martin
Income Below Poverty by Sex and Age in St Martin
With 17.8% poverty level for males and 10.3% for females among the residents of St Martin, 6 to 11 year old males and 15 year old females are the most vulnerable to poverty, with 152 males (58.0%) and 9 females (100.0%) in their respective age groups living below the poverty level.
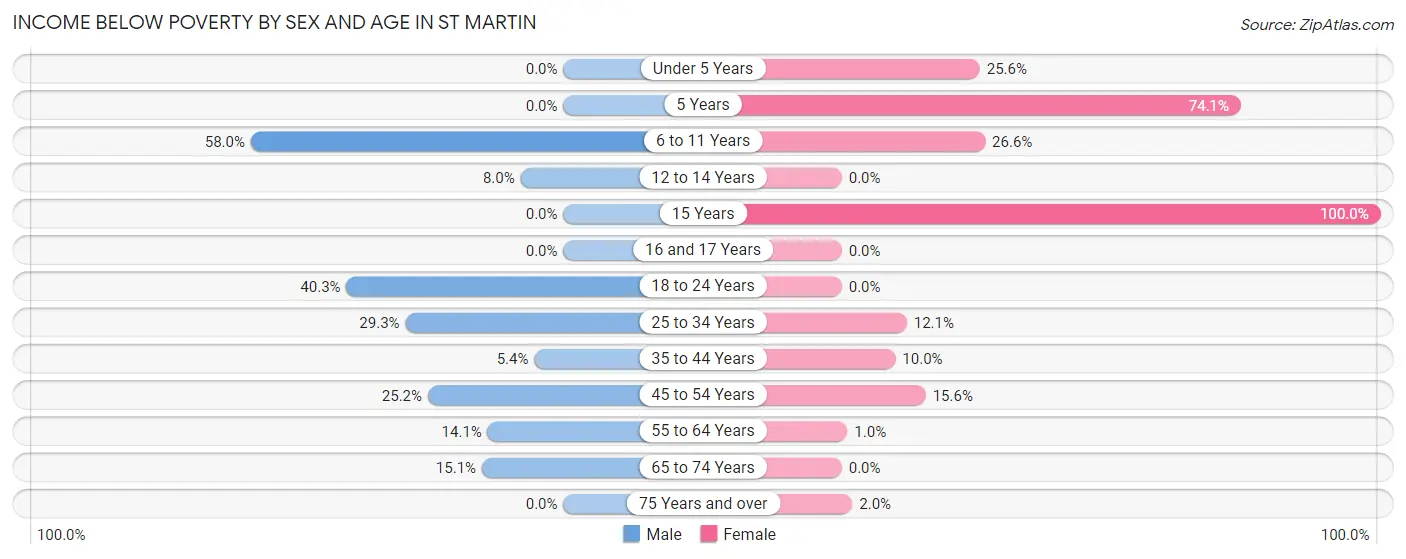
| Age Bracket | Male | Female |
| Under 5 Years | 0 (0.0%) | 41 (25.6%) |
| 5 Years | 0 (0.0%) | 80 (74.1%) |
| 6 to 11 Years | 152 (58.0%) | 33 (26.6%) |
| 12 to 14 Years | 29 (8.0%) | 0 (0.0%) |
| 15 Years | 0 (0.0%) | 9 (100.0%) |
| 16 and 17 Years | 0 (0.0%) | 0 (0.0%) |
| 18 to 24 Years | 120 (40.3%) | 0 (0.0%) |
| 25 to 34 Years | 112 (29.3%) | 95 (12.1%) |
| 35 to 44 Years | 32 (5.4%) | 64 (10.0%) |
| 45 to 54 Years | 86 (25.2%) | 93 (15.6%) |
| 55 to 64 Years | 84 (14.1%) | 7 (1.0%) |
| 65 to 74 Years | 26 (15.1%) | 0 (0.0%) |
| 75 Years and over | 0 (0.0%) | 7 (2.0%) |
| Total | 641 (17.8%) | 429 (10.3%) |
Income Above Poverty by Sex and Age in St Martin
According to the poverty statistics in St Martin, males aged under 5 years and females aged 12 to 14 years are the age groups that are most secure financially, with 100.0% of males and 100.0% of females in these age groups living above the poverty line.
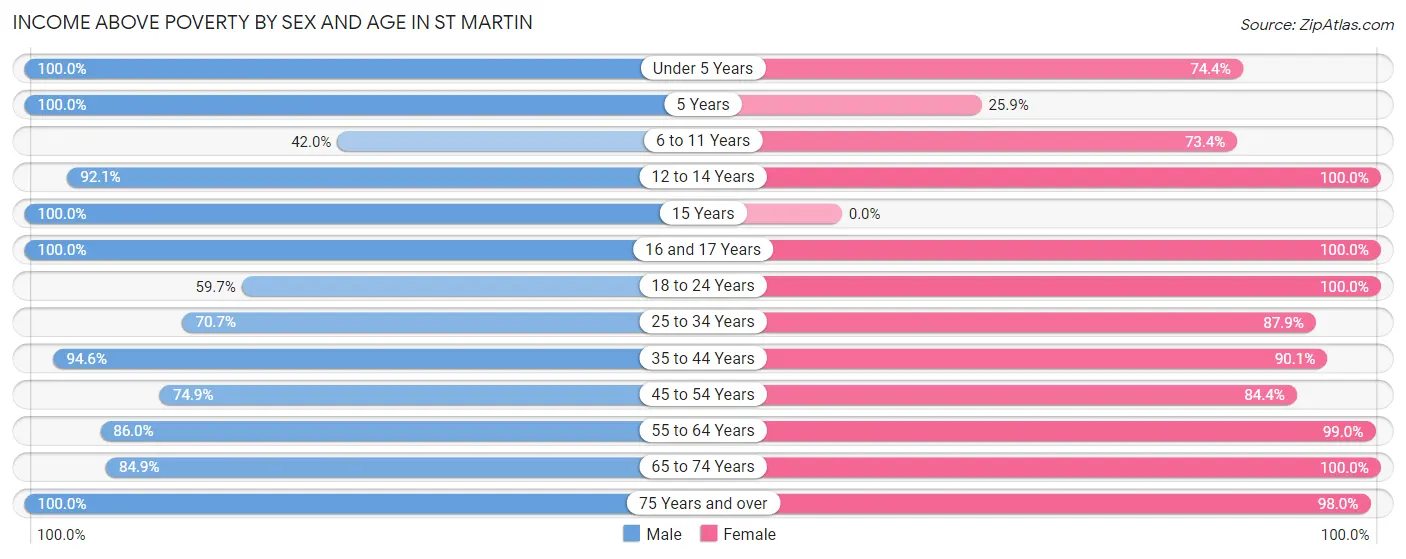
| Age Bracket | Male | Female |
| Under 5 Years | 248 (100.0%) | 119 (74.4%) |
| 5 Years | 12 (100.0%) | 28 (25.9%) |
| 6 to 11 Years | 110 (42.0%) | 91 (73.4%) |
| 12 to 14 Years | 336 (92.0%) | 42 (100.0%) |
| 15 Years | 5 (100.0%) | 0 (0.0%) |
| 16 and 17 Years | 178 (100.0%) | 185 (100.0%) |
| 18 to 24 Years | 178 (59.7%) | 211 (100.0%) |
| 25 to 34 Years | 270 (70.7%) | 692 (87.9%) |
| 35 to 44 Years | 562 (94.6%) | 579 (90.0%) |
| 45 to 54 Years | 256 (74.9%) | 504 (84.4%) |
| 55 to 64 Years | 514 (86.0%) | 666 (99.0%) |
| 65 to 74 Years | 146 (84.9%) | 264 (100.0%) |
| 75 Years and over | 150 (100.0%) | 351 (98.0%) |
| Total | 2,965 (82.2%) | 3,732 (89.7%) |
Income Below Poverty Among Married-Couple Families in St Martin
The poverty statistics for married-couple families in St Martin show that 9.3% or 103 of the total 1,112 families live below the poverty line. Families with 3 or 4 children have the highest poverty rate of 49.3%, comprising of 72 families. On the other hand, families with no children have the lowest poverty rate of 0.0%, which includes 0 families.
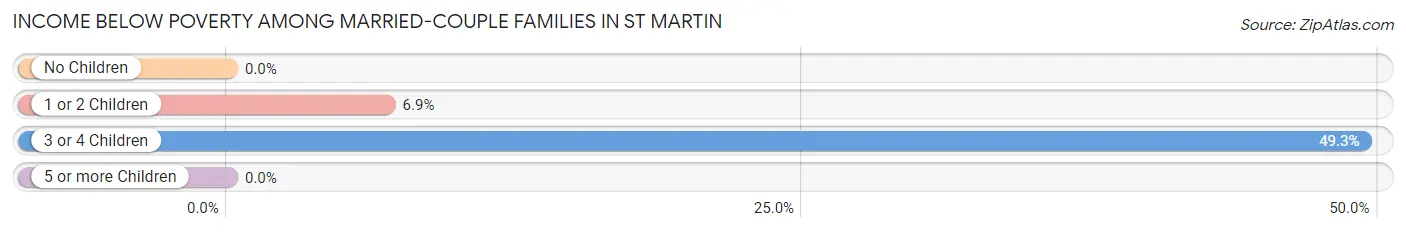
| Children | Above Poverty | Below Poverty |
| No Children | 514 (100.0%) | 0 (0.0%) |
| 1 or 2 Children | 421 (93.1%) | 31 (6.9%) |
| 3 or 4 Children | 74 (50.7%) | 72 (49.3%) |
| 5 or more Children | 0 (0.0%) | 0 (0.0%) |
| Total | 1,009 (90.7%) | 103 (9.3%) |
Income Below Poverty Among Single-Parent Households in St Martin
According to the poverty data in St Martin, 24.8% or 32 single-father households and 2.1% or 7 single-mother households are living below the poverty line. Among single-father households, those with 1 or 2 children have the highest poverty rate, with 32 households (86.5%) experiencing poverty. Likewise, among single-mother households, those with no children have the highest poverty rate, with 7 households (9.3%) falling below the poverty line.
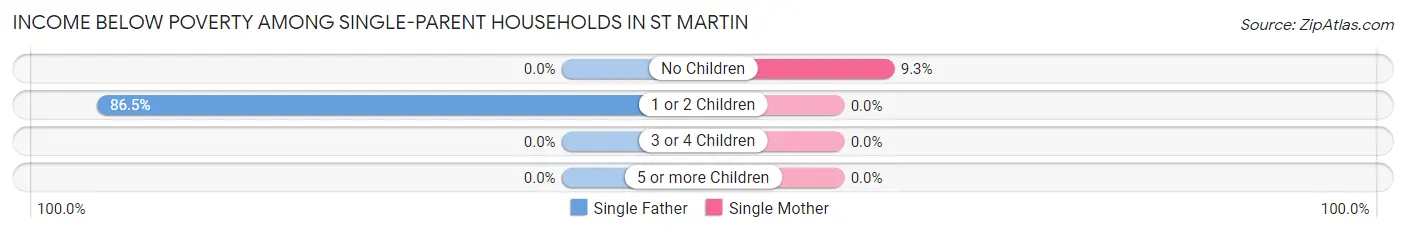
| Children | Single Father | Single Mother |
| No Children | 0 (0.0%) | 7 (9.3%) |
| 1 or 2 Children | 32 (86.5%) | 0 (0.0%) |
| 3 or 4 Children | 0 (0.0%) | 0 (0.0%) |
| 5 or more Children | 0 (0.0%) | 0 (0.0%) |
| Total | 32 (24.8%) | 7 (2.1%) |
Income Below Poverty Among Married-Couple vs Single-Parent Households in St Martin
The poverty data for St Martin shows that 103 of the married-couple family households (9.3%) and 39 of the single-parent households (8.4%) are living below the poverty level. Within the married-couple family households, those with 3 or 4 children have the highest poverty rate, with 72 households (49.3%) falling below the poverty line. Among the single-parent households, those with 1 or 2 children have the highest poverty rate, with 32 household (10.7%) living below poverty.
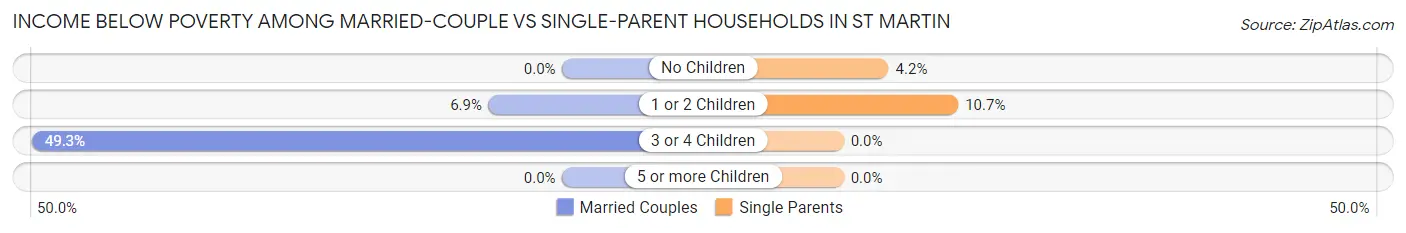
| Children | Married-Couple Families | Single-Parent Households |
| No Children | 0 (0.0%) | 7 (4.2%) |
| 1 or 2 Children | 31 (6.9%) | 32 (10.7%) |
| 3 or 4 Children | 72 (49.3%) | 0 (0.0%) |
| 5 or more Children | 0 (0.0%) | 0 (0.0%) |
| Total | 103 (9.3%) | 39 (8.4%) |
Race in St Martin
The most populous races in St Martin are White / Caucasian (6,528 | 83.2%), Black / African American (795 | 10.1%), and Asian (241 | 3.1%).
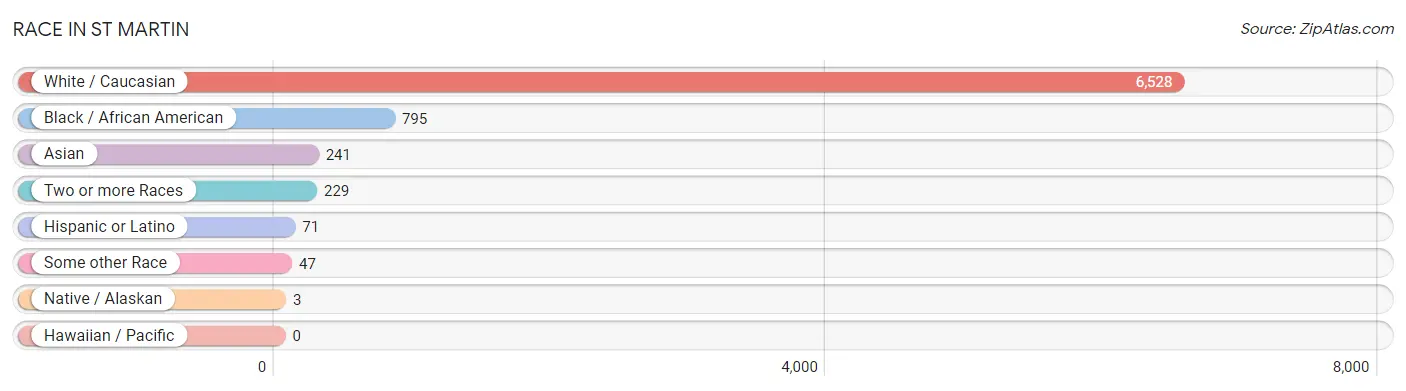
| Race | # Population | % Population |
| Asian | 241 | 3.1% |
| Black / African American | 795 | 10.1% |
| Hawaiian / Pacific | 0 | 0.0% |
| Hispanic or Latino | 71 | 0.9% |
| Native / Alaskan | 3 | 0.0% |
| White / Caucasian | 6,528 | 83.2% |
| Two or more Races | 229 | 2.9% |
| Some other Race | 47 | 0.6% |
| Total | 7,843 | 100.0% |
Ancestry in St Martin
The most populous ancestries reported in St Martin are German (1,693 | 21.6%), American (1,627 | 20.7%), French (501 | 6.4%), Irish (456 | 5.8%), and English (317 | 4.0%), together accounting for 58.6% of all St Martin residents.
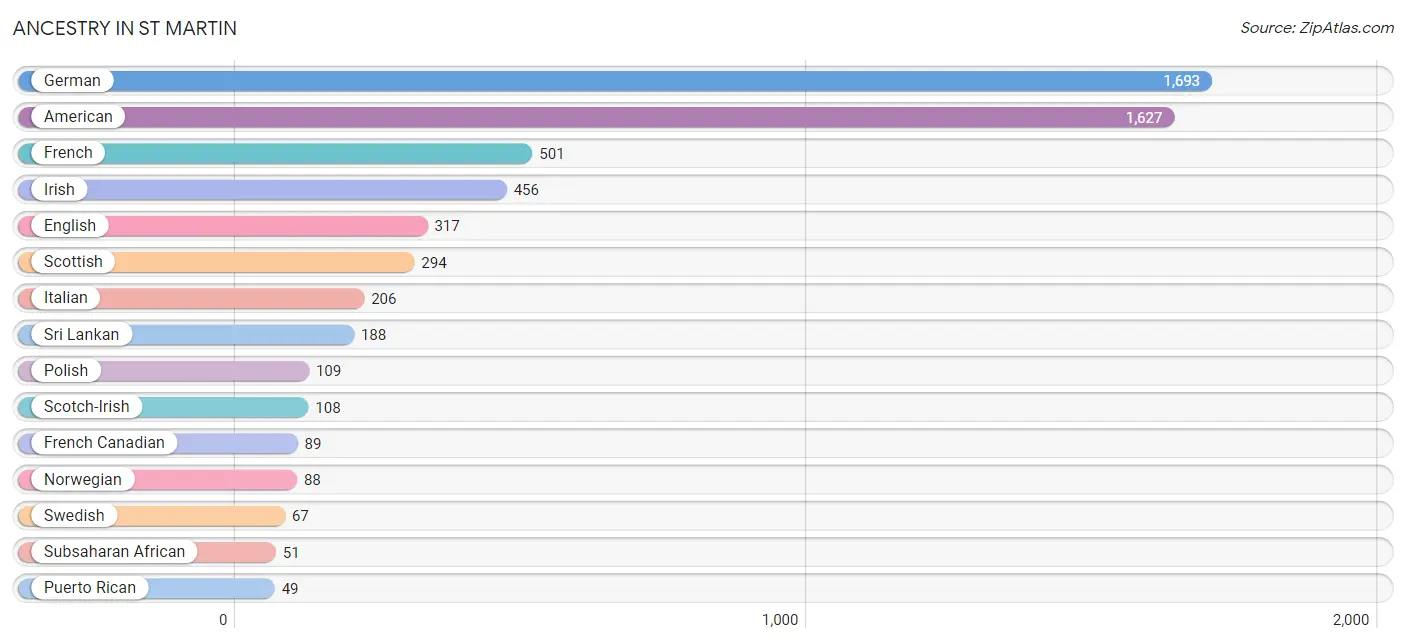
| Ancestry | # Population | % Population |
| African | 20 | 0.3% |
| Albanian | 18 | 0.2% |
| American | 1,627 | 20.7% |
| Arab | 20 | 0.3% |
| Australian | 30 | 0.4% |
| Belgian | 12 | 0.2% |
| British | 30 | 0.4% |
| Cajun | 7 | 0.1% |
| Cherokee | 1 | 0.0% |
| Choctaw | 3 | 0.0% |
| Creek | 9 | 0.1% |
| Croatian | 21 | 0.3% |
| Czechoslovakian | 12 | 0.2% |
| Dutch | 12 | 0.2% |
| English | 317 | 4.0% |
| European | 16 | 0.2% |
| French | 501 | 6.4% |
| French Canadian | 89 | 1.1% |
| German | 1,693 | 21.6% |
| Indian (Asian) | 43 | 0.5% |
| Irish | 456 | 5.8% |
| Italian | 206 | 2.6% |
| Korean | 42 | 0.5% |
| Lebanese | 20 | 0.3% |
| Mexican | 10 | 0.1% |
| Norwegian | 88 | 1.1% |
| Polish | 109 | 1.4% |
| Puerto Rican | 49 | 0.6% |
| Samoan | 26 | 0.3% |
| Scandinavian | 7 | 0.1% |
| Scotch-Irish | 108 | 1.4% |
| Scottish | 294 | 3.7% |
| Spanish | 12 | 0.2% |
| Sri Lankan | 188 | 2.4% |
| Subsaharan African | 51 | 0.6% |
| Swedish | 67 | 0.9% | View All 36 Rows |
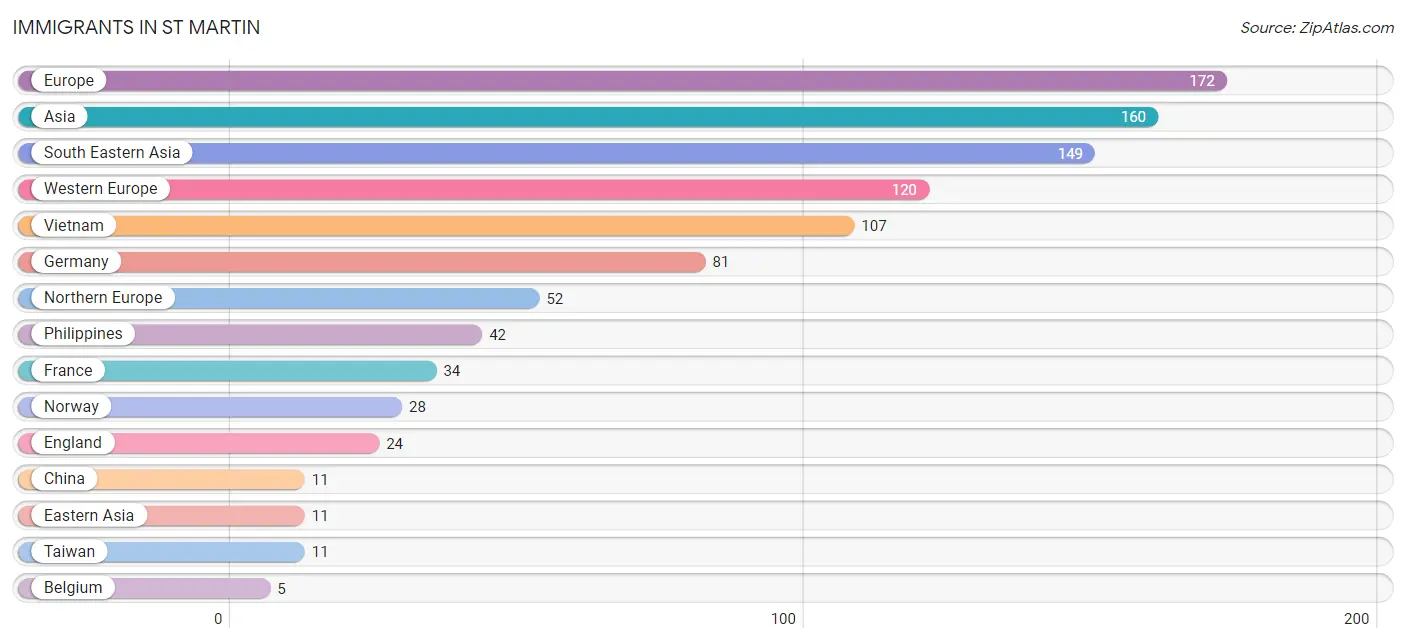
Immigrants in St Martin
The most numerous immigrant groups reported in St Martin came from Europe (172 | 2.2%), Asia (160 | 2.0%), South Eastern Asia (149 | 1.9%), Western Europe (120 | 1.5%), and Vietnam (107 | 1.4%), together accounting for 9.0% of all St Martin residents.
| Immigration Origin | # Population | % Population |
| Asia | 160 | 2.0% |
| Belgium | 5 | 0.1% |
| China | 11 | 0.1% |
| Eastern Asia | 11 | 0.1% |
| England | 24 | 0.3% |
| Europe | 172 | 2.2% |
| France | 34 | 0.4% |
| Germany | 81 | 1.0% |
| Northern Europe | 52 | 0.7% |
| Norway | 28 | 0.4% |
| Philippines | 42 | 0.5% |
| South Eastern Asia | 149 | 1.9% |
| Taiwan | 11 | 0.1% |
| Vietnam | 107 | 1.4% |
| Western Europe | 120 | 1.5% | View All 15 Rows |
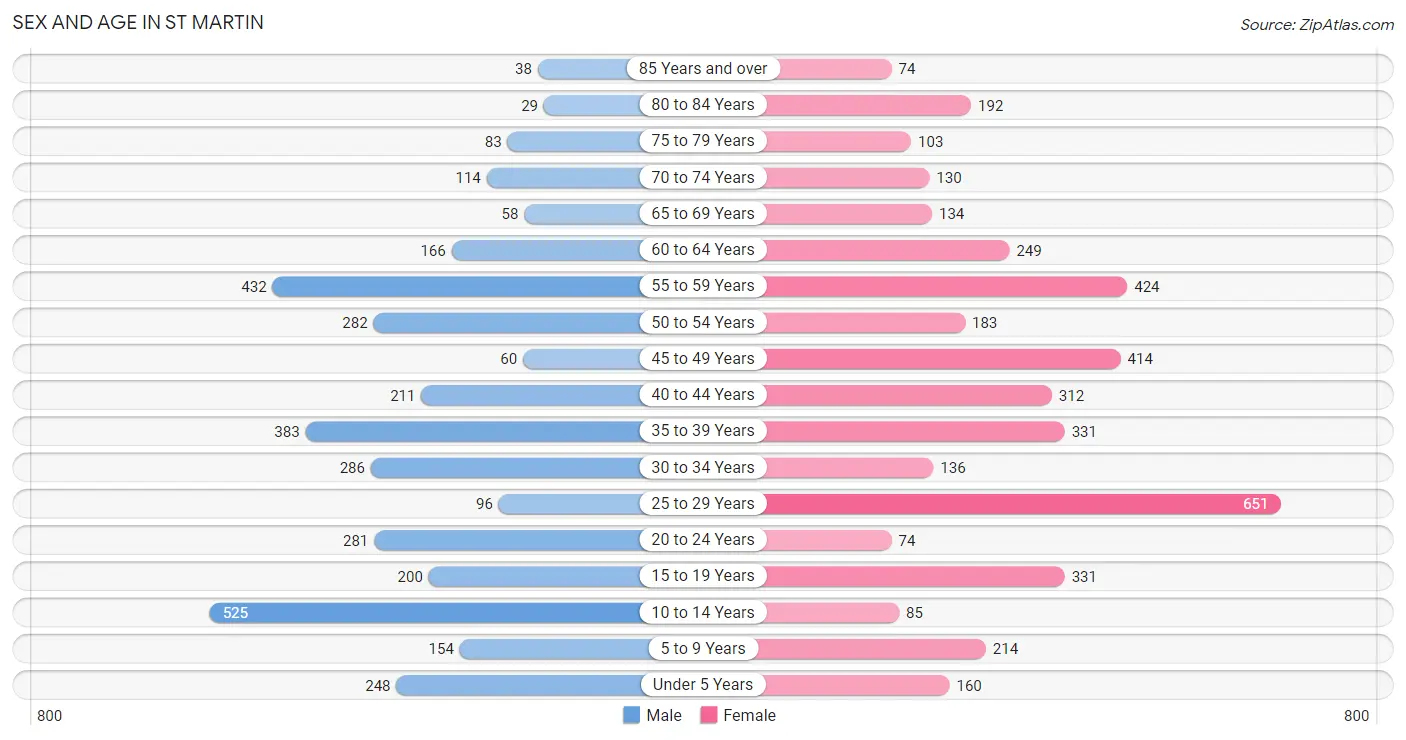
Sex and Age in St Martin
Sex and Age in St Martin
The most populous age groups in St Martin are 10 to 14 Years (525 | 14.4%) for men and 25 to 29 Years (651 | 15.5%) for women.
| Age Bracket | Male | Female |
| Under 5 Years | 248 (6.8%) | 160 (3.8%) |
| 5 to 9 Years | 154 (4.2%) | 214 (5.1%) |
| 10 to 14 Years | 525 (14.4%) | 85 (2.0%) |
| 15 to 19 Years | 200 (5.5%) | 331 (7.9%) |
| 20 to 24 Years | 281 (7.7%) | 74 (1.8%) |
| 25 to 29 Years | 96 (2.6%) | 651 (15.5%) |
| 30 to 34 Years | 286 (7.8%) | 136 (3.2%) |
| 35 to 39 Years | 383 (10.5%) | 331 (7.9%) |
| 40 to 44 Years | 211 (5.8%) | 312 (7.4%) |
| 45 to 49 Years | 60 (1.7%) | 414 (9.9%) |
| 50 to 54 Years | 282 (7.7%) | 183 (4.4%) |
| 55 to 59 Years | 432 (11.8%) | 424 (10.1%) |
| 60 to 64 Years | 166 (4.5%) | 249 (5.9%) |
| 65 to 69 Years | 58 (1.6%) | 134 (3.2%) |
| 70 to 74 Years | 114 (3.1%) | 130 (3.1%) |
| 75 to 79 Years | 83 (2.3%) | 103 (2.5%) |
| 80 to 84 Years | 29 (0.8%) | 192 (4.6%) |
| 85 Years and over | 38 (1.0%) | 74 (1.8%) |
| Total | 3,646 (100.0%) | 4,197 (100.0%) |
Families and Households in St Martin
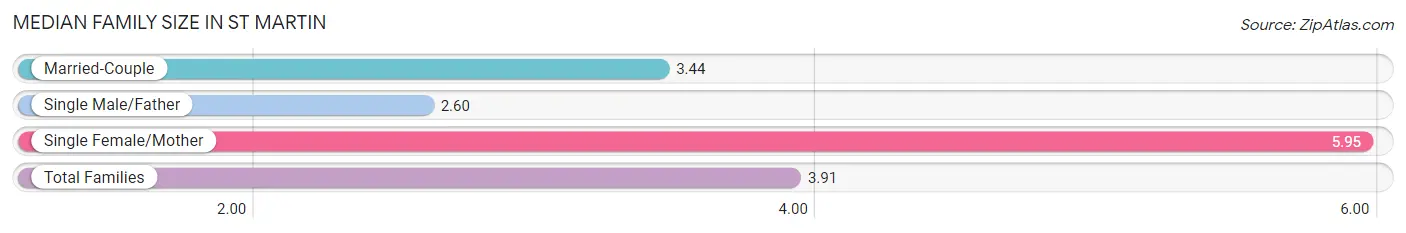
Median Family Size in St Martin
The median family size in St Martin is 3.91 persons per family, with single female/mother families (338 | 21.4%) accounting for the largest median family size of 5.95 persons per family. On the other hand, single male/father families (129 | 8.2%) represent the smallest median family size with 2.60 persons per family.
| Family Type | # Families | Family Size |
| Married-Couple | 1,112 (70.4%) | 3.44 |
| Single Male/Father | 129 (8.2%) | 2.60 |
| Single Female/Mother | 338 (21.4%) | 5.95 |
| Total Families | 1,579 (100.0%) | 3.91 |
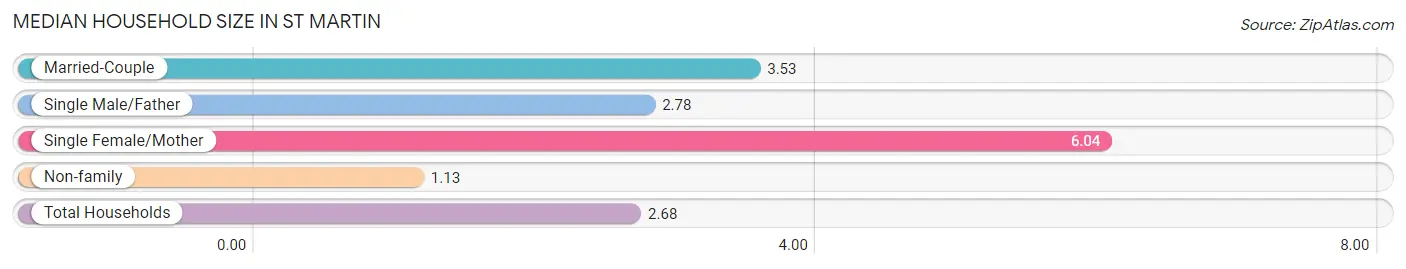
Median Household Size in St Martin
The median household size in St Martin is 2.68 persons per household, with single female/mother households (338 | 11.6%) accounting for the largest median household size of 6.04 persons per household. non-family households (1,338 | 45.9%) represent the smallest median household size with 1.13 persons per household.
| Household Type | # Households | Household Size |
| Married-Couple | 1,112 (38.1%) | 3.53 |
| Single Male/Father | 129 (4.4%) | 2.78 |
| Single Female/Mother | 338 (11.6%) | 6.04 |
| Non-family | 1,338 (45.9%) | 1.13 |
| Total Households | 2,917 (100.0%) | 2.68 |
Household Size by Marriage Status in St Martin
Out of a total of 2,917 households in St Martin, 1,579 (54.1%) are family households, while 1,338 (45.9%) are nonfamily households. The most numerous type of family households are 2-person households, comprising 571, and the most common type of nonfamily households are 1-person households, comprising 1,250.
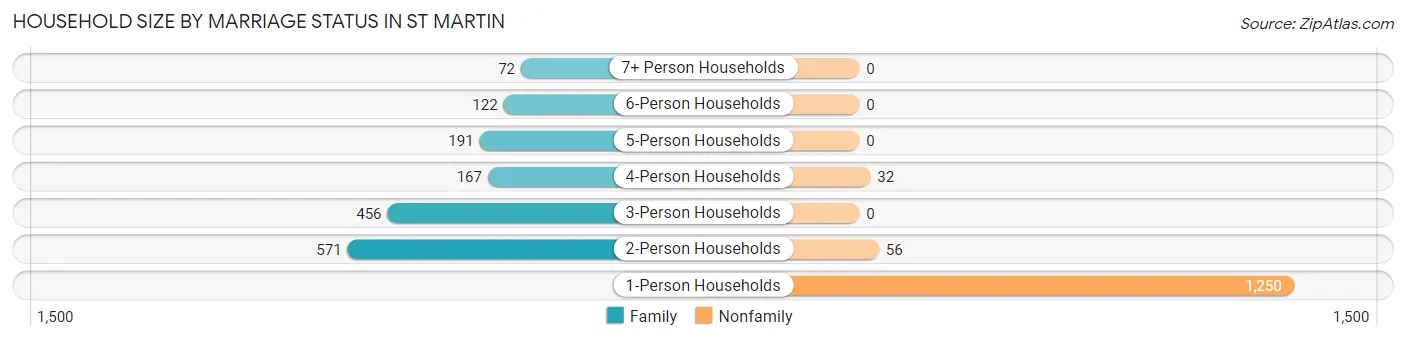
| Household Size | Family Households | Nonfamily Households |
| 1-Person Households | - | 1,250 (42.8%) |
| 2-Person Households | 571 (19.6%) | 56 (1.9%) |
| 3-Person Households | 456 (15.6%) | 0 (0.0%) |
| 4-Person Households | 167 (5.7%) | 32 (1.1%) |
| 5-Person Households | 191 (6.6%) | 0 (0.0%) |
| 6-Person Households | 122 (4.2%) | 0 (0.0%) |
| 7+ Person Households | 72 (2.5%) | 0 (0.0%) |
| Total | 1,579 (54.1%) | 1,338 (45.9%) |
Female Fertility in St Martin
Fertility by Age in St Martin
Average fertility rate in St Martin is 52.0 births per 1,000 women. Women in the age bracket of 20 to 34 years have the highest fertility rate with 117.0 births per 1,000 women. Women in the age bracket of 20 to 34 years acount for 84.2% of all women with births.
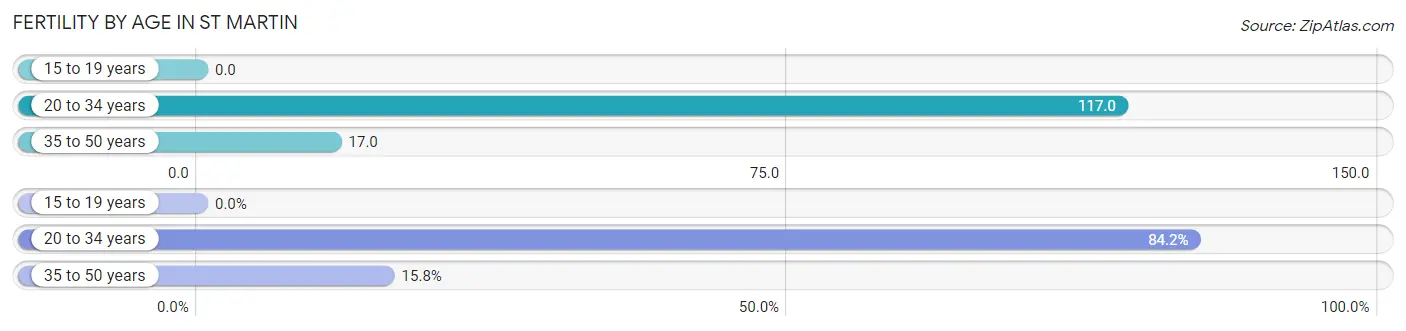
| Age Bracket | Women with Births | Births / 1,000 Women |
| 15 to 19 years | 0 (0.0%) | 0.0 |
| 20 to 34 years | 101 (84.2%) | 117.0 |
| 35 to 50 years | 19 (15.8%) | 17.0 |
| Total | 120 (100.0%) | 52.0 |
Fertility by Age by Marriage Status in St Martin
55.0% of women with births (120) in St Martin are married. The highest percentage of unmarried women with births falls into 20 to 34 years age bracket with 53.5% of them unmarried at the time of birth, while the lowest percentage of unmarried women with births belong to 35 to 50 years age bracket with 0.0% of them unmarried.
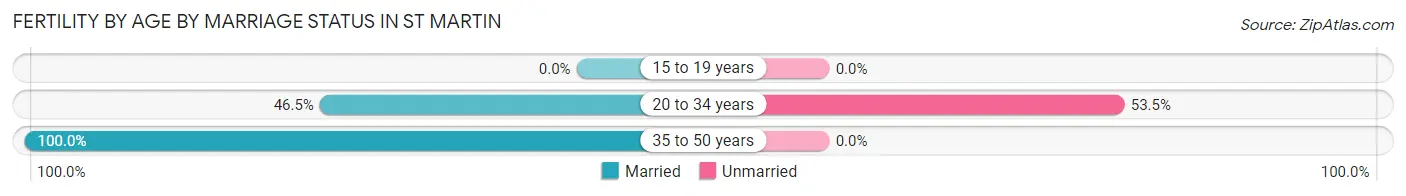
| Age Bracket | Married | Unmarried |
| 15 to 19 years | 0 (0.0%) | 0 (0.0%) |
| 20 to 34 years | 47 (46.5%) | 54 (53.5%) |
| 35 to 50 years | 19 (100.0%) | 0 (0.0%) |
| Total | 66 (55.0%) | 54 (45.0%) |
Fertility by Education in St Martin
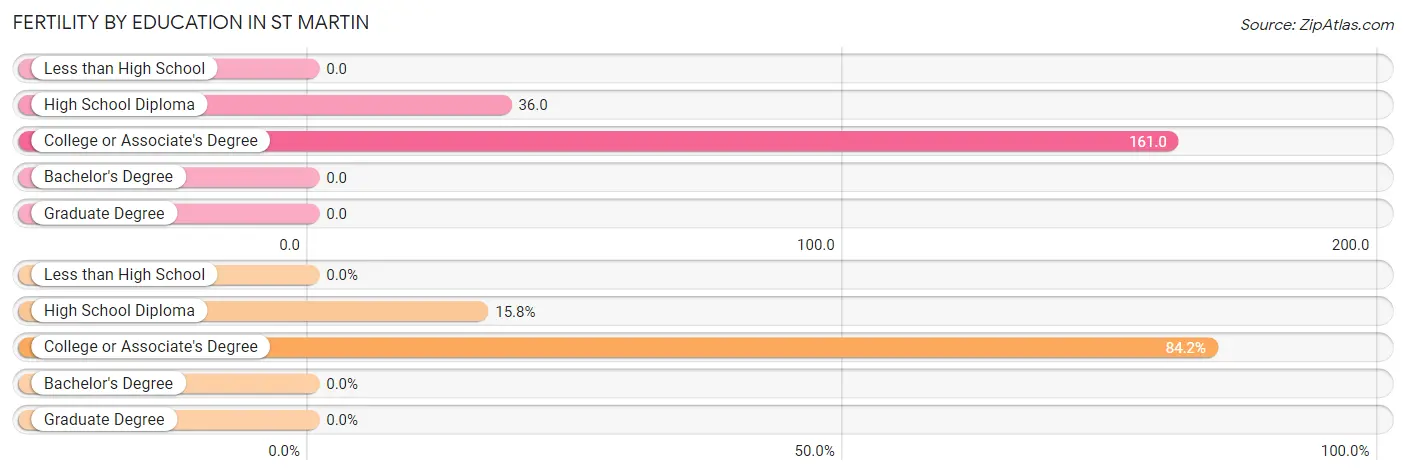
| Educational Attainment | Women with Births | Births / 1,000 Women |
| Less than High School | 0 (0.0%) | 0.0 |
| High School Diploma | 19 (15.8%) | 36.0 |
| College or Associate's Degree | 101 (84.2%) | 161.0 |
| Bachelor's Degree | 0 (0.0%) | 0.0 |
| Graduate Degree | 0 (0.0%) | 0.0 |
| Total | 120 (100.0%) | 52.0 |
Fertility by Education by Marriage Status in St Martin
45.0% of women with births in St Martin are unmarried. Women with the educational attainment of high school diploma are most likely to be married with 100.0% of them married at childbirth, while women with the educational attainment of college or associate's degree are least likely to be married with 53.5% of them unmarried at childbirth.
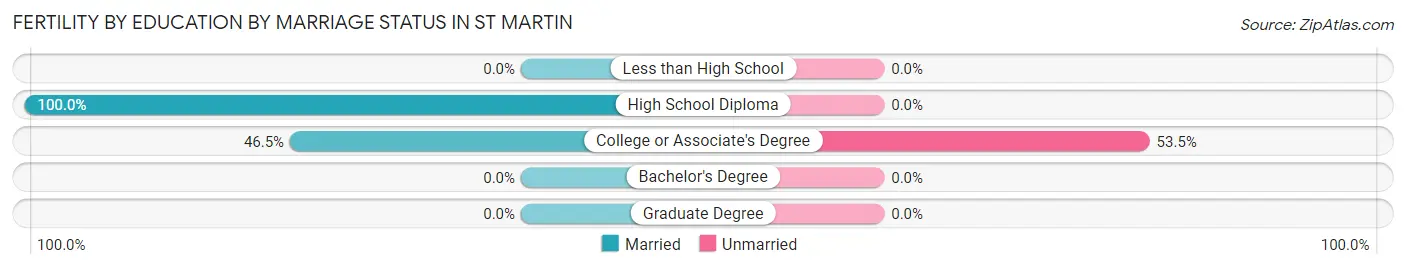
| Educational Attainment | Married | Unmarried |
| Less than High School | 0 (0.0%) | 0 (0.0%) |
| High School Diploma | 19 (100.0%) | 0 (0.0%) |
| College or Associate's Degree | 47 (46.5%) | 54 (53.5%) |
| Bachelor's Degree | 0 (0.0%) | 0 (0.0%) |
| Graduate Degree | 0 (0.0%) | 0 (0.0%) |
| Total | 66 (55.0%) | 54 (45.0%) |
Employment Characteristics in St Martin
Employment by Class of Employer in St Martin
Among the 3,436 employed individuals in St Martin, private company employees (2,353 | 68.5%), federal government employees (348 | 10.1%), and local government employees (276 | 8.0%) make up the most common classes of employment.
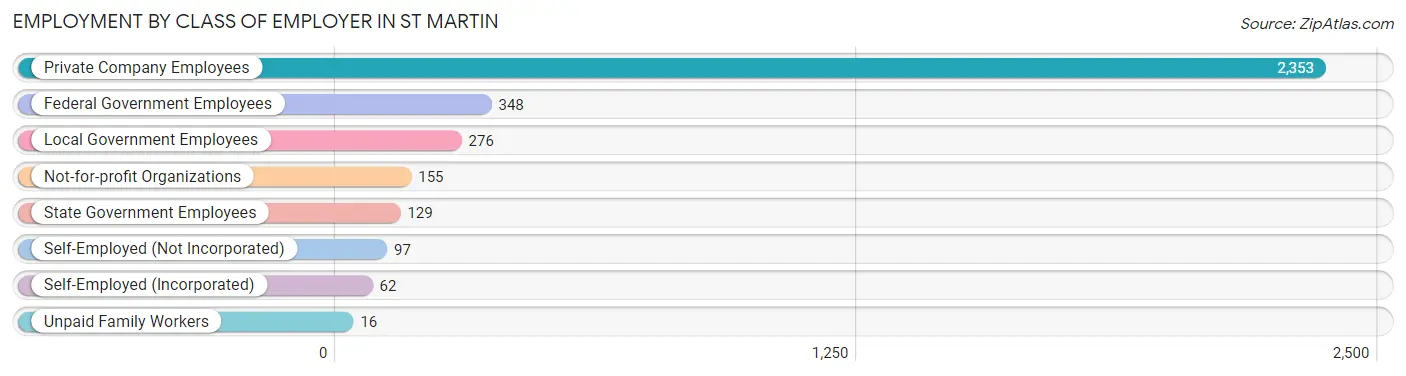
| Employer Class | # Employees | % Employees |
| Private Company Employees | 2,353 | 68.5% |
| Self-Employed (Incorporated) | 62 | 1.8% |
| Self-Employed (Not Incorporated) | 97 | 2.8% |
| Not-for-profit Organizations | 155 | 4.5% |
| Local Government Employees | 276 | 8.0% |
| State Government Employees | 129 | 3.7% |
| Federal Government Employees | 348 | 10.1% |
| Unpaid Family Workers | 16 | 0.5% |
| Total | 3,436 | 100.0% |
Employment Status by Age in St Martin
According to the labor force statistics for St Martin, out of the total population over 16 years of age (6,443), 56.4% or 3,634 individuals are in the labor force, with 5.6% or 204 of them unemployed. The age group with the highest labor force participation rate is 30 to 34 years, with 97.4% or 411 individuals in the labor force. Within the labor force, the 16 to 19 years age range has the highest percentage of unemployed individuals, with 29.9% or 123 of them being unemployed.
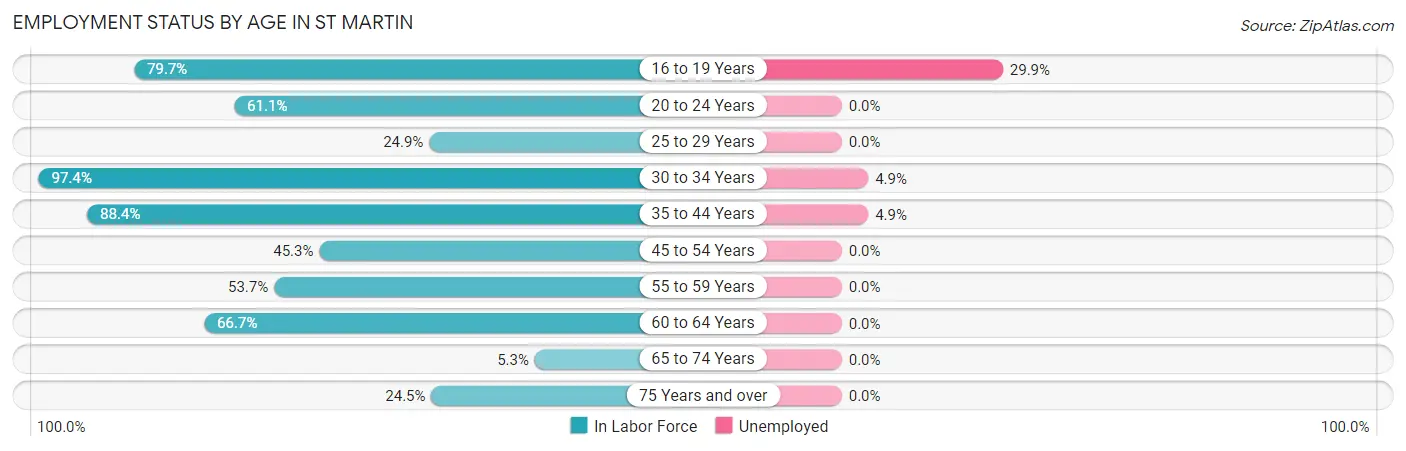
| Age Bracket | In Labor Force | Unemployed |
| 16 to 19 Years | 412 (79.7%) | 123 (29.9%) |
| 20 to 24 Years | 217 (61.1%) | 0 (0.0%) |
| 25 to 29 Years | 186 (24.9%) | 0 (0.0%) |
| 30 to 34 Years | 411 (97.4%) | 20 (4.9%) |
| 35 to 44 Years | 1,094 (88.4%) | 54 (4.9%) |
| 45 to 54 Years | 425 (45.3%) | 0 (0.0%) |
| 55 to 59 Years | 460 (53.7%) | 0 (0.0%) |
| 60 to 64 Years | 277 (66.7%) | 0 (0.0%) |
| 65 to 74 Years | 23 (5.3%) | 0 (0.0%) |
| 75 Years and over | 127 (24.5%) | 0 (0.0%) |
| Total | 3,634 (56.4%) | 204 (5.6%) |
Employment Status by Educational Attainment in St Martin
According to labor force statistics for St Martin, 61.8% of individuals (2,853) out of the total population between 25 and 64 years of age (4,616) are in the labor force, with 2.6% or 74 of them being unemployed. The group with the highest labor force participation rate are those with the educational attainment of bachelor's degree or higher, with 90.3% or 514 individuals in the labor force. Within the labor force, individuals with high school diploma education have the highest percentage of unemployment, with 3.4% or 29 of them being unemployed.
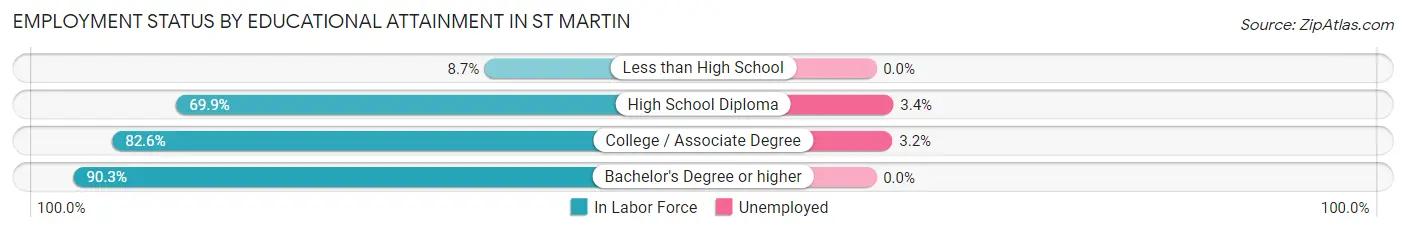
| Educational Attainment | In Labor Force | Unemployed |
| Less than High School | 100 (8.7%) | 0 (0.0%) |
| High School Diploma | 857 (69.9%) | 42 (3.4%) |
| College / Associate Degree | 1,380 (82.6%) | 53 (3.2%) |
| Bachelor's Degree or higher | 514 (90.3%) | 0 (0.0%) |
| Total | 2,853 (61.8%) | 120 (2.6%) |
Employment Occupations by Sex in St Martin
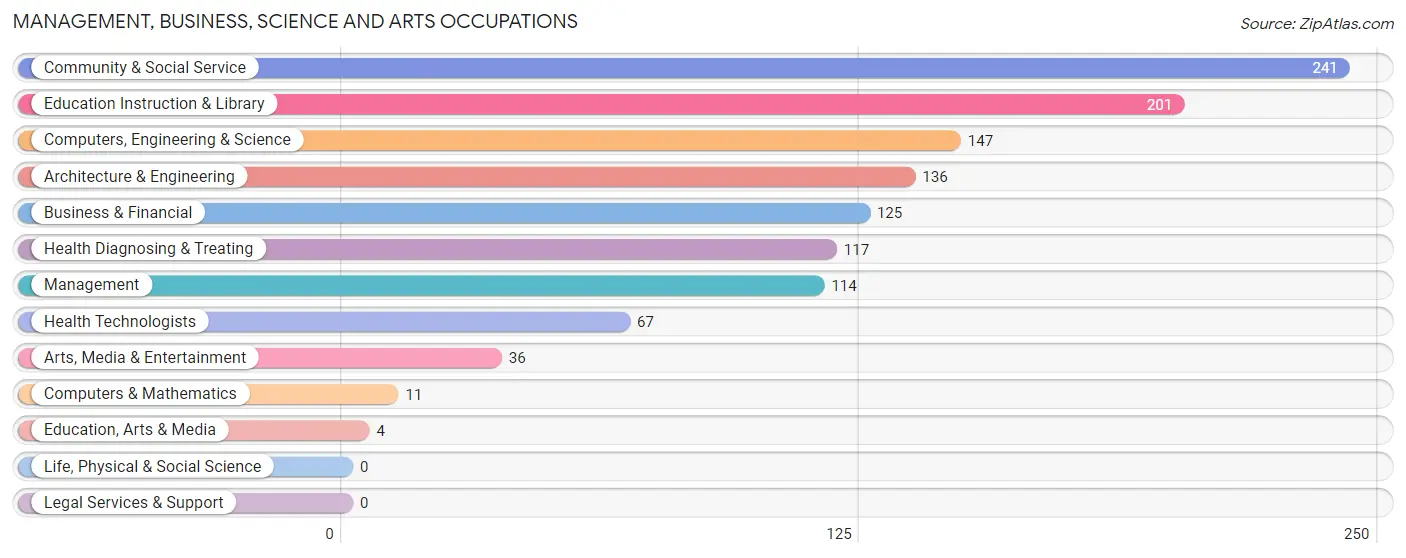
Management, Business, Science and Arts Occupations
The most common Management, Business, Science and Arts occupations in St Martin are Community & Social Service (241 | 7.3%), Education Instruction & Library (201 | 6.1%), Computers, Engineering & Science (147 | 4.4%), Architecture & Engineering (136 | 4.1%), and Business & Financial (125 | 3.8%).
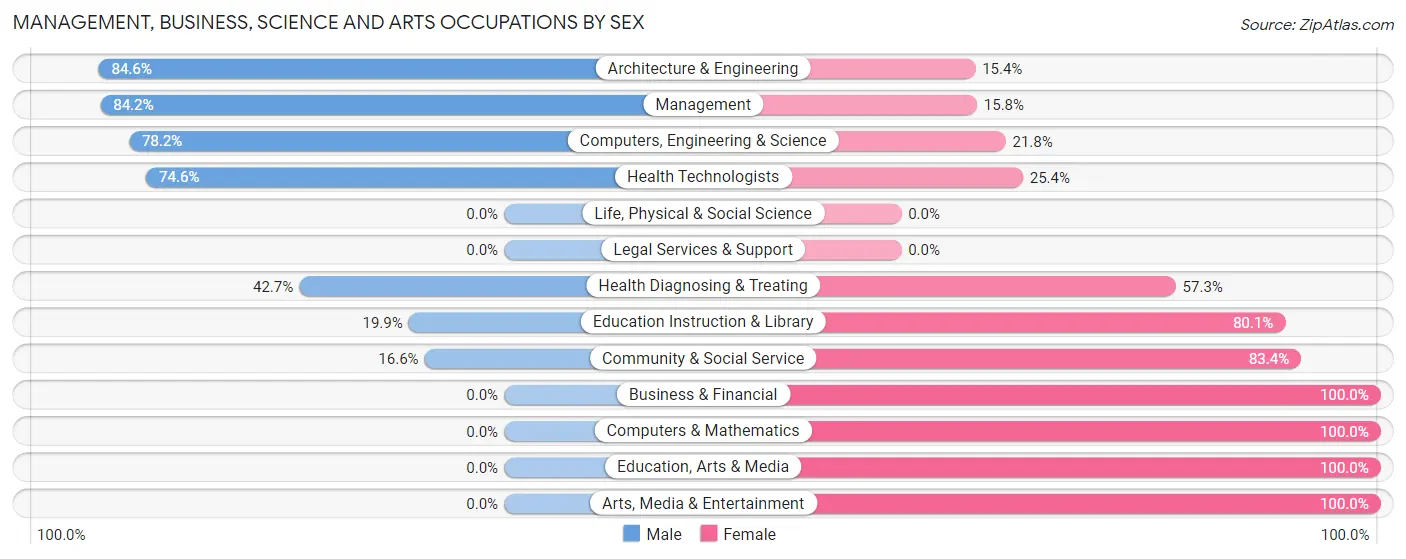
Management, Business, Science and Arts Occupations by Sex
Within the Management, Business, Science and Arts occupations in St Martin, the most male-oriented occupations are Architecture & Engineering (84.6%), Management (84.2%), and Computers, Engineering & Science (78.2%), while the most female-oriented occupations are Business & Financial (100.0%), Computers & Mathematics (100.0%), and Education, Arts & Media (100.0%).
| Occupation | Male | Female |
| Management | 96 (84.2%) | 18 (15.8%) |
| Business & Financial | 0 (0.0%) | 125 (100.0%) |
| Computers, Engineering & Science | 115 (78.2%) | 32 (21.8%) |
| Computers & Mathematics | 0 (0.0%) | 11 (100.0%) |
| Architecture & Engineering | 115 (84.6%) | 21 (15.4%) |
| Life, Physical & Social Science | 0 (0.0%) | 0 (0.0%) |
| Community & Social Service | 40 (16.6%) | 201 (83.4%) |
| Education, Arts & Media | 0 (0.0%) | 4 (100.0%) |
| Legal Services & Support | 0 (0.0%) | 0 (0.0%) |
| Education Instruction & Library | 40 (19.9%) | 161 (80.1%) |
| Arts, Media & Entertainment | 0 (0.0%) | 36 (100.0%) |
| Health Diagnosing & Treating | 50 (42.7%) | 67 (57.3%) |
| Health Technologists | 50 (74.6%) | 17 (25.4%) |
| Total (Category) | 301 (40.5%) | 443 (59.5%) |
| Total (Overall) | 1,751 (53.0%) | 1,552 (47.0%) |
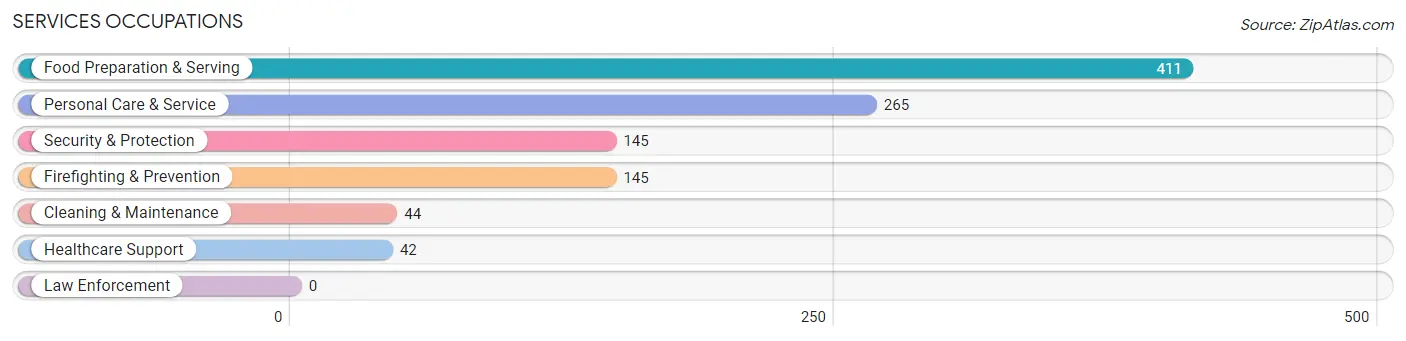
Services Occupations
The most common Services occupations in St Martin are Food Preparation & Serving (411 | 12.4%), Personal Care & Service (265 | 8.0%), Security & Protection (145 | 4.4%), Firefighting & Prevention (145 | 4.4%), and Cleaning & Maintenance (44 | 1.3%).
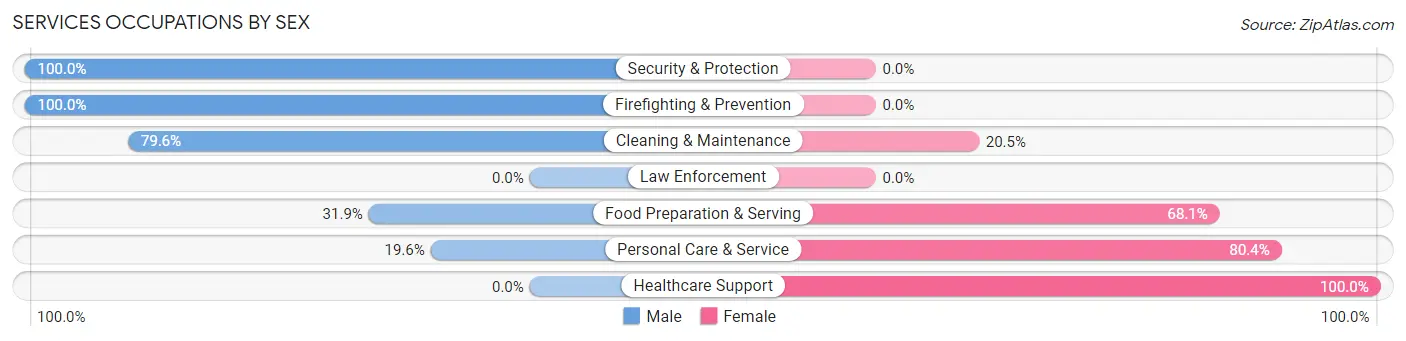
Services Occupations by Sex
Within the Services occupations in St Martin, the most male-oriented occupations are Security & Protection (100.0%), Firefighting & Prevention (100.0%), and Cleaning & Maintenance (79.5%), while the most female-oriented occupations are Healthcare Support (100.0%), Personal Care & Service (80.4%), and Food Preparation & Serving (68.1%).
| Occupation | Male | Female |
| Healthcare Support | 0 (0.0%) | 42 (100.0%) |
| Security & Protection | 145 (100.0%) | 0 (0.0%) |
| Firefighting & Prevention | 145 (100.0%) | 0 (0.0%) |
| Law Enforcement | 0 (0.0%) | 0 (0.0%) |
| Food Preparation & Serving | 131 (31.9%) | 280 (68.1%) |
| Cleaning & Maintenance | 35 (79.5%) | 9 (20.4%) |
| Personal Care & Service | 52 (19.6%) | 213 (80.4%) |
| Total (Category) | 363 (40.0%) | 544 (60.0%) |
| Total (Overall) | 1,751 (53.0%) | 1,552 (47.0%) |
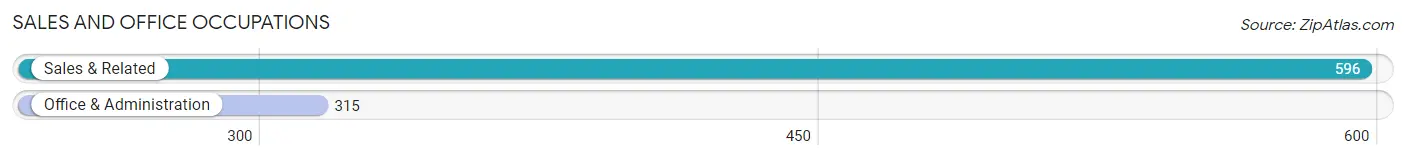
Sales and Office Occupations
The most common Sales and Office occupations in St Martin are Sales & Related (596 | 18.0%), and Office & Administration (315 | 9.5%).
Sales and Office Occupations by Sex
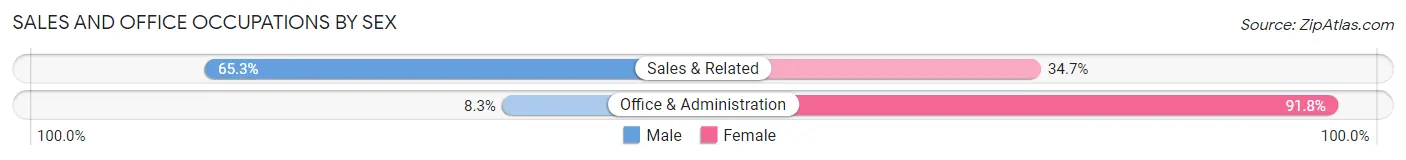
| Occupation | Male | Female |
| Sales & Related | 389 (65.3%) | 207 (34.7%) |
| Office & Administration | 26 (8.3%) | 289 (91.7%) |
| Total (Category) | 415 (45.6%) | 496 (54.4%) |
| Total (Overall) | 1,751 (53.0%) | 1,552 (47.0%) |
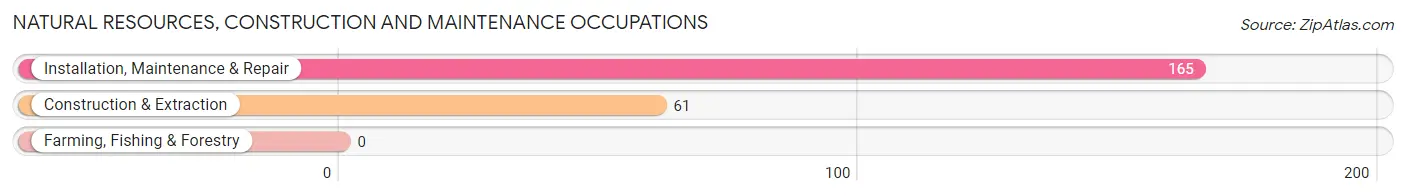
Natural Resources, Construction and Maintenance Occupations
The most common Natural Resources, Construction and Maintenance occupations in St Martin are Installation, Maintenance & Repair (165 | 5.0%), and Construction & Extraction (61 | 1.8%).
Natural Resources, Construction and Maintenance Occupations by Sex
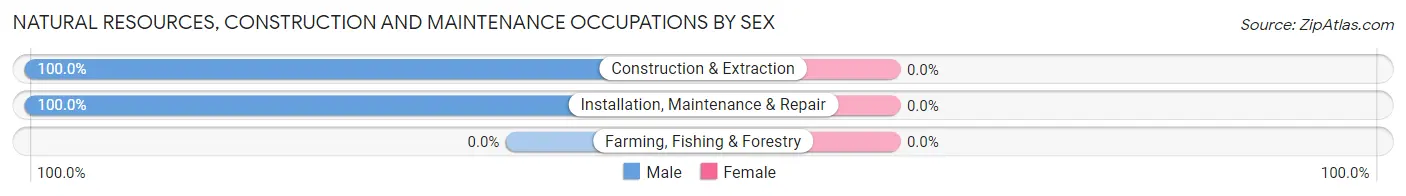
| Occupation | Male | Female |
| Farming, Fishing & Forestry | 0 (0.0%) | 0 (0.0%) |
| Construction & Extraction | 61 (100.0%) | 0 (0.0%) |
| Installation, Maintenance & Repair | 165 (100.0%) | 0 (0.0%) |
| Total (Category) | 226 (100.0%) | 0 (0.0%) |
| Total (Overall) | 1,751 (53.0%) | 1,552 (47.0%) |
Production, Transportation and Moving Occupations
The most common Production, Transportation and Moving occupations in St Martin are Material Moving (191 | 5.8%), Production (164 | 5.0%), and Transportation (160 | 4.8%).
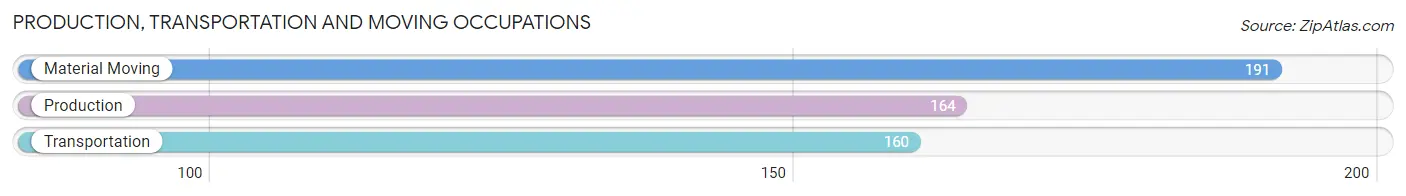
Production, Transportation and Moving Occupations by Sex
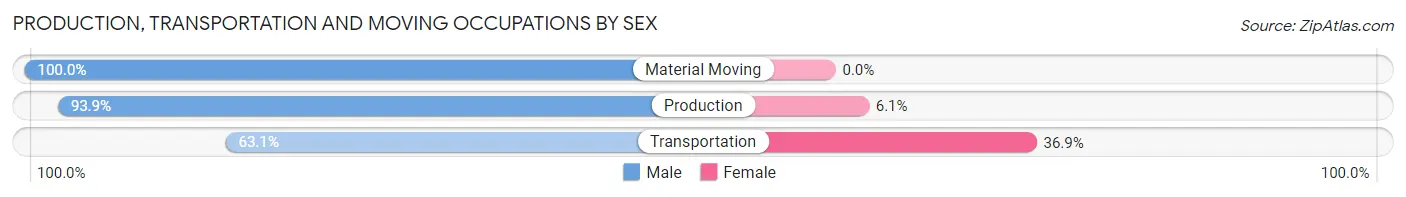
| Occupation | Male | Female |
| Production | 154 (93.9%) | 10 (6.1%) |
| Transportation | 101 (63.1%) | 59 (36.9%) |
| Material Moving | 191 (100.0%) | 0 (0.0%) |
| Total (Category) | 446 (86.6%) | 69 (13.4%) |
| Total (Overall) | 1,751 (53.0%) | 1,552 (47.0%) |
Employment Industries by Sex in St Martin
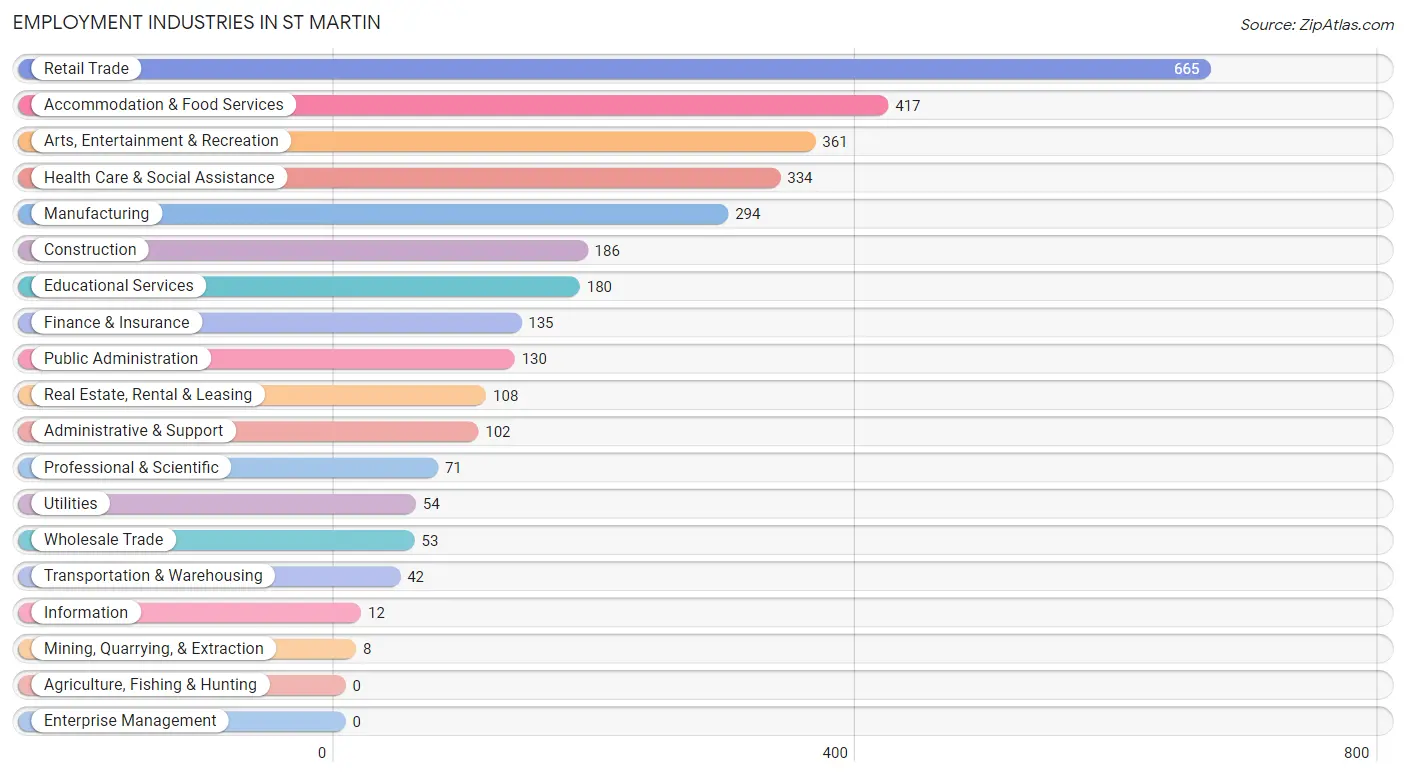
Employment Industries in St Martin
The major employment industries in St Martin include Retail Trade (665 | 20.1%), Accommodation & Food Services (417 | 12.6%), Arts, Entertainment & Recreation (361 | 10.9%), Health Care & Social Assistance (334 | 10.1%), and Manufacturing (294 | 8.9%).
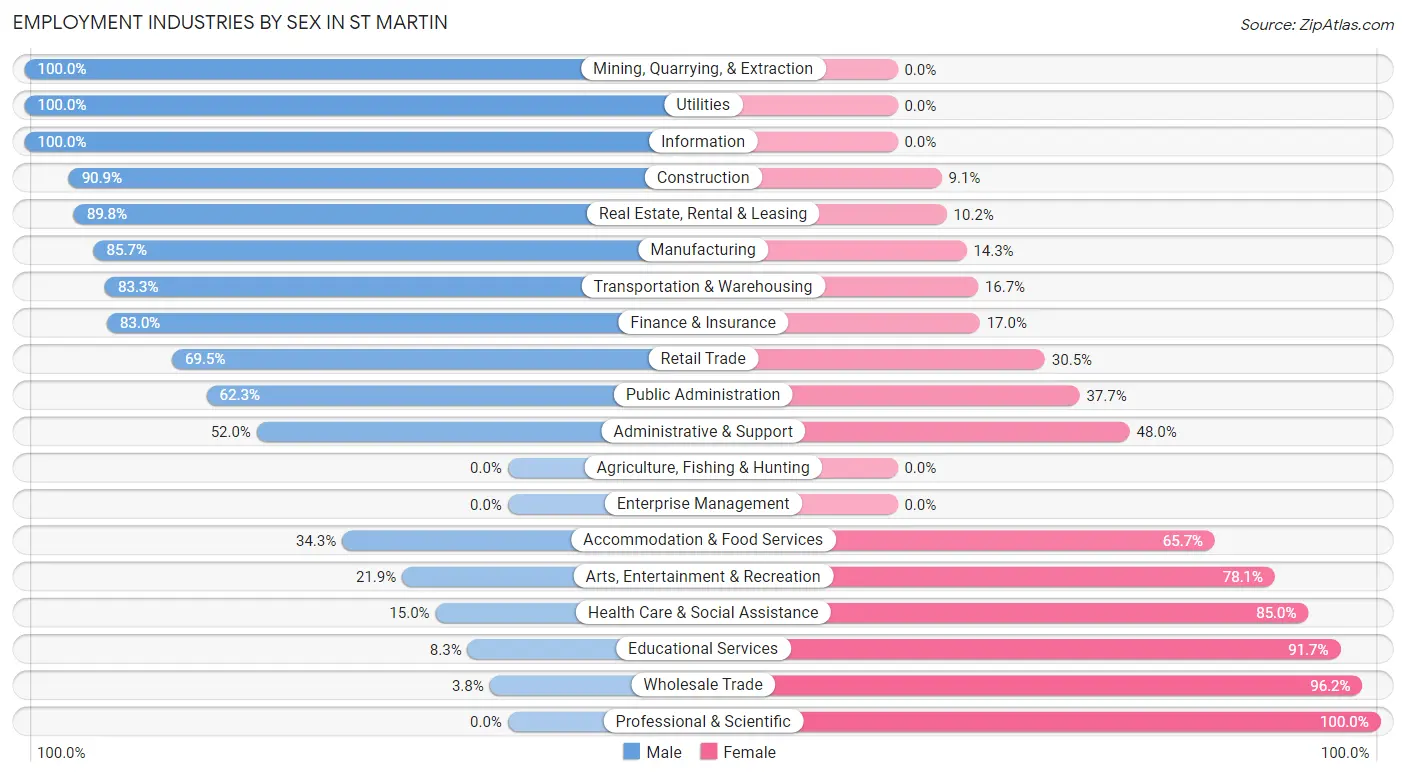
Employment Industries by Sex in St Martin
The St Martin industries that see more men than women are Mining, Quarrying, & Extraction (100.0%), Utilities (100.0%), and Information (100.0%), whereas the industries that tend to have a higher number of women are Professional & Scientific (100.0%), Wholesale Trade (96.2%), and Educational Services (91.7%).
| Industry | Male | Female |
| Agriculture, Fishing & Hunting | 0 (0.0%) | 0 (0.0%) |
| Mining, Quarrying, & Extraction | 8 (100.0%) | 0 (0.0%) |
| Construction | 169 (90.9%) | 17 (9.1%) |
| Manufacturing | 252 (85.7%) | 42 (14.3%) |
| Wholesale Trade | 2 (3.8%) | 51 (96.2%) |
| Retail Trade | 462 (69.5%) | 203 (30.5%) |
| Transportation & Warehousing | 35 (83.3%) | 7 (16.7%) |
| Utilities | 54 (100.0%) | 0 (0.0%) |
| Information | 12 (100.0%) | 0 (0.0%) |
| Finance & Insurance | 112 (83.0%) | 23 (17.0%) |
| Real Estate, Rental & Leasing | 97 (89.8%) | 11 (10.2%) |
| Professional & Scientific | 0 (0.0%) | 71 (100.0%) |
| Enterprise Management | 0 (0.0%) | 0 (0.0%) |
| Administrative & Support | 53 (52.0%) | 49 (48.0%) |
| Educational Services | 15 (8.3%) | 165 (91.7%) |
| Health Care & Social Assistance | 50 (15.0%) | 284 (85.0%) |
| Arts, Entertainment & Recreation | 79 (21.9%) | 282 (78.1%) |
| Accommodation & Food Services | 143 (34.3%) | 274 (65.7%) |
| Public Administration | 81 (62.3%) | 49 (37.7%) |
| Total | 1,751 (53.0%) | 1,552 (47.0%) |
Education in St Martin
School Enrollment in St Martin
The most common levels of schooling among the 1,627 students in St Martin are middle school (490 | 30.1%), high school (429 | 26.4%), and elementary school (290 | 17.8%).
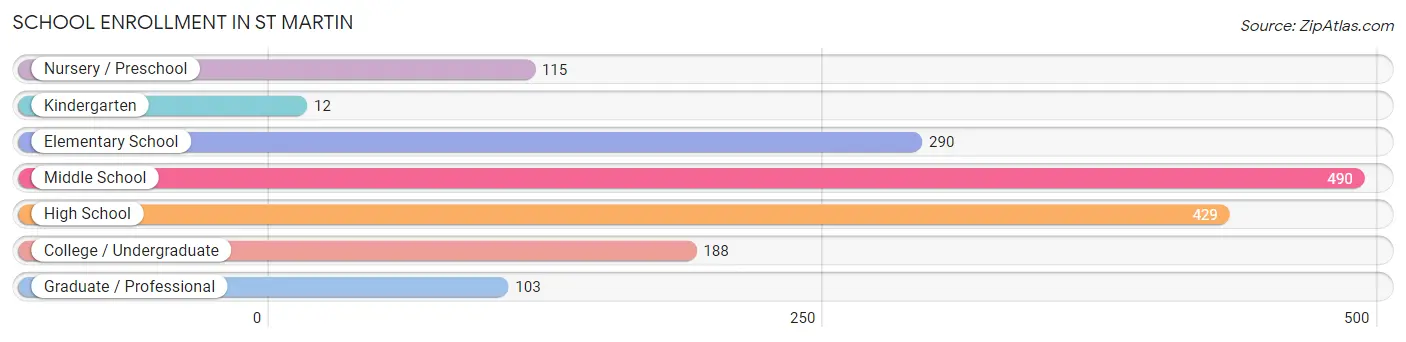
| School Level | # Students | % Students |
| Nursery / Preschool | 115 | 7.1% |
| Kindergarten | 12 | 0.7% |
| Elementary School | 290 | 17.8% |
| Middle School | 490 | 30.1% |
| High School | 429 | 26.4% |
| College / Undergraduate | 188 | 11.6% |
| Graduate / Professional | 103 | 6.3% |
| Total | 1,627 | 100.0% |
School Enrollment by Age by Funding Source in St Martin
Out of a total of 1,627 students who are enrolled in schools in St Martin, 273 (16.8%) attend a private institution, while the remaining 1,354 (83.2%) are enrolled in public schools. The age group of 5 to 9 year old has the highest likelihood of being enrolled in private schools, with 116 (45.7% in the age bracket) enrolled. Conversely, the age group of 3 to 4 year olds has the lowest likelihood of being enrolled in a private school, with 87 (100.0% in the age bracket) attending a public institution.
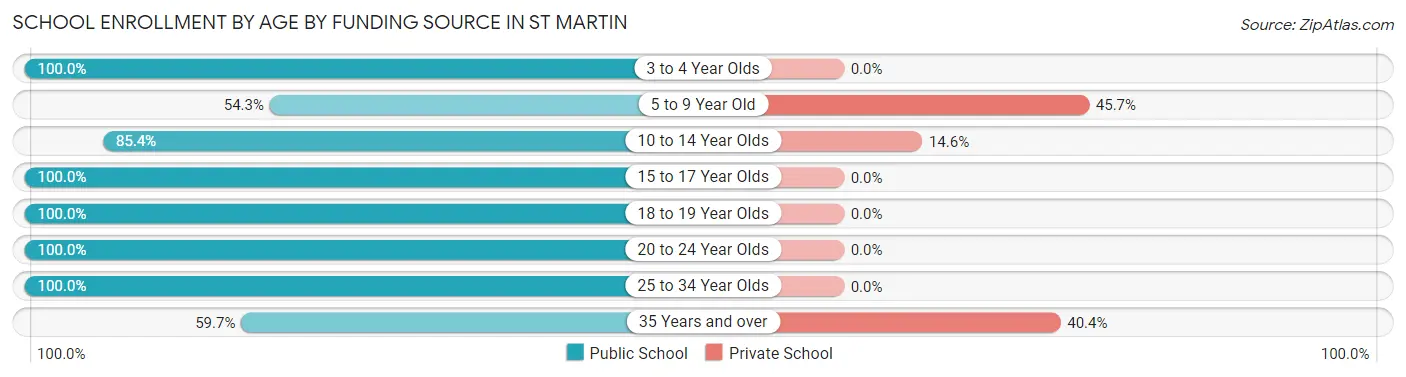
| Age Bracket | Public School | Private School |
| 3 to 4 Year Olds | 87 (100.0%) | 0 (0.0%) |
| 5 to 9 Year Old | 138 (54.3%) | 116 (45.7%) |
| 10 to 14 Year Olds | 521 (85.4%) | 89 (14.6%) |
| 15 to 17 Year Olds | 370 (100.0%) | 0 (0.0%) |
| 18 to 19 Year Olds | 7 (100.0%) | 0 (0.0%) |
| 20 to 24 Year Olds | 76 (100.0%) | 0 (0.0%) |
| 25 to 34 Year Olds | 52 (100.0%) | 0 (0.0%) |
| 35 Years and over | 102 (59.7%) | 69 (40.4%) |
| Total | 1,354 (83.2%) | 273 (16.8%) |
Educational Attainment by Field of Study in St Martin
Science & technology (195 | 22.7%), education (195 | 22.7%), business (160 | 18.6%), arts & humanities (92 | 10.7%), and visual & performing arts (79 | 9.2%) are the most common fields of study among 860 individuals in St Martin who have obtained a bachelor's degree or higher.
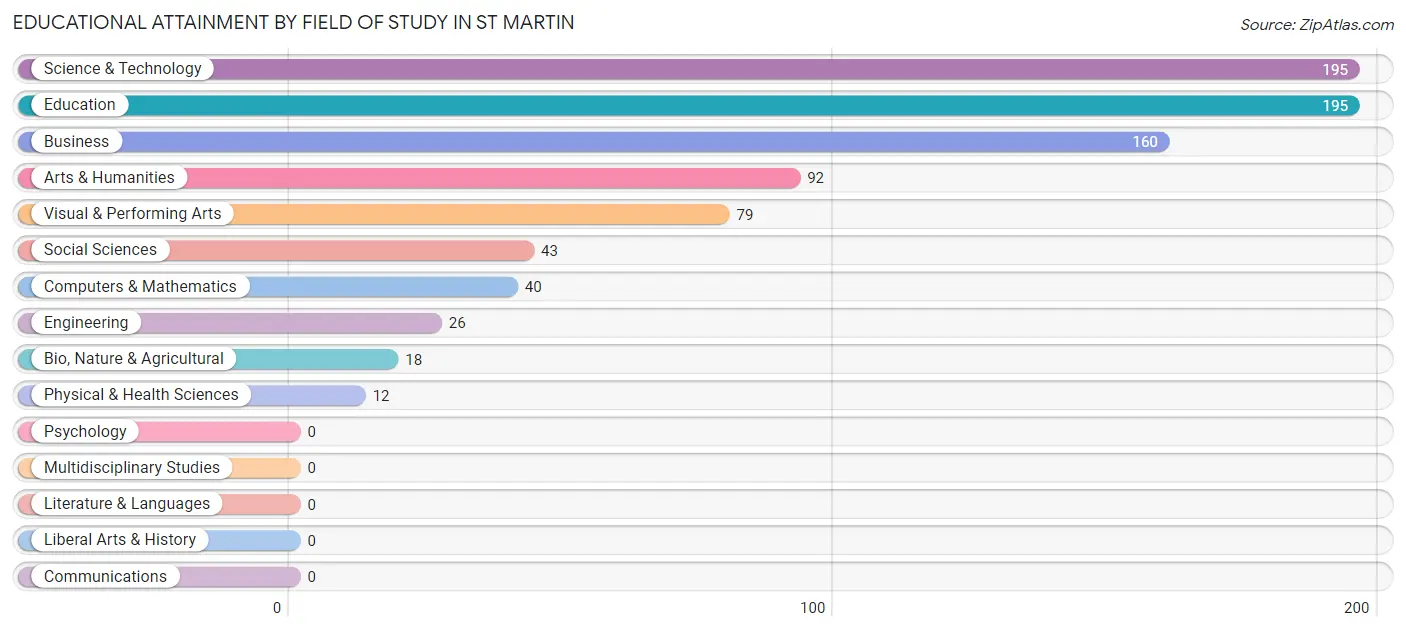
| Field of Study | # Graduates | % Graduates |
| Computers & Mathematics | 40 | 4.6% |
| Bio, Nature & Agricultural | 18 | 2.1% |
| Physical & Health Sciences | 12 | 1.4% |
| Psychology | 0 | 0.0% |
| Social Sciences | 43 | 5.0% |
| Engineering | 26 | 3.0% |
| Multidisciplinary Studies | 0 | 0.0% |
| Science & Technology | 195 | 22.7% |
| Business | 160 | 18.6% |
| Education | 195 | 22.7% |
| Literature & Languages | 0 | 0.0% |
| Liberal Arts & History | 0 | 0.0% |
| Visual & Performing Arts | 79 | 9.2% |
| Communications | 0 | 0.0% |
| Arts & Humanities | 92 | 10.7% |
| Total | 860 | 100.0% |
Transportation & Commute in St Martin
Vehicle Availability by Sex in St Martin
The most prevalent vehicle ownership categories in St Martin are males with 3 vehicles (671, accounting for 35.6%) and females with 3 vehicles (484, making up 43.2%).
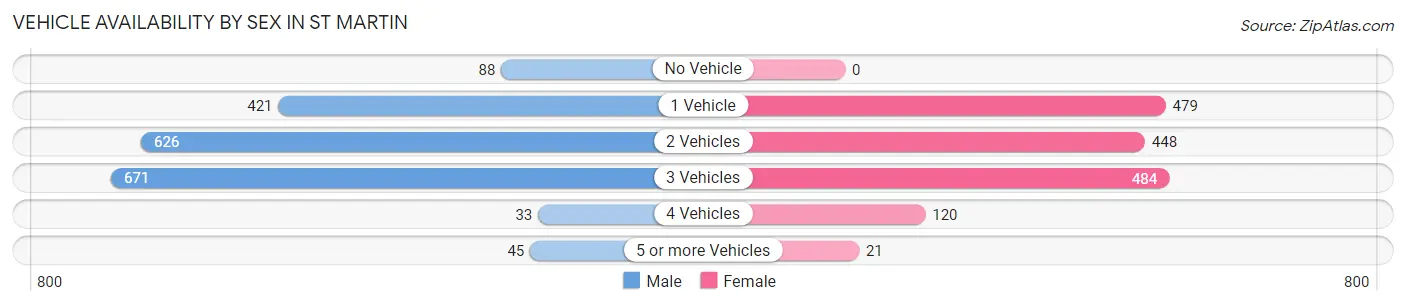
| Vehicles Available | Male | Female |
| No Vehicle | 88 (4.7%) | 0 (0.0%) |
| 1 Vehicle | 421 (22.4%) | 479 (30.9%) |
| 2 Vehicles | 626 (33.2%) | 448 (28.9%) |
| 3 Vehicles | 671 (35.6%) | 484 (31.2%) |
| 4 Vehicles | 33 (1.8%) | 120 (7.7%) |
| 5 or more Vehicles | 45 (2.4%) | 21 (1.3%) |
| Total | 1,884 (100.0%) | 1,552 (100.0%) |
Commute Time in St Martin
The most frequently occuring commute durations in St Martin are 20 to 24 minutes (768 commuters, 22.8%), 15 to 19 minutes (724 commuters, 21.5%), and 10 to 14 minutes (654 commuters, 19.4%).
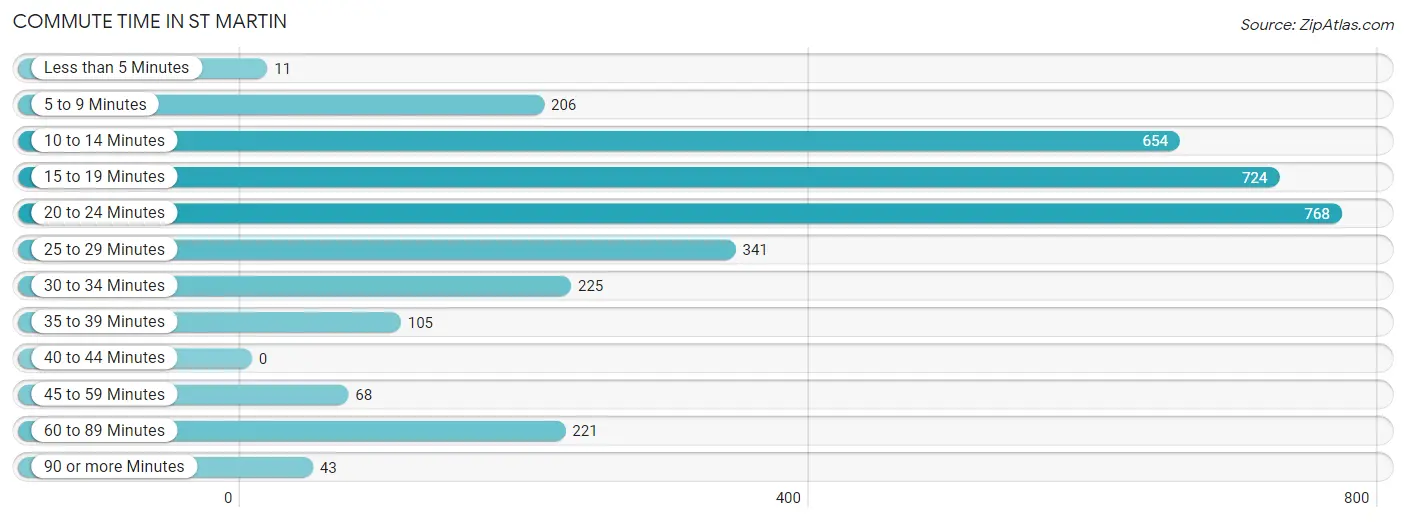
| Commute Time | # Commuters | % Commuters |
| Less than 5 Minutes | 11 | 0.3% |
| 5 to 9 Minutes | 206 | 6.1% |
| 10 to 14 Minutes | 654 | 19.4% |
| 15 to 19 Minutes | 724 | 21.5% |
| 20 to 24 Minutes | 768 | 22.8% |
| 25 to 29 Minutes | 341 | 10.1% |
| 30 to 34 Minutes | 225 | 6.7% |
| 35 to 39 Minutes | 105 | 3.1% |
| 40 to 44 Minutes | 0 | 0.0% |
| 45 to 59 Minutes | 68 | 2.0% |
| 60 to 89 Minutes | 221 | 6.6% |
| 90 or more Minutes | 43 | 1.3% |
Commute Time by Sex in St Martin
The most common commute times in St Martin are 15 to 19 minutes (438 commuters, 23.8%) for males and 10 to 14 minutes (528 commuters, 34.6%) for females.
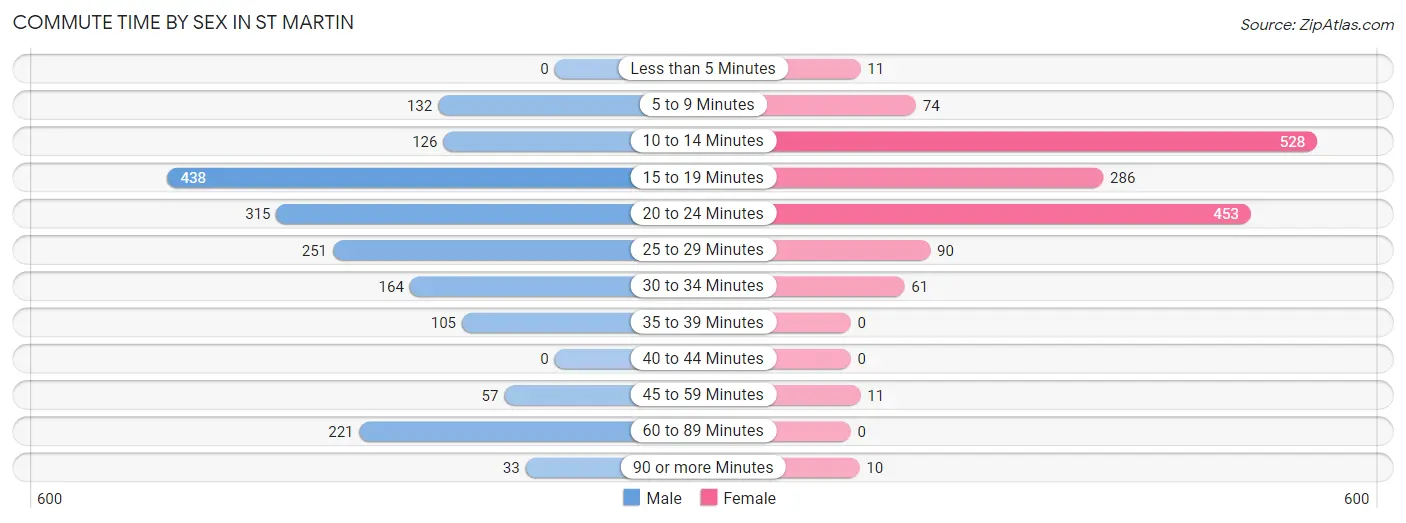
| Commute Time | Male | Female |
| Less than 5 Minutes | 0 (0.0%) | 11 (0.7%) |
| 5 to 9 Minutes | 132 (7.2%) | 74 (4.9%) |
| 10 to 14 Minutes | 126 (6.8%) | 528 (34.6%) |
| 15 to 19 Minutes | 438 (23.8%) | 286 (18.8%) |
| 20 to 24 Minutes | 315 (17.1%) | 453 (29.7%) |
| 25 to 29 Minutes | 251 (13.6%) | 90 (5.9%) |
| 30 to 34 Minutes | 164 (8.9%) | 61 (4.0%) |
| 35 to 39 Minutes | 105 (5.7%) | 0 (0.0%) |
| 40 to 44 Minutes | 0 (0.0%) | 0 (0.0%) |
| 45 to 59 Minutes | 57 (3.1%) | 11 (0.7%) |
| 60 to 89 Minutes | 221 (12.0%) | 0 (0.0%) |
| 90 or more Minutes | 33 (1.8%) | 10 (0.7%) |
Time of Departure to Work by Sex in St Martin
The most frequent times of departure to work in St Martin are 6:30 AM to 6:59 AM (384, 20.8%) for males and 6:00 AM to 6:29 AM (214, 14.0%) for females.
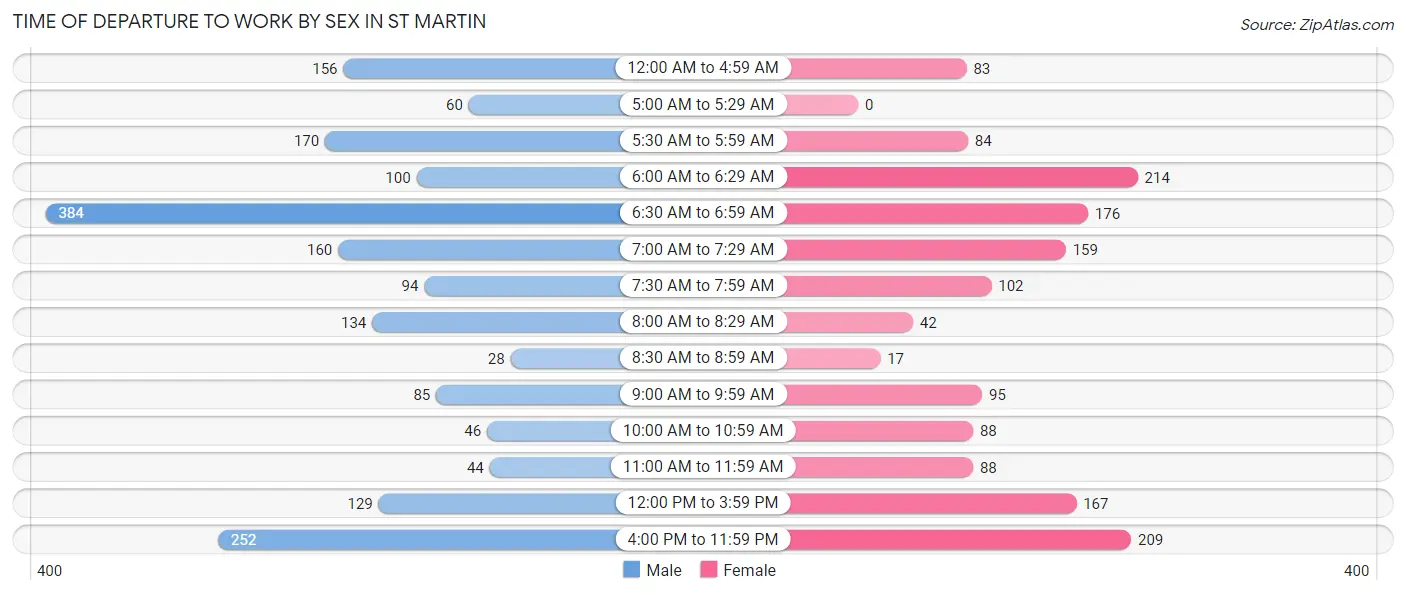
| Time of Departure | Male | Female |
| 12:00 AM to 4:59 AM | 156 (8.5%) | 83 (5.4%) |
| 5:00 AM to 5:29 AM | 60 (3.3%) | 0 (0.0%) |
| 5:30 AM to 5:59 AM | 170 (9.2%) | 84 (5.5%) |
| 6:00 AM to 6:29 AM | 100 (5.4%) | 214 (14.0%) |
| 6:30 AM to 6:59 AM | 384 (20.8%) | 176 (11.6%) |
| 7:00 AM to 7:29 AM | 160 (8.7%) | 159 (10.4%) |
| 7:30 AM to 7:59 AM | 94 (5.1%) | 102 (6.7%) |
| 8:00 AM to 8:29 AM | 134 (7.3%) | 42 (2.8%) |
| 8:30 AM to 8:59 AM | 28 (1.5%) | 17 (1.1%) |
| 9:00 AM to 9:59 AM | 85 (4.6%) | 95 (6.2%) |
| 10:00 AM to 10:59 AM | 46 (2.5%) | 88 (5.8%) |
| 11:00 AM to 11:59 AM | 44 (2.4%) | 88 (5.8%) |
| 12:00 PM to 3:59 PM | 129 (7.0%) | 167 (11.0%) |
| 4:00 PM to 11:59 PM | 252 (13.7%) | 209 (13.7%) |
| Total | 1,842 (100.0%) | 1,524 (100.0%) |
Housing Occupancy in St Martin
Occupancy by Ownership in St Martin
Of the total 2,917 dwellings in St Martin, owner-occupied units account for 1,533 (52.5%), while renter-occupied units make up 1,384 (47.4%).
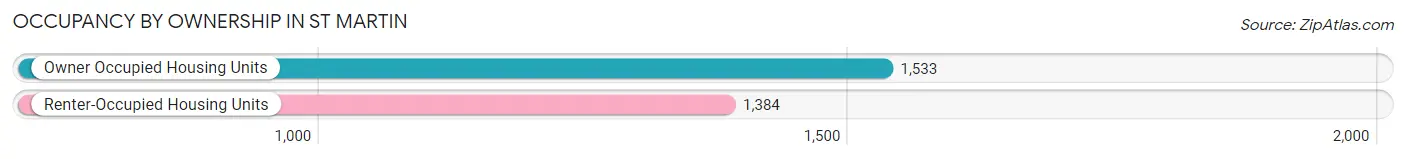
| Occupancy | # Housing Units | % Housing Units |
| Owner Occupied Housing Units | 1,533 | 52.5% |
| Renter-Occupied Housing Units | 1,384 | 47.4% |
| Total Occupied Housing Units | 2,917 | 100.0% |
Occupancy by Household Size in St Martin
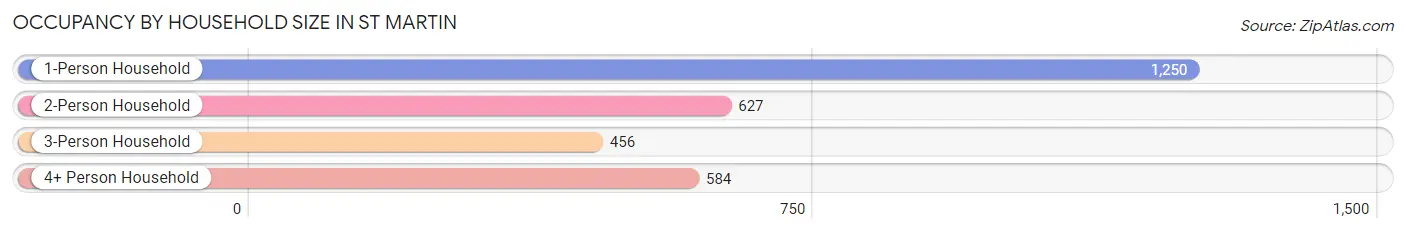
| Household Size | # Housing Units | % Housing Units |
| 1-Person Household | 1,250 | 42.8% |
| 2-Person Household | 627 | 21.5% |
| 3-Person Household | 456 | 15.6% |
| 4+ Person Household | 584 | 20.0% |
| Total Housing Units | 2,917 | 100.0% |
Occupancy by Ownership by Household Size in St Martin
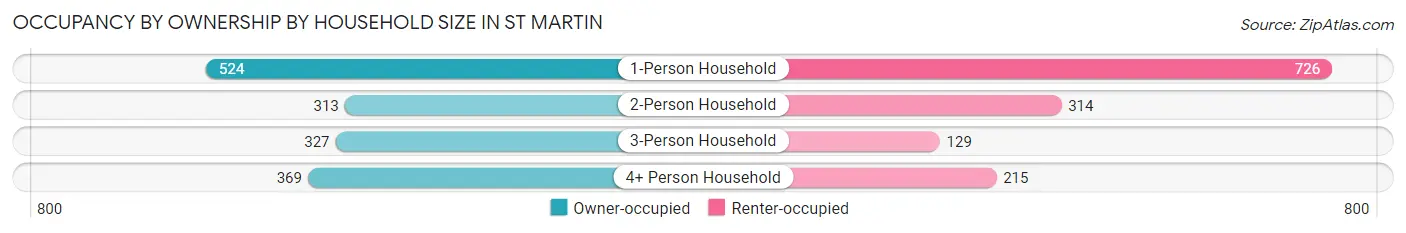
| Household Size | Owner-occupied | Renter-occupied |
| 1-Person Household | 524 (41.9%) | 726 (58.1%) |
| 2-Person Household | 313 (49.9%) | 314 (50.1%) |
| 3-Person Household | 327 (71.7%) | 129 (28.3%) |
| 4+ Person Household | 369 (63.2%) | 215 (36.8%) |
| Total Housing Units | 1,533 (52.5%) | 1,384 (47.4%) |
Occupancy by Educational Attainment in St Martin
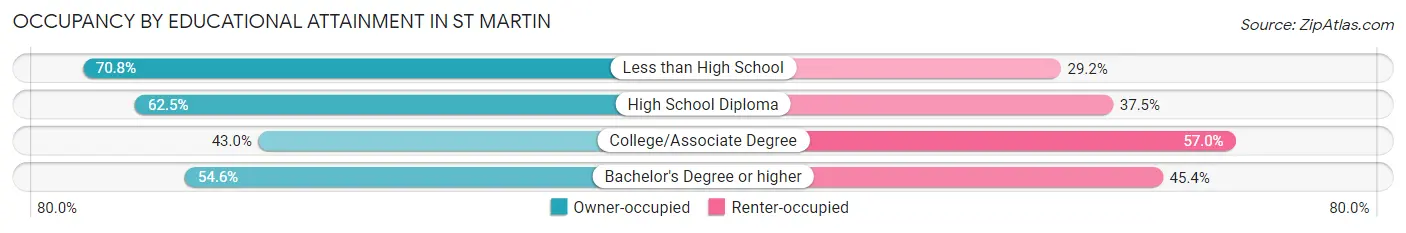
| Household Size | Owner-occupied | Renter-occupied |
| Less than High School | 167 (70.8%) | 69 (29.2%) |
| High School Diploma | 411 (62.5%) | 247 (37.5%) |
| College/Associate Degree | 555 (43.0%) | 735 (57.0%) |
| Bachelor's Degree or higher | 400 (54.6%) | 333 (45.4%) |
Occupancy by Age of Householder in St Martin
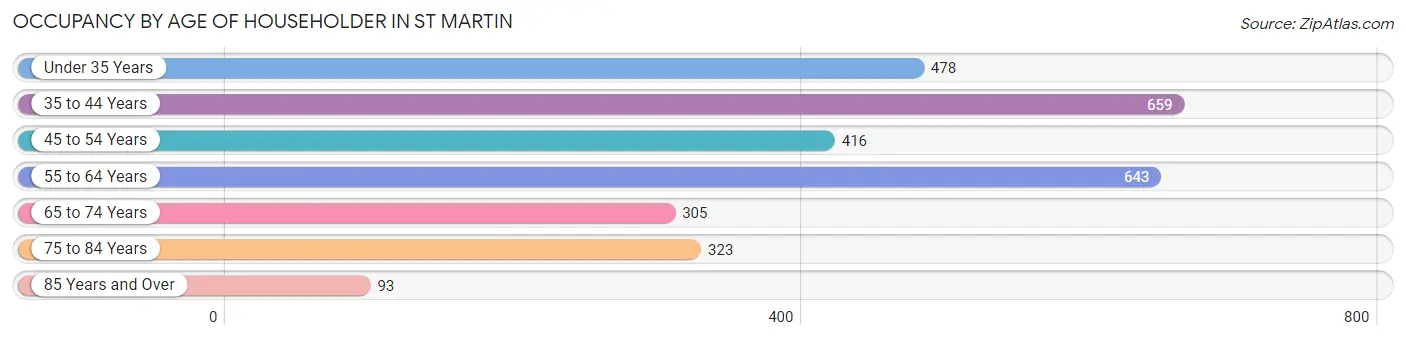
| Age Bracket | # Households | % Households |
| Under 35 Years | 478 | 16.4% |
| 35 to 44 Years | 659 | 22.6% |
| 45 to 54 Years | 416 | 14.3% |
| 55 to 64 Years | 643 | 22.0% |
| 65 to 74 Years | 305 | 10.5% |
| 75 to 84 Years | 323 | 11.1% |
| 85 Years and Over | 93 | 3.2% |
| Total | 2,917 | 100.0% |
Housing Finances in St Martin
Median Income by Occupancy in St Martin
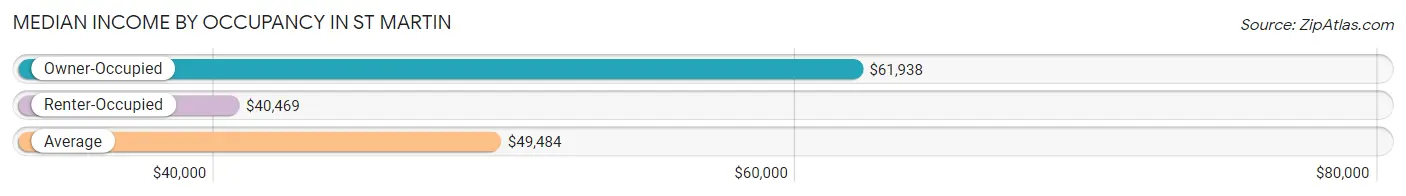
| Occupancy Type | # Households | Median Income |
| Owner-Occupied | 1,533 (52.5%) | $61,938 |
| Renter-Occupied | 1,384 (47.4%) | $40,469 |
| Average | 2,917 (100.0%) | $49,484 |
Occupancy by Householder Income Bracket in St Martin
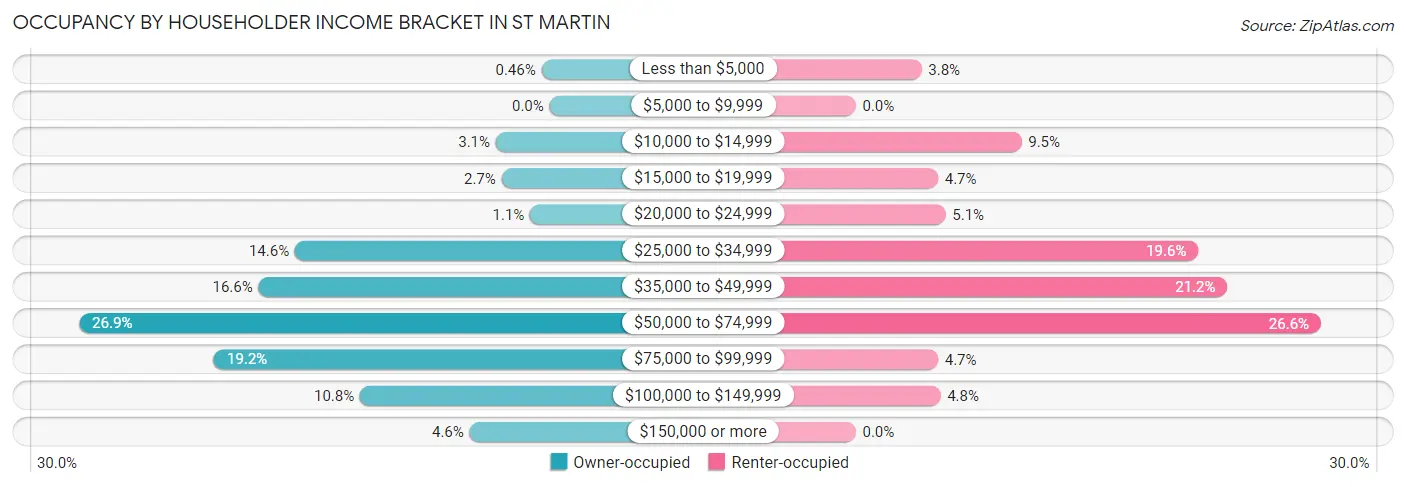
| Income Bracket | Owner-occupied | Renter-occupied |
| Less than $5,000 | 7 (0.5%) | 52 (3.8%) |
| $5,000 to $9,999 | 0 (0.0%) | 0 (0.0%) |
| $10,000 to $14,999 | 47 (3.1%) | 131 (9.5%) |
| $15,000 to $19,999 | 42 (2.7%) | 65 (4.7%) |
| $20,000 to $24,999 | 17 (1.1%) | 71 (5.1%) |
| $25,000 to $34,999 | 223 (14.5%) | 271 (19.6%) |
| $35,000 to $49,999 | 255 (16.6%) | 294 (21.2%) |
| $50,000 to $74,999 | 412 (26.9%) | 368 (26.6%) |
| $75,000 to $99,999 | 294 (19.2%) | 65 (4.7%) |
| $100,000 to $149,999 | 166 (10.8%) | 67 (4.8%) |
| $150,000 or more | 70 (4.6%) | 0 (0.0%) |
| Total | 1,533 (100.0%) | 1,384 (100.0%) |
Monthly Housing Cost Tiers in St Martin
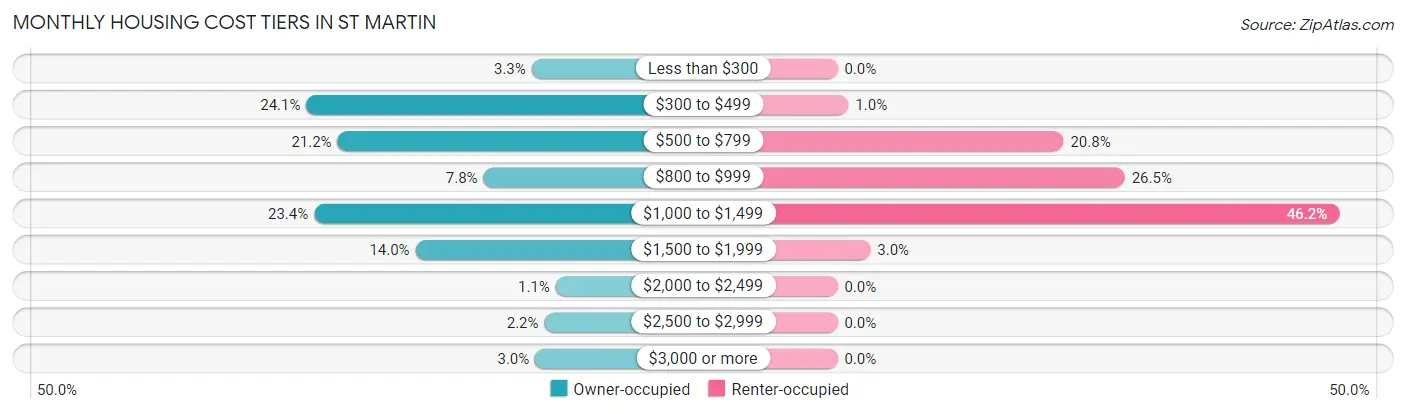
| Monthly Cost | Owner-occupied | Renter-occupied |
| Less than $300 | 51 (3.3%) | 0 (0.0%) |
| $300 to $499 | 369 (24.1%) | 14 (1.0%) |
| $500 to $799 | 325 (21.2%) | 288 (20.8%) |
| $800 to $999 | 119 (7.8%) | 366 (26.5%) |
| $1,000 to $1,499 | 358 (23.4%) | 639 (46.2%) |
| $1,500 to $1,999 | 215 (14.0%) | 42 (3.0%) |
| $2,000 to $2,499 | 17 (1.1%) | 0 (0.0%) |
| $2,500 to $2,999 | 33 (2.1%) | 0 (0.0%) |
| $3,000 or more | 46 (3.0%) | 0 (0.0%) |
| Total | 1,533 (100.0%) | 1,384 (100.0%) |
Physical Housing Characteristics in St Martin
Housing Structures in St Martin
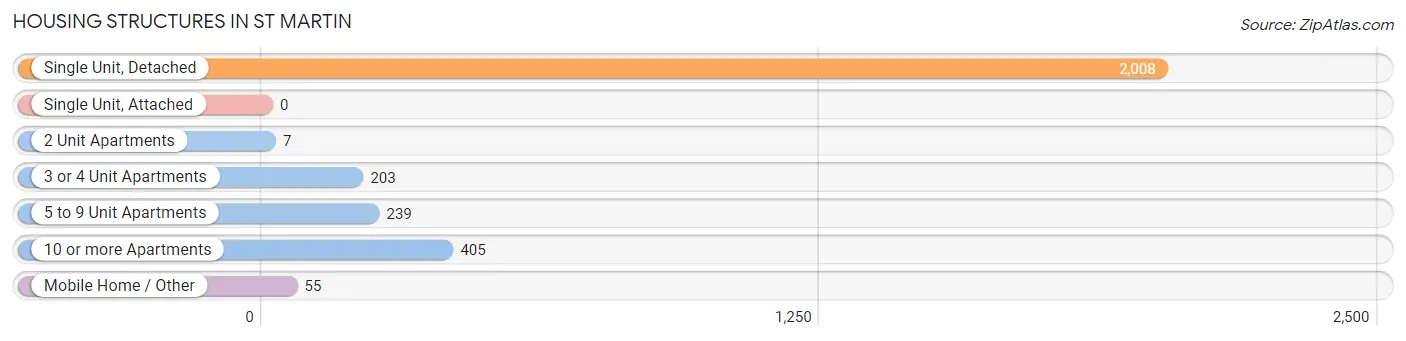
| Structure Type | # Housing Units | % Housing Units |
| Single Unit, Detached | 2,008 | 68.8% |
| Single Unit, Attached | 0 | 0.0% |
| 2 Unit Apartments | 7 | 0.2% |
| 3 or 4 Unit Apartments | 203 | 7.0% |
| 5 to 9 Unit Apartments | 239 | 8.2% |
| 10 or more Apartments | 405 | 13.9% |
| Mobile Home / Other | 55 | 1.9% |
| Total | 2,917 | 100.0% |
Housing Structures by Occupancy in St Martin
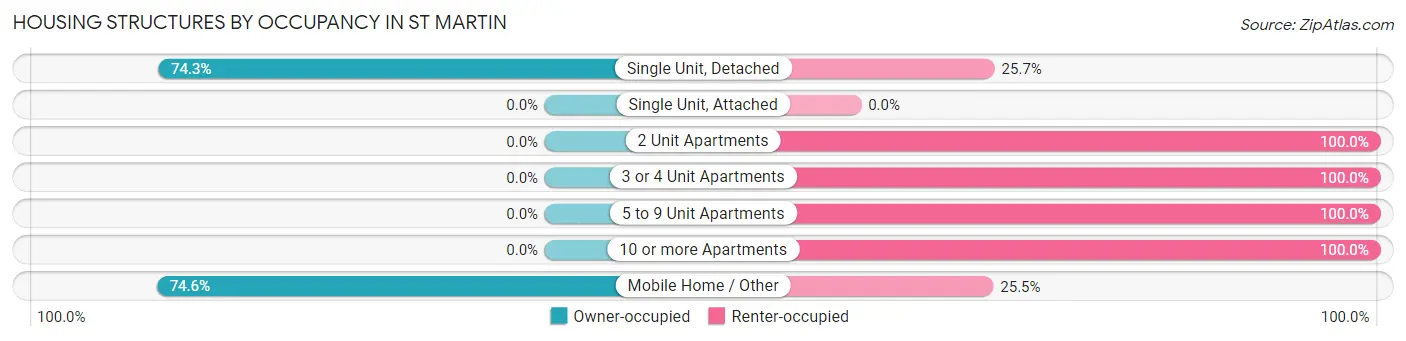
| Structure Type | Owner-occupied | Renter-occupied |
| Single Unit, Detached | 1,492 (74.3%) | 516 (25.7%) |
| Single Unit, Attached | 0 (0.0%) | 0 (0.0%) |
| 2 Unit Apartments | 0 (0.0%) | 7 (100.0%) |
| 3 or 4 Unit Apartments | 0 (0.0%) | 203 (100.0%) |
| 5 to 9 Unit Apartments | 0 (0.0%) | 239 (100.0%) |
| 10 or more Apartments | 0 (0.0%) | 405 (100.0%) |
| Mobile Home / Other | 41 (74.6%) | 14 (25.5%) |
| Total | 1,533 (52.5%) | 1,384 (47.4%) |
Housing Structures by Number of Rooms in St Martin
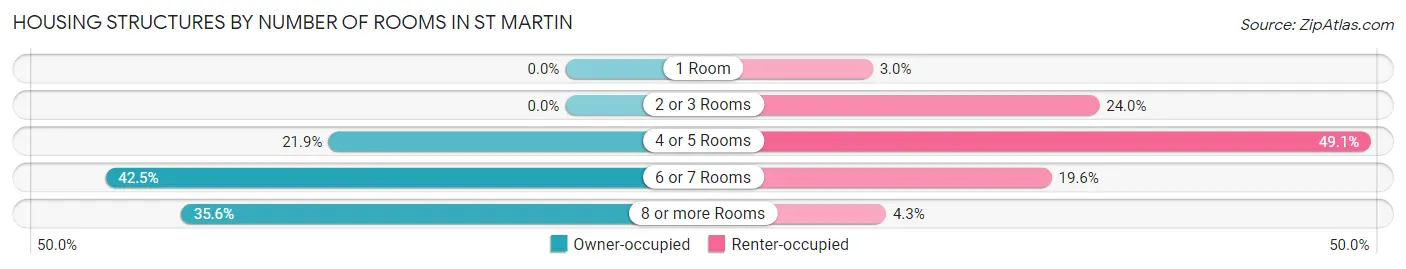
| Number of Rooms | Owner-occupied | Renter-occupied |
| 1 Room | 0 (0.0%) | 42 (3.0%) |
| 2 or 3 Rooms | 0 (0.0%) | 332 (24.0%) |
| 4 or 5 Rooms | 336 (21.9%) | 680 (49.1%) |
| 6 or 7 Rooms | 652 (42.5%) | 271 (19.6%) |
| 8 or more Rooms | 545 (35.5%) | 59 (4.3%) |
| Total | 1,533 (100.0%) | 1,384 (100.0%) |
Housing Structure by Heating Type in St Martin
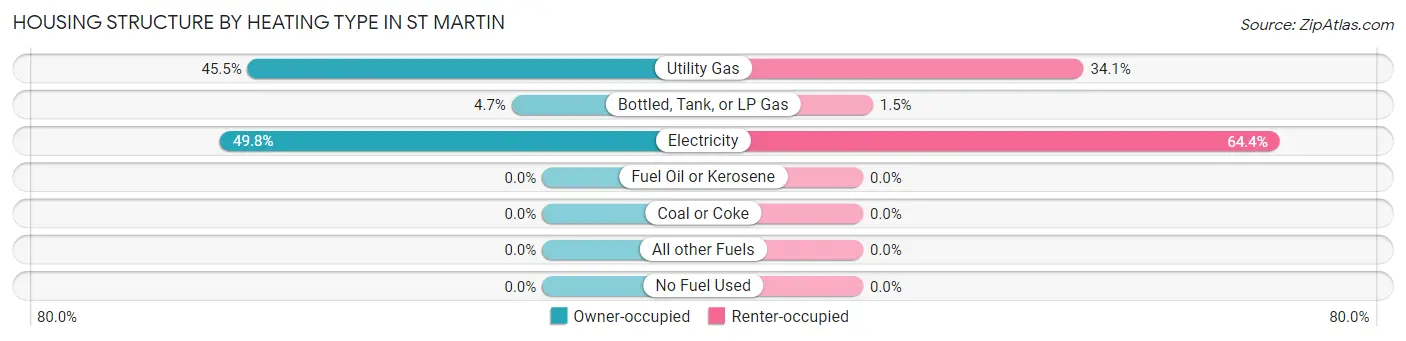
| Heating Type | Owner-occupied | Renter-occupied |
| Utility Gas | 698 (45.5%) | 472 (34.1%) |
| Bottled, Tank, or LP Gas | 72 (4.7%) | 21 (1.5%) |
| Electricity | 763 (49.8%) | 891 (64.4%) |
| Fuel Oil or Kerosene | 0 (0.0%) | 0 (0.0%) |
| Coal or Coke | 0 (0.0%) | 0 (0.0%) |
| All other Fuels | 0 (0.0%) | 0 (0.0%) |
| No Fuel Used | 0 (0.0%) | 0 (0.0%) |
| Total | 1,533 (100.0%) | 1,384 (100.0%) |
Household Vehicle Usage in St Martin
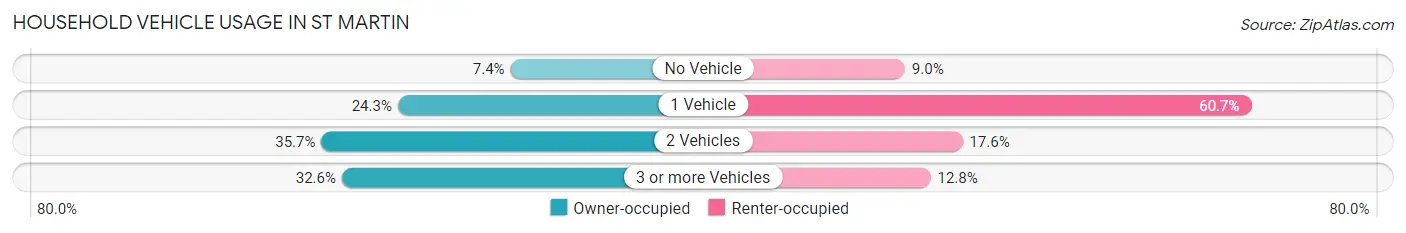
| Vehicles per Household | Owner-occupied | Renter-occupied |
| No Vehicle | 114 (7.4%) | 124 (9.0%) |
| 1 Vehicle | 372 (24.3%) | 840 (60.7%) |
| 2 Vehicles | 547 (35.7%) | 243 (17.6%) |
| 3 or more Vehicles | 500 (32.6%) | 177 (12.8%) |
| Total | 1,533 (100.0%) | 1,384 (100.0%) |
Real Estate & Mortgages in St Martin
Real Estate and Mortgage Overview in St Martin
| Characteristic | Without Mortgage | With Mortgage |
| Housing Units | 696 | 837 |
| Median Property Value | $140,000 | $154,700 |
| Median Household Income | $49,409 | $70 |
| Monthly Housing Costs | $445 | $46 |
| Real Estate Taxes | $590 | $196 |
Property Value by Mortgage Status in St Martin
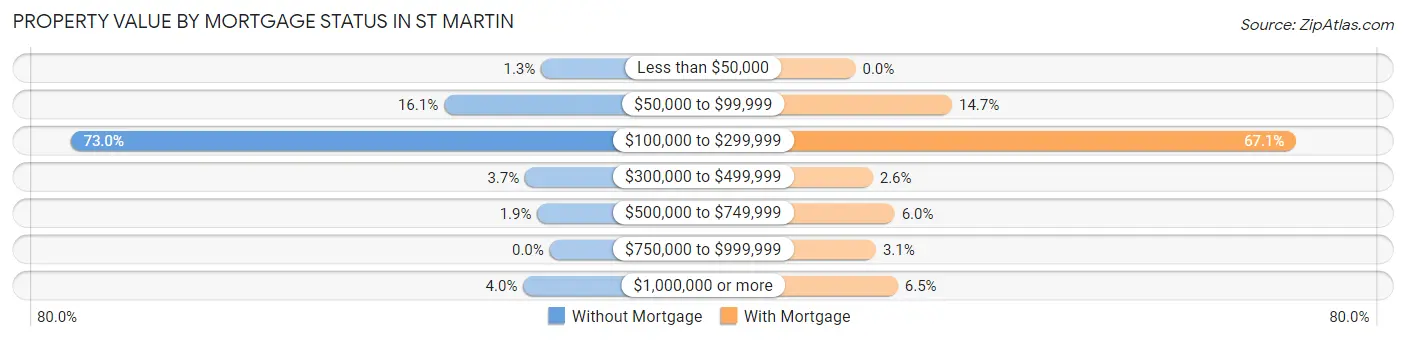
| Property Value | Without Mortgage | With Mortgage |
| Less than $50,000 | 9 (1.3%) | 0 (0.0%) |
| $50,000 to $99,999 | 112 (16.1%) | 123 (14.7%) |
| $100,000 to $299,999 | 508 (73.0%) | 562 (67.1%) |
| $300,000 to $499,999 | 26 (3.7%) | 22 (2.6%) |
| $500,000 to $749,999 | 13 (1.9%) | 50 (6.0%) |
| $750,000 to $999,999 | 0 (0.0%) | 26 (3.1%) |
| $1,000,000 or more | 28 (4.0%) | 54 (6.5%) |
| Total | 696 (100.0%) | 837 (100.0%) |
Household Income by Mortgage Status in St Martin
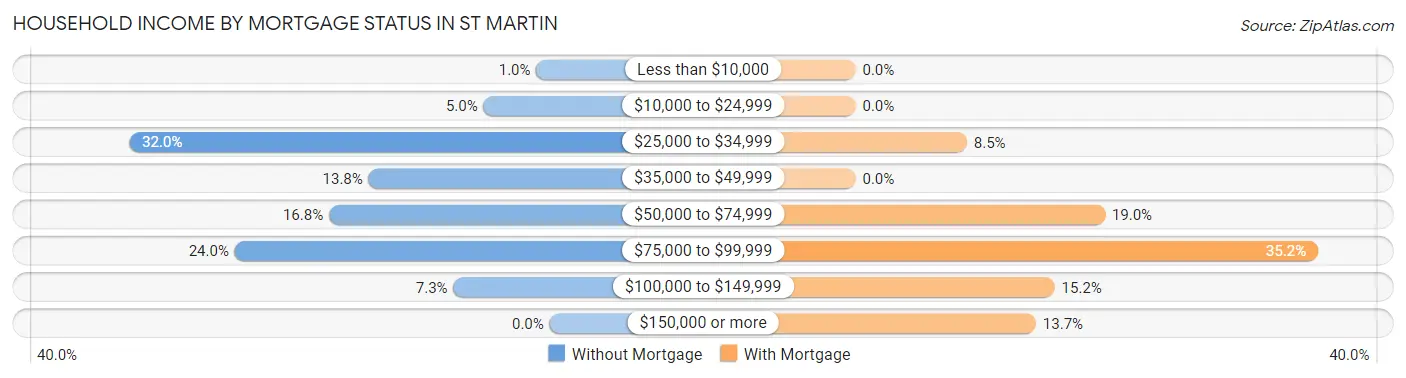
| Household Income | Without Mortgage | With Mortgage |
| Less than $10,000 | 7 (1.0%) | 0 (0.0%) |
| $10,000 to $24,999 | 35 (5.0%) | 0 (0.0%) |
| $25,000 to $34,999 | 223 (32.0%) | 71 (8.5%) |
| $35,000 to $49,999 | 96 (13.8%) | 0 (0.0%) |
| $50,000 to $74,999 | 117 (16.8%) | 159 (19.0%) |
| $75,000 to $99,999 | 167 (24.0%) | 295 (35.2%) |
| $100,000 to $149,999 | 51 (7.3%) | 127 (15.2%) |
| $150,000 or more | 0 (0.0%) | 115 (13.7%) |
| Total | 696 (100.0%) | 837 (100.0%) |
Property Value to Household Income Ratio in St Martin
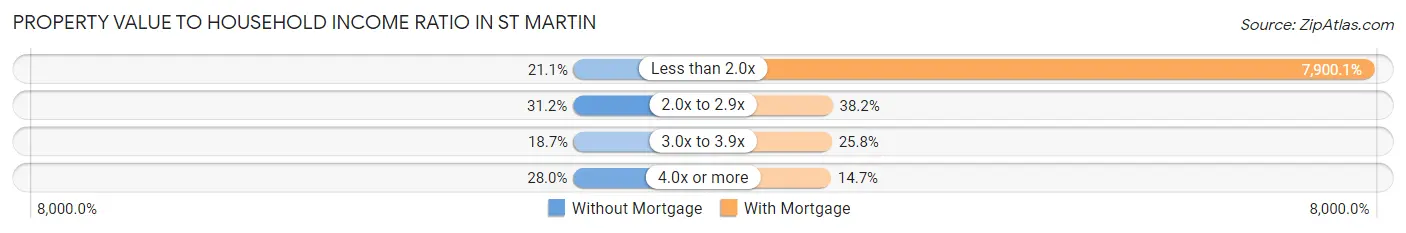
| Value-to-Income Ratio | Without Mortgage | With Mortgage |
| Less than 2.0x | 147 (21.1%) | 66,124 (7,900.1%) |
| 2.0x to 2.9x | 217 (31.2%) | 320 (38.2%) |
| 3.0x to 3.9x | 130 (18.7%) | 216 (25.8%) |
| 4.0x or more | 195 (28.0%) | 123 (14.7%) |
| Total | 696 (100.0%) | 837 (100.0%) |
Real Estate Taxes by Mortgage Status in St Martin
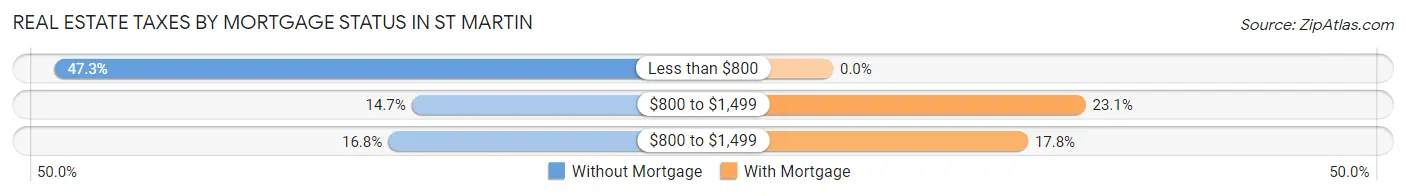
| Property Taxes | Without Mortgage | With Mortgage |
| Less than $800 | 329 (47.3%) | 0 (0.0%) |
| $800 to $1,499 | 102 (14.7%) | 193 (23.1%) |
| $800 to $1,499 | 117 (16.8%) | 149 (17.8%) |
| Total | 696 (100.0%) | 837 (100.0%) |
Health & Disability in St Martin
Health Insurance Coverage by Age in St Martin
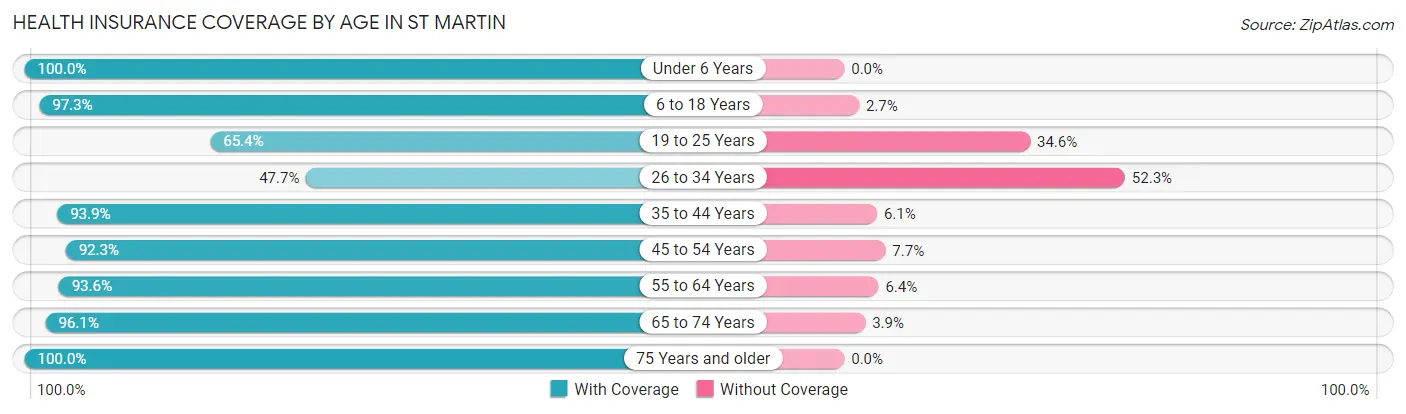
| Age Bracket | With Coverage | Without Coverage |
| Under 6 Years | 528 (100.0%) | 0 (0.0%) |
| 6 to 18 Years | 1,208 (97.3%) | 34 (2.7%) |
| 19 to 25 Years | 302 (65.4%) | 160 (34.6%) |
| 26 to 34 Years | 531 (47.7%) | 583 (52.3%) |
| 35 to 44 Years | 1,126 (93.9%) | 73 (6.1%) |
| 45 to 54 Years | 867 (92.3%) | 72 (7.7%) |
| 55 to 64 Years | 1,190 (93.6%) | 81 (6.4%) |
| 65 to 74 Years | 419 (96.1%) | 17 (3.9%) |
| 75 Years and older | 508 (100.0%) | 0 (0.0%) |
| Total | 6,679 (86.8%) | 1,020 (13.3%) |
Health Insurance Coverage by Citizenship Status in St Martin
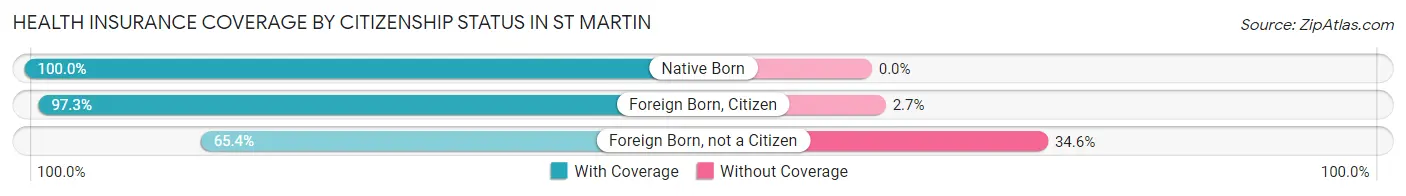
| Citizenship Status | With Coverage | Without Coverage |
| Native Born | 528 (100.0%) | 0 (0.0%) |
| Foreign Born, Citizen | 1,208 (97.3%) | 34 (2.7%) |
| Foreign Born, not a Citizen | 302 (65.4%) | 160 (34.6%) |
Health Insurance Coverage by Household Income in St Martin
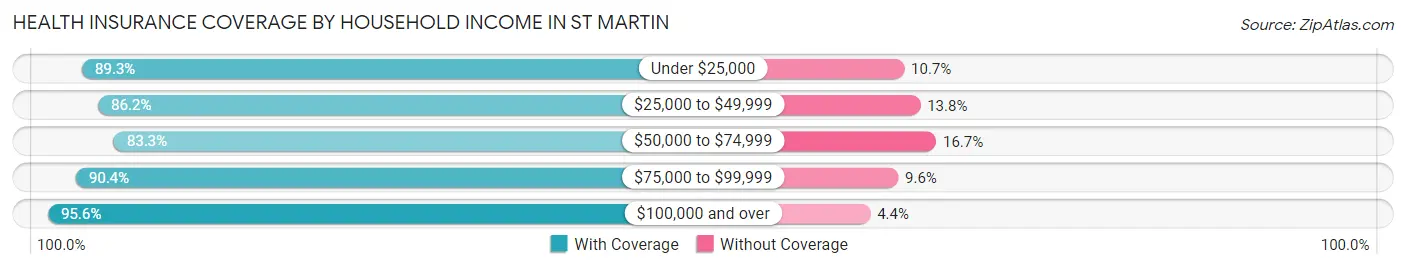
| Household Income | With Coverage | Without Coverage |
| Under $25,000 | 507 (89.3%) | 61 (10.7%) |
| $25,000 to $49,999 | 1,773 (86.2%) | 283 (13.8%) |
| $50,000 to $74,999 | 2,703 (83.3%) | 543 (16.7%) |
| $75,000 to $99,999 | 912 (90.4%) | 97 (9.6%) |
| $100,000 and over | 784 (95.6%) | 36 (4.4%) |
Public vs Private Health Insurance Coverage by Age in St Martin
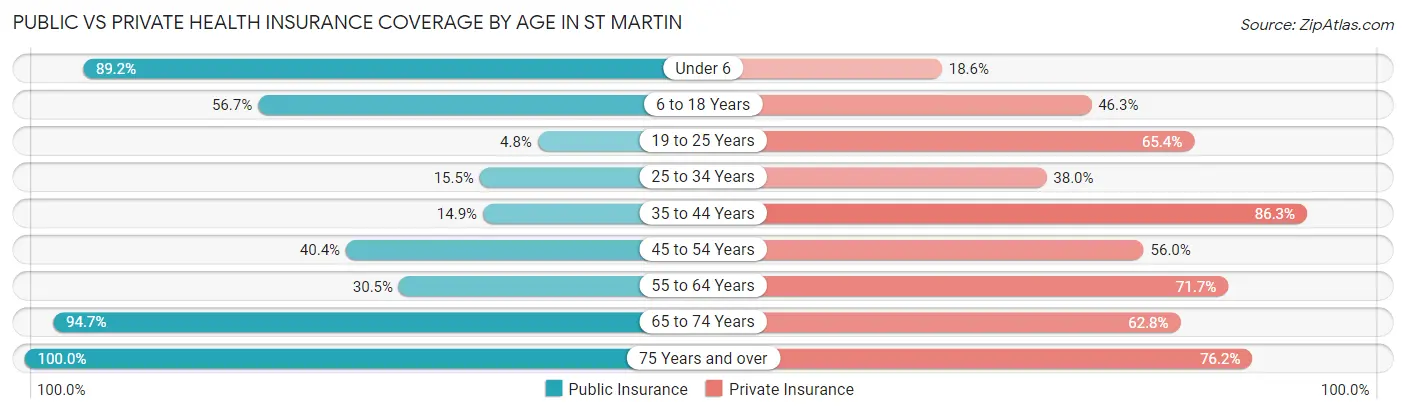
| Age Bracket | Public Insurance | Private Insurance |
| Under 6 | 471 (89.2%) | 98 (18.6%) |
| 6 to 18 Years | 704 (56.7%) | 575 (46.3%) |
| 19 to 25 Years | 22 (4.8%) | 302 (65.4%) |
| 25 to 34 Years | 173 (15.5%) | 423 (38.0%) |
| 35 to 44 Years | 179 (14.9%) | 1,035 (86.3%) |
| 45 to 54 Years | 379 (40.4%) | 526 (56.0%) |
| 55 to 64 Years | 388 (30.5%) | 911 (71.7%) |
| 65 to 74 Years | 413 (94.7%) | 274 (62.8%) |
| 75 Years and over | 508 (100.0%) | 387 (76.2%) |
| Total | 3,237 (42.0%) | 4,531 (58.9%) |
Disability Status by Sex by Age in St Martin
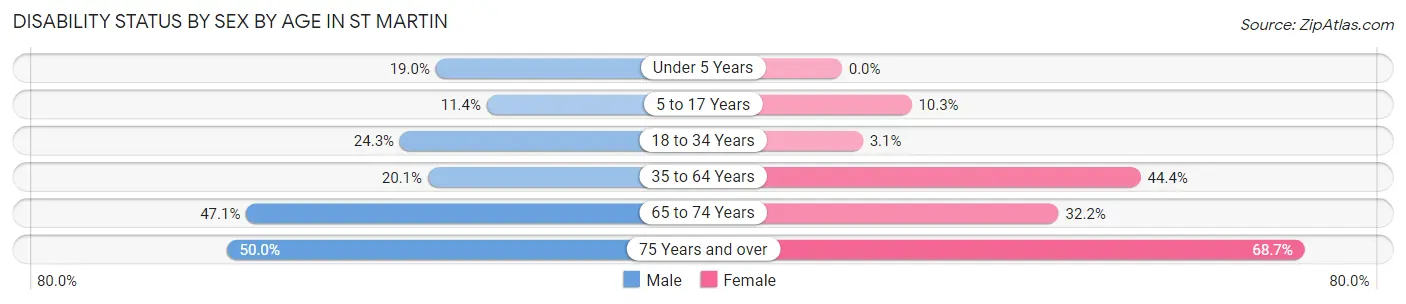
| Age Bracket | Male | Female |
| Under 5 Years | 47 (19.0%) | 0 (0.0%) |
| 5 to 17 Years | 98 (11.4%) | 51 (10.3%) |
| 18 to 34 Years | 142 (24.3%) | 31 (3.1%) |
| 35 to 64 Years | 301 (20.1%) | 849 (44.4%) |
| 65 to 74 Years | 81 (47.1%) | 85 (32.2%) |
| 75 Years and over | 75 (50.0%) | 246 (68.7%) |
Disability Class by Sex by Age in St Martin
Disability Class: Hearing Difficulty
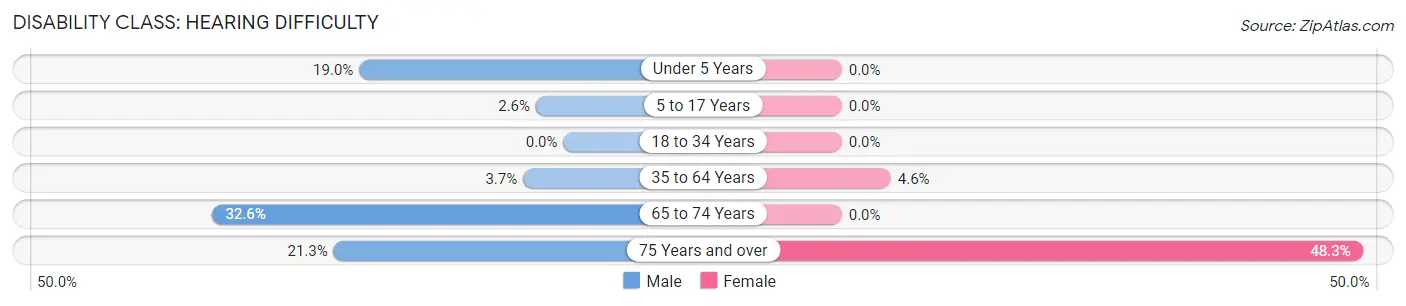
| Age Bracket | Male | Female |
| Under 5 Years | 47 (19.0%) | 0 (0.0%) |
| 5 to 17 Years | 22 (2.5%) | 0 (0.0%) |
| 18 to 34 Years | 0 (0.0%) | 0 (0.0%) |
| 35 to 64 Years | 56 (3.7%) | 87 (4.5%) |
| 65 to 74 Years | 56 (32.6%) | 0 (0.0%) |
| 75 Years and over | 32 (21.3%) | 173 (48.3%) |
Disability Class: Vision Difficulty
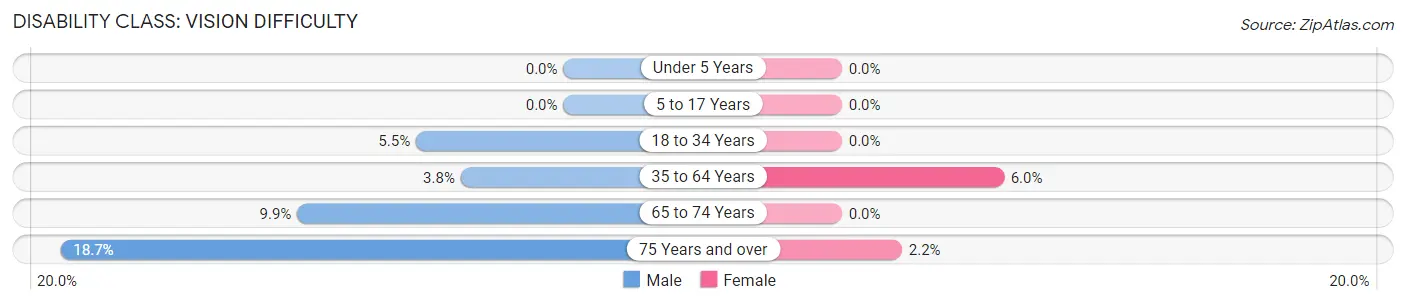
| Age Bracket | Male | Female |
| Under 5 Years | 0 (0.0%) | 0 (0.0%) |
| 5 to 17 Years | 0 (0.0%) | 0 (0.0%) |
| 18 to 34 Years | 32 (5.5%) | 0 (0.0%) |
| 35 to 64 Years | 57 (3.8%) | 115 (6.0%) |
| 65 to 74 Years | 17 (9.9%) | 0 (0.0%) |
| 75 Years and over | 28 (18.7%) | 8 (2.2%) |
Disability Class: Cognitive Difficulty
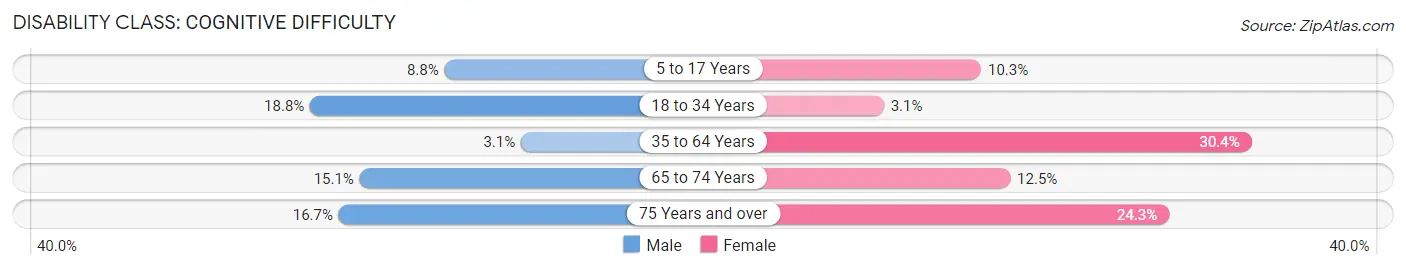
| Age Bracket | Male | Female |
| 5 to 17 Years | 76 (8.8%) | 51 (10.3%) |
| 18 to 34 Years | 110 (18.8%) | 31 (3.1%) |
| 35 to 64 Years | 47 (3.1%) | 582 (30.4%) |
| 65 to 74 Years | 26 (15.1%) | 33 (12.5%) |
| 75 Years and over | 25 (16.7%) | 87 (24.3%) |
Disability Class: Ambulatory Difficulty
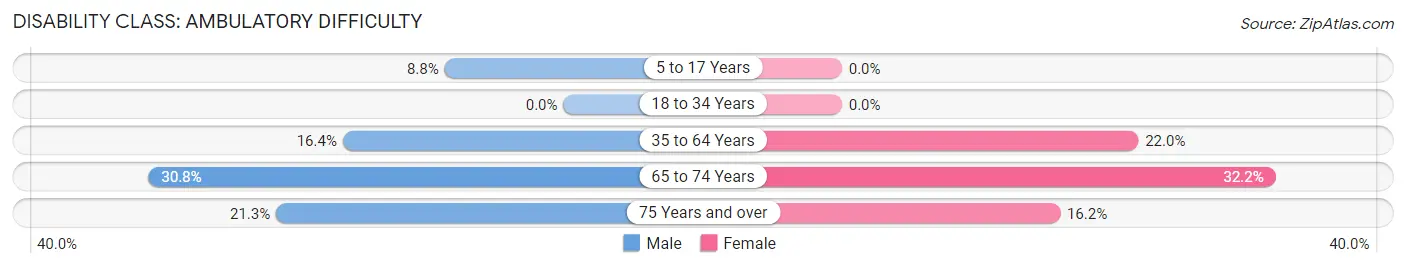
| Age Bracket | Male | Female |
| 5 to 17 Years | 76 (8.8%) | 0 (0.0%) |
| 18 to 34 Years | 0 (0.0%) | 0 (0.0%) |
| 35 to 64 Years | 245 (16.4%) | 421 (22.0%) |
| 65 to 74 Years | 53 (30.8%) | 85 (32.2%) |
| 75 Years and over | 32 (21.3%) | 58 (16.2%) |
Disability Class: Self-Care Difficulty
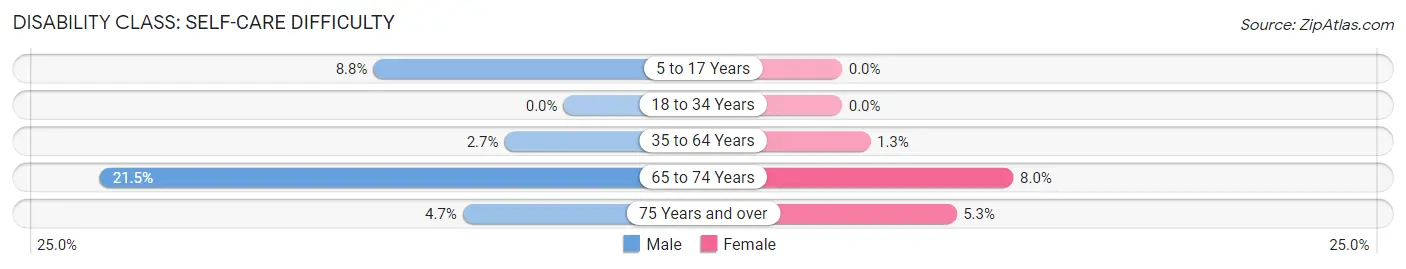
| Age Bracket | Male | Female |
| 5 to 17 Years | 76 (8.8%) | 0 (0.0%) |
| 18 to 34 Years | 0 (0.0%) | 0 (0.0%) |
| 35 to 64 Years | 41 (2.7%) | 25 (1.3%) |
| 65 to 74 Years | 37 (21.5%) | 21 (8.0%) |
| 75 Years and over | 7 (4.7%) | 19 (5.3%) |
Technology Access in St Martin
Computing Device Access in St Martin
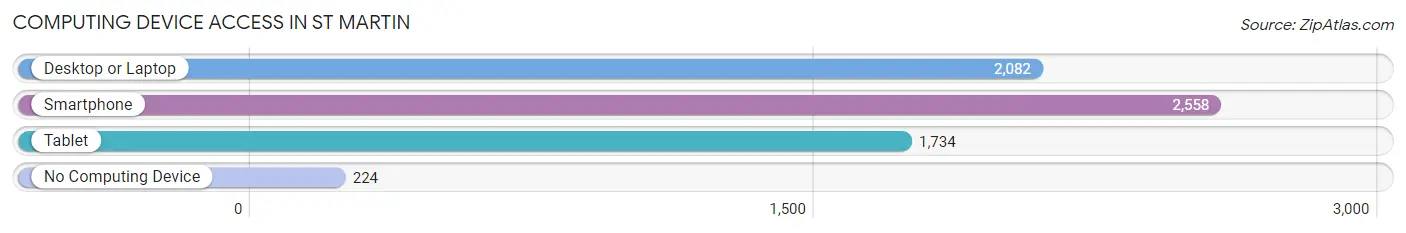
| Device Type | # Households | % Households |
| Desktop or Laptop | 2,082 | 71.4% |
| Smartphone | 2,558 | 87.7% |
| Tablet | 1,734 | 59.4% |
| No Computing Device | 224 | 7.7% |
| Total | 2,917 | 100.0% |
Internet Access in St Martin
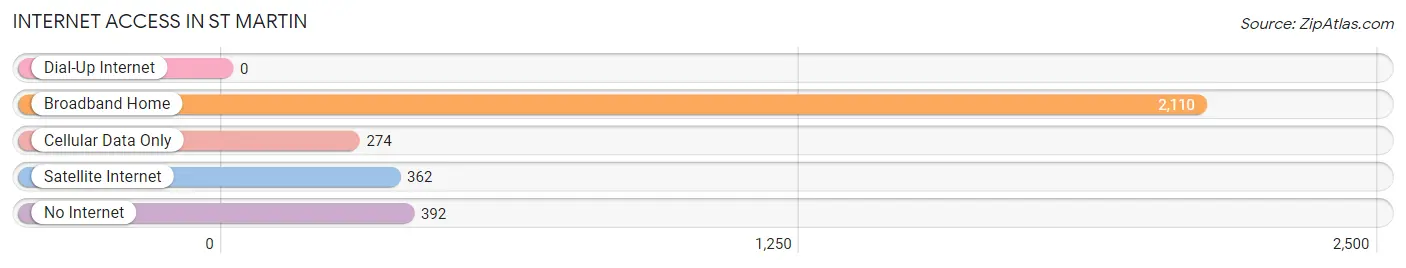
| Internet Type | # Households | % Households |
| Dial-Up Internet | 0 | 0.0% |
| Broadband Home | 2,110 | 72.3% |
| Cellular Data Only | 274 | 9.4% |
| Satellite Internet | 362 | 12.4% |
| No Internet | 392 | 13.4% |
| Total | 2,917 | 100.0% |
St Martin Summary
Introduction
St. Martin is a small town located in Jackson County, Mississippi. It is situated on the Pearl River, approximately 20 miles east of the state capital, Jackson. The town has a population of approximately 2,000 people and is part of the Pascagoula-Moss Point Metropolitan Statistical Area. St. Martin is known for its rural charm and its proximity to the Gulf Coast.
History
The area that is now St. Martin was first settled in the early 1800s by French settlers. The town was originally known as “St. Martinville” and was named after the patron saint of France, St. Martin of Tours. The town was incorporated in 1848 and was the first town in Jackson County to be incorporated.
In the late 1800s, St. Martin was a thriving agricultural community. The town was home to several cotton plantations and was a major producer of cotton and other agricultural products. The town also had a thriving lumber industry, with several sawmills located in the area.
In the early 1900s, St. Martin began to experience a decline in its agricultural and lumber industries. The Great Depression of the 1930s further exacerbated the town’s economic woes. In the 1940s, the town began to experience a resurgence in its economy, as the nearby Gulf Coast began to experience an economic boom.
Geography
St. Martin is located in Jackson County, Mississippi. The town is situated on the Pearl River, approximately 20 miles east of the state capital, Jackson. The town is located in the Pascagoula-Moss Point Metropolitan Statistical Area.
The town is located in a rural area, with the nearest major city being Mobile, Alabama, which is approximately 50 miles away. The town is located in a humid subtropical climate zone, with hot, humid summers and mild winters.
Economy
St. Martin’s economy is largely based on agriculture and tourism. The town is home to several farms, which produce a variety of crops, including cotton, corn, soybeans, and wheat. The town is also home to several seafood processing plants, which process and package seafood for local and regional markets.
The town is also home to several tourist attractions, including the St. Martin Wildlife Refuge, which is a popular destination for birdwatchers and nature enthusiasts. The town is also home to several restaurants, shops, and other businesses that cater to tourists.
Demographics
As of the 2010 census, St. Martin had a population of 2,000 people. The town is predominantly white, with approximately 75% of the population being white. The town is also home to a small African American population, with approximately 20% of the population being African American. The town is also home to a small Hispanic population, with approximately 5% of the population being Hispanic.
Conclusion
St. Martin is a small town located in Jackson County, Mississippi. The town has a population of approximately 2,000 people and is part of the Pascagoula-Moss Point Metropolitan Statistical Area. The town has a long history, dating back to the early 1800s, and is known for its rural charm and its proximity to the Gulf Coast. The town’s economy is largely based on agriculture and tourism, and the town is home to several tourist attractions, including the St. Martin Wildlife Refuge. The town is predominantly white, with approximately 75% of the population being white, and is also home to a small African American and Hispanic population.
Common Questions
What is Per Capita Income in St Martin?
Per Capita income in St Martin is $23,022.
What is the Median Family Income in St Martin?
Median Family Income in St Martin is $65,262.
What is the Median Household income in St Martin?
Median Household Income in St Martin is $49,484.
What is Income or Wage Gap in St Martin?
Income or Wage Gap in St Martin is 31.4%.
Women in St Martin earn 68.6 cents for every dollar earned by a man.
What is Inequality or Gini Index in St Martin?
Inequality or Gini Index in St Martin is 0.36.
What is the Total Population of St Martin?
Total Population of St Martin is 7,843.
What is the Total Male Population of St Martin?
Total Male Population of St Martin is 3,646.
What is the Total Female Population of St Martin?
Total Female Population of St Martin is 4,197.
What is the Ratio of Males per 100 Females in St Martin?
There are 86.87 Males per 100 Females in St Martin.
What is the Ratio of Females per 100 Males in St Martin?
There are 115.11 Females per 100 Males in St Martin.
What is the Median Population Age in St Martin?
Median Population Age in St Martin is 38.0 Years.
What is the Average Family Size in St Martin
Average Family Size in St Martin is 3.9 People.
What is the Average Household Size in St Martin
Average Household Size in St Martin is 2.7 People.
How Large is the Labor Force in St Martin?
There are 3,634 People in the Labor Forcein in St Martin.
What is the Percentage of People in the Labor Force in St Martin?
56.4% of People are in the Labor Force in St Martin.
What is the Unemployment Rate in St Martin?
Unemployment Rate in St Martin is 5.6%.