Redwater, MS Map & Demographics
Redwater Map
Redwater Overview
$16,252
PER CAPITA INCOME
$58,036
AVG FAMILY INCOME
$57,775
AVG HOUSEHOLD INCOME
0.31
INEQUALITY / GINI INDEX
514
TOTAL POPULATION
171
MALE POPULATION
343
FEMALE POPULATION
49.85
MALES / 100 FEMALES
200.58
FEMALES / 100 MALES
41.2
MEDIAN AGE
2.5
AVG FAMILY SIZE
2.4
AVG HOUSEHOLD SIZE
229
LABOR FORCE [ PEOPLE ]
58.4%
PERCENT IN LABOR FORCE
15.7%
UNEMPLOYMENT RATE
Income in Redwater
Income Overview in Redwater
Per Capita Income in Redwater is $16,252, while median incomes of families and households are $58,036 and $57,775 respectively.
| Characteristic | Number | Measure |
| Per Capita Income | 514 | $16,252 |
| Median Family Income | 175 | $58,036 |
| Mean Family Income | 175 | $55,174 |
| Median Household Income | 214 | $57,775 |
| Mean Household Income | 214 | $50,164 |
| Income Deficit | 175 | $0 |
| Wage / Income Gap (%) | 514 | 0.00% |
| Wage / Income Gap ($) | 514 | 100.00¢ per $1 |
| Gini / Inequality Index | 514 | 0.31 |
Earnings by Sex in Redwater
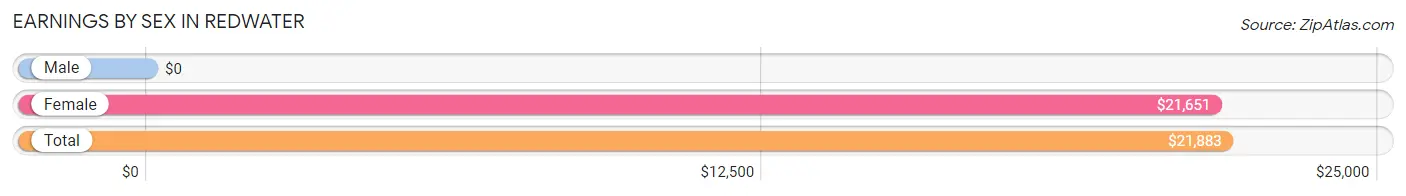
| Sex | Number | Average Earnings |
| Male | 67 (23.1%) | $0 |
| Female | 223 (76.9%) | $21,651 |
| Total | 290 (100.0%) | $21,883 |
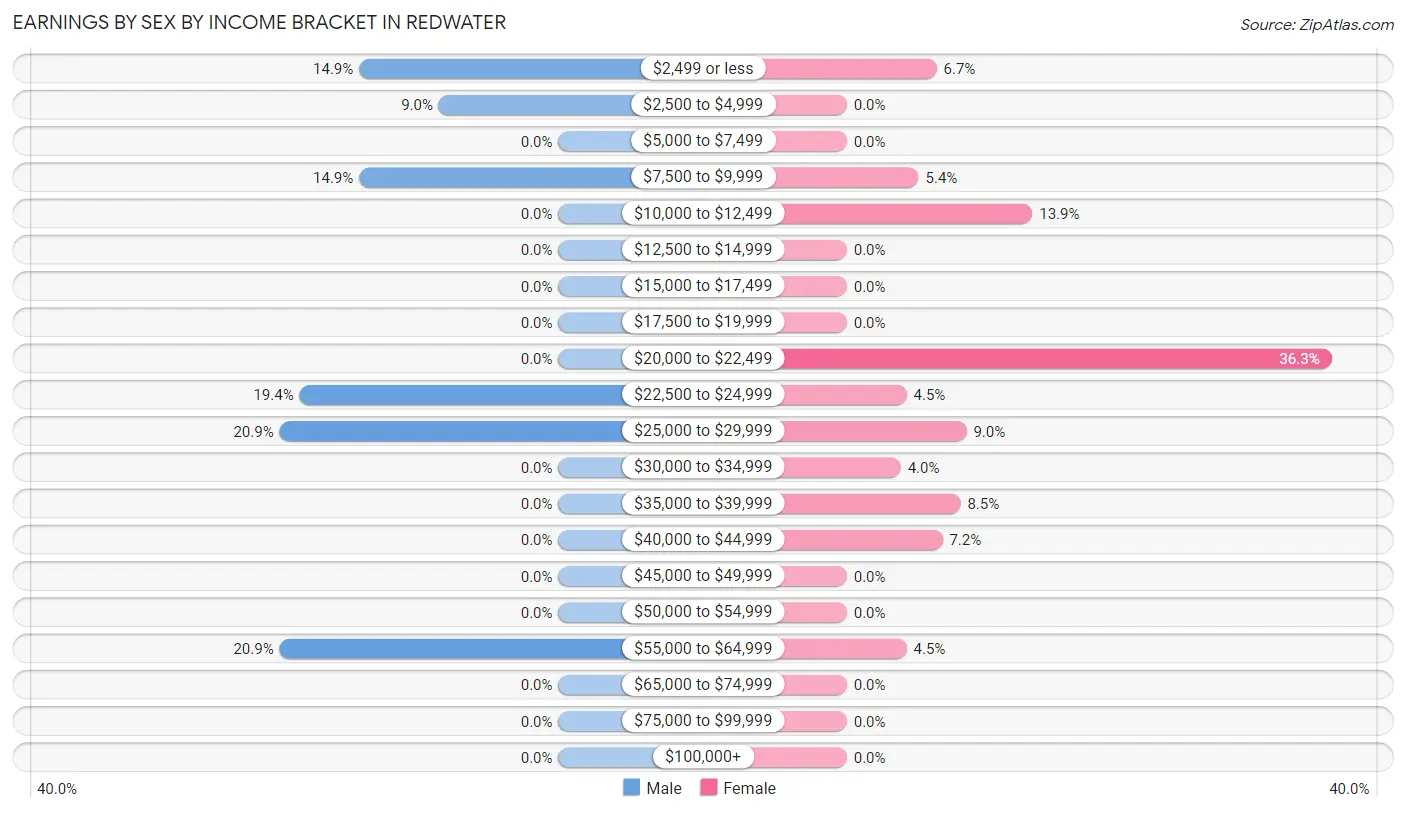
Earnings by Sex by Income Bracket in Redwater
The most common earnings brackets in Redwater are $25,000 to $29,999 for men (14 | 20.9%) and $20,000 to $22,499 for women (81 | 36.3%).
| Income | Male | Female |
| $2,499 or less | 10 (14.9%) | 15 (6.7%) |
| $2,500 to $4,999 | 6 (9.0%) | 0 (0.0%) |
| $5,000 to $7,499 | 0 (0.0%) | 0 (0.0%) |
| $7,500 to $9,999 | 10 (14.9%) | 12 (5.4%) |
| $10,000 to $12,499 | 0 (0.0%) | 31 (13.9%) |
| $12,500 to $14,999 | 0 (0.0%) | 0 (0.0%) |
| $15,000 to $17,499 | 0 (0.0%) | 0 (0.0%) |
| $17,500 to $19,999 | 0 (0.0%) | 0 (0.0%) |
| $20,000 to $22,499 | 0 (0.0%) | 81 (36.3%) |
| $22,500 to $24,999 | 13 (19.4%) | 10 (4.5%) |
| $25,000 to $29,999 | 14 (20.9%) | 20 (9.0%) |
| $30,000 to $34,999 | 0 (0.0%) | 9 (4.0%) |
| $35,000 to $39,999 | 0 (0.0%) | 19 (8.5%) |
| $40,000 to $44,999 | 0 (0.0%) | 16 (7.2%) |
| $45,000 to $49,999 | 0 (0.0%) | 0 (0.0%) |
| $50,000 to $54,999 | 0 (0.0%) | 0 (0.0%) |
| $55,000 to $64,999 | 14 (20.9%) | 10 (4.5%) |
| $65,000 to $74,999 | 0 (0.0%) | 0 (0.0%) |
| $75,000 to $99,999 | 0 (0.0%) | 0 (0.0%) |
| $100,000+ | 0 (0.0%) | 0 (0.0%) |
| Total | 67 (100.0%) | 223 (100.0%) |
Earnings by Sex by Educational Attainment in Redwater
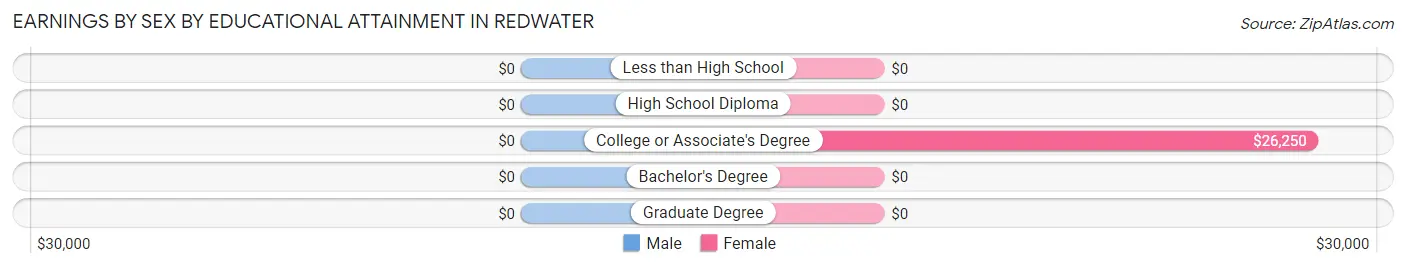
| Educational Attainment | Male Income | Female Income |
| Less than High School | - | - |
| High School Diploma | - | - |
| College or Associate's Degree | - | - |
| Bachelor's Degree | - | - |
| Graduate Degree | - | - |
| Total | $24,519 | $21,744 |
Family Income in Redwater
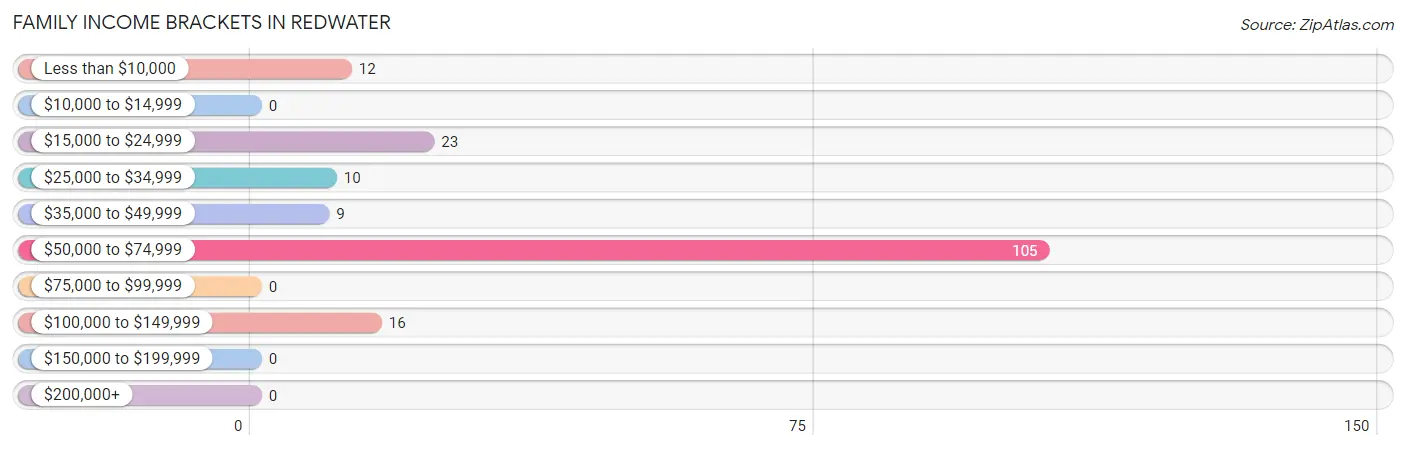
Family Income Brackets in Redwater
According to the Redwater family income data, there are 105 families falling into the $50,000 to $74,999 income range, which is the most common income bracket and makes up 60.0% of all families.
| Income Bracket | # Families | % Families |
| Less than $10,000 | 12 | 6.9% |
| $10,000 to $14,999 | 0 | 0.0% |
| $15,000 to $24,999 | 23 | 13.1% |
| $25,000 to $34,999 | 10 | 5.7% |
| $35,000 to $49,999 | 9 | 5.1% |
| $50,000 to $74,999 | 105 | 60.0% |
| $75,000 to $99,999 | 0 | 0.0% |
| $100,000 to $149,999 | 16 | 9.1% |
| $150,000 to $199,999 | 0 | 0.0% |
| $200,000+ | 0 | 0.0% |
Family Income by Famaliy Size in Redwater
| Income Bracket | # Families | Median Income |
| 2-Person Families | 15 (8.6%) | $0 |
| 3-Person Families | 37 (21.1%) | $0 |
| 4-Person Families | 91 (52.0%) | $0 |
| 5-Person Families | 22 (12.6%) | $0 |
| 6-Person Families | 0 (0.0%) | $0 |
| 7+ Person Families | 10 (5.7%) | $0 |
| Total | 175 (100.0%) | $58,036 |
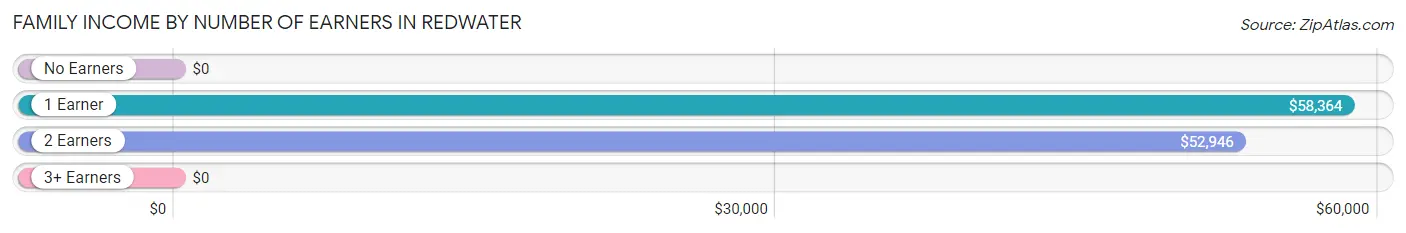
Family Income by Number of Earners in Redwater
| Number of Earners | # Families | Median Income |
| No Earners | 10 (5.7%) | $0 |
| 1 Earner | 106 (60.6%) | $58,364 |
| 2 Earners | 43 (24.6%) | $52,946 |
| 3+ Earners | 16 (9.1%) | $0 |
| Total | 175 (100.0%) | $58,036 |
Household Income in Redwater
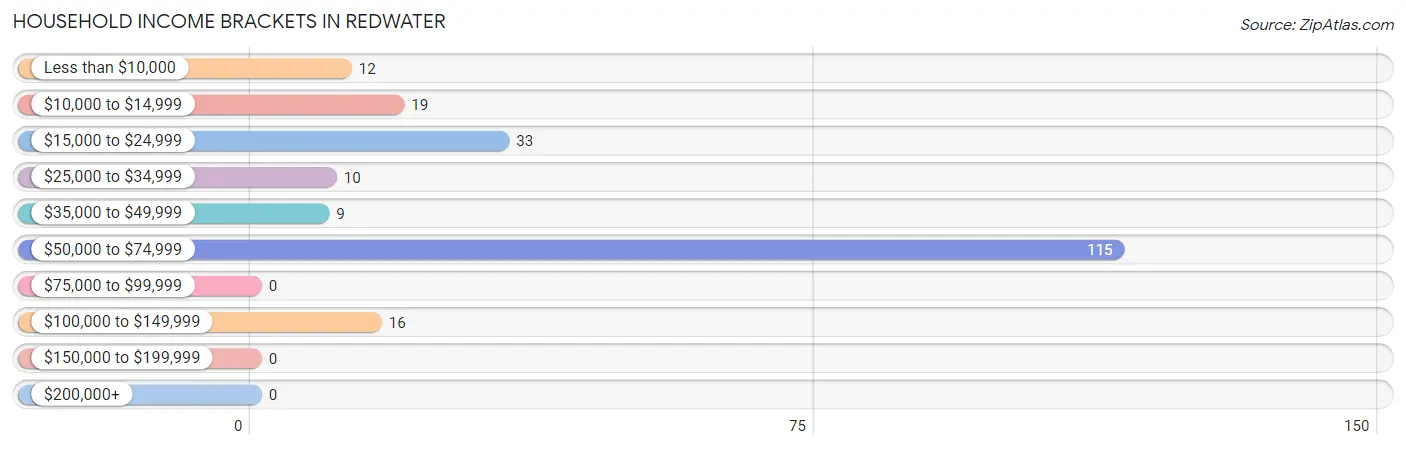
Household Income Brackets in Redwater
With 115 households falling in the category, the $50,000 to $74,999 income range is the most frequent in Redwater, accounting for 53.7% of all households.
| Income Bracket | # Households | % Households |
| Less than $10,000 | 12 | 5.6% |
| $10,000 to $14,999 | 19 | 8.9% |
| $15,000 to $24,999 | 33 | 15.4% |
| $25,000 to $34,999 | 10 | 4.7% |
| $35,000 to $49,999 | 9 | 4.2% |
| $50,000 to $74,999 | 115 | 53.7% |
| $75,000 to $99,999 | 0 | 0.0% |
| $100,000 to $149,999 | 16 | 7.5% |
| $150,000 to $199,999 | 0 | 0.0% |
| $200,000+ | 0 | 0.0% |
Household Income by Householder Age in Redwater
The median household income in Redwater is $57,775, with the highest median household income of $59,000 found in the 45 to 64 years age bracket for the primary householder. A total of 60 households (28.0%) fall into this category.
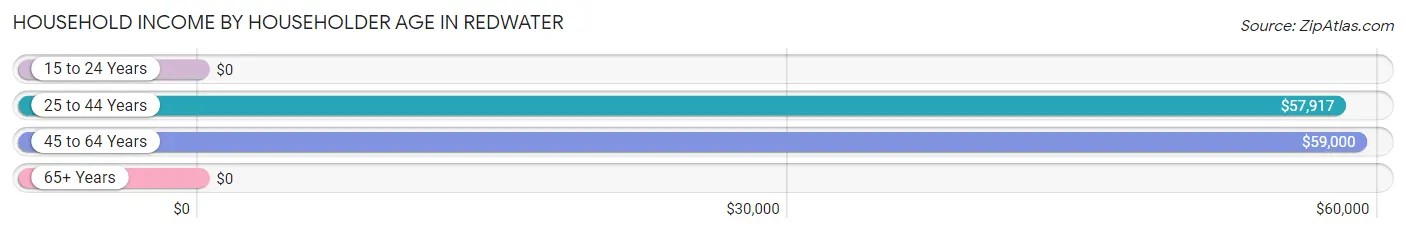
| Income Bracket | # Households | Median Income |
| 15 to 24 Years | 0 (0.0%) | $0 |
| 25 to 44 Years | 135 (63.1%) | $57,917 |
| 45 to 64 Years | 60 (28.0%) | $59,000 |
| 65+ Years | 19 (8.9%) | $0 |
| Total | 214 (100.0%) | $57,775 |
Poverty in Redwater
Income Below Poverty by Sex and Age in Redwater
With 70.2% poverty level for males and 51.9% for females among the residents of Redwater, under 5 year old males and under 5 year old females are the most vulnerable to poverty, with 7 males (100.0%) and 14 females (100.0%) in their respective age groups living below the poverty level.
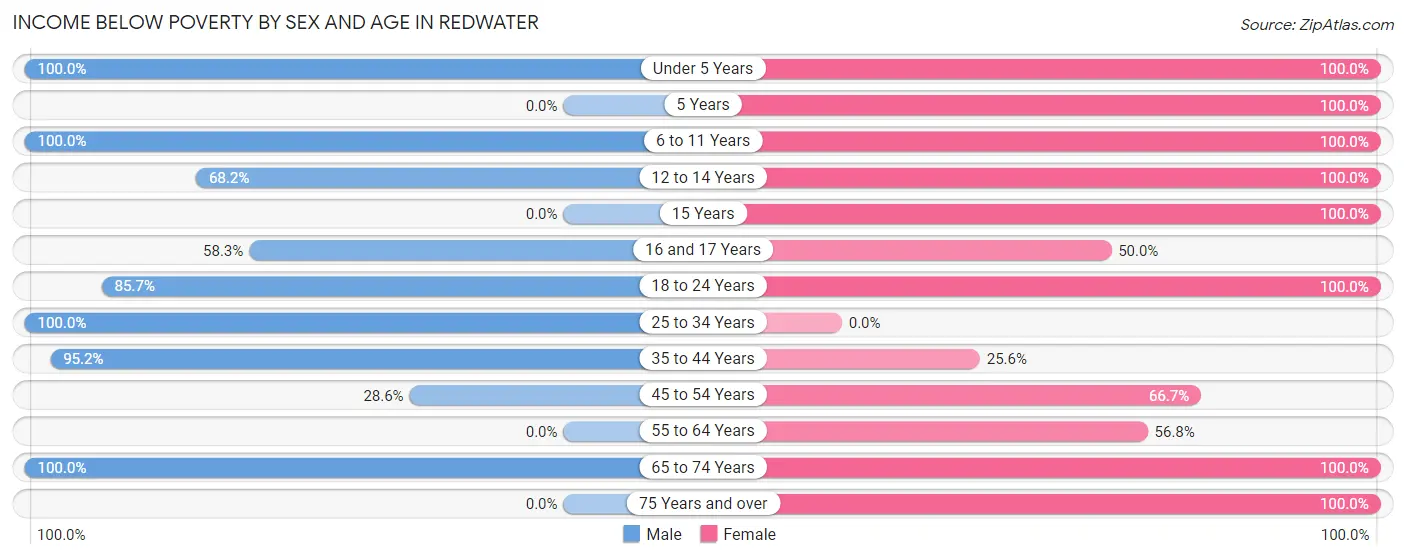
| Age Bracket | Male | Female |
| Under 5 Years | 7 (100.0%) | 14 (100.0%) |
| 5 Years | 0 (0.0%) | 9 (100.0%) |
| 6 to 11 Years | 27 (100.0%) | 9 (100.0%) |
| 12 to 14 Years | 15 (68.2%) | 17 (100.0%) |
| 15 Years | 0 (0.0%) | 6 (100.0%) |
| 16 and 17 Years | 7 (58.3%) | 6 (50.0%) |
| 18 to 24 Years | 6 (85.7%) | 16 (100.0%) |
| 25 to 34 Years | 20 (100.0%) | 0 (0.0%) |
| 35 to 44 Years | 20 (95.2%) | 31 (25.6%) |
| 45 to 54 Years | 8 (28.6%) | 20 (66.7%) |
| 55 to 64 Years | 0 (0.0%) | 21 (56.8%) |
| 65 to 74 Years | 10 (100.0%) | 9 (100.0%) |
| 75 Years and over | 0 (0.0%) | 16 (100.0%) |
| Total | 120 (70.2%) | 174 (51.9%) |
Income Above Poverty by Sex and Age in Redwater
According to the poverty statistics in Redwater, males aged 15 years and females aged 25 to 34 years are the age groups that are most secure financially, with 100.0% of males and 100.0% of females in these age groups living above the poverty line.
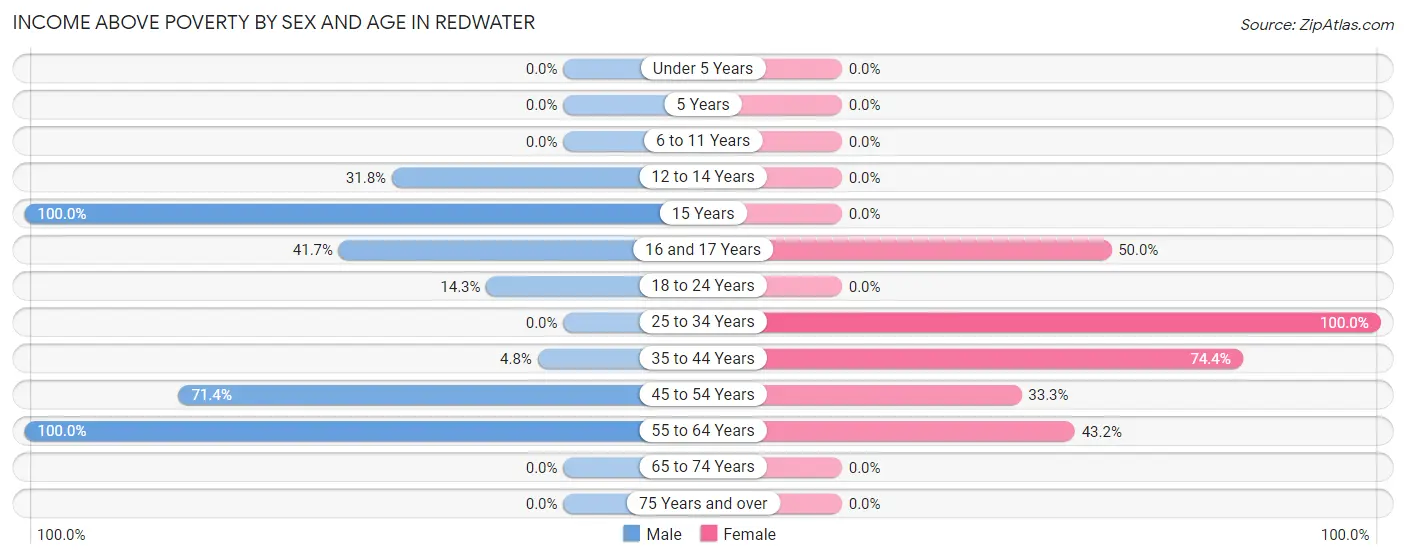
| Age Bracket | Male | Female |
| Under 5 Years | 0 (0.0%) | 0 (0.0%) |
| 5 Years | 0 (0.0%) | 0 (0.0%) |
| 6 to 11 Years | 0 (0.0%) | 0 (0.0%) |
| 12 to 14 Years | 7 (31.8%) | 0 (0.0%) |
| 15 Years | 3 (100.0%) | 0 (0.0%) |
| 16 and 17 Years | 5 (41.7%) | 6 (50.0%) |
| 18 to 24 Years | 1 (14.3%) | 0 (0.0%) |
| 25 to 34 Years | 0 (0.0%) | 39 (100.0%) |
| 35 to 44 Years | 1 (4.8%) | 90 (74.4%) |
| 45 to 54 Years | 20 (71.4%) | 10 (33.3%) |
| 55 to 64 Years | 14 (100.0%) | 16 (43.2%) |
| 65 to 74 Years | 0 (0.0%) | 0 (0.0%) |
| 75 Years and over | 0 (0.0%) | 0 (0.0%) |
| Total | 51 (29.8%) | 161 (48.1%) |
Income Below Poverty Among Married-Couple Families in Redwater
The poverty statistics for married-couple families in Redwater show that 23.6% or 30 of the total 127 families live below the poverty line. Families with 5 or more children have the highest poverty rate of 100.0%, comprising of 10 families. On the other hand, families with no children have the lowest poverty rate of 0.0%, which includes 0 families.
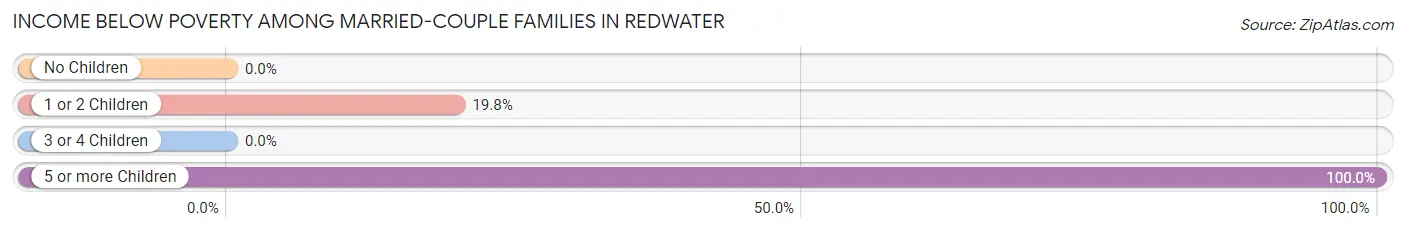
| Children | Above Poverty | Below Poverty |
| No Children | 16 (100.0%) | 0 (0.0%) |
| 1 or 2 Children | 81 (80.2%) | 20 (19.8%) |
| 3 or 4 Children | 0 (0.0%) | 0 (0.0%) |
| 5 or more Children | 0 (0.0%) | 10 (100.0%) |
| Total | 97 (76.4%) | 30 (23.6%) |
Income Below Poverty Among Single-Parent Households in Redwater
According to the poverty data in Redwater, 44.4% or 12 single-father households and 57.1% or 12 single-mother households are living below the poverty line. Among single-father households, those with 3 or 4 children have the highest poverty rate, with 12 households (100.0%) experiencing poverty. Likewise, among single-mother households, those with 1 or 2 children have the highest poverty rate, with 12 households (57.1%) falling below the poverty line.
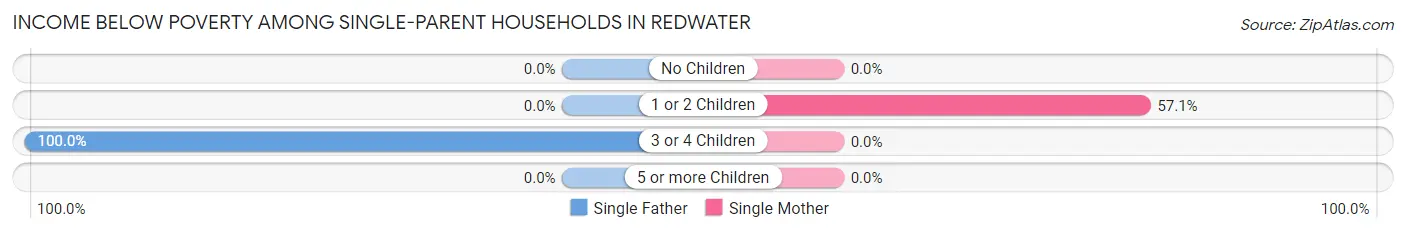
| Children | Single Father | Single Mother |
| No Children | 0 (0.0%) | 0 (0.0%) |
| 1 or 2 Children | 0 (0.0%) | 12 (57.1%) |
| 3 or 4 Children | 12 (100.0%) | 0 (0.0%) |
| 5 or more Children | 0 (0.0%) | 0 (0.0%) |
| Total | 12 (44.4%) | 12 (57.1%) |
Income Below Poverty Among Married-Couple vs Single-Parent Households in Redwater
The poverty data for Redwater shows that 30 of the married-couple family households (23.6%) and 24 of the single-parent households (50.0%) are living below the poverty level. Within the married-couple family households, those with 5 or more children have the highest poverty rate, with 10 households (100.0%) falling below the poverty line. Among the single-parent households, those with 3 or 4 children have the highest poverty rate, with 12 household (100.0%) living below poverty.
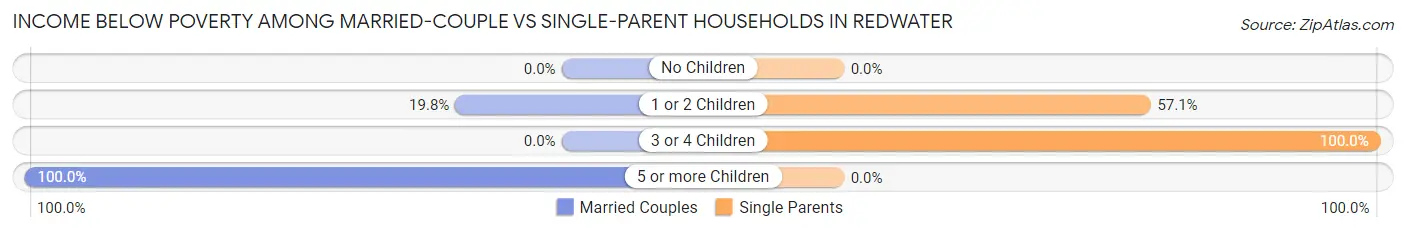
| Children | Married-Couple Families | Single-Parent Households |
| No Children | 0 (0.0%) | 0 (0.0%) |
| 1 or 2 Children | 20 (19.8%) | 12 (57.1%) |
| 3 or 4 Children | 0 (0.0%) | 12 (100.0%) |
| 5 or more Children | 10 (100.0%) | 0 (0.0%) |
| Total | 30 (23.6%) | 24 (50.0%) |
Race in Redwater
The most populous races in Redwater are Native / Alaskan (401 | 78.0%), Black / African American (89 | 17.3%), and Two or more Races (14 | 2.7%).
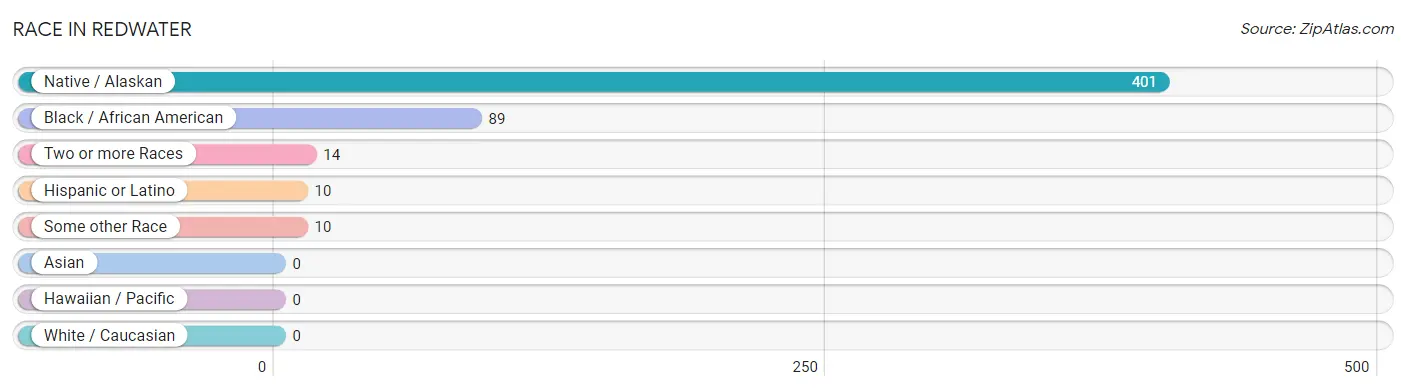
| Race | # Population | % Population |
| Asian | 0 | 0.0% |
| Black / African American | 89 | 17.3% |
| Hawaiian / Pacific | 0 | 0.0% |
| Hispanic or Latino | 10 | 1.9% |
| Native / Alaskan | 401 | 78.0% |
| White / Caucasian | 0 | 0.0% |
| Two or more Races | 14 | 2.7% |
| Some other Race | 10 | 1.9% |
| Total | 514 | 100.0% |
Ancestry in Redwater
The most populous ancestries reported in Redwater are Choctaw (413 | 80.3%), American (10 | 1.9%), and Mexican (10 | 1.9%), together accounting for 84.2% of all Redwater residents.
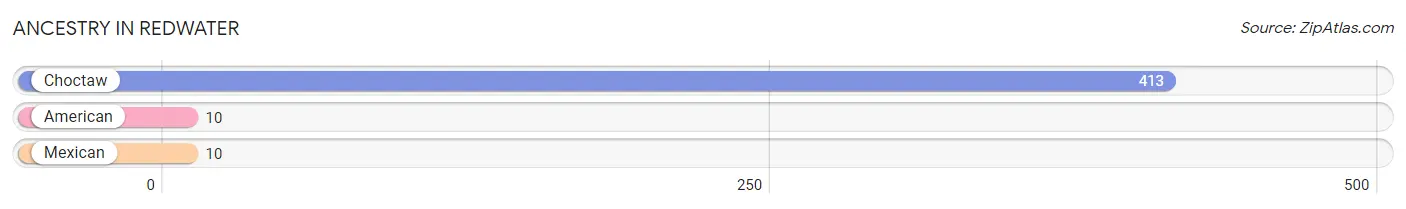
| Ancestry | # Population | % Population |
| American | 10 | 1.9% |
| Choctaw | 413 | 80.3% |
| Mexican | 10 | 1.9% | View All 3 Rows |
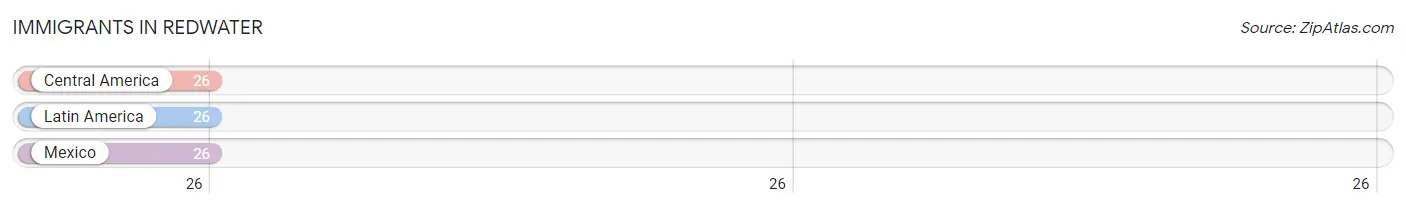
Immigrants in Redwater
The most numerous immigrant groups reported in Redwater came from Central America (26 | 5.1%), Latin America (26 | 5.1%), and Mexico (26 | 5.1%), together accounting for 15.2% of all Redwater residents.
| Immigration Origin | # Population | % Population |
| Central America | 26 | 5.1% |
| Latin America | 26 | 5.1% |
| Mexico | 26 | 5.1% | View All 3 Rows |
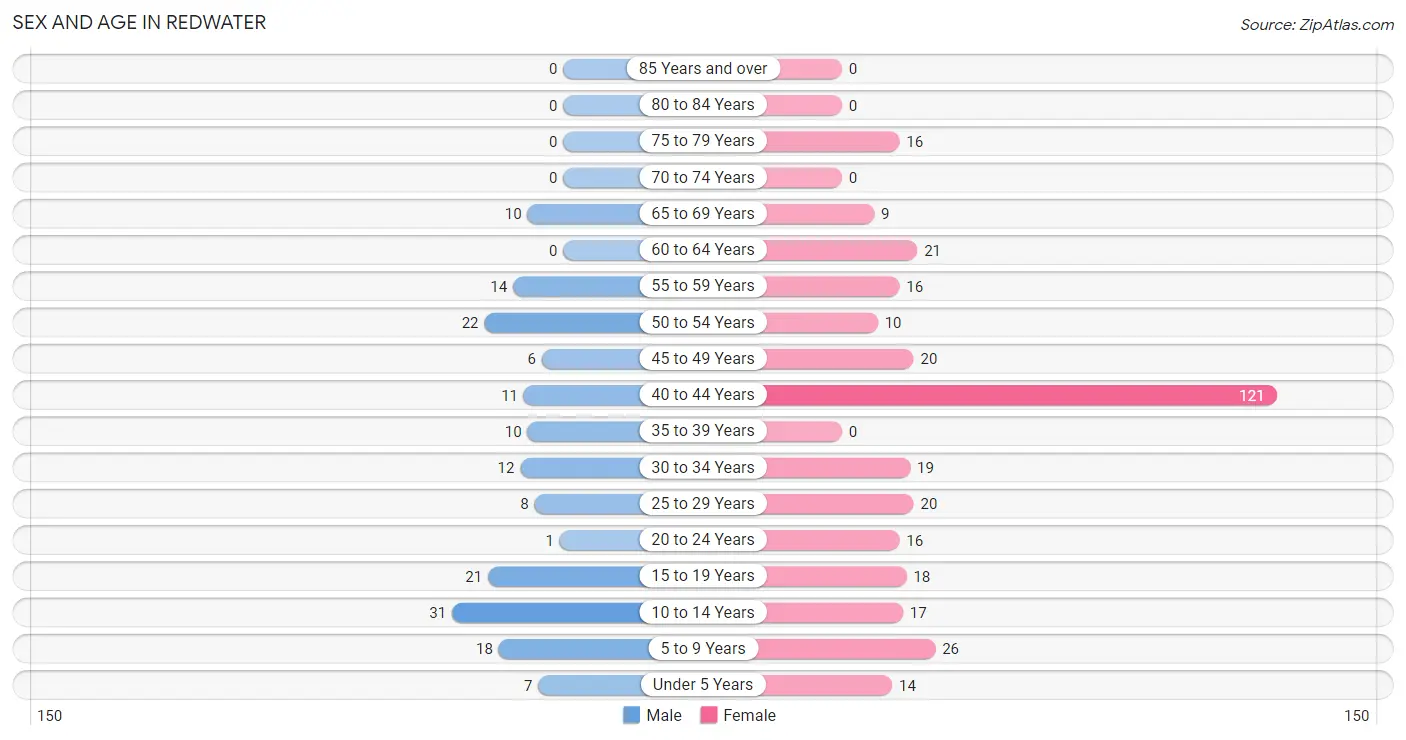
Sex and Age in Redwater
Sex and Age in Redwater
The most populous age groups in Redwater are 10 to 14 Years (31 | 18.1%) for men and 40 to 44 Years (121 | 35.3%) for women.
| Age Bracket | Male | Female |
| Under 5 Years | 7 (4.1%) | 14 (4.1%) |
| 5 to 9 Years | 18 (10.5%) | 26 (7.6%) |
| 10 to 14 Years | 31 (18.1%) | 17 (5.0%) |
| 15 to 19 Years | 21 (12.3%) | 18 (5.2%) |
| 20 to 24 Years | 1 (0.6%) | 16 (4.7%) |
| 25 to 29 Years | 8 (4.7%) | 20 (5.8%) |
| 30 to 34 Years | 12 (7.0%) | 19 (5.5%) |
| 35 to 39 Years | 10 (5.9%) | 0 (0.0%) |
| 40 to 44 Years | 11 (6.4%) | 121 (35.3%) |
| 45 to 49 Years | 6 (3.5%) | 20 (5.8%) |
| 50 to 54 Years | 22 (12.9%) | 10 (2.9%) |
| 55 to 59 Years | 14 (8.2%) | 16 (4.7%) |
| 60 to 64 Years | 0 (0.0%) | 21 (6.1%) |
| 65 to 69 Years | 10 (5.9%) | 9 (2.6%) |
| 70 to 74 Years | 0 (0.0%) | 0 (0.0%) |
| 75 to 79 Years | 0 (0.0%) | 16 (4.7%) |
| 80 to 84 Years | 0 (0.0%) | 0 (0.0%) |
| 85 Years and over | 0 (0.0%) | 0 (0.0%) |
| Total | 171 (100.0%) | 343 (100.0%) |
Families and Households in Redwater
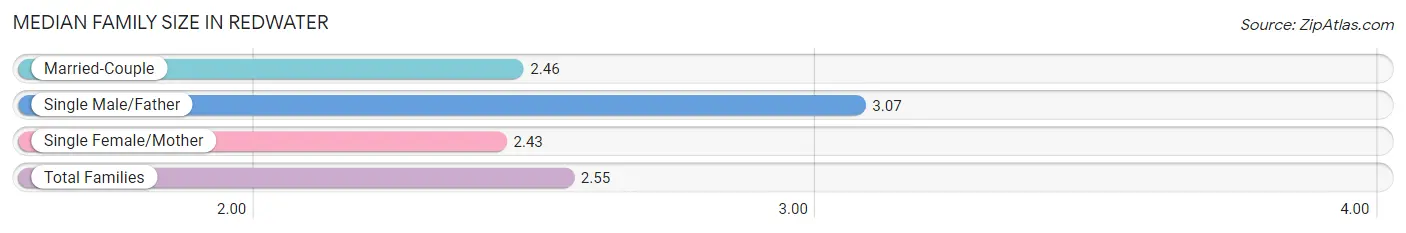
Median Family Size in Redwater
The median family size in Redwater is 2.55 persons per family, with single male/father families (27 | 15.4%) accounting for the largest median family size of 3.07 persons per family. On the other hand, single female/mother families (21 | 12.0%) represent the smallest median family size with 2.43 persons per family.
| Family Type | # Families | Family Size |
| Married-Couple | 127 (72.6%) | 2.46 |
| Single Male/Father | 27 (15.4%) | 3.07 |
| Single Female/Mother | 21 (12.0%) | 2.43 |
| Total Families | 175 (100.0%) | 2.55 |
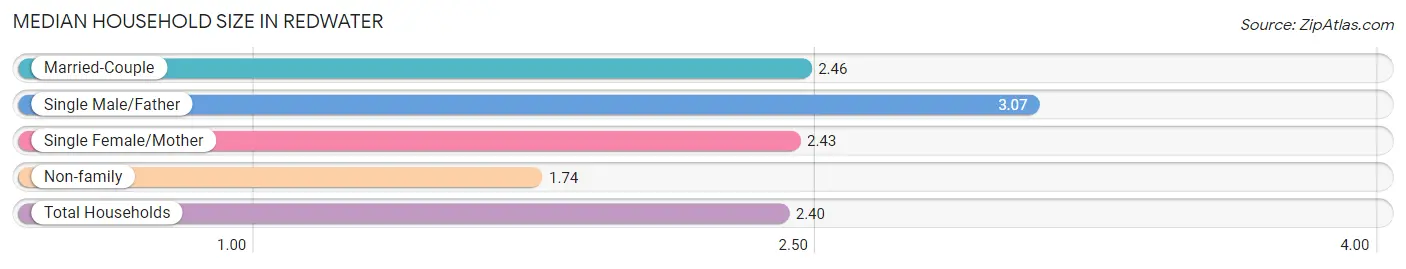
Median Household Size in Redwater
The median household size in Redwater is 2.40 persons per household, with single male/father households (27 | 12.6%) accounting for the largest median household size of 3.07 persons per household. non-family households (39 | 18.2%) represent the smallest median household size with 1.74 persons per household.
| Household Type | # Households | Household Size |
| Married-Couple | 127 (59.4%) | 2.46 |
| Single Male/Father | 27 (12.6%) | 3.07 |
| Single Female/Mother | 21 (9.8%) | 2.43 |
| Non-family | 39 (18.2%) | 1.74 |
| Total Households | 214 (100.0%) | 2.40 |
Household Size by Marriage Status in Redwater
Out of a total of 214 households in Redwater, 175 (81.8%) are family households, while 39 (18.2%) are nonfamily households. The most numerous type of family households are 4-person households, comprising 91, and the most common type of nonfamily households are 1-person households, comprising 29.
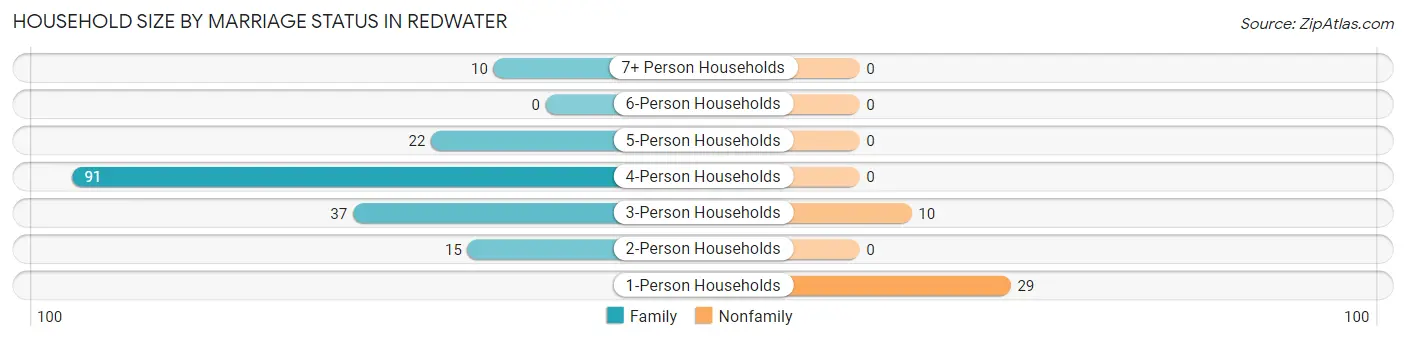
| Household Size | Family Households | Nonfamily Households |
| 1-Person Households | - | 29 (13.6%) |
| 2-Person Households | 15 (7.0%) | 0 (0.0%) |
| 3-Person Households | 37 (17.3%) | 10 (4.7%) |
| 4-Person Households | 91 (42.5%) | 0 (0.0%) |
| 5-Person Households | 22 (10.3%) | 0 (0.0%) |
| 6-Person Households | 0 (0.0%) | 0 (0.0%) |
| 7+ Person Households | 10 (4.7%) | 0 (0.0%) |
| Total | 175 (81.8%) | 39 (18.2%) |
Female Fertility in Redwater
Fertility by Age in Redwater
| Age Bracket | Women with Births | Births / 1,000 Women |
| 15 to 19 years | 0 (0.0%) | 0.0 |
| 20 to 34 years | 0 (0.0%) | 0.0 |
| 35 to 50 years | 0 (0.0%) | 0.0 |
| Total | 0 (0.0%) | 0.0 |
Fertility by Age by Marriage Status in Redwater
| Age Bracket | Married | Unmarried |
| 15 to 19 years | 0 (0.0%) | 0 (0.0%) |
| 20 to 34 years | 0 (0.0%) | 0 (0.0%) |
| 35 to 50 years | 0 (0.0%) | 0 (0.0%) |
| Total | 0 (0.0%) | 0 (0.0%) |
Fertility by Education in Redwater
| Educational Attainment | Women with Births | Births / 1,000 Women |
| Less than High School | 0 (0.0%) | 0.0 |
| High School Diploma | 0 (0.0%) | 0.0 |
| College or Associate's Degree | 0 (0.0%) | 0.0 |
| Bachelor's Degree | 0 (0.0%) | 0.0 |
| Graduate Degree | 0 (0.0%) | 0.0 |
| Total | 0 (0.0%) | 0.0 |
Fertility by Education by Marriage Status in Redwater
| Educational Attainment | Married | Unmarried |
| Less than High School | 0 (0.0%) | 0 (0.0%) |
| High School Diploma | 0 (0.0%) | 0 (0.0%) |
| College or Associate's Degree | 0 (0.0%) | 0 (0.0%) |
| Bachelor's Degree | 0 (0.0%) | 0 (0.0%) |
| Graduate Degree | 0 (0.0%) | 0 (0.0%) |
| Total | 0 (0.0%) | 0 (0.0%) |
Employment Characteristics in Redwater
Employment by Class of Employer in Redwater
Among the 193 employed individuals in Redwater, federal government employees (80 | 41.4%), private company employees (72 | 37.3%), and local government employees (41 | 21.2%) make up the most common classes of employment.
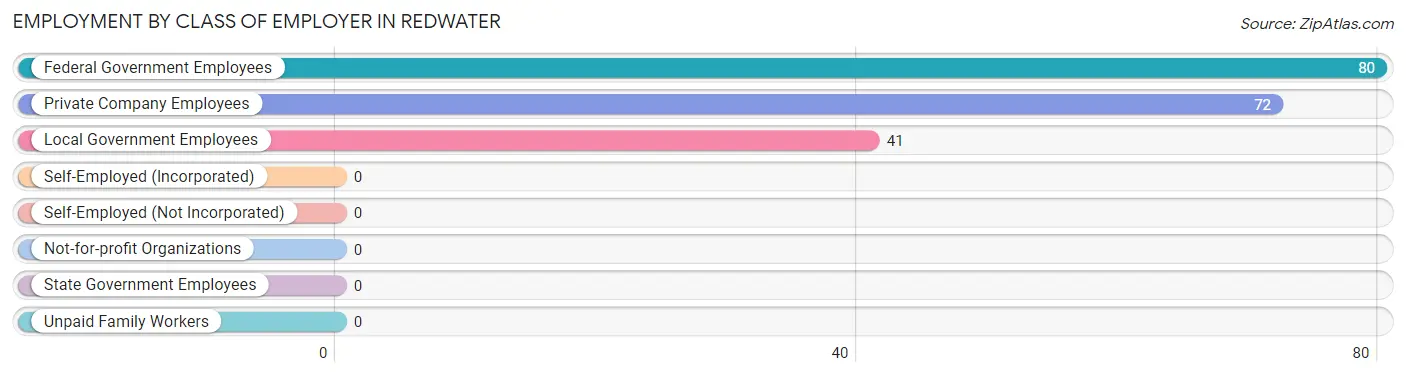
| Employer Class | # Employees | % Employees |
| Private Company Employees | 72 | 37.3% |
| Self-Employed (Incorporated) | 0 | 0.0% |
| Self-Employed (Not Incorporated) | 0 | 0.0% |
| Not-for-profit Organizations | 0 | 0.0% |
| Local Government Employees | 41 | 21.2% |
| State Government Employees | 0 | 0.0% |
| Federal Government Employees | 80 | 41.4% |
| Unpaid Family Workers | 0 | 0.0% |
| Total | 193 | 100.0% |
Employment Status by Age in Redwater
According to the labor force statistics for Redwater, out of the total population over 16 years of age (392), 58.4% or 229 individuals are in the labor force, with 15.7% or 36 of them unemployed. The age group with the highest labor force participation rate is 30 to 34 years, with 100.0% or 31 individuals in the labor force. Within the labor force, the 20 to 24 years age range has the highest percentage of unemployed individuals, with 100.0% or 16 of them being unemployed.
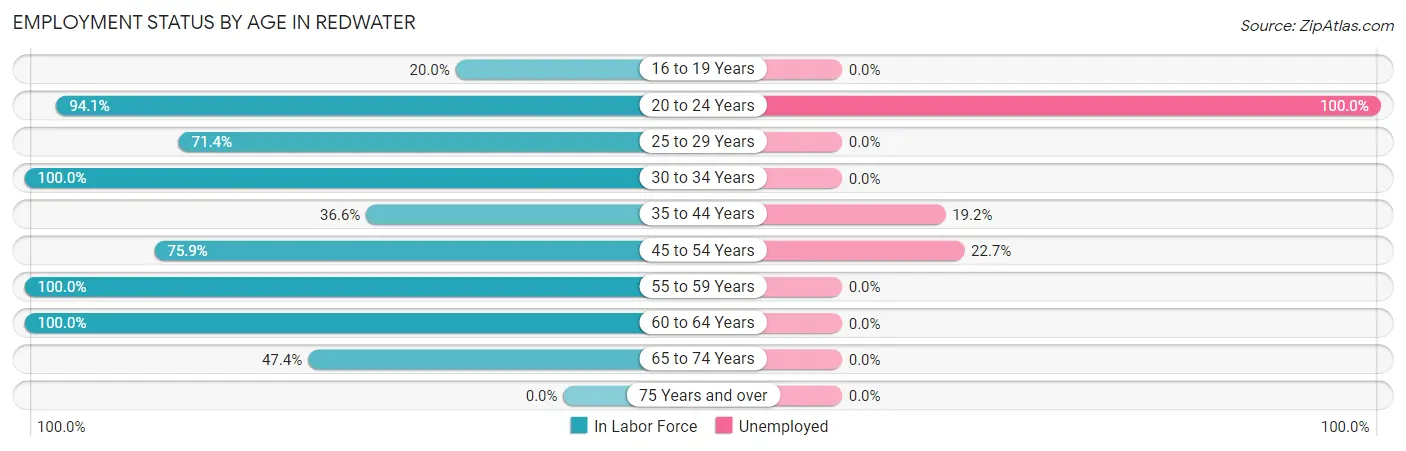
| Age Bracket | In Labor Force | Unemployed |
| 16 to 19 Years | 6 (20.0%) | 0 (0.0%) |
| 20 to 24 Years | 16 (94.1%) | 16 (100.0%) |
| 25 to 29 Years | 20 (71.4%) | 0 (0.0%) |
| 30 to 34 Years | 31 (100.0%) | 0 (0.0%) |
| 35 to 44 Years | 52 (36.6%) | 10 (19.2%) |
| 45 to 54 Years | 44 (75.9%) | 10 (22.7%) |
| 55 to 59 Years | 30 (100.0%) | 0 (0.0%) |
| 60 to 64 Years | 21 (100.0%) | 0 (0.0%) |
| 65 to 74 Years | 9 (47.4%) | 0 (0.0%) |
| 75 Years and over | 0 (0.0%) | 0 (0.0%) |
| Total | 229 (58.4%) | 36 (15.7%) |
Employment Status by Educational Attainment in Redwater
According to labor force statistics for Redwater, 63.9% of individuals (198) out of the total population between 25 and 64 years of age (310) are in the labor force, with 10.1% or 20 of them being unemployed. The group with the highest labor force participation rate are those with the educational attainment of college / associate degree, with 100.0% or 61 individuals in the labor force. Within the labor force, individuals with less than high school education have the highest percentage of unemployment, with 66.7% or 20 of them being unemployed.
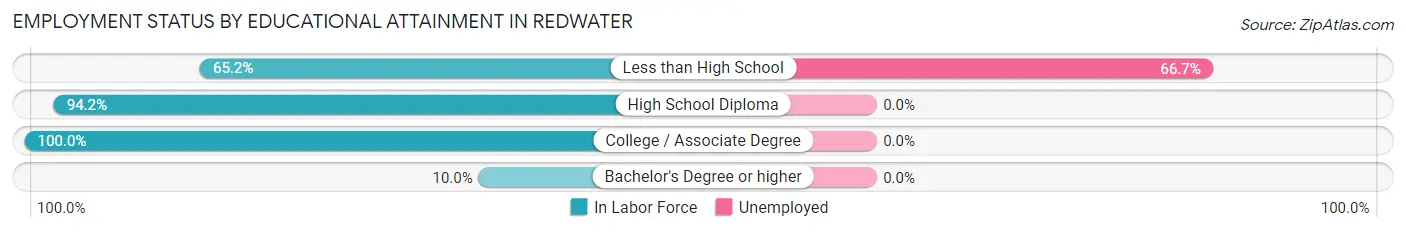
| Educational Attainment | In Labor Force | Unemployed |
| Less than High School | 30 (65.2%) | 31 (66.7%) |
| High School Diploma | 97 (94.2%) | 0 (0.0%) |
| College / Associate Degree | 61 (100.0%) | 0 (0.0%) |
| Bachelor's Degree or higher | 10 (10.0%) | 0 (0.0%) |
| Total | 198 (63.9%) | 31 (10.1%) |
Employment Occupations by Sex in Redwater
Management, Business, Science and Arts Occupations
The most common Management, Business, Science and Arts occupations in Redwater are Community & Social Service (29 | 15.0%), and Education Instruction & Library (29 | 15.0%).
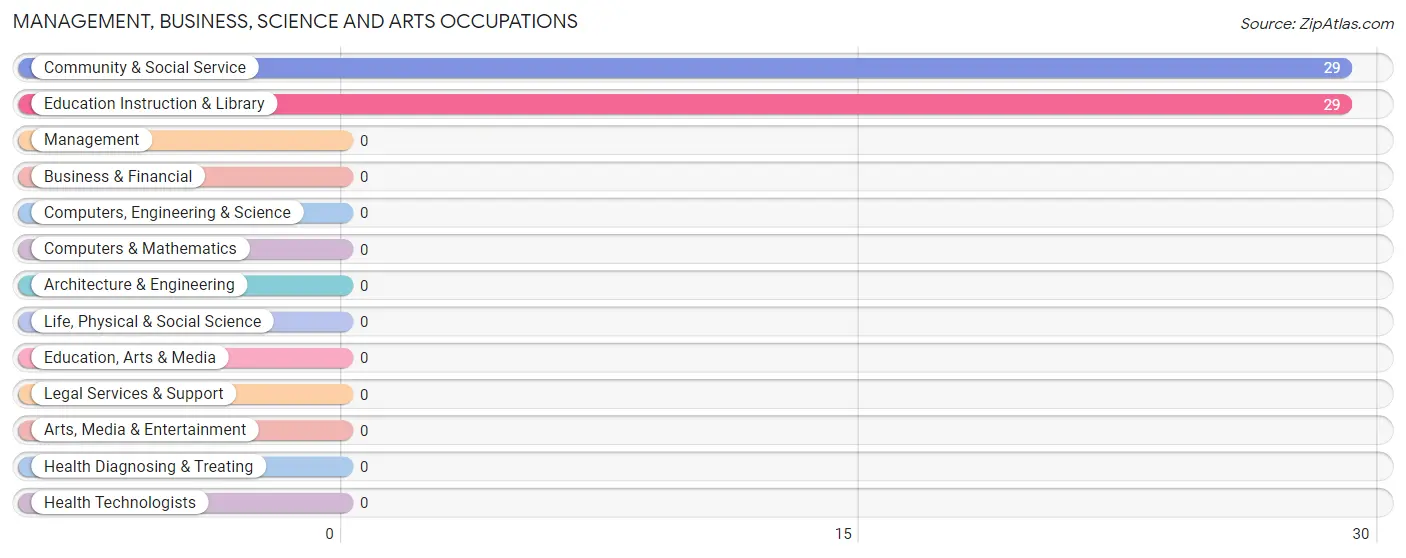
Management, Business, Science and Arts Occupations by Sex
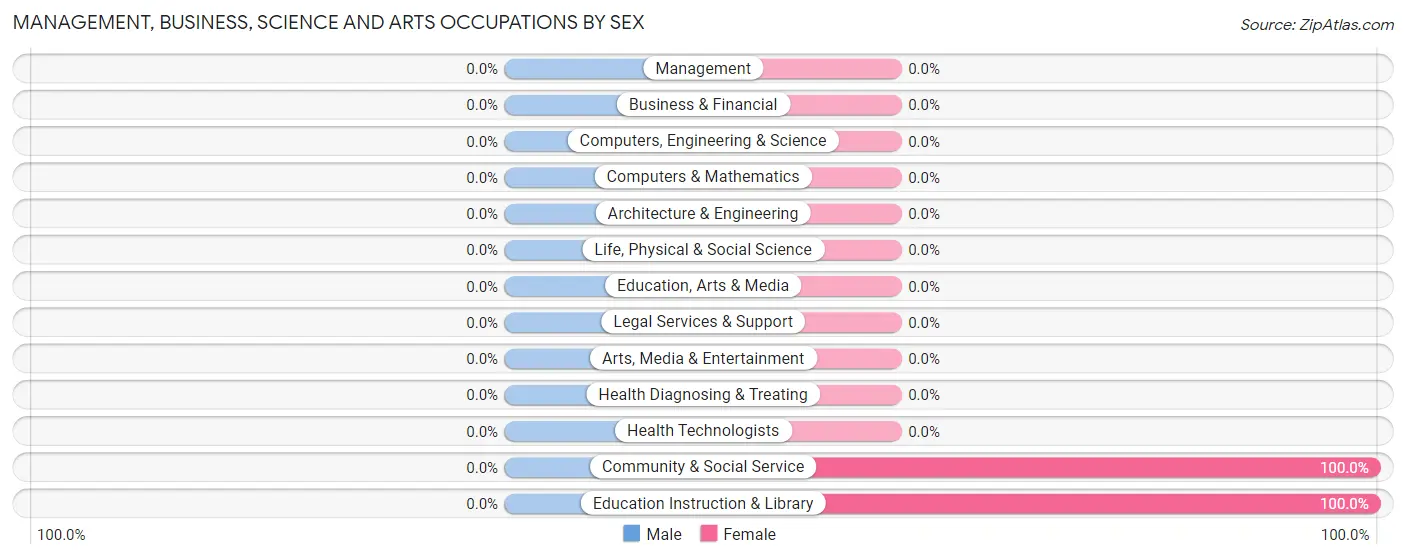
| Occupation | Male | Female |
| Management | 0 (0.0%) | 0 (0.0%) |
| Business & Financial | 0 (0.0%) | 0 (0.0%) |
| Computers, Engineering & Science | 0 (0.0%) | 0 (0.0%) |
| Computers & Mathematics | 0 (0.0%) | 0 (0.0%) |
| Architecture & Engineering | 0 (0.0%) | 0 (0.0%) |
| Life, Physical & Social Science | 0 (0.0%) | 0 (0.0%) |
| Community & Social Service | 0 (0.0%) | 29 (100.0%) |
| Education, Arts & Media | 0 (0.0%) | 0 (0.0%) |
| Legal Services & Support | 0 (0.0%) | 0 (0.0%) |
| Education Instruction & Library | 0 (0.0%) | 29 (100.0%) |
| Arts, Media & Entertainment | 0 (0.0%) | 0 (0.0%) |
| Health Diagnosing & Treating | 0 (0.0%) | 0 (0.0%) |
| Health Technologists | 0 (0.0%) | 0 (0.0%) |
| Total (Category) | 0 (0.0%) | 29 (100.0%) |
| Total (Overall) | 51 (26.4%) | 142 (73.6%) |
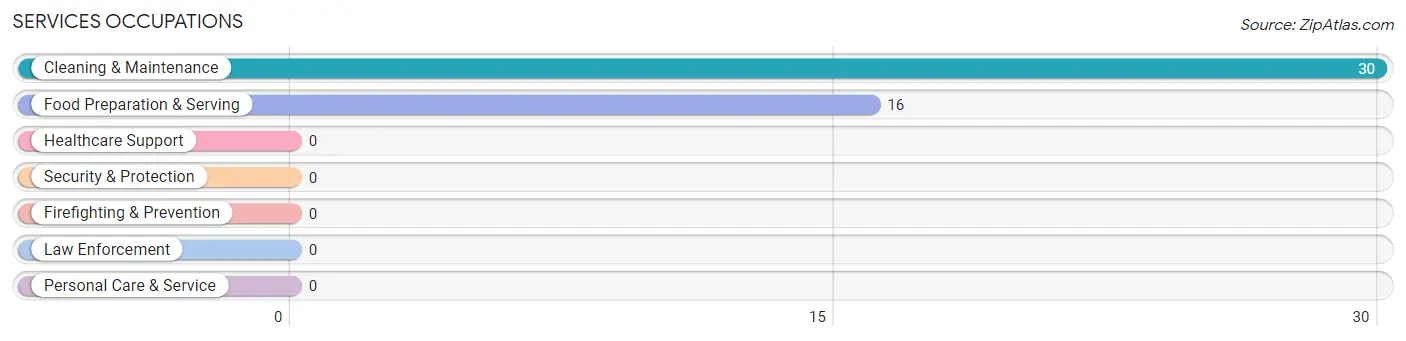
Services Occupations
The most common Services occupations in Redwater are Cleaning & Maintenance (30 | 15.5%), and Food Preparation & Serving (16 | 8.3%).
Services Occupations by Sex
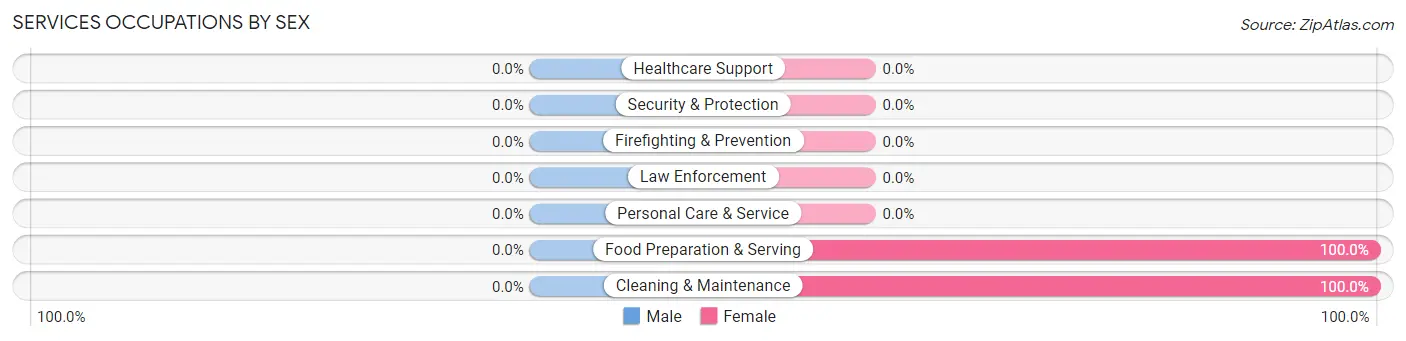
| Occupation | Male | Female |
| Healthcare Support | 0 (0.0%) | 0 (0.0%) |
| Security & Protection | 0 (0.0%) | 0 (0.0%) |
| Firefighting & Prevention | 0 (0.0%) | 0 (0.0%) |
| Law Enforcement | 0 (0.0%) | 0 (0.0%) |
| Food Preparation & Serving | 0 (0.0%) | 16 (100.0%) |
| Cleaning & Maintenance | 0 (0.0%) | 30 (100.0%) |
| Personal Care & Service | 0 (0.0%) | 0 (0.0%) |
| Total (Category) | 0 (0.0%) | 46 (100.0%) |
| Total (Overall) | 51 (26.4%) | 142 (73.6%) |
Sales and Office Occupations
The most common Sales and Office occupations in Redwater are Office & Administration (26 | 13.5%), and Sales & Related (12 | 6.2%).
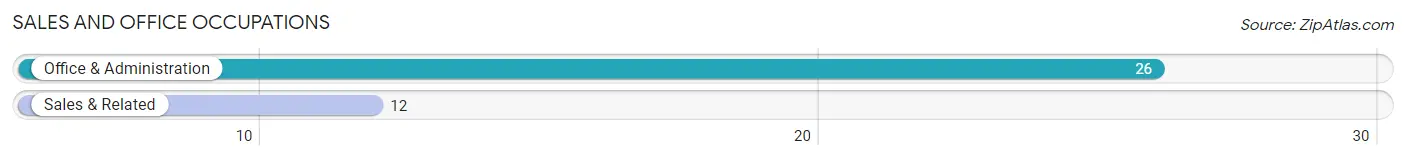
Sales and Office Occupations by Sex
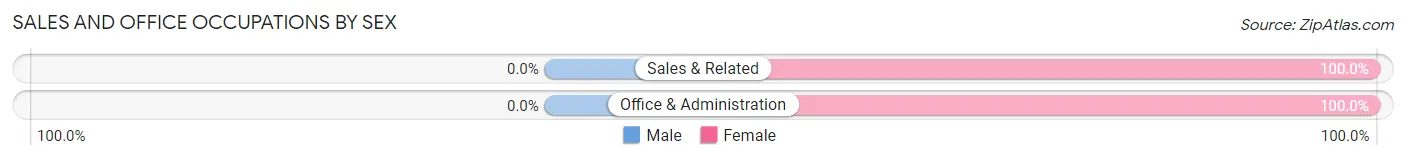
| Occupation | Male | Female |
| Sales & Related | 0 (0.0%) | 12 (100.0%) |
| Office & Administration | 0 (0.0%) | 26 (100.0%) |
| Total (Category) | 0 (0.0%) | 38 (100.0%) |
| Total (Overall) | 51 (26.4%) | 142 (73.6%) |
Natural Resources, Construction and Maintenance Occupations
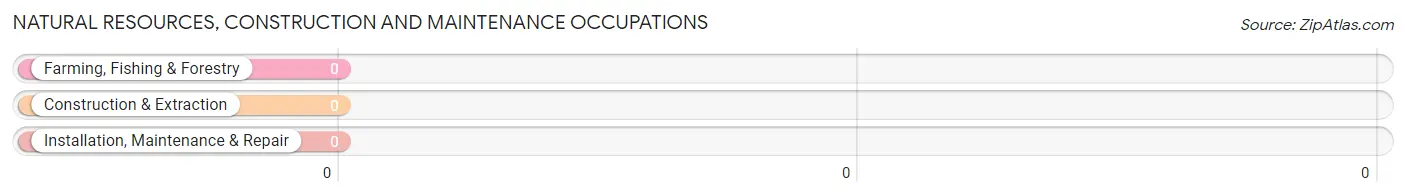
Natural Resources, Construction and Maintenance Occupations by Sex
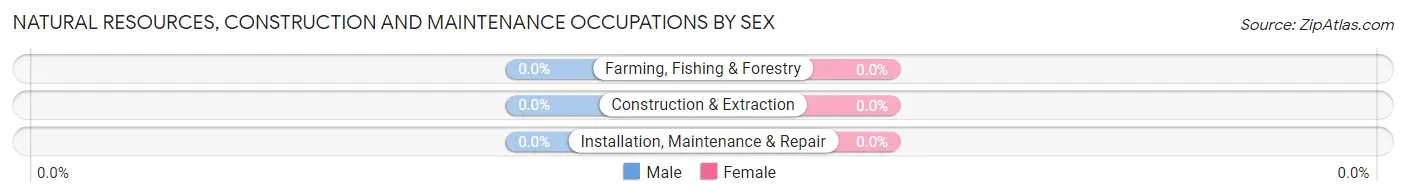
| Occupation | Male | Female |
| Farming, Fishing & Forestry | 0 (0.0%) | 0 (0.0%) |
| Construction & Extraction | 0 (0.0%) | 0 (0.0%) |
| Installation, Maintenance & Repair | 0 (0.0%) | 0 (0.0%) |
| Total (Category) | 0 (0.0%) | 0 (0.0%) |
| Total (Overall) | 51 (26.4%) | 142 (73.6%) |
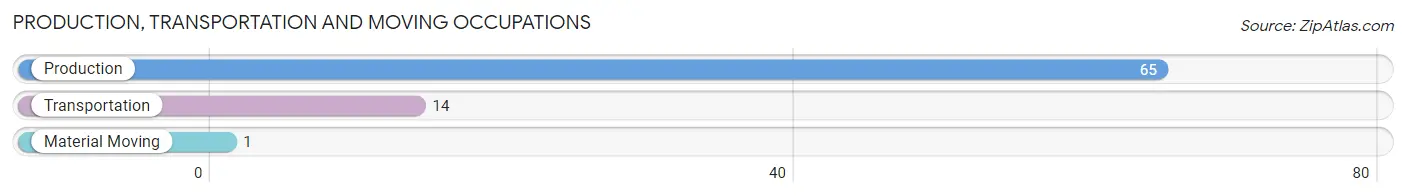
Production, Transportation and Moving Occupations
The most common Production, Transportation and Moving occupations in Redwater are Production (65 | 33.7%), Transportation (14 | 7.2%), and Material Moving (1 | 0.5%).
Production, Transportation and Moving Occupations by Sex
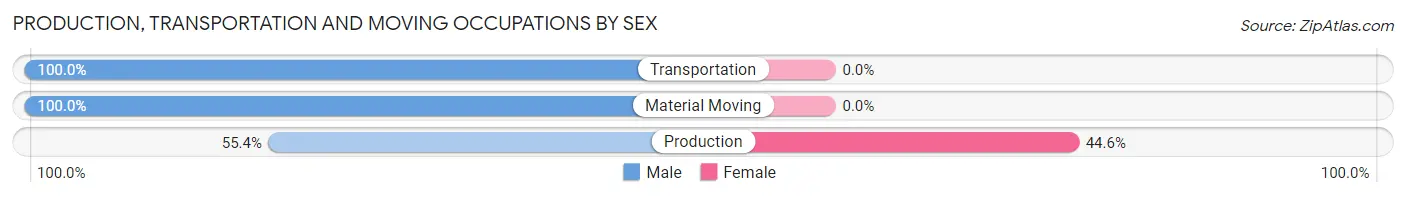
| Occupation | Male | Female |
| Production | 36 (55.4%) | 29 (44.6%) |
| Transportation | 14 (100.0%) | 0 (0.0%) |
| Material Moving | 1 (100.0%) | 0 (0.0%) |
| Total (Category) | 51 (63.7%) | 29 (36.2%) |
| Total (Overall) | 51 (26.4%) | 142 (73.6%) |
Employment Industries by Sex in Redwater
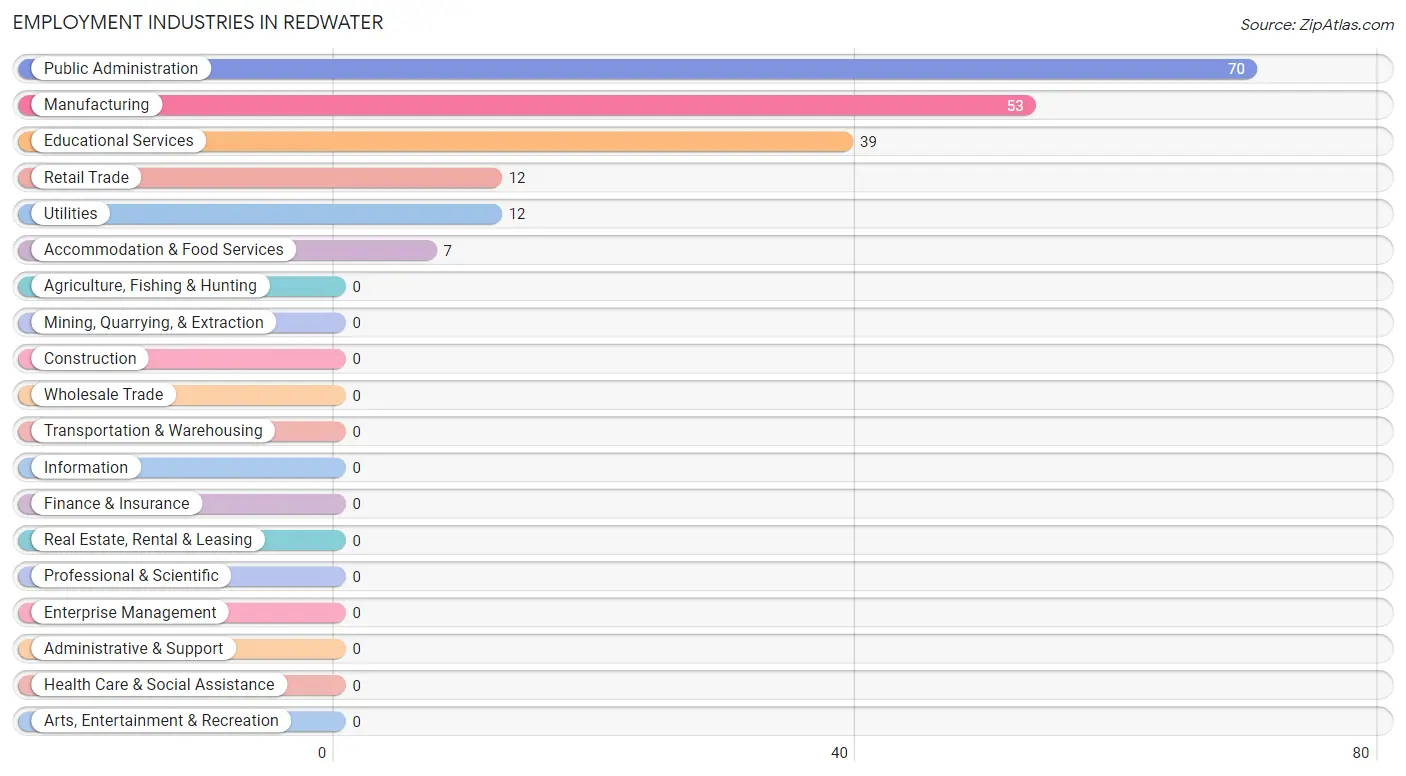
Employment Industries in Redwater
The major employment industries in Redwater include Public Administration (70 | 36.3%), Manufacturing (53 | 27.5%), Educational Services (39 | 20.2%), Retail Trade (12 | 6.2%), and Utilities (12 | 6.2%).
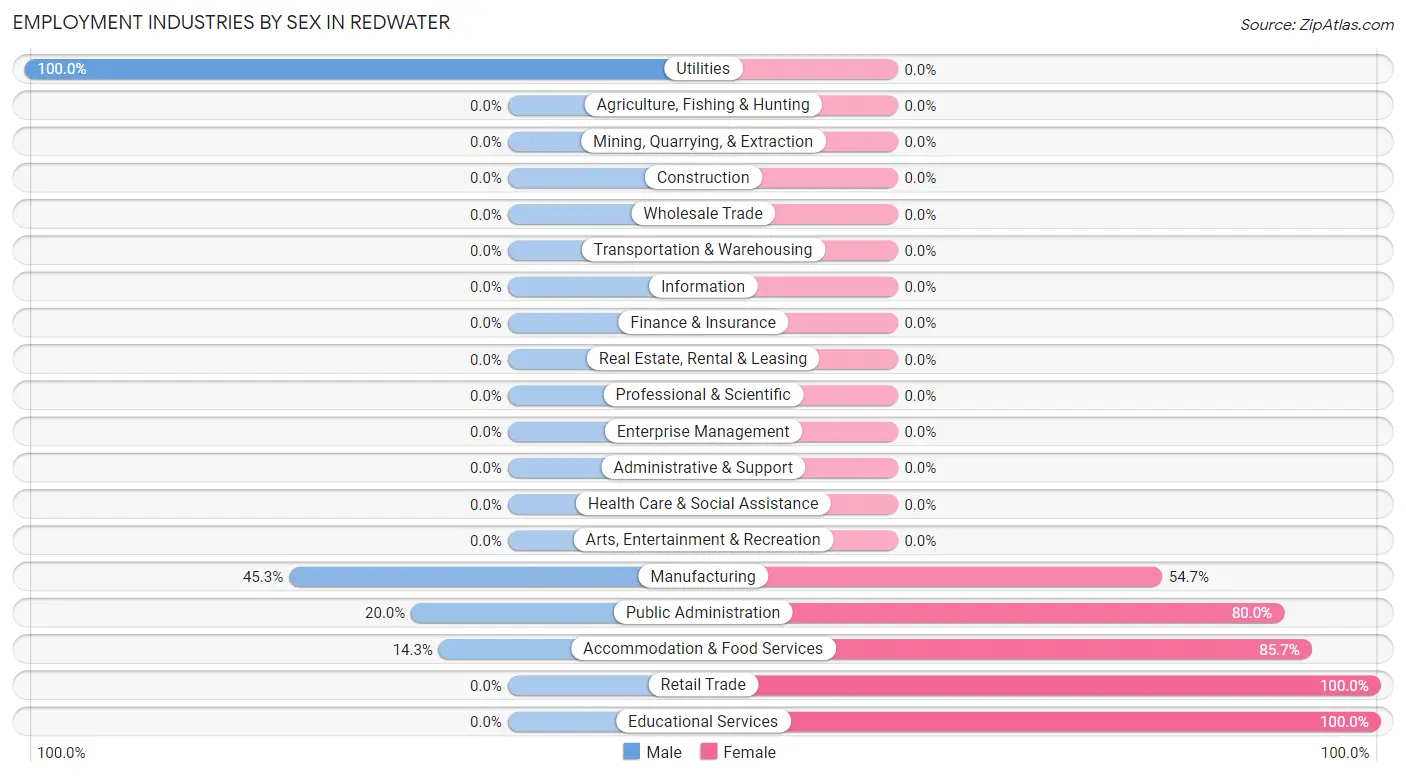
Employment Industries by Sex in Redwater
The Redwater industries that see more men than women are Utilities (100.0%), Manufacturing (45.3%), and Public Administration (20.0%), whereas the industries that tend to have a higher number of women are Retail Trade (100.0%), Educational Services (100.0%), and Accommodation & Food Services (85.7%).
| Industry | Male | Female |
| Agriculture, Fishing & Hunting | 0 (0.0%) | 0 (0.0%) |
| Mining, Quarrying, & Extraction | 0 (0.0%) | 0 (0.0%) |
| Construction | 0 (0.0%) | 0 (0.0%) |
| Manufacturing | 24 (45.3%) | 29 (54.7%) |
| Wholesale Trade | 0 (0.0%) | 0 (0.0%) |
| Retail Trade | 0 (0.0%) | 12 (100.0%) |
| Transportation & Warehousing | 0 (0.0%) | 0 (0.0%) |
| Utilities | 12 (100.0%) | 0 (0.0%) |
| Information | 0 (0.0%) | 0 (0.0%) |
| Finance & Insurance | 0 (0.0%) | 0 (0.0%) |
| Real Estate, Rental & Leasing | 0 (0.0%) | 0 (0.0%) |
| Professional & Scientific | 0 (0.0%) | 0 (0.0%) |
| Enterprise Management | 0 (0.0%) | 0 (0.0%) |
| Administrative & Support | 0 (0.0%) | 0 (0.0%) |
| Educational Services | 0 (0.0%) | 39 (100.0%) |
| Health Care & Social Assistance | 0 (0.0%) | 0 (0.0%) |
| Arts, Entertainment & Recreation | 0 (0.0%) | 0 (0.0%) |
| Accommodation & Food Services | 1 (14.3%) | 6 (85.7%) |
| Public Administration | 14 (20.0%) | 56 (80.0%) |
| Total | 51 (26.4%) | 142 (73.6%) |
Education in Redwater
School Enrollment in Redwater
The most common levels of schooling among the 153 students in Redwater are high school (43 | 28.1%), middle school (40 | 26.1%), and college / undergraduate (26 | 17.0%).
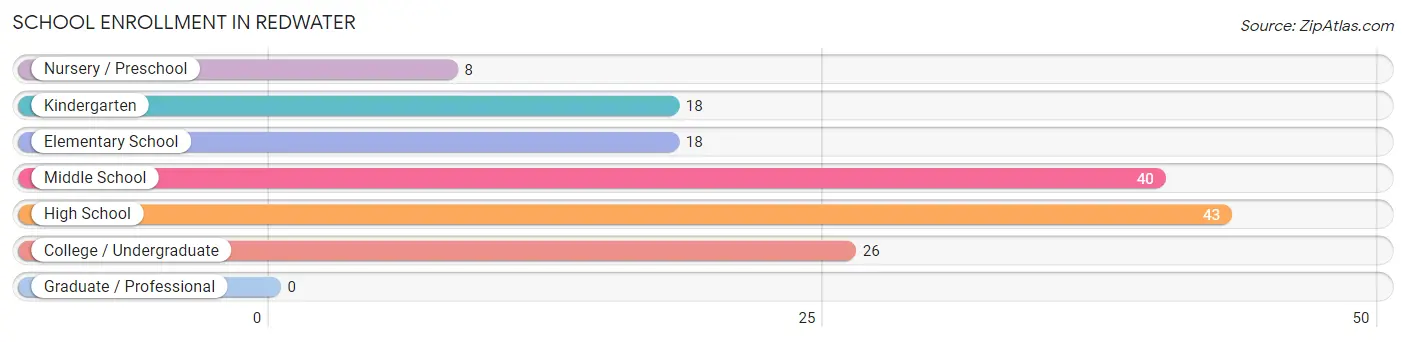
| School Level | # Students | % Students |
| Nursery / Preschool | 8 | 5.2% |
| Kindergarten | 18 | 11.8% |
| Elementary School | 18 | 11.8% |
| Middle School | 40 | 26.1% |
| High School | 43 | 28.1% |
| College / Undergraduate | 26 | 17.0% |
| Graduate / Professional | 0 | 0.0% |
| Total | 153 | 100.0% |
School Enrollment by Age by Funding Source in Redwater
Out of a total of 153 students who are enrolled in schools in Redwater, 38 (24.8%) attend a private institution, while the remaining 115 (75.2%) are enrolled in public schools. The age group of 15 to 17 year olds has the highest likelihood of being enrolled in private schools, with 21 (77.8% in the age bracket) enrolled. Conversely, the age group of 3 to 4 year olds has the lowest likelihood of being enrolled in a private school, with 8 (100.0% in the age bracket) attending a public institution.
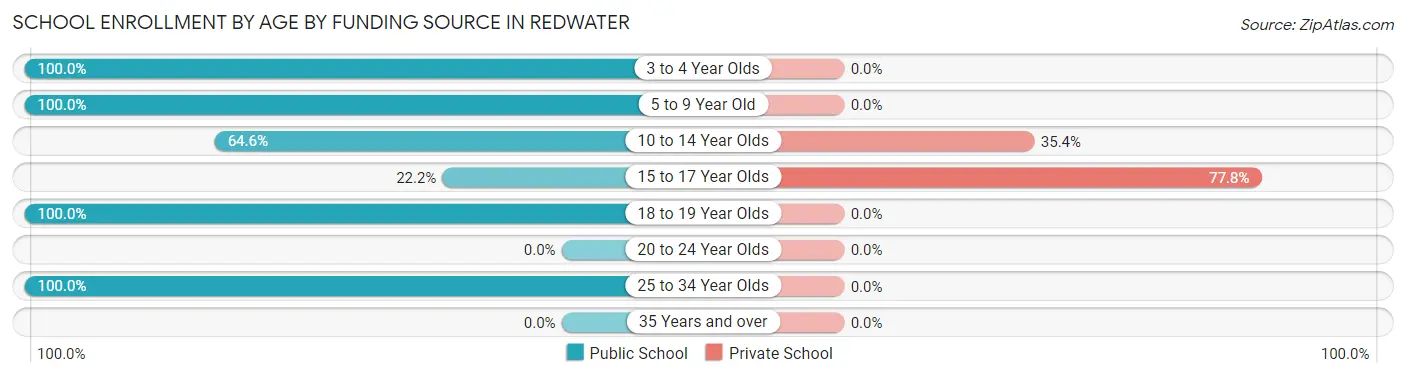
| Age Bracket | Public School | Private School |
| 3 to 4 Year Olds | 8 (100.0%) | 0 (0.0%) |
| 5 to 9 Year Old | 44 (100.0%) | 0 (0.0%) |
| 10 to 14 Year Olds | 31 (64.6%) | 17 (35.4%) |
| 15 to 17 Year Olds | 6 (22.2%) | 21 (77.8%) |
| 18 to 19 Year Olds | 6 (100.0%) | 0 (0.0%) |
| 20 to 24 Year Olds | 0 (0.0%) | 0 (0.0%) |
| 25 to 34 Year Olds | 20 (100.0%) | 0 (0.0%) |
| 35 Years and over | 0 (0.0%) | 0 (0.0%) |
| Total | 115 (75.2%) | 38 (24.8%) |
Educational Attainment by Field of Study in Redwater
Education (81 | 69.8%), visual & performing arts (16 | 13.8%), business (10 | 8.6%), and engineering (9 | 7.8%) are the most common fields of study among 116 individuals in Redwater who have obtained a bachelor's degree or higher.
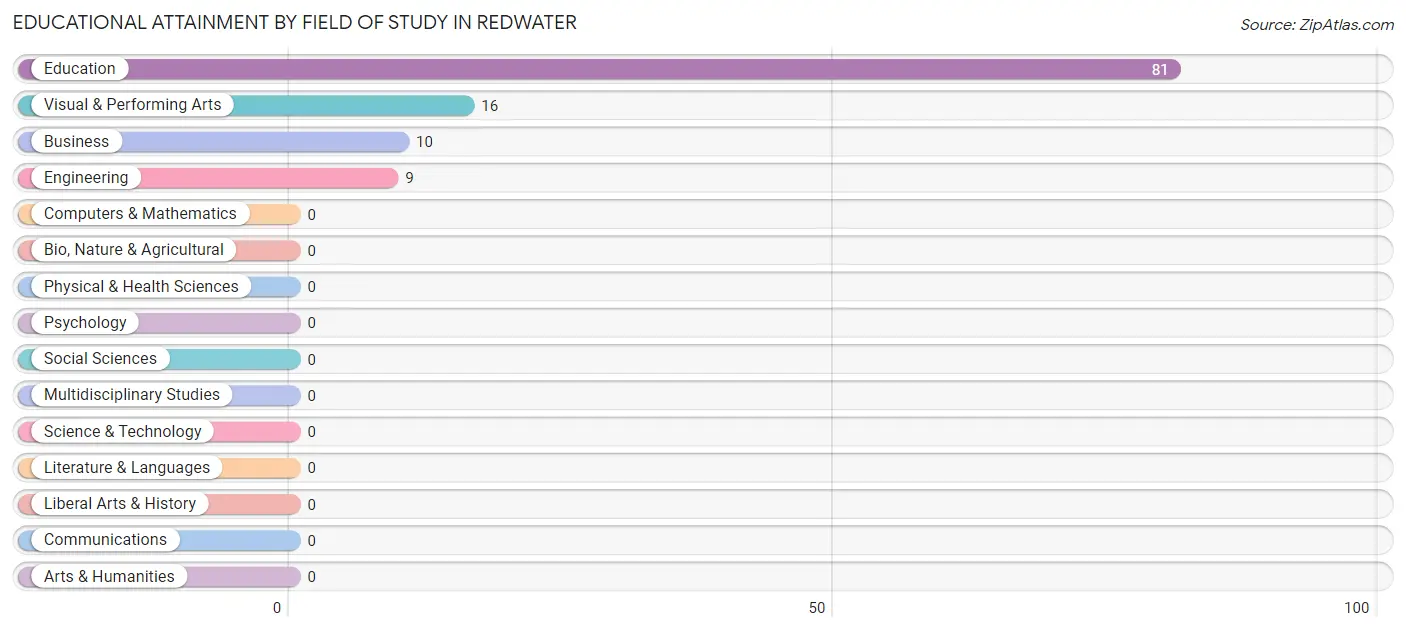
| Field of Study | # Graduates | % Graduates |
| Computers & Mathematics | 0 | 0.0% |
| Bio, Nature & Agricultural | 0 | 0.0% |
| Physical & Health Sciences | 0 | 0.0% |
| Psychology | 0 | 0.0% |
| Social Sciences | 0 | 0.0% |
| Engineering | 9 | 7.8% |
| Multidisciplinary Studies | 0 | 0.0% |
| Science & Technology | 0 | 0.0% |
| Business | 10 | 8.6% |
| Education | 81 | 69.8% |
| Literature & Languages | 0 | 0.0% |
| Liberal Arts & History | 0 | 0.0% |
| Visual & Performing Arts | 16 | 13.8% |
| Communications | 0 | 0.0% |
| Arts & Humanities | 0 | 0.0% |
| Total | 116 | 100.0% |
Transportation & Commute in Redwater
Vehicle Availability by Sex in Redwater
The most prevalent vehicle ownership categories in Redwater are males with 2 vehicles (26, accounting for 51.0%) and females with 2 vehicles (40, making up 18.3%).
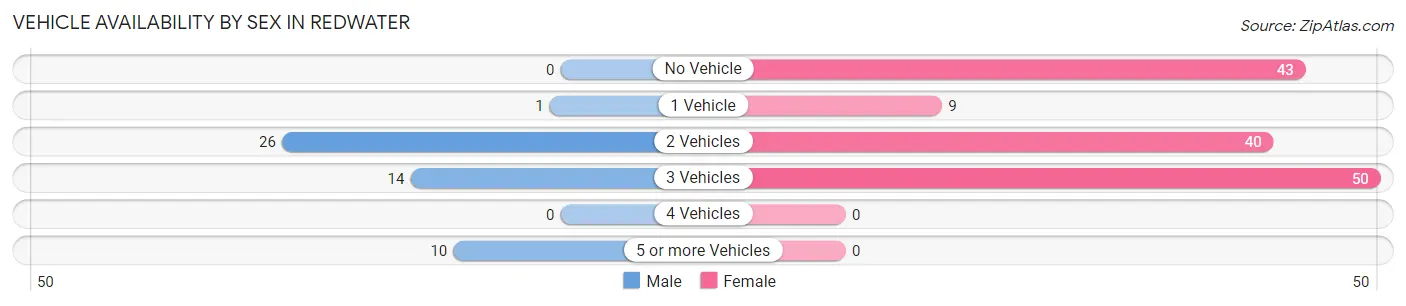
| Vehicles Available | Male | Female |
| No Vehicle | 0 (0.0%) | 43 (30.3%) |
| 1 Vehicle | 1 (2.0%) | 9 (6.3%) |
| 2 Vehicles | 26 (51.0%) | 40 (28.2%) |
| 3 Vehicles | 14 (27.5%) | 50 (35.2%) |
| 4 Vehicles | 0 (0.0%) | 0 (0.0%) |
| 5 or more Vehicles | 10 (19.6%) | 0 (0.0%) |
| Total | 51 (100.0%) | 142 (100.0%) |
Commute Time in Redwater
The most frequently occuring commute durations in Redwater are 10 to 14 minutes (62 commuters, 32.1%), 30 to 34 minutes (48 commuters, 24.9%), and 5 to 9 minutes (46 commuters, 23.8%).
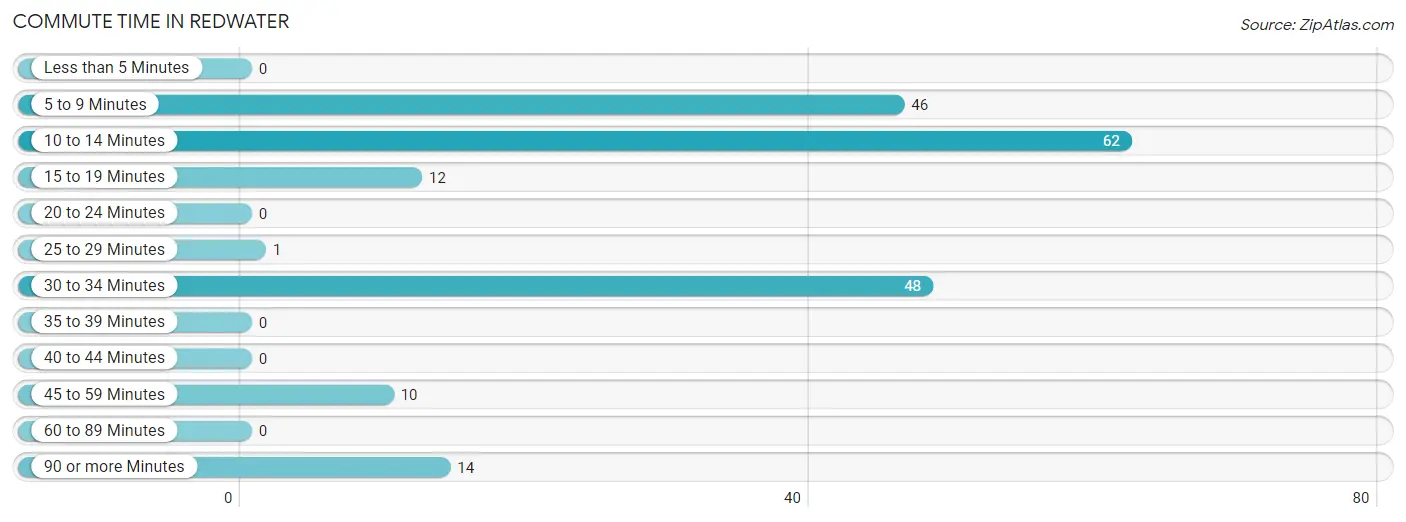
| Commute Time | # Commuters | % Commuters |
| Less than 5 Minutes | 0 | 0.0% |
| 5 to 9 Minutes | 46 | 23.8% |
| 10 to 14 Minutes | 62 | 32.1% |
| 15 to 19 Minutes | 12 | 6.2% |
| 20 to 24 Minutes | 0 | 0.0% |
| 25 to 29 Minutes | 1 | 0.5% |
| 30 to 34 Minutes | 48 | 24.9% |
| 35 to 39 Minutes | 0 | 0.0% |
| 40 to 44 Minutes | 0 | 0.0% |
| 45 to 59 Minutes | 10 | 5.2% |
| 60 to 89 Minutes | 0 | 0.0% |
| 90 or more Minutes | 14 | 7.2% |
Commute Time by Sex in Redwater
The most common commute times in Redwater are 10 to 14 minutes (14 commuters, 27.5%) for males and 10 to 14 minutes (48 commuters, 33.8%) for females.
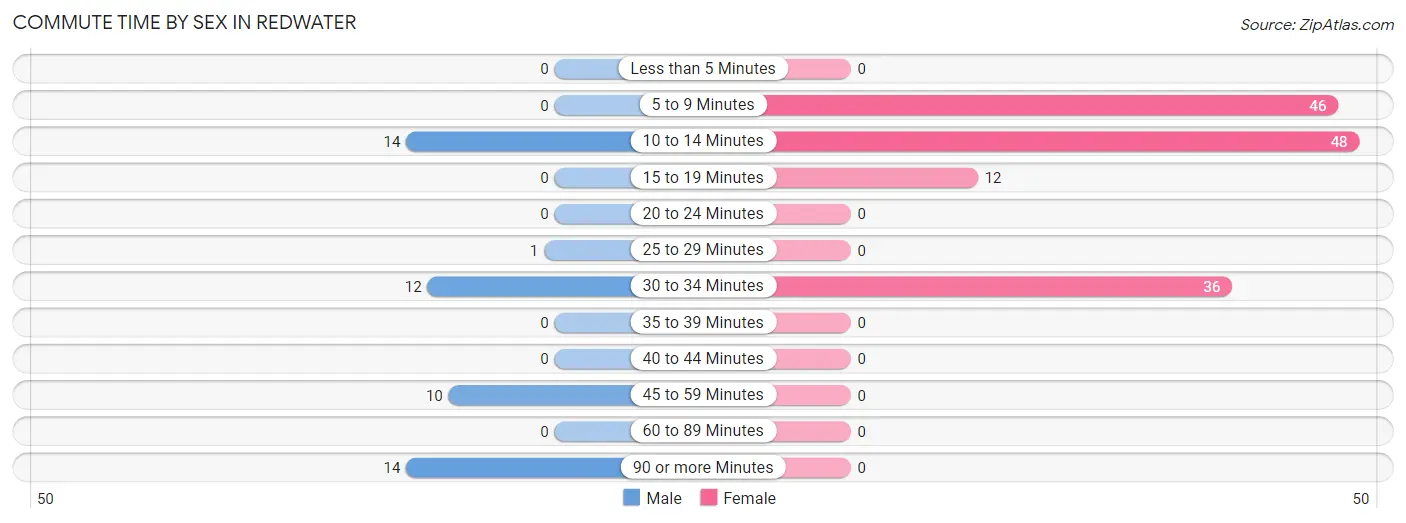
| Commute Time | Male | Female |
| Less than 5 Minutes | 0 (0.0%) | 0 (0.0%) |
| 5 to 9 Minutes | 0 (0.0%) | 46 (32.4%) |
| 10 to 14 Minutes | 14 (27.5%) | 48 (33.8%) |
| 15 to 19 Minutes | 0 (0.0%) | 12 (8.5%) |
| 20 to 24 Minutes | 0 (0.0%) | 0 (0.0%) |
| 25 to 29 Minutes | 1 (2.0%) | 0 (0.0%) |
| 30 to 34 Minutes | 12 (23.5%) | 36 (25.4%) |
| 35 to 39 Minutes | 0 (0.0%) | 0 (0.0%) |
| 40 to 44 Minutes | 0 (0.0%) | 0 (0.0%) |
| 45 to 59 Minutes | 10 (19.6%) | 0 (0.0%) |
| 60 to 89 Minutes | 0 (0.0%) | 0 (0.0%) |
| 90 or more Minutes | 14 (27.5%) | 0 (0.0%) |
Time of Departure to Work by Sex in Redwater
The most frequent times of departure to work in Redwater are 5:30 AM to 5:59 AM (14, 27.5%) for males and 7:30 AM to 7:59 AM (50, 35.2%) for females.
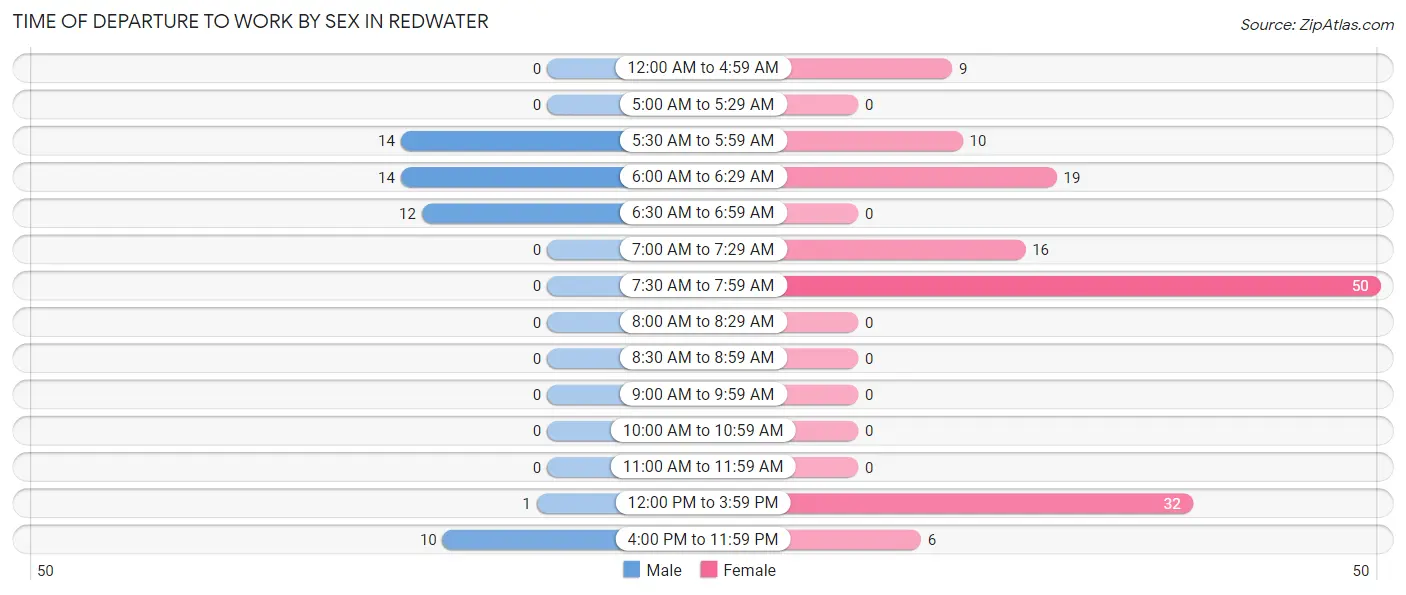
| Time of Departure | Male | Female |
| 12:00 AM to 4:59 AM | 0 (0.0%) | 9 (6.3%) |
| 5:00 AM to 5:29 AM | 0 (0.0%) | 0 (0.0%) |
| 5:30 AM to 5:59 AM | 14 (27.5%) | 10 (7.0%) |
| 6:00 AM to 6:29 AM | 14 (27.5%) | 19 (13.4%) |
| 6:30 AM to 6:59 AM | 12 (23.5%) | 0 (0.0%) |
| 7:00 AM to 7:29 AM | 0 (0.0%) | 16 (11.3%) |
| 7:30 AM to 7:59 AM | 0 (0.0%) | 50 (35.2%) |
| 8:00 AM to 8:29 AM | 0 (0.0%) | 0 (0.0%) |
| 8:30 AM to 8:59 AM | 0 (0.0%) | 0 (0.0%) |
| 9:00 AM to 9:59 AM | 0 (0.0%) | 0 (0.0%) |
| 10:00 AM to 10:59 AM | 0 (0.0%) | 0 (0.0%) |
| 11:00 AM to 11:59 AM | 0 (0.0%) | 0 (0.0%) |
| 12:00 PM to 3:59 PM | 1 (2.0%) | 32 (22.5%) |
| 4:00 PM to 11:59 PM | 10 (19.6%) | 6 (4.2%) |
| Total | 51 (100.0%) | 142 (100.0%) |
Housing Occupancy in Redwater
Occupancy by Ownership in Redwater
Of the total 214 dwellings in Redwater, owner-occupied units account for 183 (85.5%), while renter-occupied units make up 31 (14.5%).
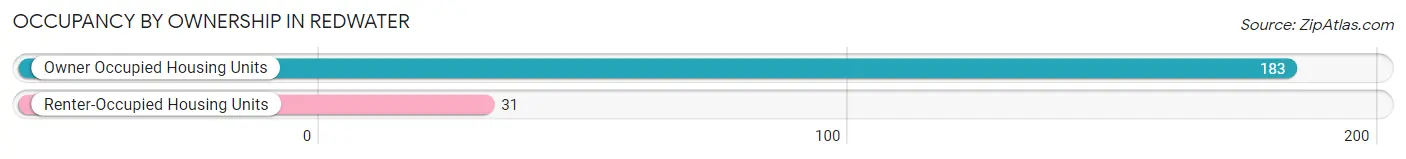
| Occupancy | # Housing Units | % Housing Units |
| Owner Occupied Housing Units | 183 | 85.5% |
| Renter-Occupied Housing Units | 31 | 14.5% |
| Total Occupied Housing Units | 214 | 100.0% |
Occupancy by Household Size in Redwater
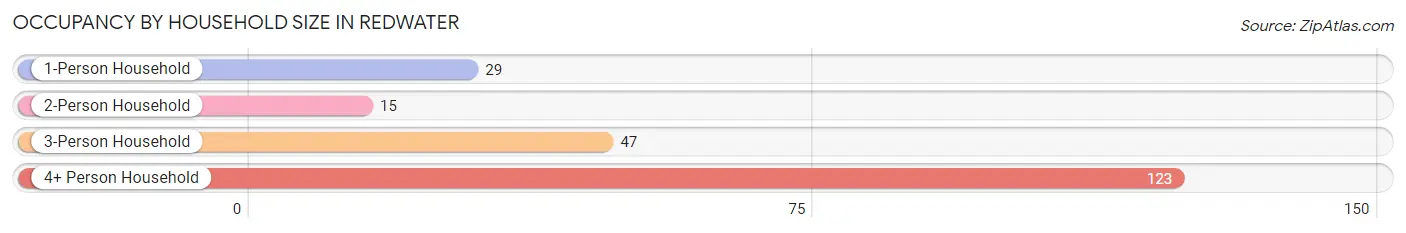
| Household Size | # Housing Units | % Housing Units |
| 1-Person Household | 29 | 13.6% |
| 2-Person Household | 15 | 7.0% |
| 3-Person Household | 47 | 22.0% |
| 4+ Person Household | 123 | 57.5% |
| Total Housing Units | 214 | 100.0% |
Occupancy by Ownership by Household Size in Redwater
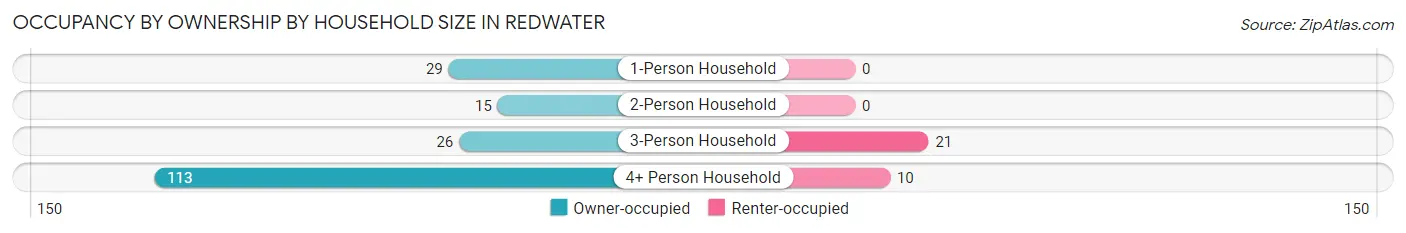
| Household Size | Owner-occupied | Renter-occupied |
| 1-Person Household | 29 (100.0%) | 0 (0.0%) |
| 2-Person Household | 15 (100.0%) | 0 (0.0%) |
| 3-Person Household | 26 (55.3%) | 21 (44.7%) |
| 4+ Person Household | 113 (91.9%) | 10 (8.1%) |
| Total Housing Units | 183 (85.5%) | 31 (14.5%) |
Occupancy by Educational Attainment in Redwater
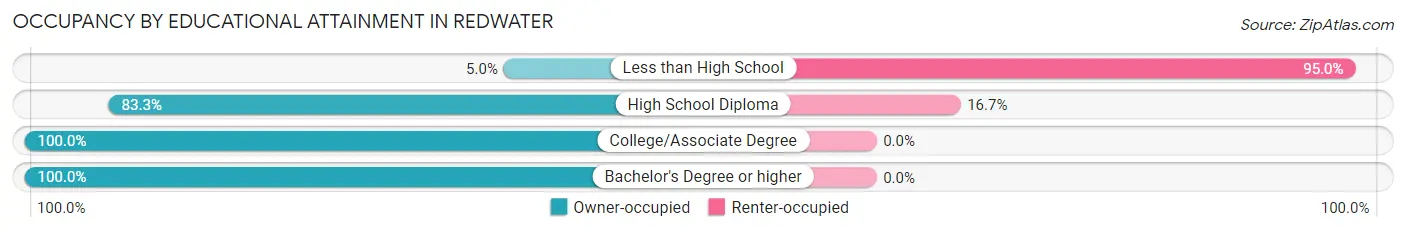
| Household Size | Owner-occupied | Renter-occupied |
| Less than High School | 1 (5.0%) | 19 (95.0%) |
| High School Diploma | 60 (83.3%) | 12 (16.7%) |
| College/Associate Degree | 31 (100.0%) | 0 (0.0%) |
| Bachelor's Degree or higher | 91 (100.0%) | 0 (0.0%) |
Occupancy by Age of Householder in Redwater
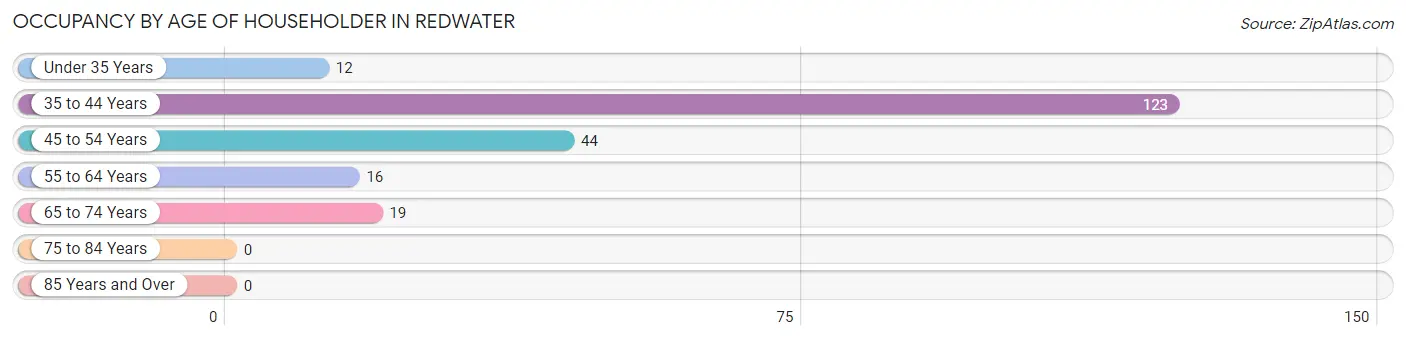
| Age Bracket | # Households | % Households |
| Under 35 Years | 12 | 5.6% |
| 35 to 44 Years | 123 | 57.5% |
| 45 to 54 Years | 44 | 20.6% |
| 55 to 64 Years | 16 | 7.5% |
| 65 to 74 Years | 19 | 8.9% |
| 75 to 84 Years | 0 | 0.0% |
| 85 Years and Over | 0 | 0.0% |
| Total | 214 | 100.0% |
Housing Finances in Redwater
Median Income by Occupancy in Redwater
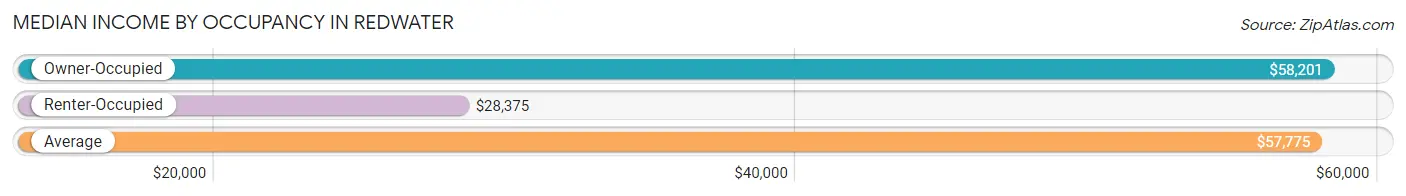
| Occupancy Type | # Households | Median Income |
| Owner-Occupied | 183 (85.5%) | $58,201 |
| Renter-Occupied | 31 (14.5%) | $28,375 |
| Average | 214 (100.0%) | $57,775 |
Occupancy by Householder Income Bracket in Redwater
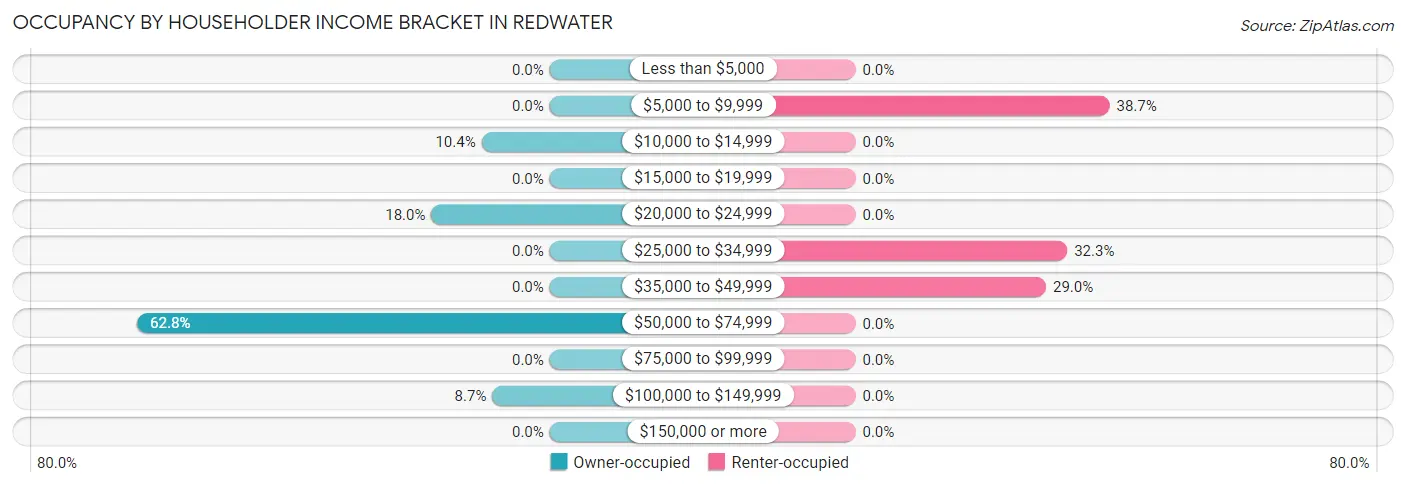
| Income Bracket | Owner-occupied | Renter-occupied |
| Less than $5,000 | 0 (0.0%) | 0 (0.0%) |
| $5,000 to $9,999 | 0 (0.0%) | 12 (38.7%) |
| $10,000 to $14,999 | 19 (10.4%) | 0 (0.0%) |
| $15,000 to $19,999 | 0 (0.0%) | 0 (0.0%) |
| $20,000 to $24,999 | 33 (18.0%) | 0 (0.0%) |
| $25,000 to $34,999 | 0 (0.0%) | 10 (32.3%) |
| $35,000 to $49,999 | 0 (0.0%) | 9 (29.0%) |
| $50,000 to $74,999 | 115 (62.8%) | 0 (0.0%) |
| $75,000 to $99,999 | 0 (0.0%) | 0 (0.0%) |
| $100,000 to $149,999 | 16 (8.7%) | 0 (0.0%) |
| $150,000 or more | 0 (0.0%) | 0 (0.0%) |
| Total | 183 (100.0%) | 31 (100.0%) |
Monthly Housing Cost Tiers in Redwater
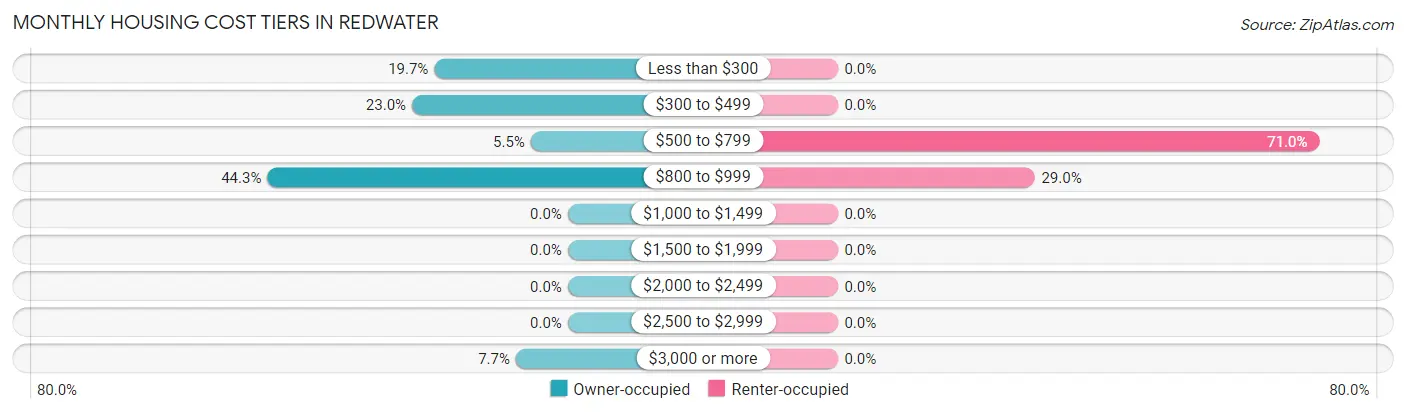
| Monthly Cost | Owner-occupied | Renter-occupied |
| Less than $300 | 36 (19.7%) | 0 (0.0%) |
| $300 to $499 | 42 (23.0%) | 0 (0.0%) |
| $500 to $799 | 10 (5.5%) | 22 (71.0%) |
| $800 to $999 | 81 (44.3%) | 9 (29.0%) |
| $1,000 to $1,499 | 0 (0.0%) | 0 (0.0%) |
| $1,500 to $1,999 | 0 (0.0%) | 0 (0.0%) |
| $2,000 to $2,499 | 0 (0.0%) | 0 (0.0%) |
| $2,500 to $2,999 | 0 (0.0%) | 0 (0.0%) |
| $3,000 or more | 14 (7.6%) | 0 (0.0%) |
| Total | 183 (100.0%) | 31 (100.0%) |
Physical Housing Characteristics in Redwater
Housing Structures in Redwater
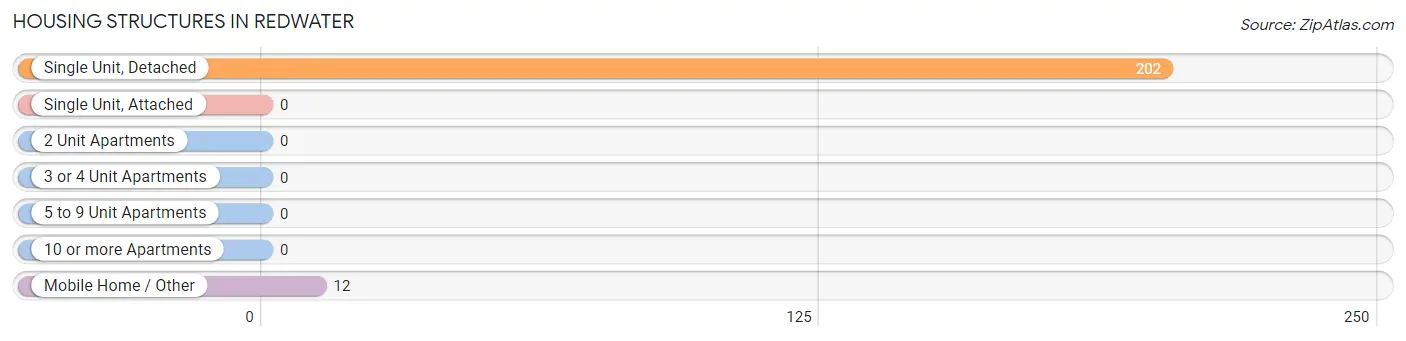
| Structure Type | # Housing Units | % Housing Units |
| Single Unit, Detached | 202 | 94.4% |
| Single Unit, Attached | 0 | 0.0% |
| 2 Unit Apartments | 0 | 0.0% |
| 3 or 4 Unit Apartments | 0 | 0.0% |
| 5 to 9 Unit Apartments | 0 | 0.0% |
| 10 or more Apartments | 0 | 0.0% |
| Mobile Home / Other | 12 | 5.6% |
| Total | 214 | 100.0% |
Housing Structures by Occupancy in Redwater
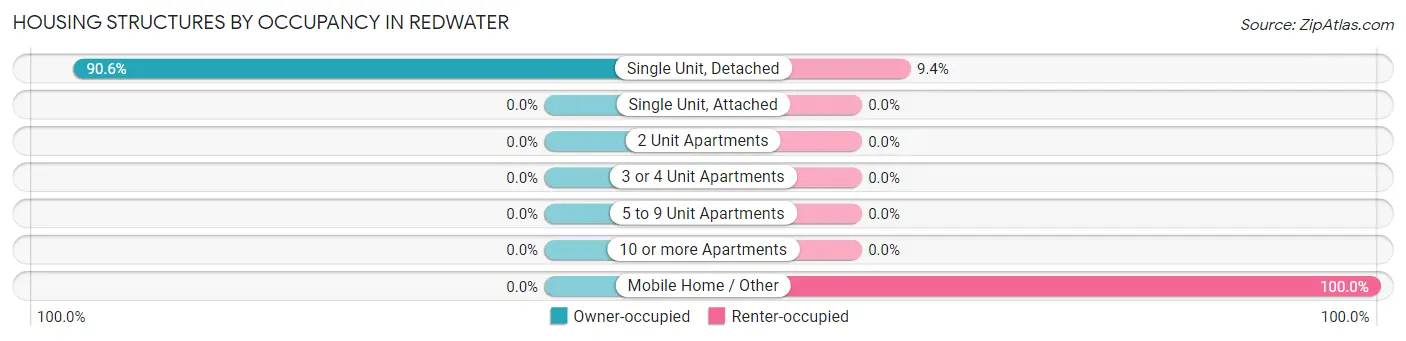
| Structure Type | Owner-occupied | Renter-occupied |
| Single Unit, Detached | 183 (90.6%) | 19 (9.4%) |
| Single Unit, Attached | 0 (0.0%) | 0 (0.0%) |
| 2 Unit Apartments | 0 (0.0%) | 0 (0.0%) |
| 3 or 4 Unit Apartments | 0 (0.0%) | 0 (0.0%) |
| 5 to 9 Unit Apartments | 0 (0.0%) | 0 (0.0%) |
| 10 or more Apartments | 0 (0.0%) | 0 (0.0%) |
| Mobile Home / Other | 0 (0.0%) | 12 (100.0%) |
| Total | 183 (85.5%) | 31 (14.5%) |
Housing Structures by Number of Rooms in Redwater
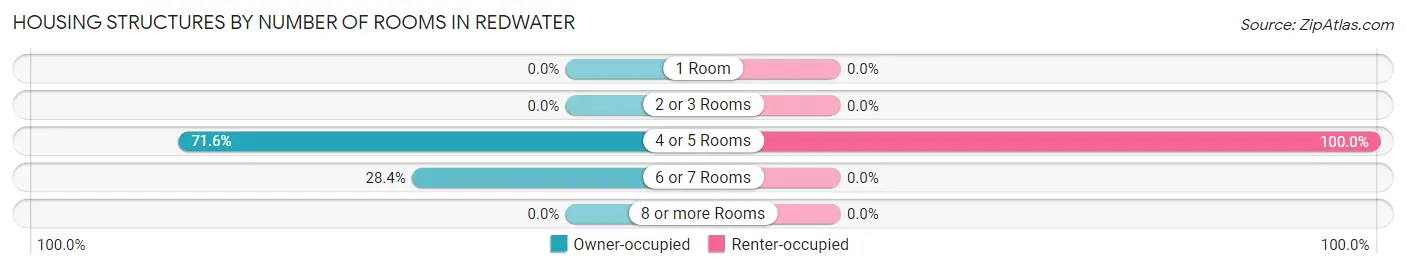
| Number of Rooms | Owner-occupied | Renter-occupied |
| 1 Room | 0 (0.0%) | 0 (0.0%) |
| 2 or 3 Rooms | 0 (0.0%) | 0 (0.0%) |
| 4 or 5 Rooms | 131 (71.6%) | 31 (100.0%) |
| 6 or 7 Rooms | 52 (28.4%) | 0 (0.0%) |
| 8 or more Rooms | 0 (0.0%) | 0 (0.0%) |
| Total | 183 (100.0%) | 31 (100.0%) |
Housing Structure by Heating Type in Redwater
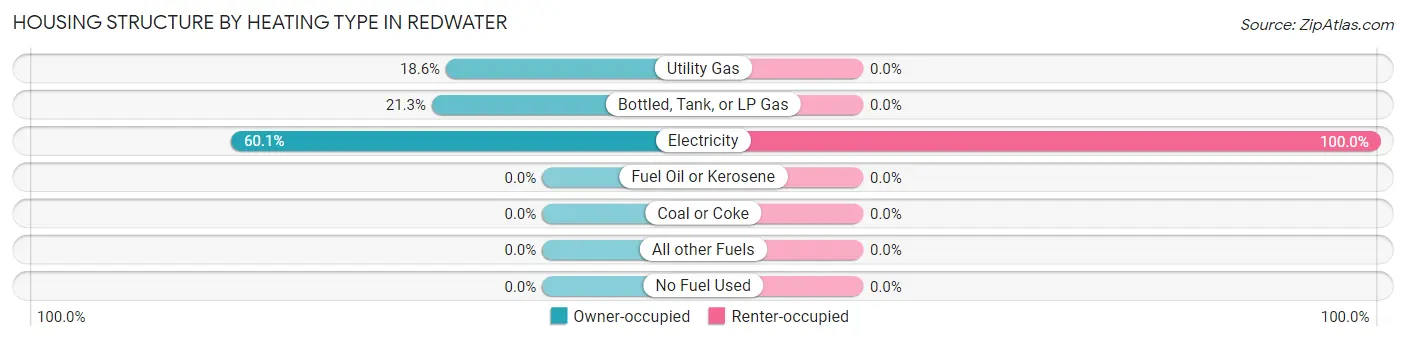
| Heating Type | Owner-occupied | Renter-occupied |
| Utility Gas | 34 (18.6%) | 0 (0.0%) |
| Bottled, Tank, or LP Gas | 39 (21.3%) | 0 (0.0%) |
| Electricity | 110 (60.1%) | 31 (100.0%) |
| Fuel Oil or Kerosene | 0 (0.0%) | 0 (0.0%) |
| Coal or Coke | 0 (0.0%) | 0 (0.0%) |
| All other Fuels | 0 (0.0%) | 0 (0.0%) |
| No Fuel Used | 0 (0.0%) | 0 (0.0%) |
| Total | 183 (100.0%) | 31 (100.0%) |
Household Vehicle Usage in Redwater
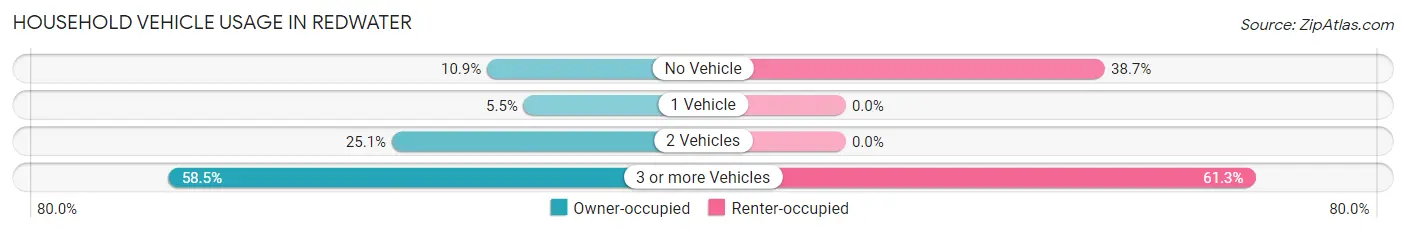
| Vehicles per Household | Owner-occupied | Renter-occupied |
| No Vehicle | 20 (10.9%) | 12 (38.7%) |
| 1 Vehicle | 10 (5.5%) | 0 (0.0%) |
| 2 Vehicles | 46 (25.1%) | 0 (0.0%) |
| 3 or more Vehicles | 107 (58.5%) | 19 (61.3%) |
| Total | 183 (100.0%) | 31 (100.0%) |
Real Estate & Mortgages in Redwater
Real Estate and Mortgage Overview in Redwater
| Characteristic | Without Mortgage | With Mortgage |
| Housing Units | 66 | 117 |
| Median Property Value | $65,000 | $136,300 |
| Median Household Income | - | - |
| Monthly Housing Costs | $291 | $14 |
| Real Estate Taxes | - | - |
Property Value by Mortgage Status in Redwater
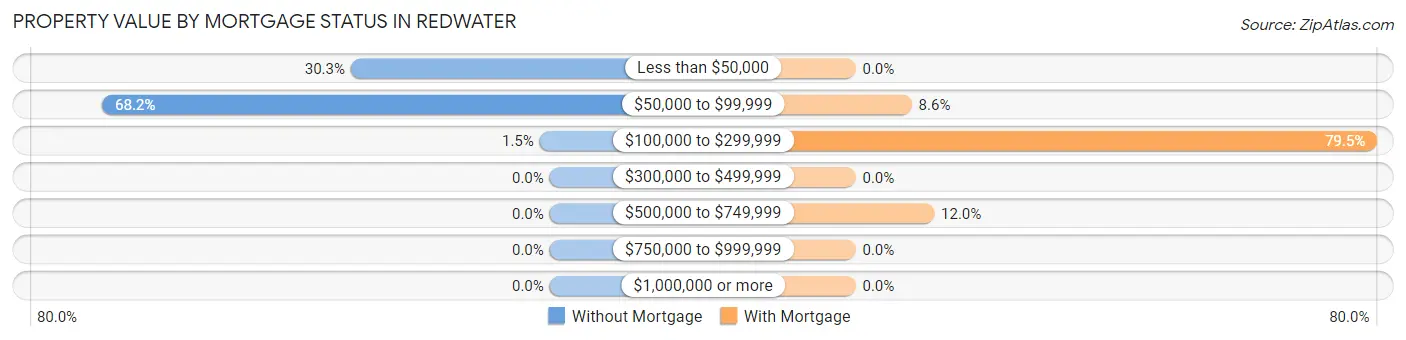
| Property Value | Without Mortgage | With Mortgage |
| Less than $50,000 | 20 (30.3%) | 0 (0.0%) |
| $50,000 to $99,999 | 45 (68.2%) | 10 (8.6%) |
| $100,000 to $299,999 | 1 (1.5%) | 93 (79.5%) |
| $300,000 to $499,999 | 0 (0.0%) | 0 (0.0%) |
| $500,000 to $749,999 | 0 (0.0%) | 14 (12.0%) |
| $750,000 to $999,999 | 0 (0.0%) | 0 (0.0%) |
| $1,000,000 or more | 0 (0.0%) | 0 (0.0%) |
| Total | 66 (100.0%) | 117 (100.0%) |
Household Income by Mortgage Status in Redwater
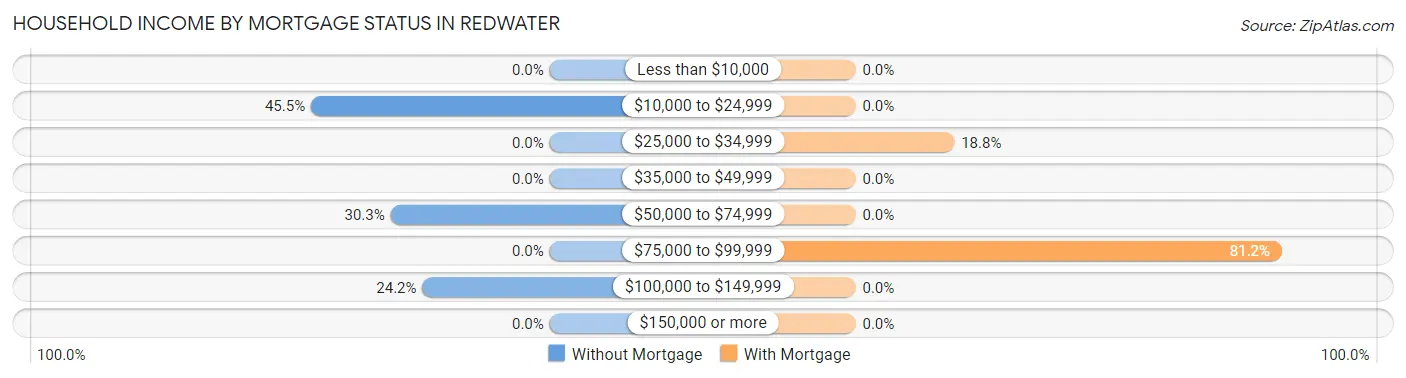
| Household Income | Without Mortgage | With Mortgage |
| Less than $10,000 | 0 (0.0%) | 0 (0.0%) |
| $10,000 to $24,999 | 30 (45.5%) | 0 (0.0%) |
| $25,000 to $34,999 | 0 (0.0%) | 22 (18.8%) |
| $35,000 to $49,999 | 0 (0.0%) | 0 (0.0%) |
| $50,000 to $74,999 | 20 (30.3%) | 0 (0.0%) |
| $75,000 to $99,999 | 0 (0.0%) | 95 (81.2%) |
| $100,000 to $149,999 | 16 (24.2%) | 0 (0.0%) |
| $150,000 or more | 0 (0.0%) | 0 (0.0%) |
| Total | 66 (100.0%) | 117 (100.0%) |
Property Value to Household Income Ratio in Redwater
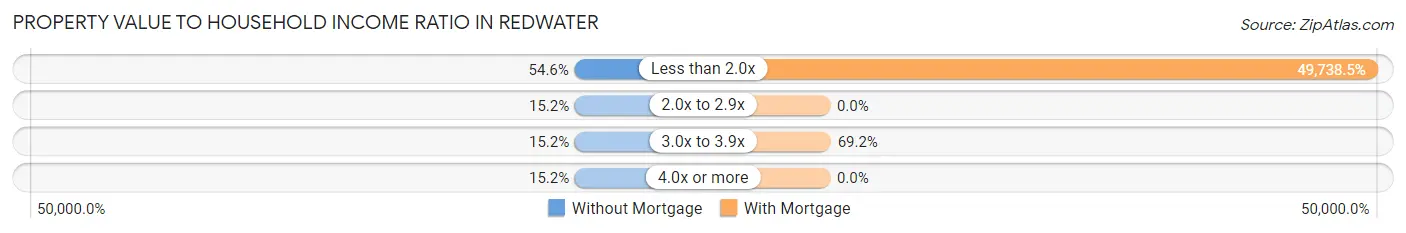
| Value-to-Income Ratio | Without Mortgage | With Mortgage |
| Less than 2.0x | 36 (54.5%) | 58,194 (49,738.5%) |
| 2.0x to 2.9x | 10 (15.1%) | 0 (0.0%) |
| 3.0x to 3.9x | 10 (15.1%) | 81 (69.2%) |
| 4.0x or more | 10 (15.1%) | 0 (0.0%) |
| Total | 66 (100.0%) | 117 (100.0%) |
Real Estate Taxes by Mortgage Status in Redwater
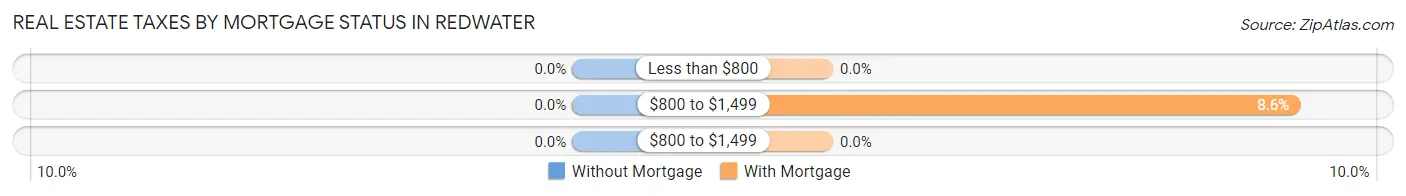
| Property Taxes | Without Mortgage | With Mortgage |
| Less than $800 | 0 (0.0%) | 0 (0.0%) |
| $800 to $1,499 | 0 (0.0%) | 10 (8.6%) |
| $800 to $1,499 | 0 (0.0%) | 0 (0.0%) |
| Total | 66 (100.0%) | 117 (100.0%) |
Health & Disability in Redwater
Health Insurance Coverage by Age in Redwater
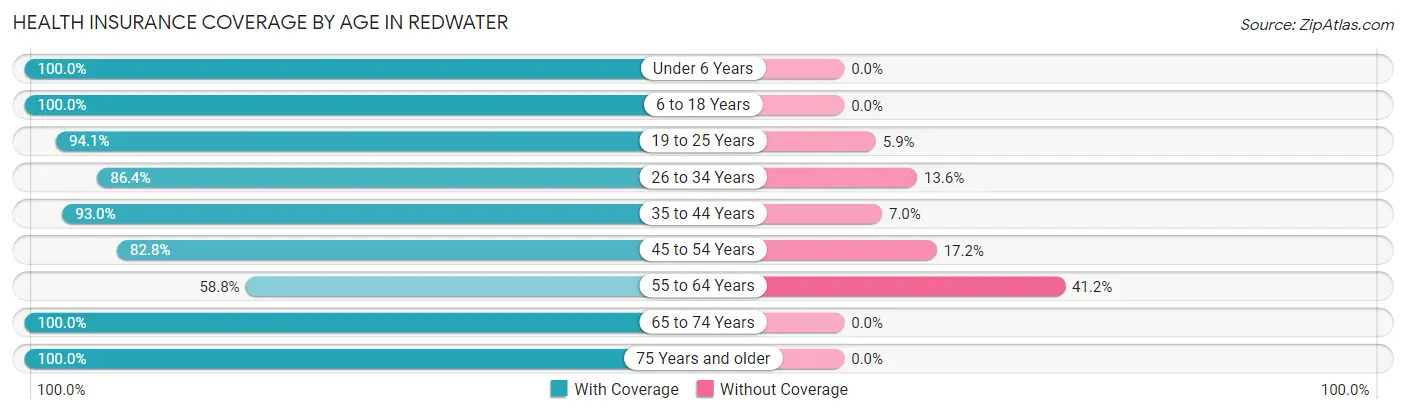
| Age Bracket | With Coverage | Without Coverage |
| Under 6 Years | 30 (100.0%) | 0 (0.0%) |
| 6 to 18 Years | 122 (100.0%) | 0 (0.0%) |
| 19 to 25 Years | 16 (94.1%) | 1 (5.9%) |
| 26 to 34 Years | 51 (86.4%) | 8 (13.6%) |
| 35 to 44 Years | 132 (93.0%) | 10 (7.0%) |
| 45 to 54 Years | 48 (82.8%) | 10 (17.2%) |
| 55 to 64 Years | 30 (58.8%) | 21 (41.2%) |
| 65 to 74 Years | 19 (100.0%) | 0 (0.0%) |
| 75 Years and older | 16 (100.0%) | 0 (0.0%) |
| Total | 464 (90.3%) | 50 (9.7%) |
Health Insurance Coverage by Citizenship Status in Redwater
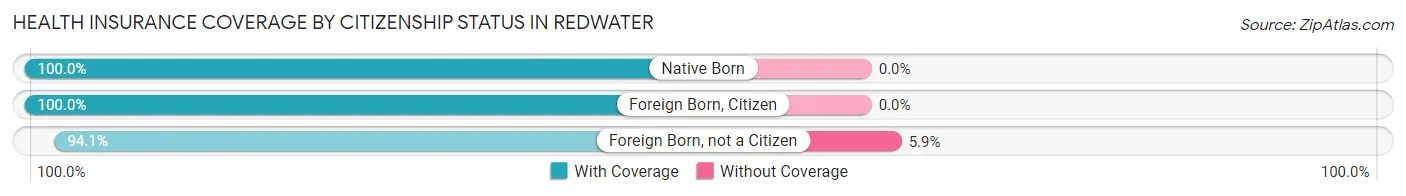
| Citizenship Status | With Coverage | Without Coverage |
| Native Born | 30 (100.0%) | 0 (0.0%) |
| Foreign Born, Citizen | 122 (100.0%) | 0 (0.0%) |
| Foreign Born, not a Citizen | 16 (94.1%) | 1 (5.9%) |
Health Insurance Coverage by Household Income in Redwater
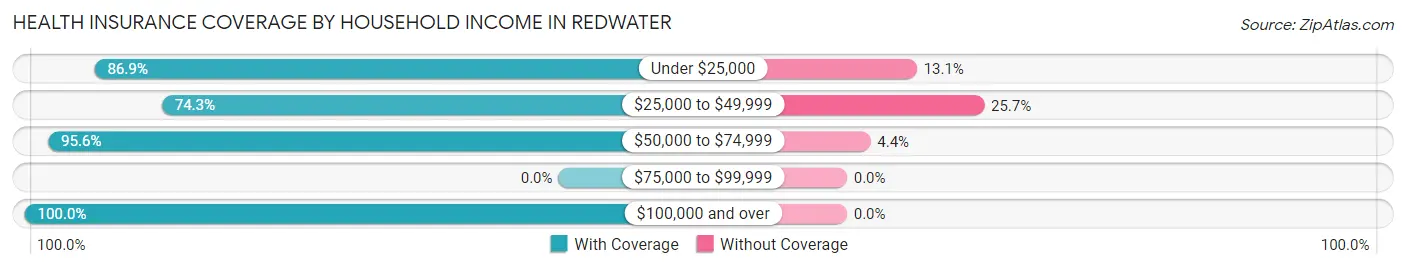
| Household Income | With Coverage | Without Coverage |
| Under $25,000 | 146 (86.9%) | 22 (13.1%) |
| $25,000 to $49,999 | 52 (74.3%) | 18 (25.7%) |
| $50,000 to $74,999 | 217 (95.6%) | 10 (4.4%) |
| $75,000 to $99,999 | 0 (0.0%) | 0 (0.0%) |
| $100,000 and over | 49 (100.0%) | 0 (0.0%) |
Public vs Private Health Insurance Coverage by Age in Redwater
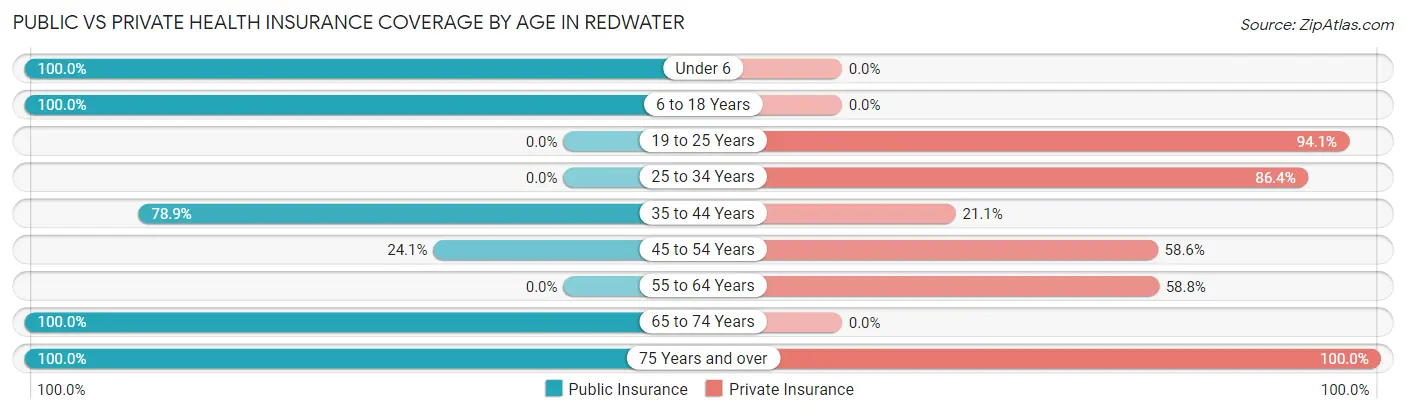
| Age Bracket | Public Insurance | Private Insurance |
| Under 6 | 30 (100.0%) | 0 (0.0%) |
| 6 to 18 Years | 122 (100.0%) | 0 (0.0%) |
| 19 to 25 Years | 0 (0.0%) | 16 (94.1%) |
| 25 to 34 Years | 0 (0.0%) | 51 (86.4%) |
| 35 to 44 Years | 112 (78.9%) | 30 (21.1%) |
| 45 to 54 Years | 14 (24.1%) | 34 (58.6%) |
| 55 to 64 Years | 0 (0.0%) | 30 (58.8%) |
| 65 to 74 Years | 19 (100.0%) | 0 (0.0%) |
| 75 Years and over | 16 (100.0%) | 16 (100.0%) |
| Total | 313 (60.9%) | 177 (34.4%) |
Disability Status by Sex by Age in Redwater
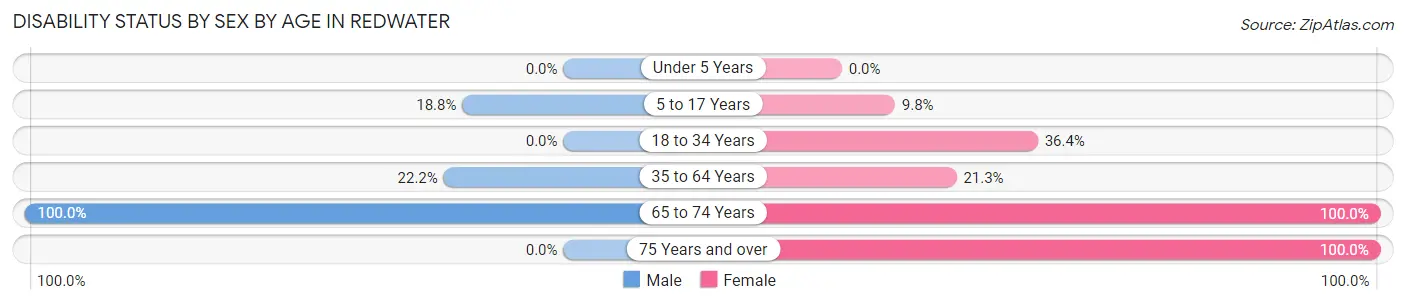
| Age Bracket | Male | Female |
| Under 5 Years | 0 (0.0%) | 0 (0.0%) |
| 5 to 17 Years | 12 (18.8%) | 6 (9.8%) |
| 18 to 34 Years | 0 (0.0%) | 20 (36.4%) |
| 35 to 64 Years | 14 (22.2%) | 40 (21.3%) |
| 65 to 74 Years | 10 (100.0%) | 9 (100.0%) |
| 75 Years and over | 0 (0.0%) | 16 (100.0%) |
Disability Class by Sex by Age in Redwater
Disability Class: Hearing Difficulty
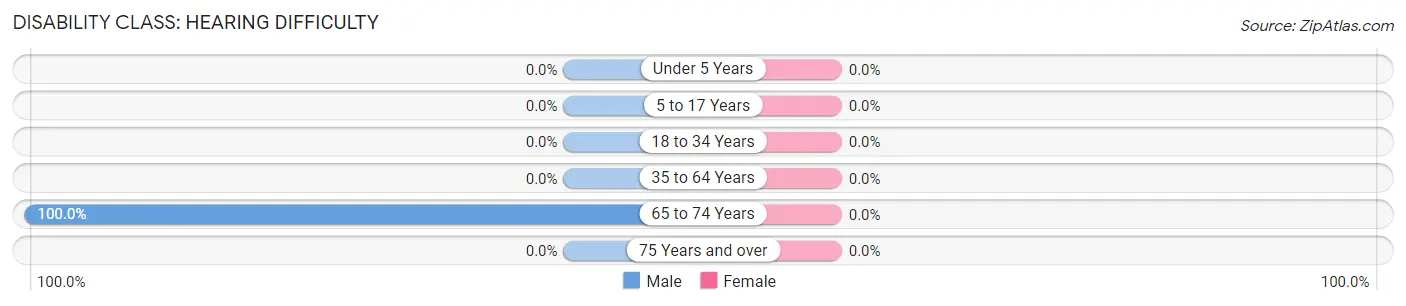
| Age Bracket | Male | Female |
| Under 5 Years | 0 (0.0%) | 0 (0.0%) |
| 5 to 17 Years | 0 (0.0%) | 0 (0.0%) |
| 18 to 34 Years | 0 (0.0%) | 0 (0.0%) |
| 35 to 64 Years | 0 (0.0%) | 0 (0.0%) |
| 65 to 74 Years | 10 (100.0%) | 0 (0.0%) |
| 75 Years and over | 0 (0.0%) | 0 (0.0%) |
Disability Class: Vision Difficulty
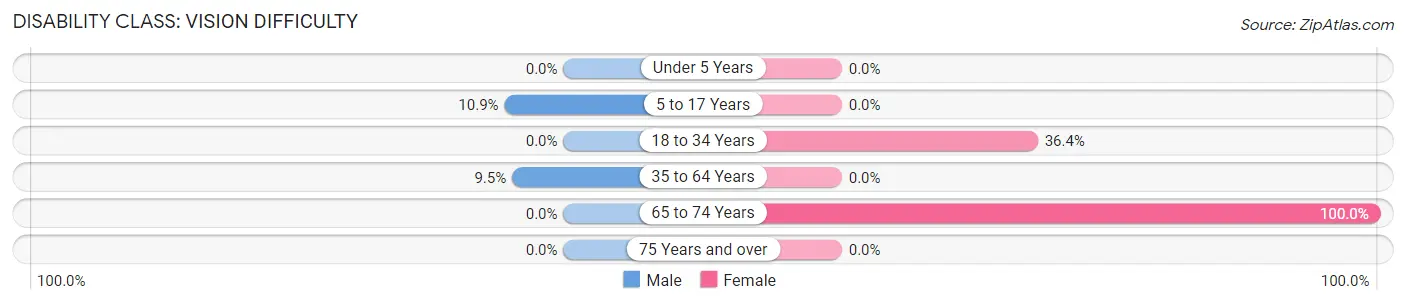
| Age Bracket | Male | Female |
| Under 5 Years | 0 (0.0%) | 0 (0.0%) |
| 5 to 17 Years | 7 (10.9%) | 0 (0.0%) |
| 18 to 34 Years | 0 (0.0%) | 20 (36.4%) |
| 35 to 64 Years | 6 (9.5%) | 0 (0.0%) |
| 65 to 74 Years | 0 (0.0%) | 9 (100.0%) |
| 75 Years and over | 0 (0.0%) | 0 (0.0%) |
Disability Class: Cognitive Difficulty
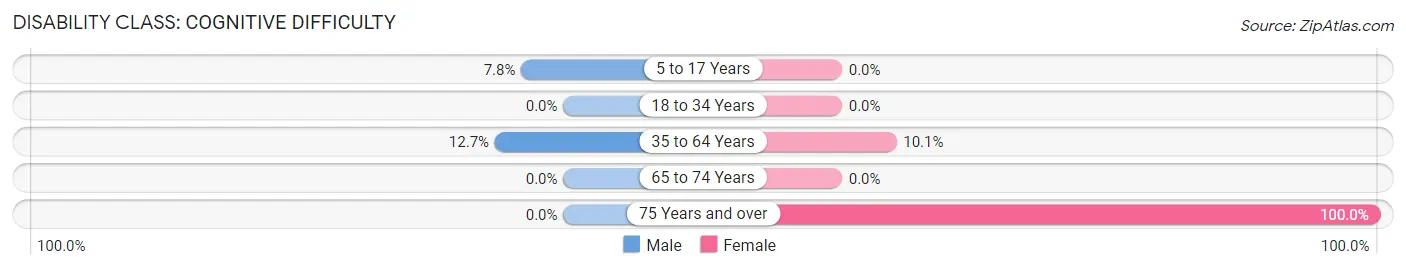
| Age Bracket | Male | Female |
| 5 to 17 Years | 5 (7.8%) | 0 (0.0%) |
| 18 to 34 Years | 0 (0.0%) | 0 (0.0%) |
| 35 to 64 Years | 8 (12.7%) | 19 (10.1%) |
| 65 to 74 Years | 0 (0.0%) | 0 (0.0%) |
| 75 Years and over | 0 (0.0%) | 16 (100.0%) |
Disability Class: Ambulatory Difficulty
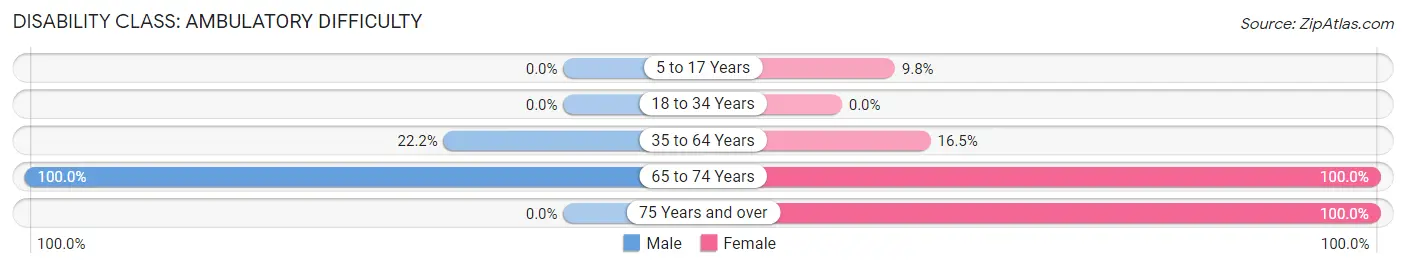
| Age Bracket | Male | Female |
| 5 to 17 Years | 0 (0.0%) | 6 (9.8%) |
| 18 to 34 Years | 0 (0.0%) | 0 (0.0%) |
| 35 to 64 Years | 14 (22.2%) | 31 (16.5%) |
| 65 to 74 Years | 10 (100.0%) | 9 (100.0%) |
| 75 Years and over | 0 (0.0%) | 16 (100.0%) |
Disability Class: Self-Care Difficulty
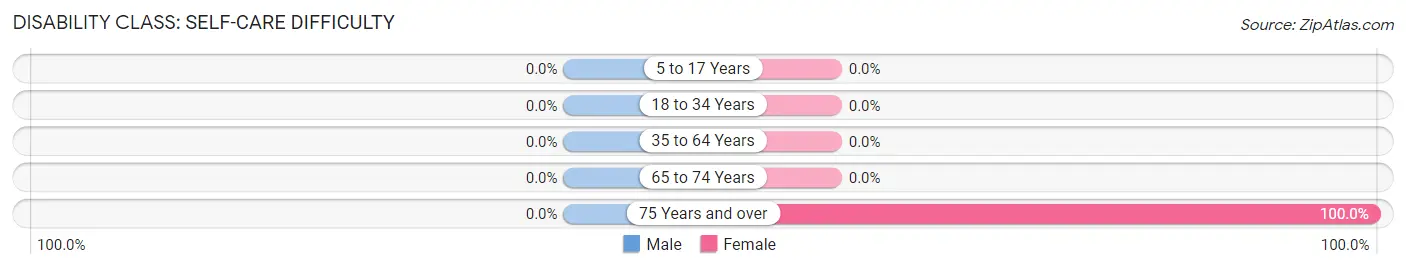
| Age Bracket | Male | Female |
| 5 to 17 Years | 0 (0.0%) | 0 (0.0%) |
| 18 to 34 Years | 0 (0.0%) | 0 (0.0%) |
| 35 to 64 Years | 0 (0.0%) | 0 (0.0%) |
| 65 to 74 Years | 0 (0.0%) | 0 (0.0%) |
| 75 Years and over | 0 (0.0%) | 16 (100.0%) |
Technology Access in Redwater
Computing Device Access in Redwater
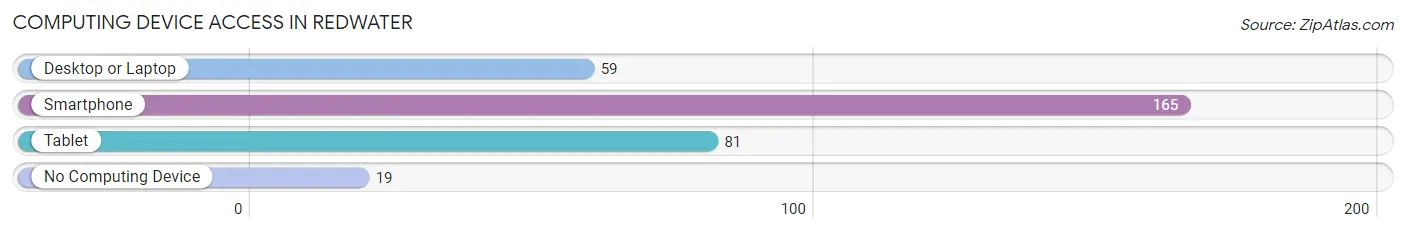
| Device Type | # Households | % Households |
| Desktop or Laptop | 59 | 27.6% |
| Smartphone | 165 | 77.1% |
| Tablet | 81 | 37.9% |
| No Computing Device | 19 | 8.9% |
| Total | 214 | 100.0% |
Internet Access in Redwater
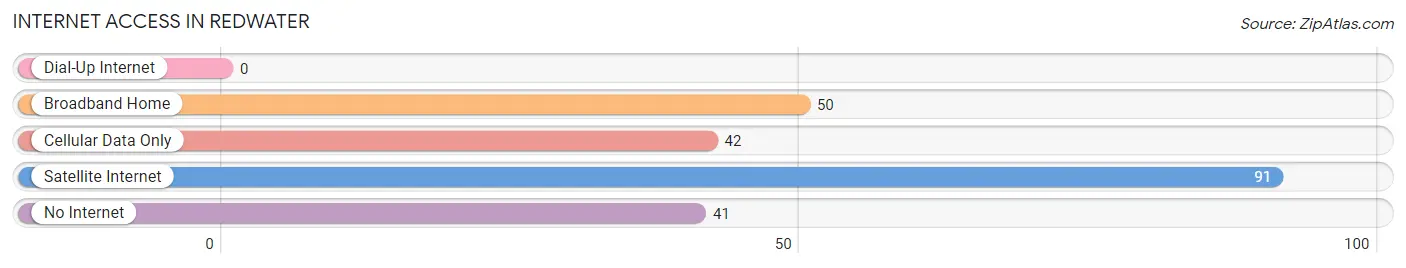
| Internet Type | # Households | % Households |
| Dial-Up Internet | 0 | 0.0% |
| Broadband Home | 50 | 23.4% |
| Cellular Data Only | 42 | 19.6% |
| Satellite Internet | 91 | 42.5% |
| No Internet | 41 | 19.2% |
| Total | 214 | 100.0% |
Redwater Summary
Redwater is a small town located in Montgomery County, Mississippi. It is situated in the northeastern part of the state, approximately 20 miles south of the state capital, Jackson. The town was founded in 1872 and has a population of approximately 1,000 people.
History
Redwater was founded in 1872 by a group of settlers from the nearby town of Winona. The town was named after the nearby Redwater Creek, which was named for its reddish-brown color. The town was originally a farming community, but in the early 1900s, the timber industry began to take off in the area. The town was home to several sawmills and lumber companies, and the timber industry was the main source of employment for the town's residents.
In the late 1940s, the timber industry began to decline, and the town's economy shifted to focus on agriculture. The town is still home to several farms, and the local economy is largely based on agriculture.
Geography
Redwater is located in the northeastern part of Montgomery County, Mississippi. The town is situated on the banks of the Redwater Creek, which is a tributary of the Pearl River. The town is surrounded by rolling hills and forests, and the area is known for its scenic beauty.
The town is located approximately 20 miles south of the state capital, Jackson. The nearest major city is Meridian, which is located approximately 40 miles to the east.
Economy
The economy of Redwater is largely based on agriculture. The town is home to several farms, and the local economy is largely based on the production of crops such as corn, soybeans, and cotton. The town is also home to several small businesses, including a grocery store, a hardware store, and a few restaurants.
Demographics
As of the 2010 census, the population of Redwater was 1,000 people. The town is predominantly white, with approximately 95% of the population being white. The remaining 5% of the population is made up of African Americans, Hispanics, and other ethnicities. The median household income in Redwater is $35,000, and the median age is 38 years old.
Conclusion
Redwater is a small town located in Montgomery County, Mississippi. It was founded in 1872 and has a population of approximately 1,000 people. The town's economy is largely based on agriculture, and the local economy is largely based on the production of crops such as corn, soybeans, and cotton. The town is predominantly white, with approximately 95% of the population being white. The median household income in Redwater is $35,000, and the median age is 38 years old.
Common Questions
What is Per Capita Income in Redwater?
Per Capita income in Redwater is $16,252.
What is the Median Family Income in Redwater?
Median Family Income in Redwater is $58,036.
What is the Median Household income in Redwater?
Median Household Income in Redwater is $57,775.
What is Inequality or Gini Index in Redwater?
Inequality or Gini Index in Redwater is 0.31.
What is the Total Population of Redwater?
Total Population of Redwater is 514.
What is the Total Male Population of Redwater?
Total Male Population of Redwater is 171.
What is the Total Female Population of Redwater?
Total Female Population of Redwater is 343.
What is the Ratio of Males per 100 Females in Redwater?
There are 49.85 Males per 100 Females in Redwater.
What is the Ratio of Females per 100 Males in Redwater?
There are 200.58 Females per 100 Males in Redwater.
What is the Median Population Age in Redwater?
Median Population Age in Redwater is 41.2 Years.
What is the Average Family Size in Redwater
Average Family Size in Redwater is 2.5 People.
What is the Average Household Size in Redwater
Average Household Size in Redwater is 2.4 People.
How Large is the Labor Force in Redwater?
There are 229 People in the Labor Forcein in Redwater.
What is the Percentage of People in the Labor Force in Redwater?
58.4% of People are in the Labor Force in Redwater.
What is the Unemployment Rate in Redwater?
Unemployment Rate in Redwater is 15.7%.