Blue Mountain, MS Map & Demographics
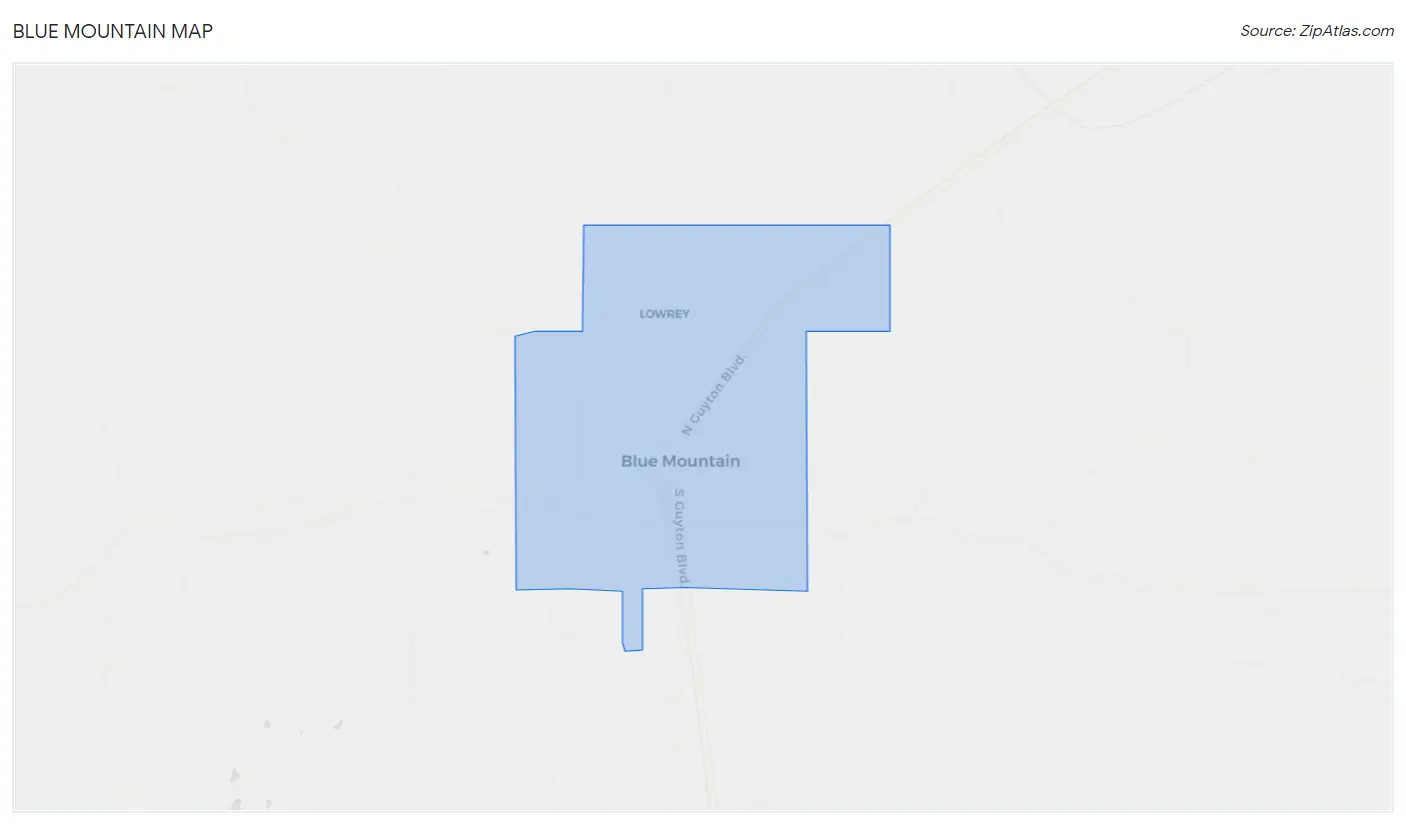
Blue Mountain Map
Blue Mountain Overview
$17,792
PER CAPITA INCOME
$56,596
AVG FAMILY INCOME
$55,106
AVG HOUSEHOLD INCOME
56.8%
WAGE / INCOME GAP [ % ]
43.2¢/ $1
WAGE / INCOME GAP [ $ ]
0.45
INEQUALITY / GINI INDEX
1,100
TOTAL POPULATION
527
MALE POPULATION
573
FEMALE POPULATION
91.97
MALES / 100 FEMALES
108.73
FEMALES / 100 MALES
22.4
MEDIAN AGE
3.1
AVG FAMILY SIZE
2.7
AVG HOUSEHOLD SIZE
460
LABOR FORCE [ PEOPLE ]
50.5%
PERCENT IN LABOR FORCE
1.1%
UNEMPLOYMENT RATE
Blue Mountain Zip Codes
Blue Mountain Area Codes
Income in Blue Mountain
Income Overview in Blue Mountain
Per Capita Income in Blue Mountain is $17,792, while median incomes of families and households are $56,596 and $55,106 respectively.
| Characteristic | Number | Measure |
| Per Capita Income | 1,100 | $17,792 |
| Median Family Income | 200 | $56,596 |
| Mean Family Income | 200 | $73,375 |
| Median Household Income | 302 | $55,106 |
| Mean Household Income | 302 | $59,567 |
| Income Deficit | 200 | $0 |
| Wage / Income Gap (%) | 1,100 | 56.78% |
| Wage / Income Gap ($) | 1,100 | 43.22¢ per $1 |
| Gini / Inequality Index | 1,100 | 0.45 |
Earnings by Sex in Blue Mountain
Average Earnings in Blue Mountain are $17,344, $29,688 for men and $12,831 for women, a difference of 56.8%.
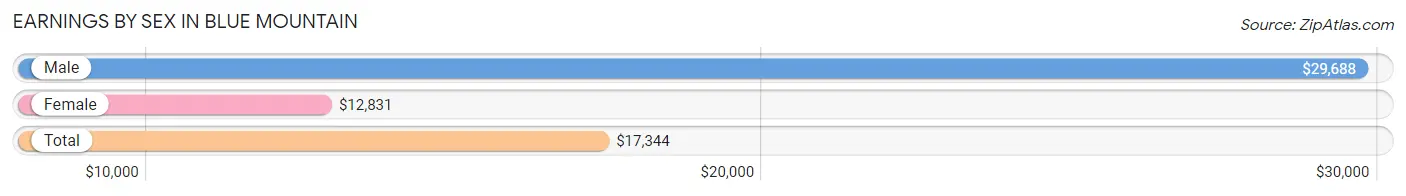
| Sex | Number | Average Earnings |
| Male | 260 (44.0%) | $29,688 |
| Female | 331 (56.0%) | $12,831 |
| Total | 591 (100.0%) | $17,344 |
Earnings by Sex by Income Bracket in Blue Mountain
The most common earnings brackets in Blue Mountain are $35,000 to $39,999 for men (45 | 17.3%) and $5,000 to $7,499 for women (77 | 23.3%).
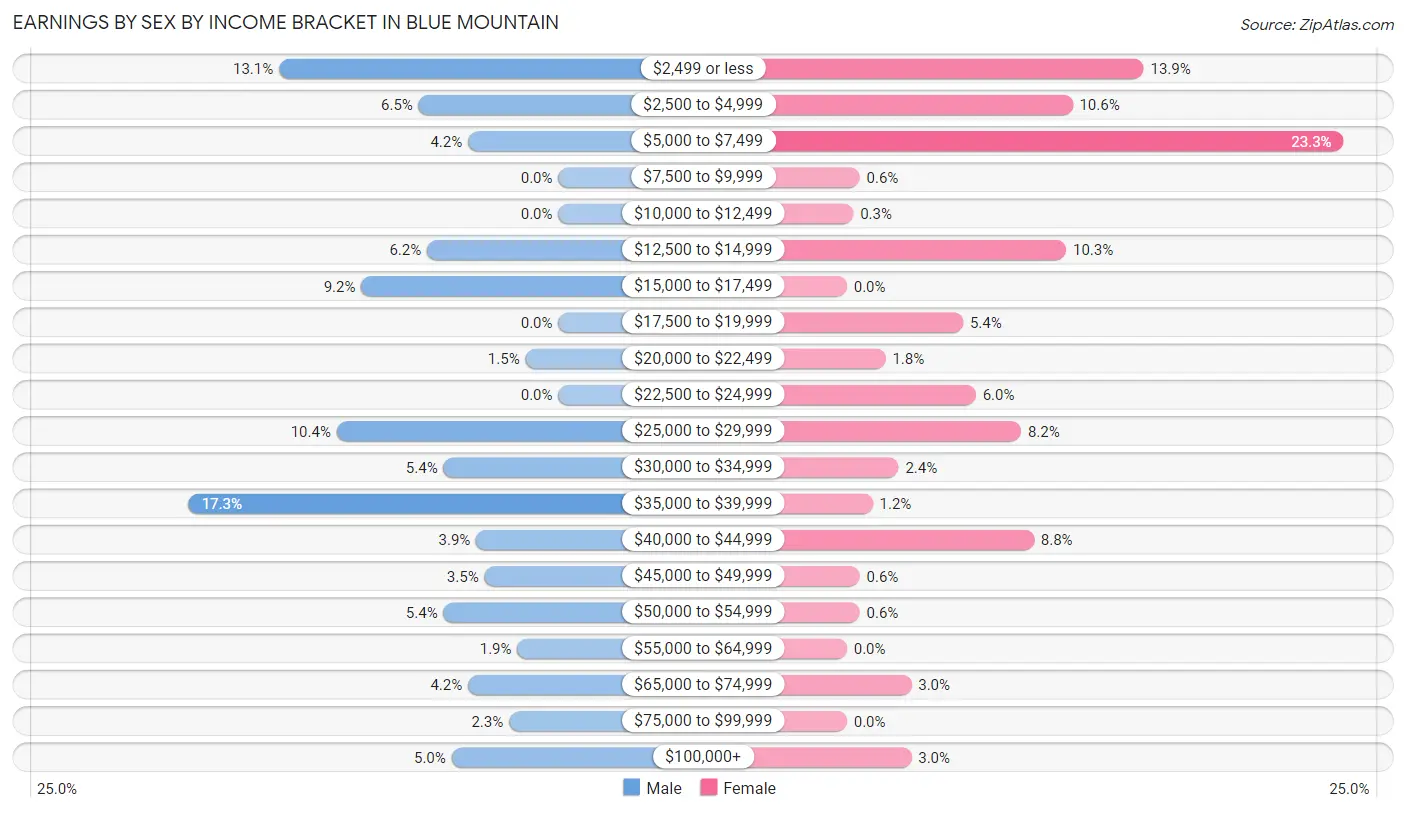
| Income | Male | Female |
| $2,499 or less | 34 (13.1%) | 46 (13.9%) |
| $2,500 to $4,999 | 17 (6.5%) | 35 (10.6%) |
| $5,000 to $7,499 | 11 (4.2%) | 77 (23.3%) |
| $7,500 to $9,999 | 0 (0.0%) | 2 (0.6%) |
| $10,000 to $12,499 | 0 (0.0%) | 1 (0.3%) |
| $12,500 to $14,999 | 16 (6.1%) | 34 (10.3%) |
| $15,000 to $17,499 | 24 (9.2%) | 0 (0.0%) |
| $17,500 to $19,999 | 0 (0.0%) | 18 (5.4%) |
| $20,000 to $22,499 | 4 (1.5%) | 6 (1.8%) |
| $22,500 to $24,999 | 0 (0.0%) | 20 (6.0%) |
| $25,000 to $29,999 | 27 (10.4%) | 27 (8.2%) |
| $30,000 to $34,999 | 14 (5.4%) | 8 (2.4%) |
| $35,000 to $39,999 | 45 (17.3%) | 4 (1.2%) |
| $40,000 to $44,999 | 10 (3.8%) | 29 (8.8%) |
| $45,000 to $49,999 | 9 (3.5%) | 2 (0.6%) |
| $50,000 to $54,999 | 14 (5.4%) | 2 (0.6%) |
| $55,000 to $64,999 | 5 (1.9%) | 0 (0.0%) |
| $65,000 to $74,999 | 11 (4.2%) | 10 (3.0%) |
| $75,000 to $99,999 | 6 (2.3%) | 0 (0.0%) |
| $100,000+ | 13 (5.0%) | 10 (3.0%) |
| Total | 260 (100.0%) | 331 (100.0%) |
Earnings by Sex by Educational Attainment in Blue Mountain
Average earnings in Blue Mountain are $37,284 for men and $25,509 for women, a difference of 31.6%. Men with an educational attainment of high school diploma enjoy the highest average annual earnings of $36,607, while those with college or associate's degree education earn the least with $36,534. Women with an educational attainment of less than high school earn the most with the average annual earnings of $26,667, while those with high school diploma education have the smallest earnings of $20,833.
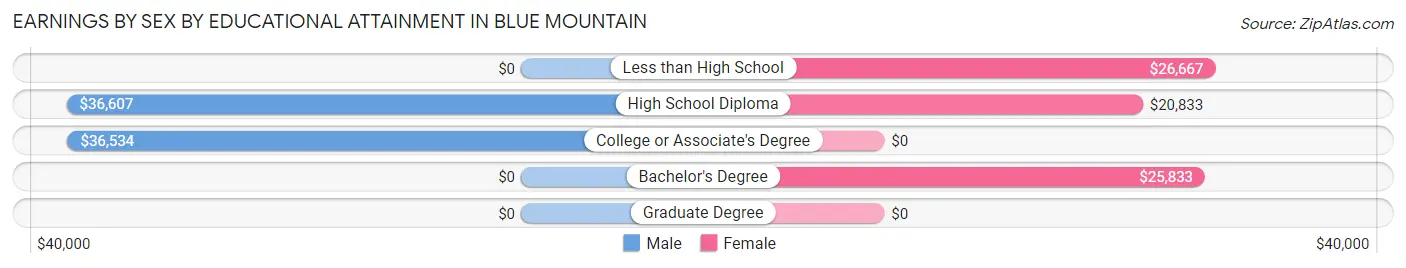
| Educational Attainment | Male Income | Female Income |
| Less than High School | - | - |
| High School Diploma | $36,607 | $20,833 |
| College or Associate's Degree | $36,534 | $0 |
| Bachelor's Degree | - | - |
| Graduate Degree | - | - |
| Total | $37,284 | $25,509 |
Family Income in Blue Mountain
Family Income Brackets in Blue Mountain
According to the Blue Mountain family income data, there are 77 families falling into the $50,000 to $74,999 income range, which is the most common income bracket and makes up 38.5% of all families. Conversely, the $10,000 to $14,999 income bracket is the least frequent group with only 6 families (3.0%) belonging to this category.
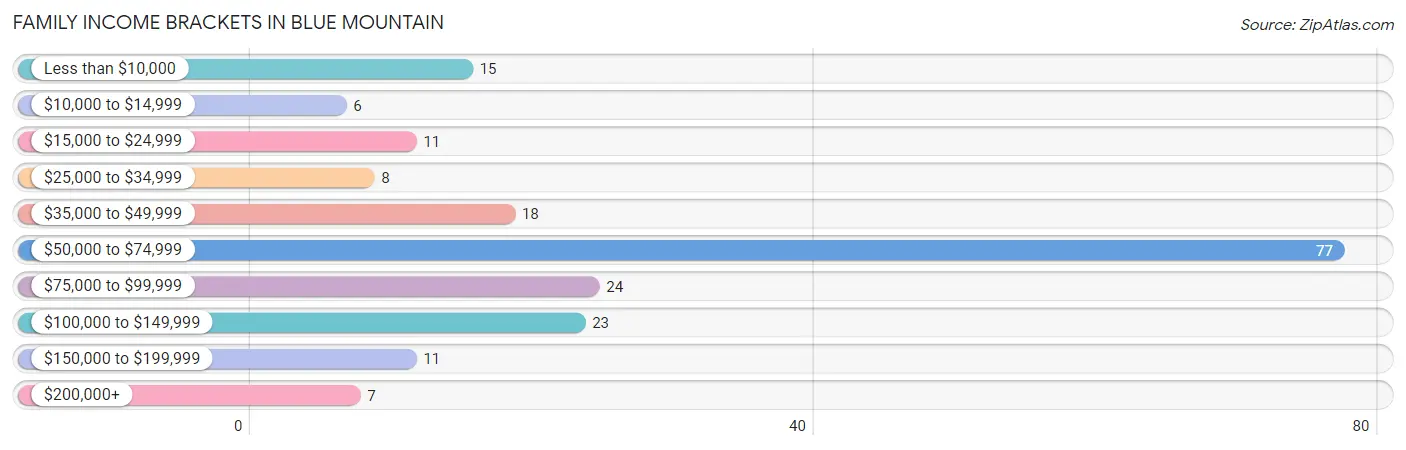
| Income Bracket | # Families | % Families |
| Less than $10,000 | 15 | 7.5% |
| $10,000 to $14,999 | 6 | 3.0% |
| $15,000 to $24,999 | 11 | 5.5% |
| $25,000 to $34,999 | 8 | 4.0% |
| $35,000 to $49,999 | 18 | 9.0% |
| $50,000 to $74,999 | 77 | 38.5% |
| $75,000 to $99,999 | 24 | 12.0% |
| $100,000 to $149,999 | 23 | 11.5% |
| $150,000 to $199,999 | 11 | 5.5% |
| $200,000+ | 7 | 3.5% |
Family Income by Famaliy Size in Blue Mountain
2-person families (68 | 34.0%) account for the highest median family income in Blue Mountain with $58,929 per family, while 2-person families (68 | 34.0%) have the highest median income of $29,464 per family member.
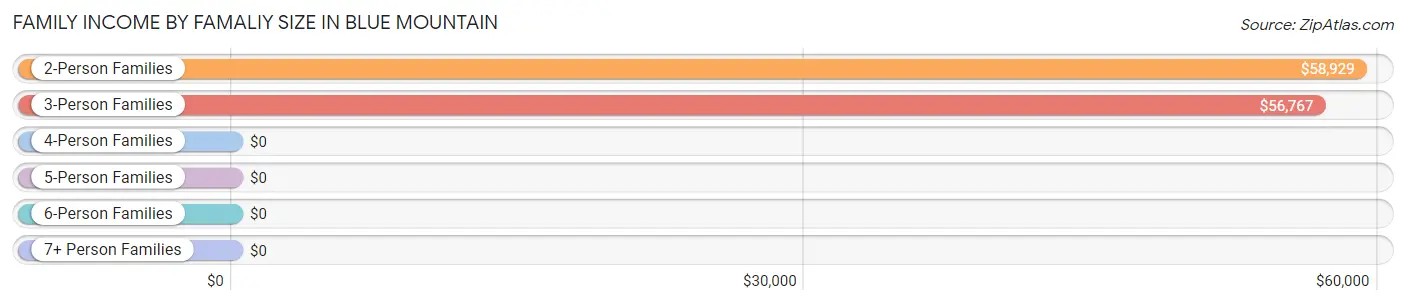
| Income Bracket | # Families | Median Income |
| 2-Person Families | 68 (34.0%) | $58,929 |
| 3-Person Families | 77 (38.5%) | $56,767 |
| 4-Person Families | 15 (7.5%) | $0 |
| 5-Person Families | 21 (10.5%) | $0 |
| 6-Person Families | 14 (7.0%) | $0 |
| 7+ Person Families | 5 (2.5%) | $0 |
| Total | 200 (100.0%) | $56,596 |
Family Income by Number of Earners in Blue Mountain
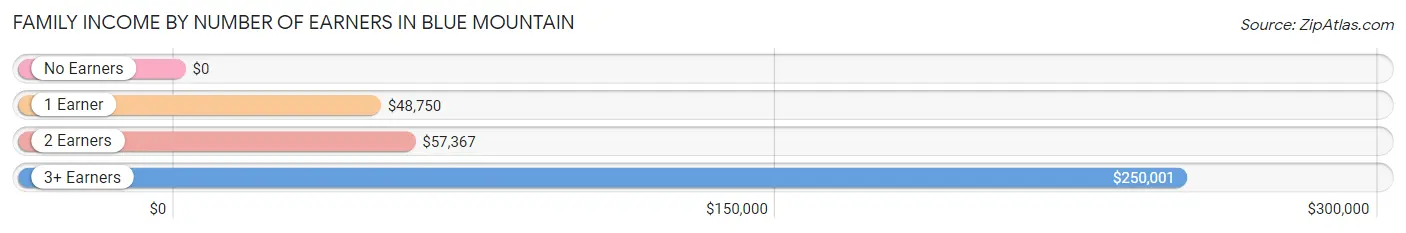
| Number of Earners | # Families | Median Income |
| No Earners | 37 (18.5%) | $0 |
| 1 Earner | 52 (26.0%) | $48,750 |
| 2 Earners | 99 (49.5%) | $57,367 |
| 3+ Earners | 12 (6.0%) | $250,001 |
| Total | 200 (100.0%) | $56,596 |
Household Income in Blue Mountain
Household Income Brackets in Blue Mountain
With 80 households falling in the category, the $50,000 to $74,999 income range is the most frequent in Blue Mountain, accounting for 26.5% of all households. In contrast, only 7 households (2.3%) fall into the $10,000 to $14,999 income bracket, making it the least populous group.
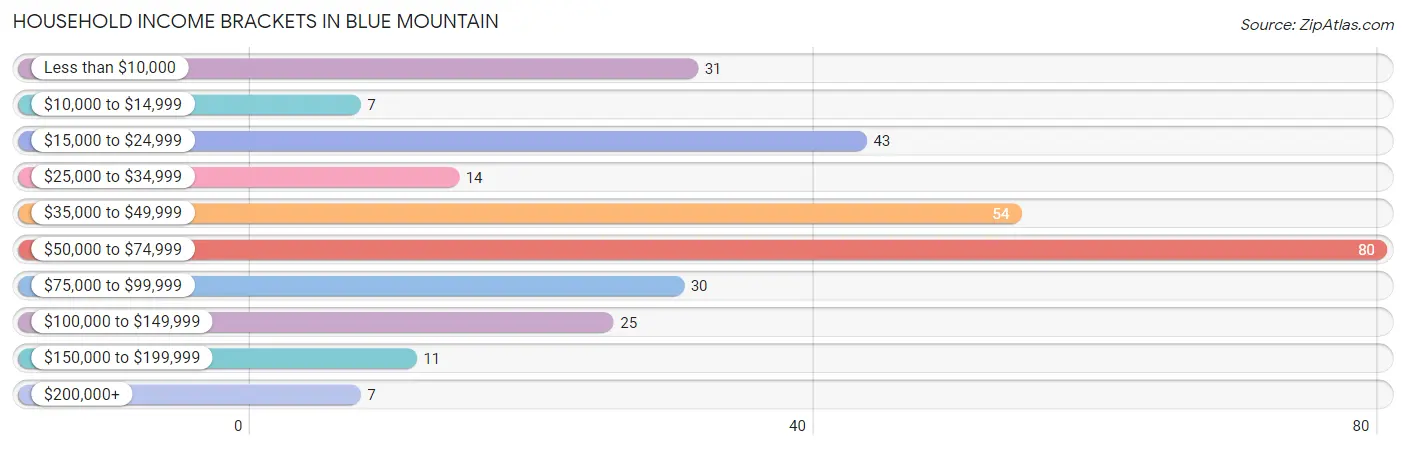
| Income Bracket | # Households | % Households |
| Less than $10,000 | 31 | 10.3% |
| $10,000 to $14,999 | 7 | 2.3% |
| $15,000 to $24,999 | 43 | 14.2% |
| $25,000 to $34,999 | 14 | 4.6% |
| $35,000 to $49,999 | 54 | 17.9% |
| $50,000 to $74,999 | 80 | 26.5% |
| $75,000 to $99,999 | 30 | 9.9% |
| $100,000 to $149,999 | 25 | 8.3% |
| $150,000 to $199,999 | 11 | 3.6% |
| $200,000+ | 7 | 2.3% |
Household Income by Householder Age in Blue Mountain
The median household income in Blue Mountain is $55,106, with the highest median household income of $61,250 found in the 65+ years age bracket for the primary householder. A total of 64 households (21.2%) fall into this category. Meanwhile, the 15 to 24 years age bracket for the primary householder has the lowest median household income of $0, with 13 households (4.3%) in this group.
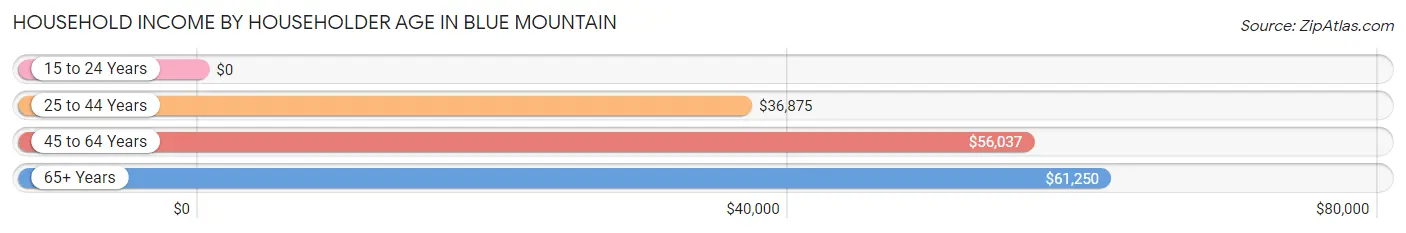
| Income Bracket | # Households | Median Income |
| 15 to 24 Years | 13 (4.3%) | $0 |
| 25 to 44 Years | 90 (29.8%) | $36,875 |
| 45 to 64 Years | 135 (44.7%) | $56,037 |
| 65+ Years | 64 (21.2%) | $61,250 |
| Total | 302 (100.0%) | $55,106 |
Poverty in Blue Mountain
Income Below Poverty by Sex and Age in Blue Mountain
With 21.4% poverty level for males and 24.6% for females among the residents of Blue Mountain, 6 to 11 year old males and 5 year old females are the most vulnerable to poverty, with 11 males (84.6%) and 3 females (100.0%) in their respective age groups living below the poverty level.
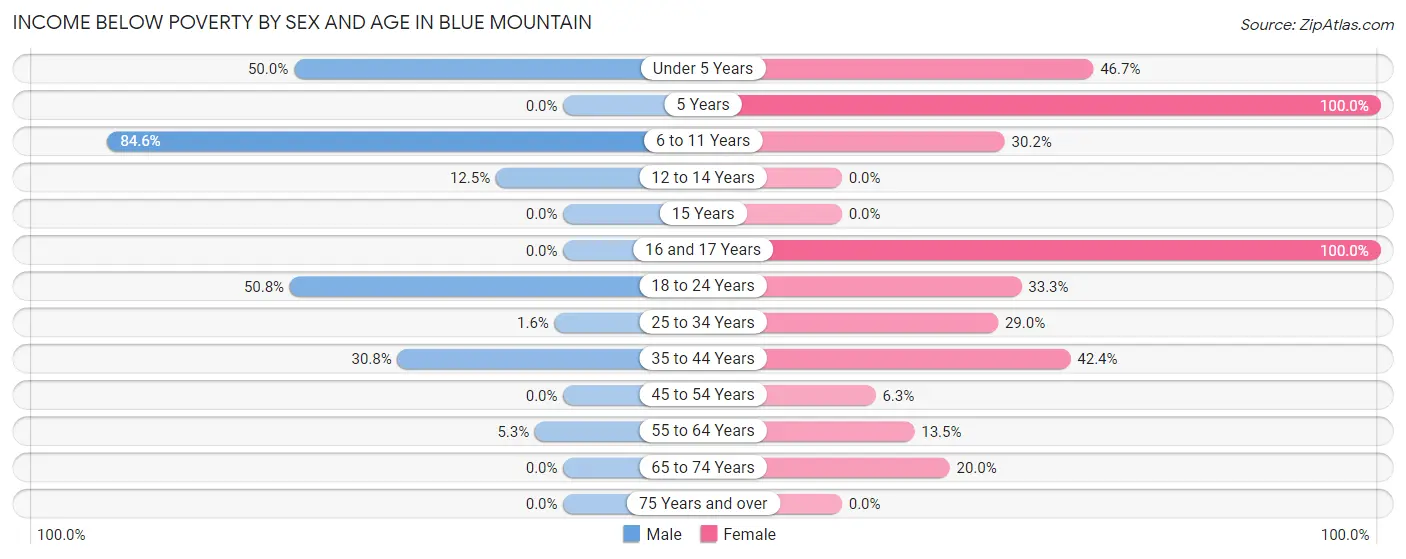
| Age Bracket | Male | Female |
| Under 5 Years | 24 (50.0%) | 7 (46.7%) |
| 5 Years | 0 (0.0%) | 3 (100.0%) |
| 6 to 11 Years | 11 (84.6%) | 13 (30.2%) |
| 12 to 14 Years | 8 (12.5%) | 0 (0.0%) |
| 15 Years | 0 (0.0%) | 0 (0.0%) |
| 16 and 17 Years | 0 (0.0%) | 7 (100.0%) |
| 18 to 24 Years | 34 (50.7%) | 16 (33.3%) |
| 25 to 34 Years | 1 (1.6%) | 20 (29.0%) |
| 35 to 44 Years | 8 (30.8%) | 14 (42.4%) |
| 45 to 54 Years | 0 (0.0%) | 5 (6.2%) |
| 55 to 64 Years | 2 (5.3%) | 7 (13.5%) |
| 65 to 74 Years | 0 (0.0%) | 6 (20.0%) |
| 75 Years and over | 0 (0.0%) | 0 (0.0%) |
| Total | 88 (21.4%) | 98 (24.6%) |
Income Above Poverty by Sex and Age in Blue Mountain
According to the poverty statistics in Blue Mountain, males aged 15 years and females aged 15 years are the age groups that are most secure financially, with 100.0% of males and 100.0% of females in these age groups living above the poverty line.
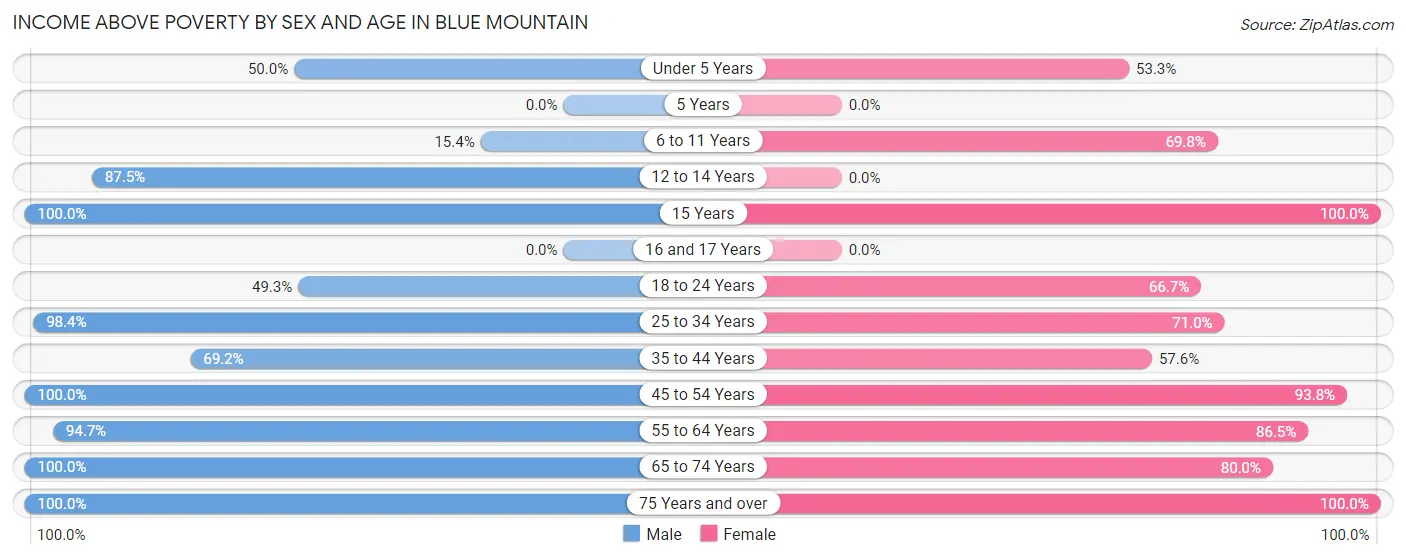
| Age Bracket | Male | Female |
| Under 5 Years | 24 (50.0%) | 8 (53.3%) |
| 5 Years | 0 (0.0%) | 0 (0.0%) |
| 6 to 11 Years | 2 (15.4%) | 30 (69.8%) |
| 12 to 14 Years | 56 (87.5%) | 0 (0.0%) |
| 15 Years | 1 (100.0%) | 3 (100.0%) |
| 16 and 17 Years | 0 (0.0%) | 0 (0.0%) |
| 18 to 24 Years | 33 (49.2%) | 32 (66.7%) |
| 25 to 34 Years | 61 (98.4%) | 49 (71.0%) |
| 35 to 44 Years | 18 (69.2%) | 19 (57.6%) |
| 45 to 54 Years | 54 (100.0%) | 75 (93.8%) |
| 55 to 64 Years | 36 (94.7%) | 45 (86.5%) |
| 65 to 74 Years | 37 (100.0%) | 24 (80.0%) |
| 75 Years and over | 2 (100.0%) | 15 (100.0%) |
| Total | 324 (78.6%) | 300 (75.4%) |
Income Below Poverty Among Married-Couple Families in Blue Mountain
The poverty statistics for married-couple families in Blue Mountain show that 5.8% or 7 of the total 121 families live below the poverty line. Families with 1 or 2 children have the highest poverty rate of 20.6%, comprising of 7 families. On the other hand, families with no children have the lowest poverty rate of 0.0%, which includes 0 families.
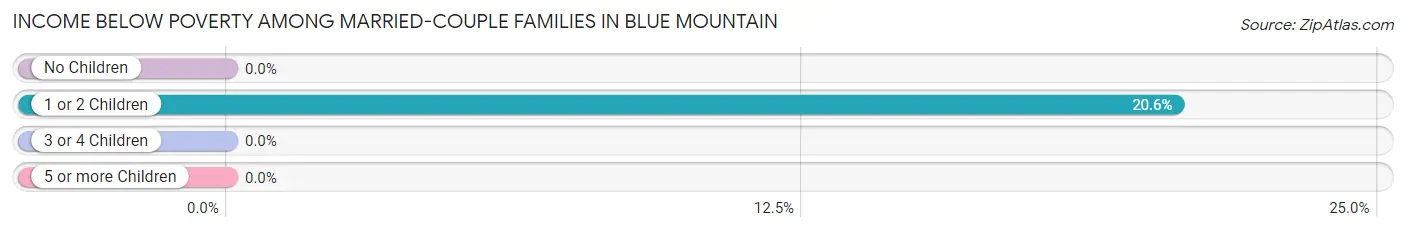
| Children | Above Poverty | Below Poverty |
| No Children | 85 (100.0%) | 0 (0.0%) |
| 1 or 2 Children | 27 (79.4%) | 7 (20.6%) |
| 3 or 4 Children | 2 (100.0%) | 0 (0.0%) |
| 5 or more Children | 0 (0.0%) | 0 (0.0%) |
| Total | 114 (94.2%) | 7 (5.8%) |
Income Below Poverty Among Single-Parent Households in Blue Mountain
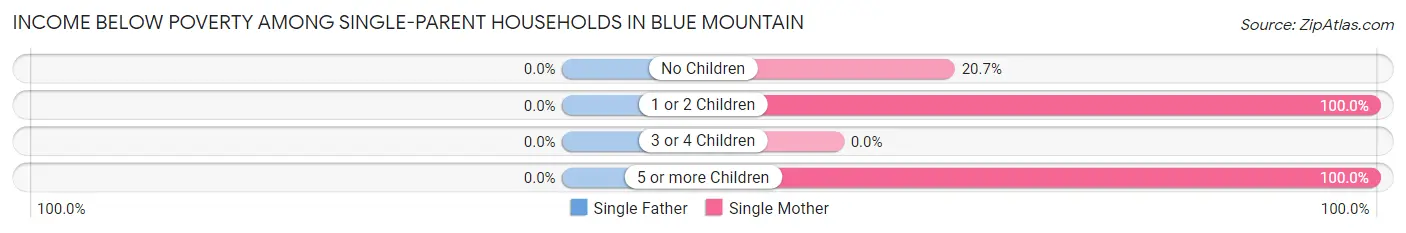
| Children | Single Father | Single Mother |
| No Children | 0 (0.0%) | 6 (20.7%) |
| 1 or 2 Children | 0 (0.0%) | 3 (100.0%) |
| 3 or 4 Children | 0 (0.0%) | 0 (0.0%) |
| 5 or more Children | 0 (0.0%) | 5 (100.0%) |
| Total | 0 (0.0%) | 14 (27.5%) |
Income Below Poverty Among Married-Couple vs Single-Parent Households in Blue Mountain
The poverty data for Blue Mountain shows that 7 of the married-couple family households (5.8%) and 14 of the single-parent households (17.7%) are living below the poverty level. Within the married-couple family households, those with 1 or 2 children have the highest poverty rate, with 7 households (20.6%) falling below the poverty line. Among the single-parent households, those with 5 or more children have the highest poverty rate, with 5 household (100.0%) living below poverty.
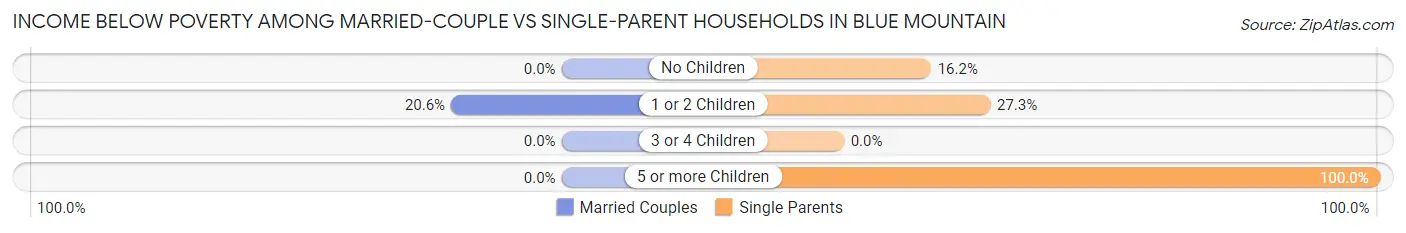
| Children | Married-Couple Families | Single-Parent Households |
| No Children | 0 (0.0%) | 6 (16.2%) |
| 1 or 2 Children | 7 (20.6%) | 3 (27.3%) |
| 3 or 4 Children | 0 (0.0%) | 0 (0.0%) |
| 5 or more Children | 0 (0.0%) | 5 (100.0%) |
| Total | 7 (5.8%) | 14 (17.7%) |
Race in Blue Mountain
The most populous races in Blue Mountain are White / Caucasian (679 | 61.7%), Black / African American (266 | 24.2%), and Two or more Races (104 | 9.5%).
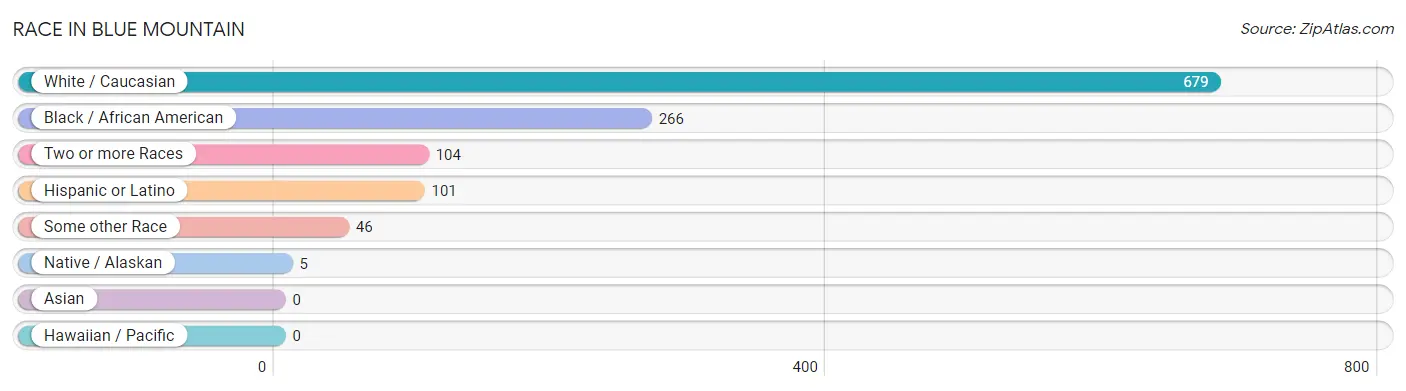
| Race | # Population | % Population |
| Asian | 0 | 0.0% |
| Black / African American | 266 | 24.2% |
| Hawaiian / Pacific | 0 | 0.0% |
| Hispanic or Latino | 101 | 9.2% |
| Native / Alaskan | 5 | 0.4% |
| White / Caucasian | 679 | 61.7% |
| Two or more Races | 104 | 9.5% |
| Some other Race | 46 | 4.2% |
| Total | 1,100 | 100.0% |
Ancestry in Blue Mountain
The most populous ancestries reported in Blue Mountain are English (128 | 11.6%), American (105 | 9.6%), Mexican (73 | 6.6%), Irish (44 | 4.0%), and German (38 | 3.5%), together accounting for 35.3% of all Blue Mountain residents.
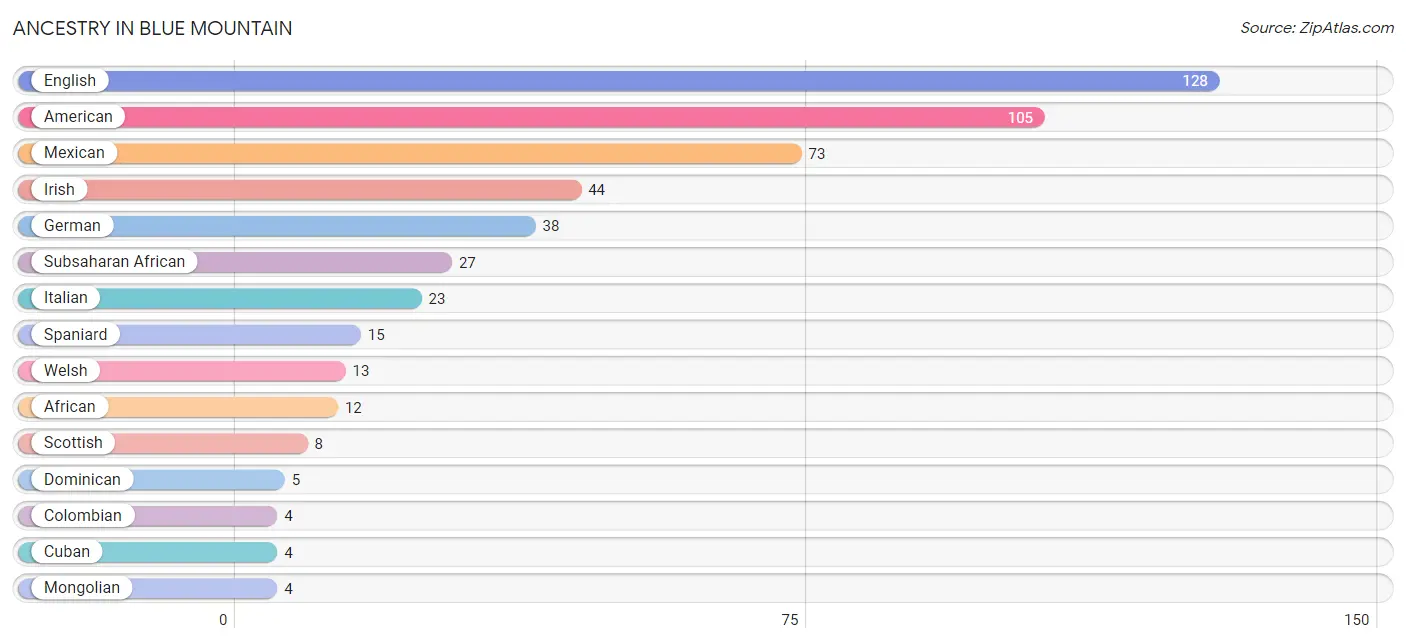
| Ancestry | # Population | % Population |
| African | 12 | 1.1% |
| American | 105 | 9.6% |
| Colombian | 4 | 0.4% |
| Cuban | 4 | 0.4% |
| Dominican | 5 | 0.4% |
| Eastern European | 2 | 0.2% |
| English | 128 | 11.6% |
| European | 2 | 0.2% |
| German | 38 | 3.5% |
| Irish | 44 | 4.0% |
| Italian | 23 | 2.1% |
| Mexican | 73 | 6.6% |
| Mongolian | 4 | 0.4% |
| Scottish | 8 | 0.7% |
| South American | 4 | 0.4% |
| Spaniard | 15 | 1.4% |
| Subsaharan African | 27 | 2.5% |
| Ukrainian | 4 | 0.4% |
| Welsh | 13 | 1.2% | View All 19 Rows |
Immigrants in Blue Mountain
The most numerous immigrant groups reported in Blue Mountain came from Latin America (19 | 1.7%), Asia (10 | 0.9%), Central America (10 | 0.9%), Eastern Asia (10 | 0.9%), and Japan (10 | 0.9%), together accounting for 5.4% of all Blue Mountain residents.
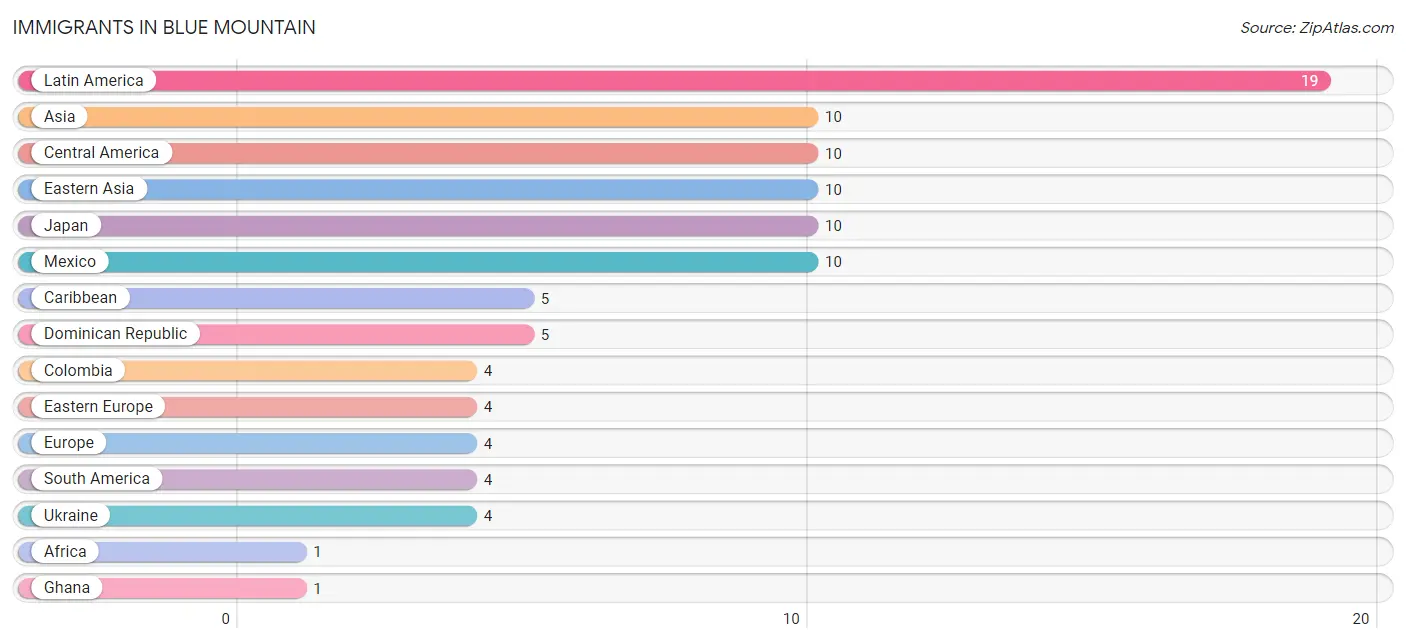
| Immigration Origin | # Population | % Population |
| Africa | 1 | 0.1% |
| Asia | 10 | 0.9% |
| Caribbean | 5 | 0.4% |
| Central America | 10 | 0.9% |
| Colombia | 4 | 0.4% |
| Dominican Republic | 5 | 0.4% |
| Eastern Asia | 10 | 0.9% |
| Eastern Europe | 4 | 0.4% |
| Europe | 4 | 0.4% |
| Ghana | 1 | 0.1% |
| Japan | 10 | 0.9% |
| Latin America | 19 | 1.7% |
| Mexico | 10 | 0.9% |
| South America | 4 | 0.4% |
| Ukraine | 4 | 0.4% |
| Western Africa | 1 | 0.1% | View All 16 Rows |
Sex and Age in Blue Mountain
Sex and Age in Blue Mountain
The most populous age groups in Blue Mountain are 20 to 24 Years (140 | 26.6%) for men and 15 to 19 Years (155 | 27.1%) for women.
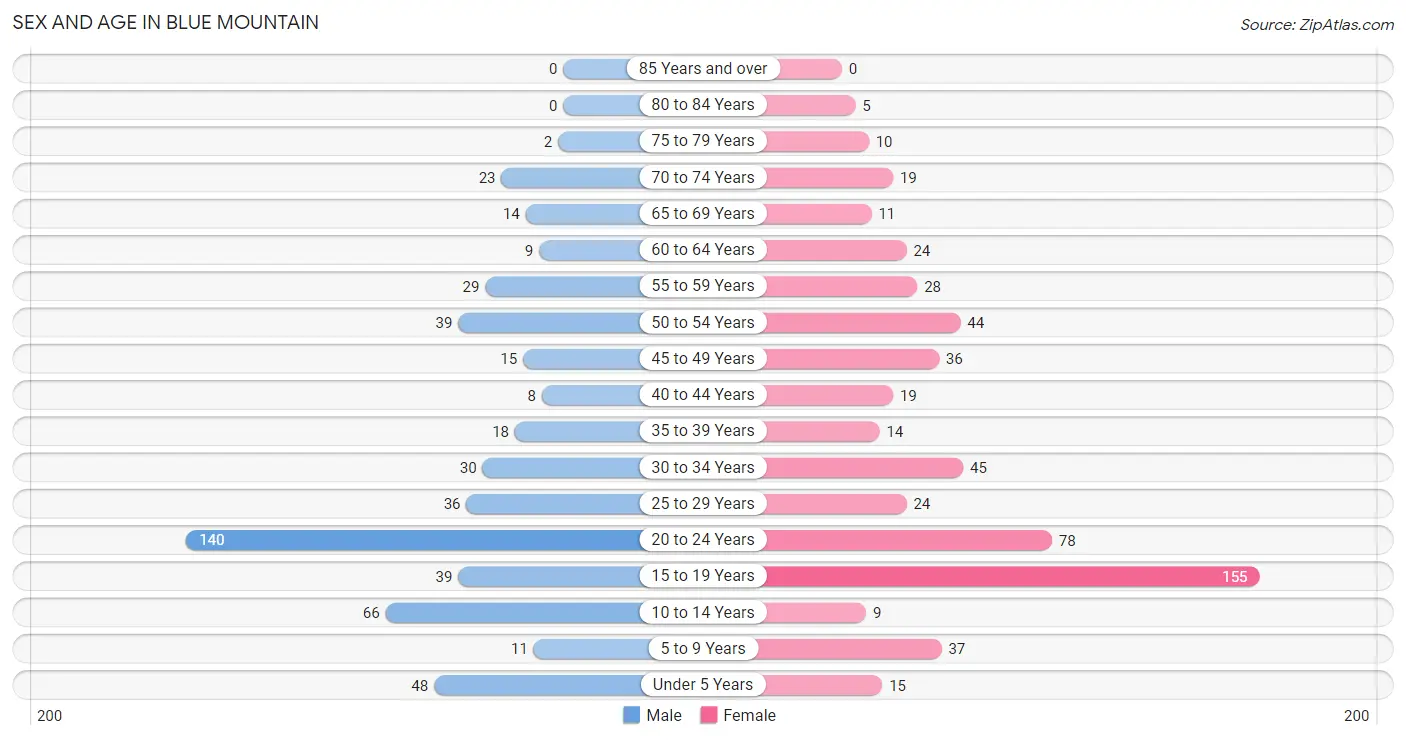
| Age Bracket | Male | Female |
| Under 5 Years | 48 (9.1%) | 15 (2.6%) |
| 5 to 9 Years | 11 (2.1%) | 37 (6.5%) |
| 10 to 14 Years | 66 (12.5%) | 9 (1.6%) |
| 15 to 19 Years | 39 (7.4%) | 155 (27.1%) |
| 20 to 24 Years | 140 (26.6%) | 78 (13.6%) |
| 25 to 29 Years | 36 (6.8%) | 24 (4.2%) |
| 30 to 34 Years | 30 (5.7%) | 45 (7.9%) |
| 35 to 39 Years | 18 (3.4%) | 14 (2.4%) |
| 40 to 44 Years | 8 (1.5%) | 19 (3.3%) |
| 45 to 49 Years | 15 (2.9%) | 36 (6.3%) |
| 50 to 54 Years | 39 (7.4%) | 44 (7.7%) |
| 55 to 59 Years | 29 (5.5%) | 28 (4.9%) |
| 60 to 64 Years | 9 (1.7%) | 24 (4.2%) |
| 65 to 69 Years | 14 (2.7%) | 11 (1.9%) |
| 70 to 74 Years | 23 (4.4%) | 19 (3.3%) |
| 75 to 79 Years | 2 (0.4%) | 10 (1.8%) |
| 80 to 84 Years | 0 (0.0%) | 5 (0.9%) |
| 85 Years and over | 0 (0.0%) | 0 (0.0%) |
| Total | 527 (100.0%) | 573 (100.0%) |
Families and Households in Blue Mountain
Median Family Size in Blue Mountain
The median family size in Blue Mountain is 3.15 persons per family, with single female/mother families (51 | 25.5%) accounting for the largest median family size of 4.14 persons per family. On the other hand, married-couple families (121 | 60.5%) represent the smallest median family size with 2.58 persons per family.
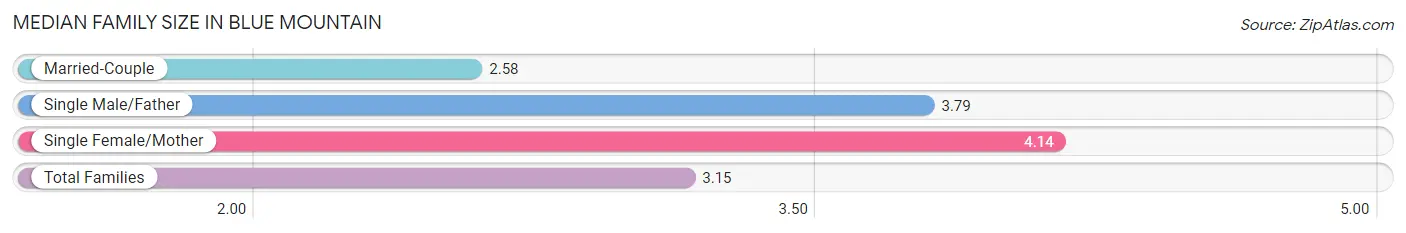
| Family Type | # Families | Family Size |
| Married-Couple | 121 (60.5%) | 2.58 |
| Single Male/Father | 28 (14.0%) | 3.79 |
| Single Female/Mother | 51 (25.5%) | 4.14 |
| Total Families | 200 (100.0%) | 3.15 |
Median Household Size in Blue Mountain
The median household size in Blue Mountain is 2.68 persons per household, with single female/mother households (51 | 16.9%) accounting for the largest median household size of 4.31 persons per household. non-family households (102 | 33.8%) represent the smallest median household size with 1.55 persons per household.
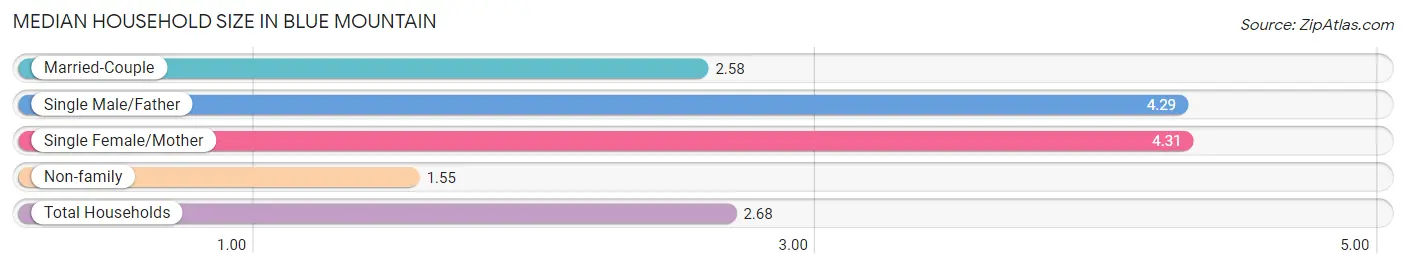
| Household Type | # Households | Household Size |
| Married-Couple | 121 (40.1%) | 2.58 |
| Single Male/Father | 28 (9.3%) | 4.29 |
| Single Female/Mother | 51 (16.9%) | 4.31 |
| Non-family | 102 (33.8%) | 1.55 |
| Total Households | 302 (100.0%) | 2.68 |
Household Size by Marriage Status in Blue Mountain
Out of a total of 302 households in Blue Mountain, 200 (66.2%) are family households, while 102 (33.8%) are nonfamily households. The most numerous type of family households are 3-person households, comprising 74, and the most common type of nonfamily households are 1-person households, comprising 83.
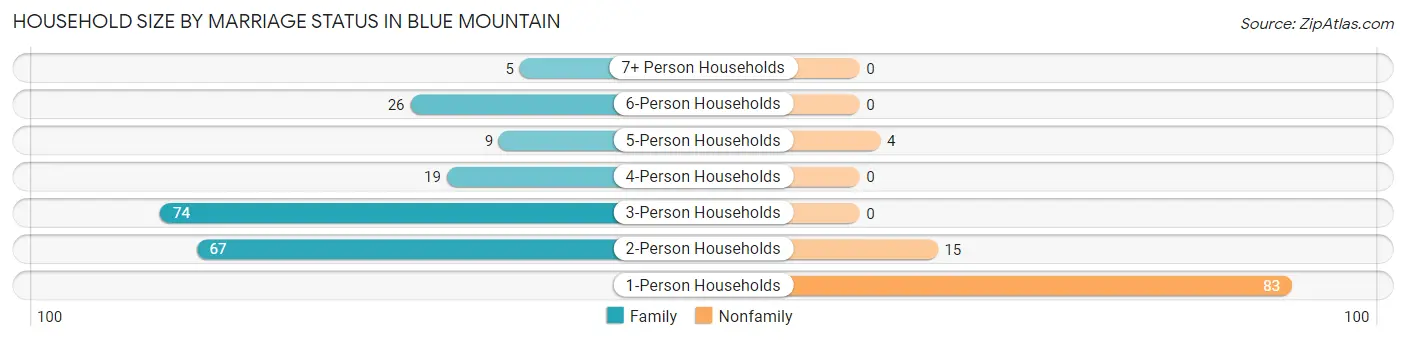
| Household Size | Family Households | Nonfamily Households |
| 1-Person Households | - | 83 (27.5%) |
| 2-Person Households | 67 (22.2%) | 15 (5.0%) |
| 3-Person Households | 74 (24.5%) | 0 (0.0%) |
| 4-Person Households | 19 (6.3%) | 0 (0.0%) |
| 5-Person Households | 9 (3.0%) | 4 (1.3%) |
| 6-Person Households | 26 (8.6%) | 0 (0.0%) |
| 7+ Person Households | 5 (1.7%) | 0 (0.0%) |
| Total | 200 (66.2%) | 102 (33.8%) |
Female Fertility in Blue Mountain
Fertility by Age in Blue Mountain
| Age Bracket | Women with Births | Births / 1,000 Women |
| 15 to 19 years | 0 (0.0%) | 0.0 |
| 20 to 34 years | 0 (0.0%) | 0.0 |
| 35 to 50 years | 0 (0.0%) | 0.0 |
| Total | 0 (0.0%) | 0.0 |
Fertility by Age by Marriage Status in Blue Mountain
| Age Bracket | Married | Unmarried |
| 15 to 19 years | 0 (0.0%) | 0 (0.0%) |
| 20 to 34 years | 0 (0.0%) | 0 (0.0%) |
| 35 to 50 years | 0 (0.0%) | 0 (0.0%) |
| Total | 0 (0.0%) | 0 (0.0%) |
Fertility by Education in Blue Mountain
| Educational Attainment | Women with Births | Births / 1,000 Women |
| Less than High School | 0 (0.0%) | 0.0 |
| High School Diploma | 0 (0.0%) | 0.0 |
| College or Associate's Degree | 0 (0.0%) | 0.0 |
| Bachelor's Degree | 0 (0.0%) | 0.0 |
| Graduate Degree | 0 (0.0%) | 0.0 |
| Total | 0 (0.0%) | 0.0 |
Fertility by Education by Marriage Status in Blue Mountain
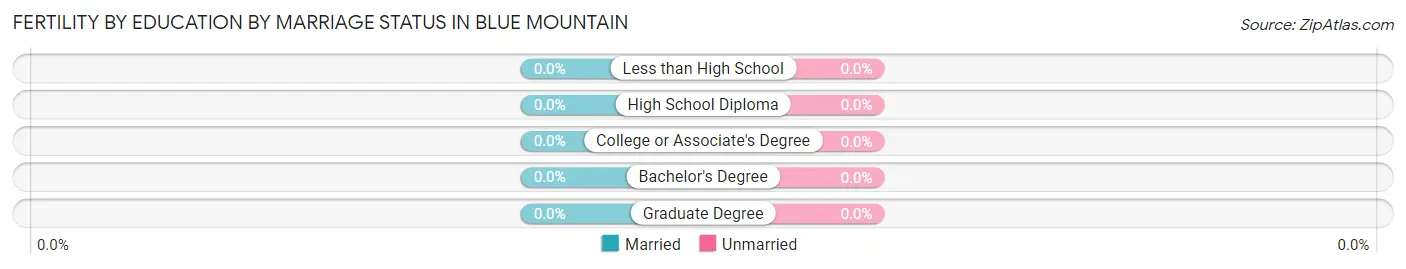
| Educational Attainment | Married | Unmarried |
| Less than High School | 0 (0.0%) | 0 (0.0%) |
| High School Diploma | 0 (0.0%) | 0 (0.0%) |
| College or Associate's Degree | 0 (0.0%) | 0 (0.0%) |
| Bachelor's Degree | 0 (0.0%) | 0 (0.0%) |
| Graduate Degree | 0 (0.0%) | 0 (0.0%) |
| Total | 0 (0.0%) | 0 (0.0%) |
Employment Characteristics in Blue Mountain
Employment by Class of Employer in Blue Mountain
Among the 439 employed individuals in Blue Mountain, private company employees (328 | 74.7%), not-for-profit organizations (56 | 12.8%), and local government employees (17 | 3.9%) make up the most common classes of employment.
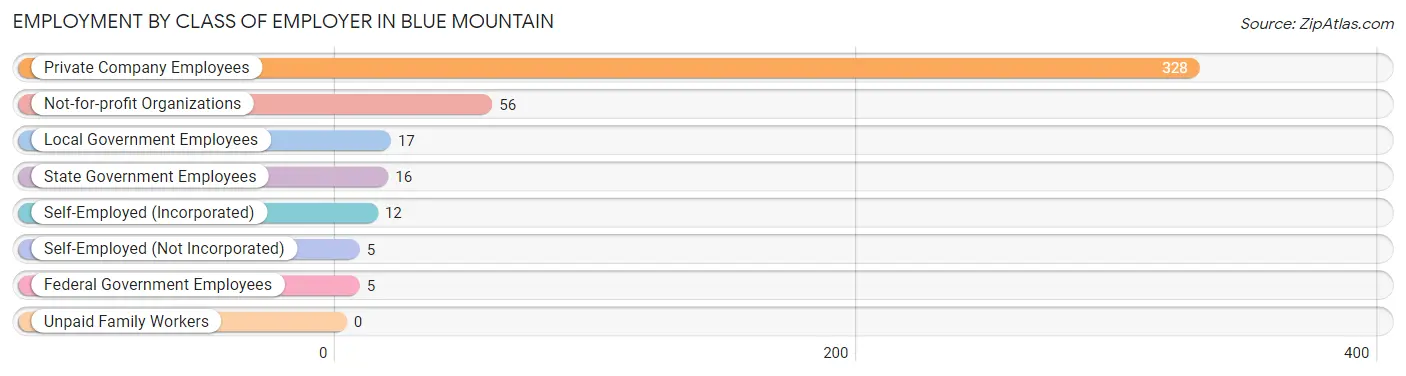
| Employer Class | # Employees | % Employees |
| Private Company Employees | 328 | 74.7% |
| Self-Employed (Incorporated) | 12 | 2.7% |
| Self-Employed (Not Incorporated) | 5 | 1.1% |
| Not-for-profit Organizations | 56 | 12.8% |
| Local Government Employees | 17 | 3.9% |
| State Government Employees | 16 | 3.6% |
| Federal Government Employees | 5 | 1.1% |
| Unpaid Family Workers | 0 | 0.0% |
| Total | 439 | 100.0% |
Employment Status by Age in Blue Mountain
According to the labor force statistics for Blue Mountain, out of the total population over 16 years of age (910), 50.5% or 460 individuals are in the labor force, with 1.1% or 5 of them unemployed. The age group with the highest labor force participation rate is 30 to 34 years, with 97.3% or 73 individuals in the labor force. Within the labor force, the 20 to 24 years age range has the highest percentage of unemployed individuals, with 3.5% or 4 of them being unemployed.
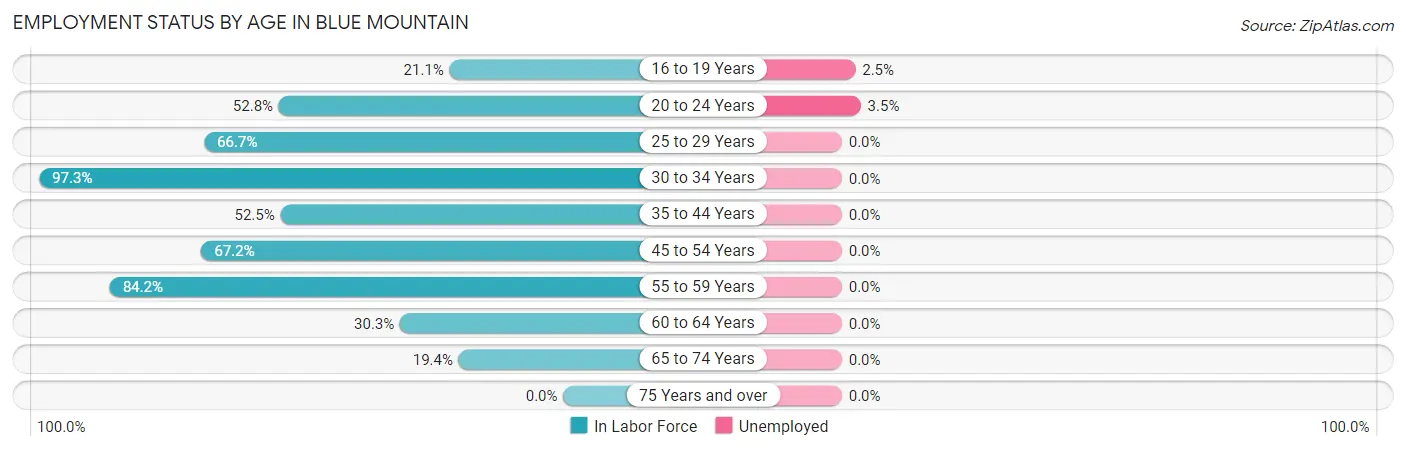
| Age Bracket | In Labor Force | Unemployed |
| 16 to 19 Years | 40 (21.1%) | 1 (2.5%) |
| 20 to 24 Years | 115 (52.8%) | 4 (3.5%) |
| 25 to 29 Years | 40 (66.7%) | 0 (0.0%) |
| 30 to 34 Years | 73 (97.3%) | 0 (0.0%) |
| 35 to 44 Years | 31 (52.5%) | 0 (0.0%) |
| 45 to 54 Years | 90 (67.2%) | 0 (0.0%) |
| 55 to 59 Years | 48 (84.2%) | 0 (0.0%) |
| 60 to 64 Years | 10 (30.3%) | 0 (0.0%) |
| 65 to 74 Years | 13 (19.4%) | 0 (0.0%) |
| 75 Years and over | 0 (0.0%) | 0 (0.0%) |
| Total | 460 (50.5%) | 5 (1.1%) |
Employment Status by Educational Attainment in Blue Mountain
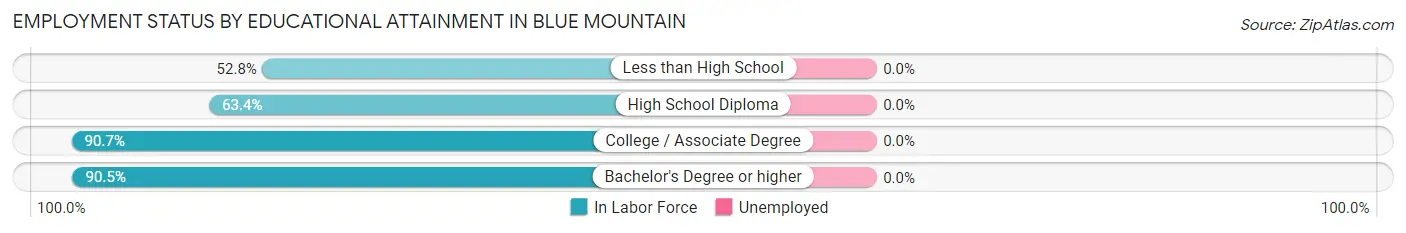
| Educational Attainment | In Labor Force | Unemployed |
| Less than High School | 67 (52.8%) | 0 (0.0%) |
| High School Diploma | 90 (63.4%) | 0 (0.0%) |
| College / Associate Degree | 78 (90.7%) | 0 (0.0%) |
| Bachelor's Degree or higher | 57 (90.5%) | 0 (0.0%) |
| Total | 292 (69.9%) | 0 (0.0%) |
Employment Occupations by Sex in Blue Mountain
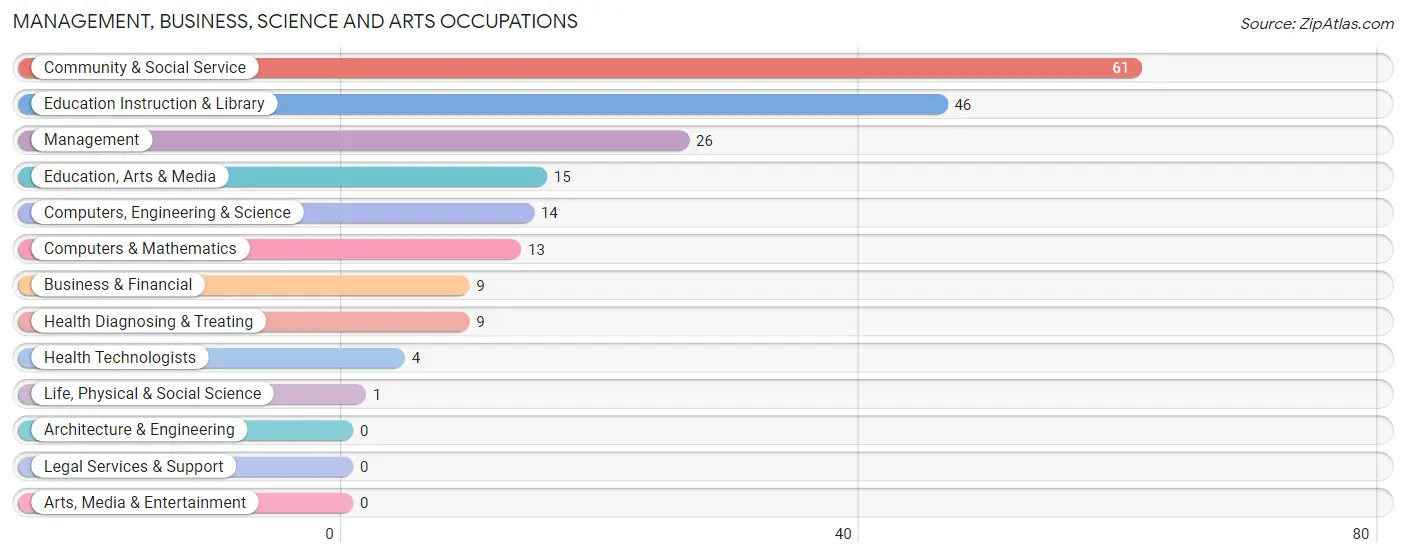
Management, Business, Science and Arts Occupations
The most common Management, Business, Science and Arts occupations in Blue Mountain are Community & Social Service (61 | 13.6%), Education Instruction & Library (46 | 10.2%), Management (26 | 5.8%), Education, Arts & Media (15 | 3.3%), and Computers, Engineering & Science (14 | 3.1%).
Management, Business, Science and Arts Occupations by Sex
Within the Management, Business, Science and Arts occupations in Blue Mountain, the most male-oriented occupations are Computers & Mathematics (100.0%), Education, Arts & Media (100.0%), and Computers, Engineering & Science (92.9%), while the most female-oriented occupations are Business & Financial (100.0%), Life, Physical & Social Science (100.0%), and Health Diagnosing & Treating (100.0%).
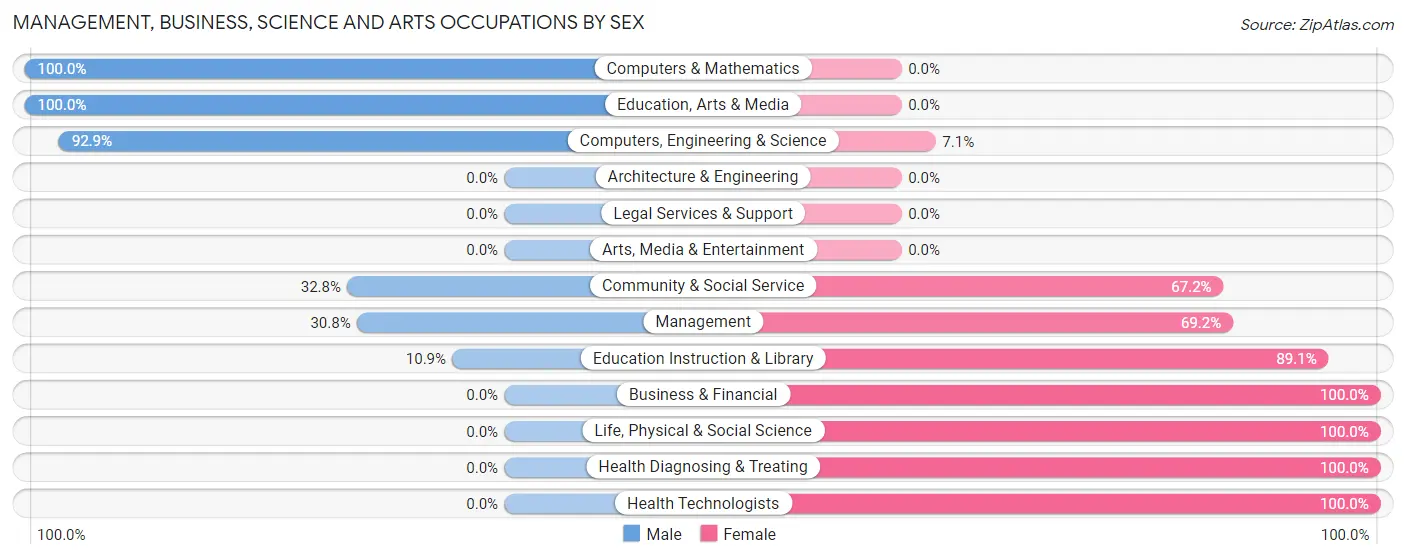
| Occupation | Male | Female |
| Management | 8 (30.8%) | 18 (69.2%) |
| Business & Financial | 0 (0.0%) | 9 (100.0%) |
| Computers, Engineering & Science | 13 (92.9%) | 1 (7.1%) |
| Computers & Mathematics | 13 (100.0%) | 0 (0.0%) |
| Architecture & Engineering | 0 (0.0%) | 0 (0.0%) |
| Life, Physical & Social Science | 0 (0.0%) | 1 (100.0%) |
| Community & Social Service | 20 (32.8%) | 41 (67.2%) |
| Education, Arts & Media | 15 (100.0%) | 0 (0.0%) |
| Legal Services & Support | 0 (0.0%) | 0 (0.0%) |
| Education Instruction & Library | 5 (10.9%) | 41 (89.1%) |
| Arts, Media & Entertainment | 0 (0.0%) | 0 (0.0%) |
| Health Diagnosing & Treating | 0 (0.0%) | 9 (100.0%) |
| Health Technologists | 0 (0.0%) | 4 (100.0%) |
| Total (Category) | 41 (34.4%) | 78 (65.5%) |
| Total (Overall) | 203 (45.1%) | 247 (54.9%) |
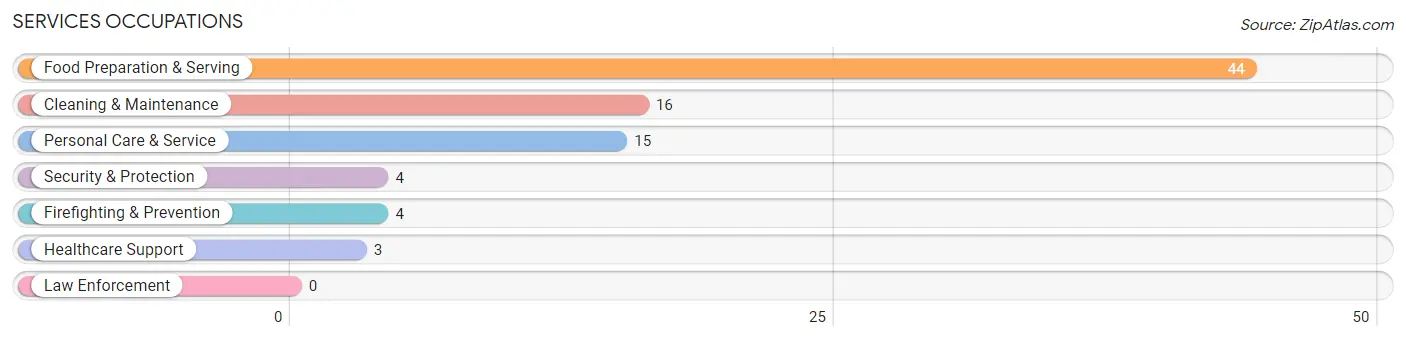
Services Occupations
The most common Services occupations in Blue Mountain are Food Preparation & Serving (44 | 9.8%), Cleaning & Maintenance (16 | 3.6%), Personal Care & Service (15 | 3.3%), Security & Protection (4 | 0.9%), and Firefighting & Prevention (4 | 0.9%).
Services Occupations by Sex
Within the Services occupations in Blue Mountain, the most male-oriented occupations are Cleaning & Maintenance (56.2%), and Food Preparation & Serving (45.5%), while the most female-oriented occupations are Healthcare Support (100.0%), Security & Protection (100.0%), and Firefighting & Prevention (100.0%).
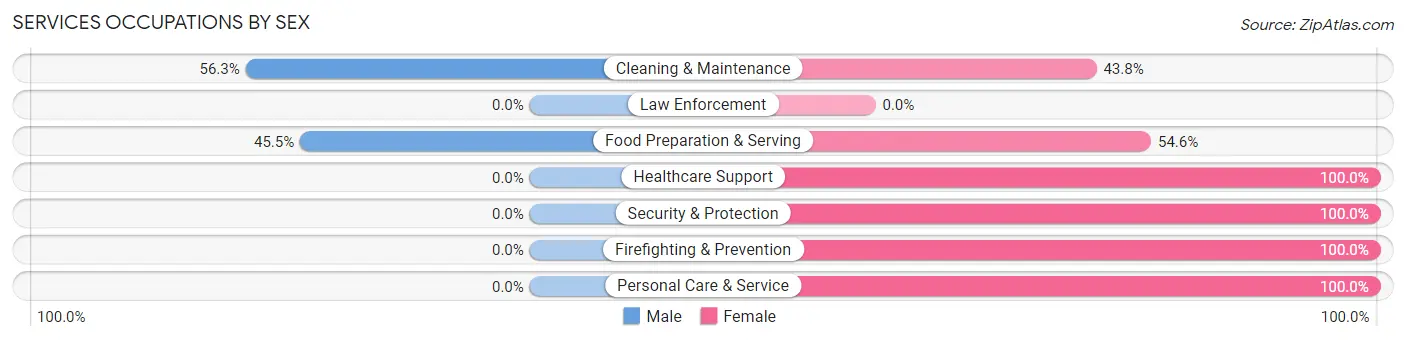
| Occupation | Male | Female |
| Healthcare Support | 0 (0.0%) | 3 (100.0%) |
| Security & Protection | 0 (0.0%) | 4 (100.0%) |
| Firefighting & Prevention | 0 (0.0%) | 4 (100.0%) |
| Law Enforcement | 0 (0.0%) | 0 (0.0%) |
| Food Preparation & Serving | 20 (45.5%) | 24 (54.5%) |
| Cleaning & Maintenance | 9 (56.2%) | 7 (43.8%) |
| Personal Care & Service | 0 (0.0%) | 15 (100.0%) |
| Total (Category) | 29 (35.4%) | 53 (64.6%) |
| Total (Overall) | 203 (45.1%) | 247 (54.9%) |
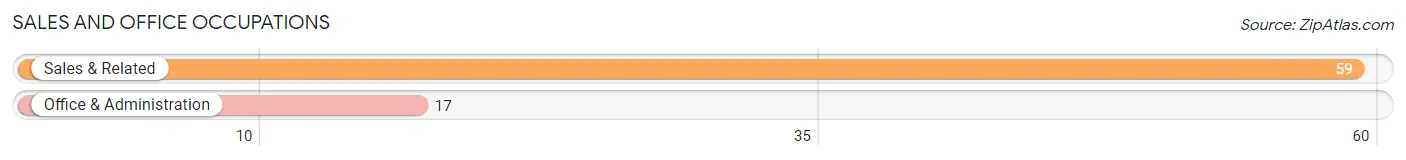
Sales and Office Occupations
The most common Sales and Office occupations in Blue Mountain are Sales & Related (59 | 13.1%), and Office & Administration (17 | 3.8%).
Sales and Office Occupations by Sex
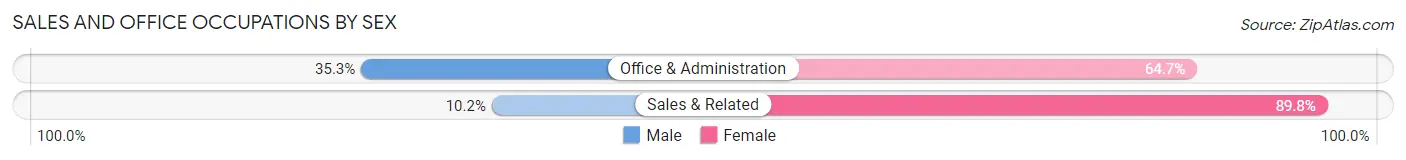
| Occupation | Male | Female |
| Sales & Related | 6 (10.2%) | 53 (89.8%) |
| Office & Administration | 6 (35.3%) | 11 (64.7%) |
| Total (Category) | 12 (15.8%) | 64 (84.2%) |
| Total (Overall) | 203 (45.1%) | 247 (54.9%) |
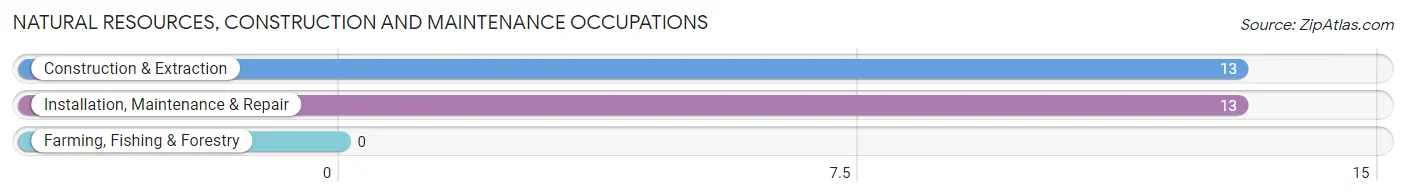
Natural Resources, Construction and Maintenance Occupations
The most common Natural Resources, Construction and Maintenance occupations in Blue Mountain are Construction & Extraction (13 | 2.9%), and Installation, Maintenance & Repair (13 | 2.9%).
Natural Resources, Construction and Maintenance Occupations by Sex
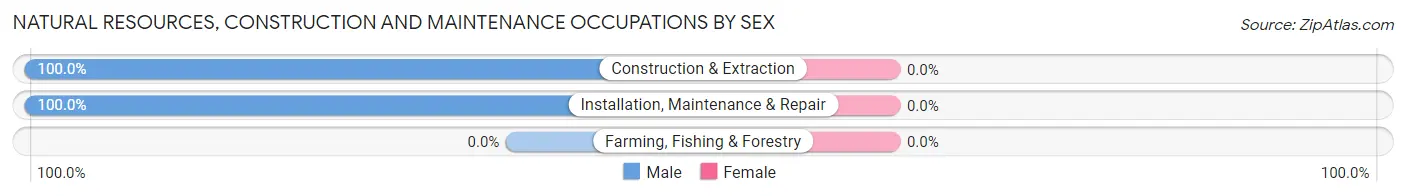
| Occupation | Male | Female |
| Farming, Fishing & Forestry | 0 (0.0%) | 0 (0.0%) |
| Construction & Extraction | 13 (100.0%) | 0 (0.0%) |
| Installation, Maintenance & Repair | 13 (100.0%) | 0 (0.0%) |
| Total (Category) | 26 (100.0%) | 0 (0.0%) |
| Total (Overall) | 203 (45.1%) | 247 (54.9%) |
Production, Transportation and Moving Occupations
The most common Production, Transportation and Moving occupations in Blue Mountain are Production (91 | 20.2%), Material Moving (44 | 9.8%), and Transportation (12 | 2.7%).

Production, Transportation and Moving Occupations by Sex
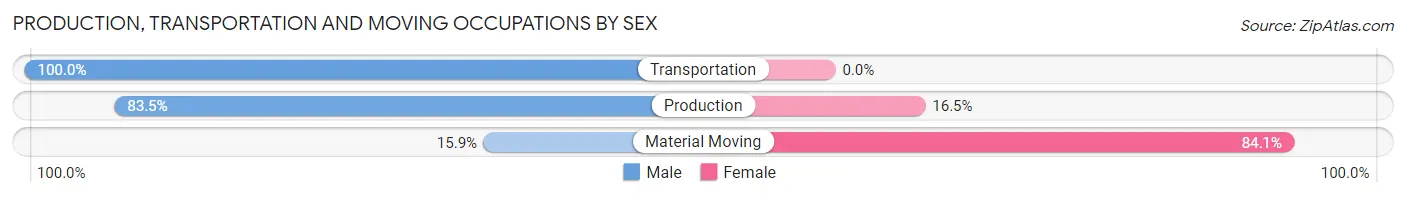
| Occupation | Male | Female |
| Production | 76 (83.5%) | 15 (16.5%) |
| Transportation | 12 (100.0%) | 0 (0.0%) |
| Material Moving | 7 (15.9%) | 37 (84.1%) |
| Total (Category) | 95 (64.6%) | 52 (35.4%) |
| Total (Overall) | 203 (45.1%) | 247 (54.9%) |
Employment Industries by Sex in Blue Mountain
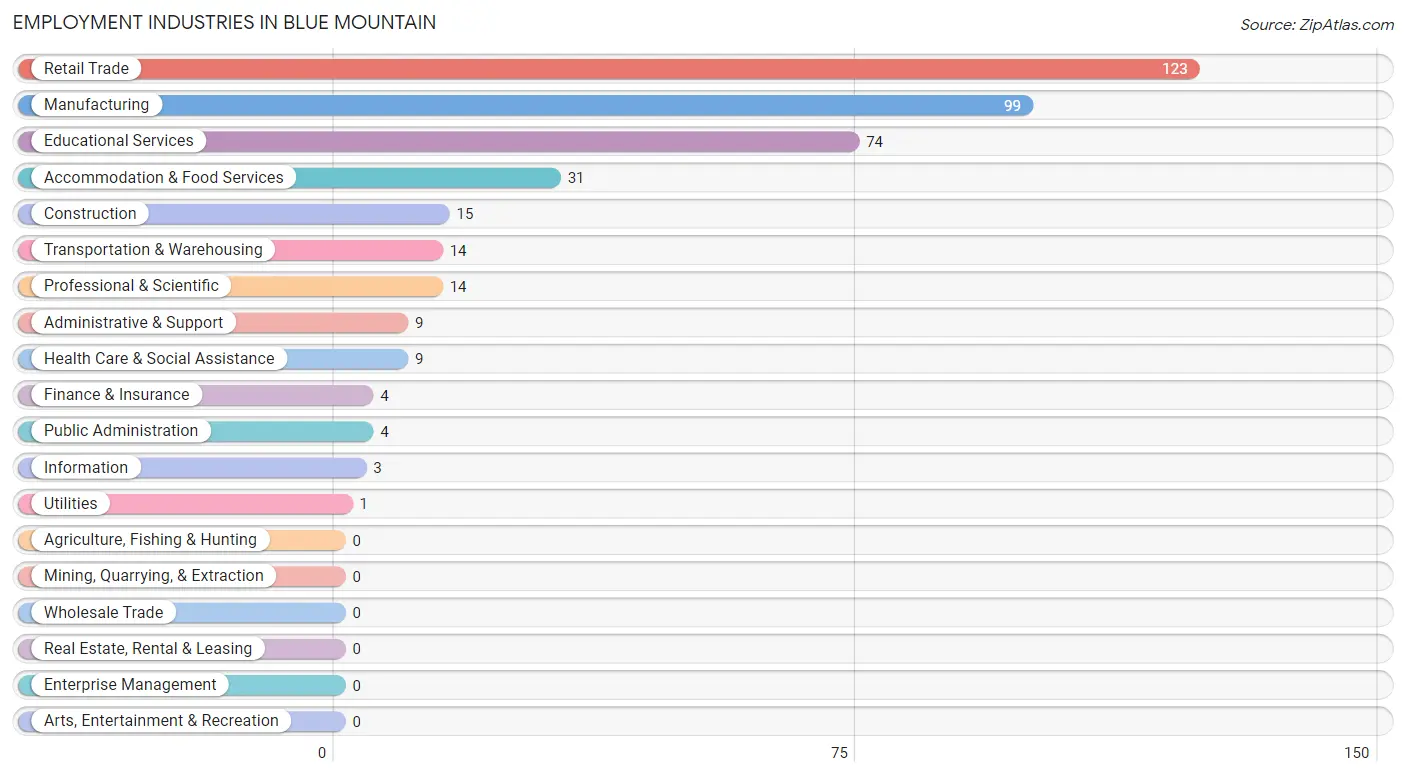
Employment Industries in Blue Mountain
The major employment industries in Blue Mountain include Retail Trade (123 | 27.3%), Manufacturing (99 | 22.0%), Educational Services (74 | 16.4%), Accommodation & Food Services (31 | 6.9%), and Construction (15 | 3.3%).
Employment Industries by Sex in Blue Mountain
The Blue Mountain industries that see more men than women are Construction (100.0%), Transportation & Warehousing (100.0%), and Utilities (100.0%), whereas the industries that tend to have a higher number of women are Finance & Insurance (100.0%), Health Care & Social Assistance (100.0%), and Educational Services (93.2%).
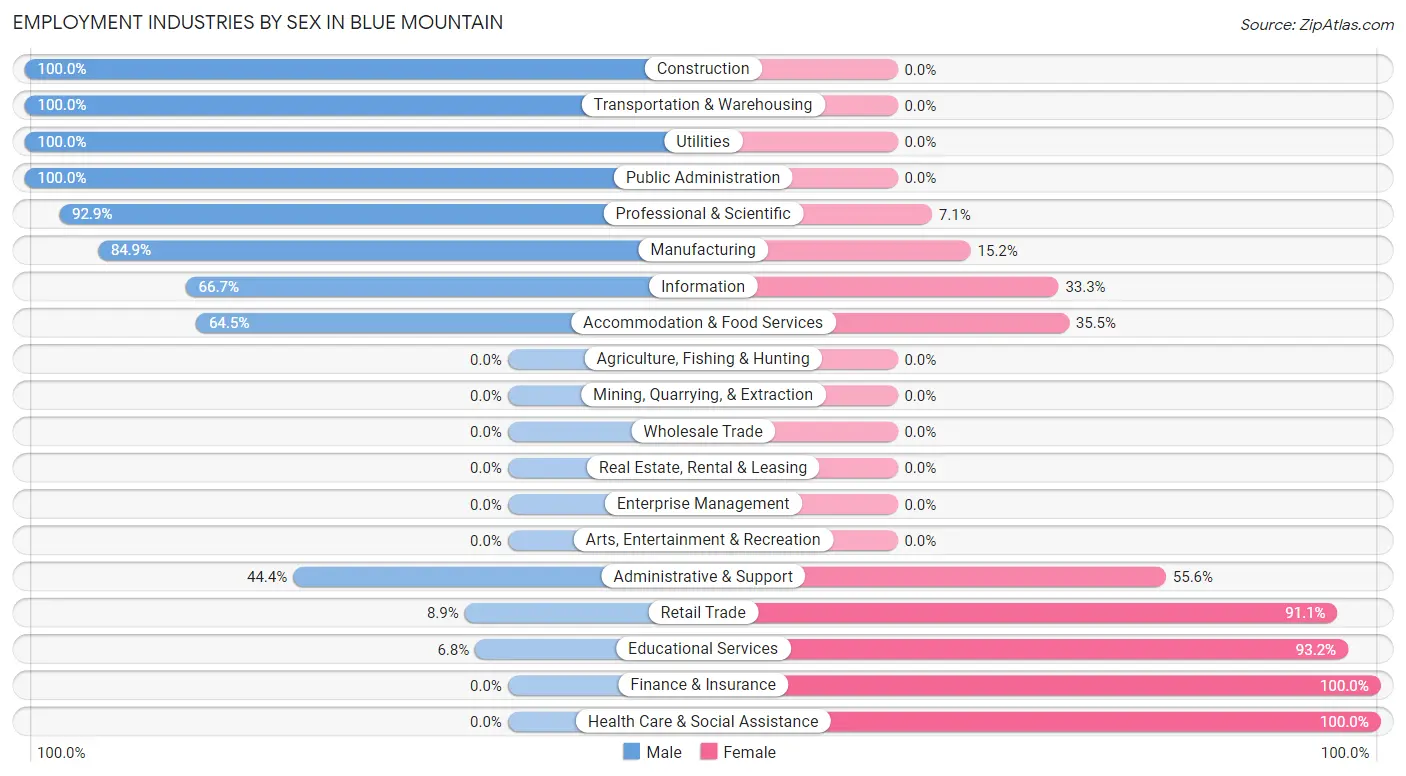
| Industry | Male | Female |
| Agriculture, Fishing & Hunting | 0 (0.0%) | 0 (0.0%) |
| Mining, Quarrying, & Extraction | 0 (0.0%) | 0 (0.0%) |
| Construction | 15 (100.0%) | 0 (0.0%) |
| Manufacturing | 84 (84.9%) | 15 (15.1%) |
| Wholesale Trade | 0 (0.0%) | 0 (0.0%) |
| Retail Trade | 11 (8.9%) | 112 (91.1%) |
| Transportation & Warehousing | 14 (100.0%) | 0 (0.0%) |
| Utilities | 1 (100.0%) | 0 (0.0%) |
| Information | 2 (66.7%) | 1 (33.3%) |
| Finance & Insurance | 0 (0.0%) | 4 (100.0%) |
| Real Estate, Rental & Leasing | 0 (0.0%) | 0 (0.0%) |
| Professional & Scientific | 13 (92.9%) | 1 (7.1%) |
| Enterprise Management | 0 (0.0%) | 0 (0.0%) |
| Administrative & Support | 4 (44.4%) | 5 (55.6%) |
| Educational Services | 5 (6.8%) | 69 (93.2%) |
| Health Care & Social Assistance | 0 (0.0%) | 9 (100.0%) |
| Arts, Entertainment & Recreation | 0 (0.0%) | 0 (0.0%) |
| Accommodation & Food Services | 20 (64.5%) | 11 (35.5%) |
| Public Administration | 4 (100.0%) | 0 (0.0%) |
| Total | 203 (45.1%) | 247 (54.9%) |
Education in Blue Mountain
School Enrollment in Blue Mountain
The most common levels of schooling among the 524 students in Blue Mountain are college / undergraduate (369 | 70.4%), middle school (68 | 13.0%), and elementary school (35 | 6.7%).
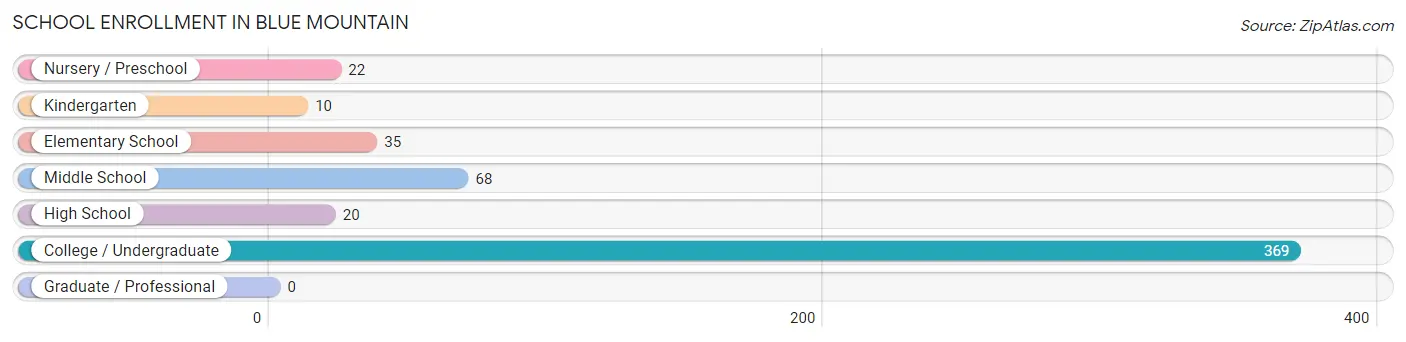
| School Level | # Students | % Students |
| Nursery / Preschool | 22 | 4.2% |
| Kindergarten | 10 | 1.9% |
| Elementary School | 35 | 6.7% |
| Middle School | 68 | 13.0% |
| High School | 20 | 3.8% |
| College / Undergraduate | 369 | 70.4% |
| Graduate / Professional | 0 | 0.0% |
| Total | 524 | 100.0% |
School Enrollment by Age by Funding Source in Blue Mountain
Out of a total of 524 students who are enrolled in schools in Blue Mountain, 160 (30.5%) attend a private institution, while the remaining 364 (69.5%) are enrolled in public schools. The age group of 20 to 24 year olds has the highest likelihood of being enrolled in private schools, with 125 (70.2% in the age bracket) enrolled. Conversely, the age group of 3 to 4 year olds has the lowest likelihood of being enrolled in a private school, with 19 (100.0% in the age bracket) attending a public institution.
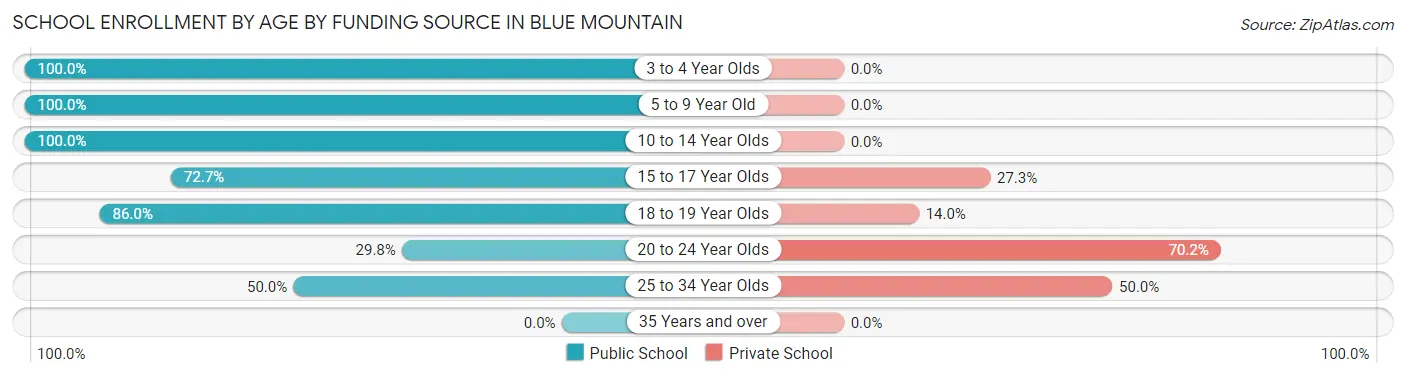
| Age Bracket | Public School | Private School |
| 3 to 4 Year Olds | 19 (100.0%) | 0 (0.0%) |
| 5 to 9 Year Old | 48 (100.0%) | 0 (0.0%) |
| 10 to 14 Year Olds | 75 (100.0%) | 0 (0.0%) |
| 15 to 17 Year Olds | 8 (72.7%) | 3 (27.3%) |
| 18 to 19 Year Olds | 154 (86.0%) | 25 (14.0%) |
| 20 to 24 Year Olds | 53 (29.8%) | 125 (70.2%) |
| 25 to 34 Year Olds | 7 (50.0%) | 7 (50.0%) |
| 35 Years and over | 0 (0.0%) | 0 (0.0%) |
| Total | 364 (69.5%) | 160 (30.5%) |
Educational Attainment by Field of Study in Blue Mountain
Education (20 | 26.0%), business (18 | 23.4%), psychology (16 | 20.8%), literature & languages (10 | 13.0%), and visual & performing arts (6 | 7.8%) are the most common fields of study among 77 individuals in Blue Mountain who have obtained a bachelor's degree or higher.
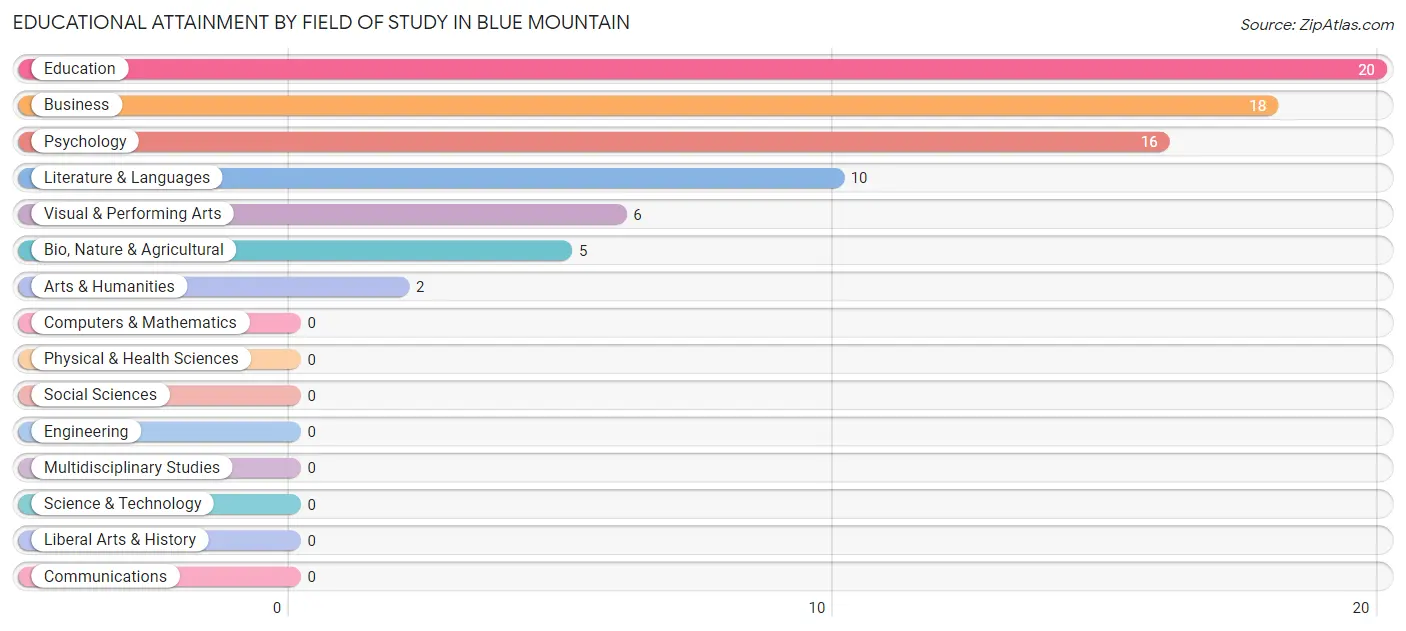
| Field of Study | # Graduates | % Graduates |
| Computers & Mathematics | 0 | 0.0% |
| Bio, Nature & Agricultural | 5 | 6.5% |
| Physical & Health Sciences | 0 | 0.0% |
| Psychology | 16 | 20.8% |
| Social Sciences | 0 | 0.0% |
| Engineering | 0 | 0.0% |
| Multidisciplinary Studies | 0 | 0.0% |
| Science & Technology | 0 | 0.0% |
| Business | 18 | 23.4% |
| Education | 20 | 26.0% |
| Literature & Languages | 10 | 13.0% |
| Liberal Arts & History | 0 | 0.0% |
| Visual & Performing Arts | 6 | 7.8% |
| Communications | 0 | 0.0% |
| Arts & Humanities | 2 | 2.6% |
| Total | 77 | 100.0% |
Transportation & Commute in Blue Mountain
Vehicle Availability by Sex in Blue Mountain
The most prevalent vehicle ownership categories in Blue Mountain are males with 1 vehicle (61, accounting for 33.3%) and females with 1 vehicle (35, making up 35.1%).
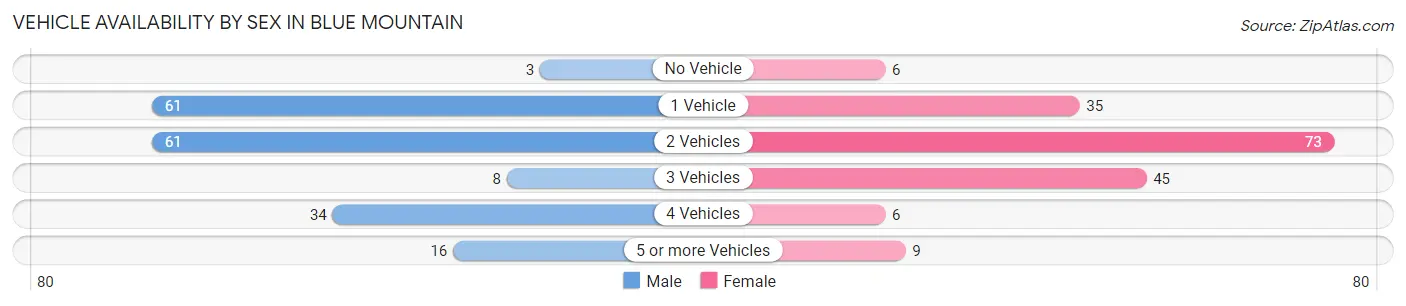
| Vehicles Available | Male | Female |
| No Vehicle | 3 (1.6%) | 6 (3.5%) |
| 1 Vehicle | 61 (33.3%) | 35 (20.1%) |
| 2 Vehicles | 61 (33.3%) | 73 (41.9%) |
| 3 Vehicles | 8 (4.4%) | 45 (25.9%) |
| 4 Vehicles | 34 (18.6%) | 6 (3.5%) |
| 5 or more Vehicles | 16 (8.7%) | 9 (5.2%) |
| Total | 183 (100.0%) | 174 (100.0%) |
Commute Time in Blue Mountain
The most frequently occuring commute durations in Blue Mountain are 15 to 19 minutes (106 commuters, 26.2%), 5 to 9 minutes (64 commuters, 15.8%), and 20 to 24 minutes (51 commuters, 12.6%).
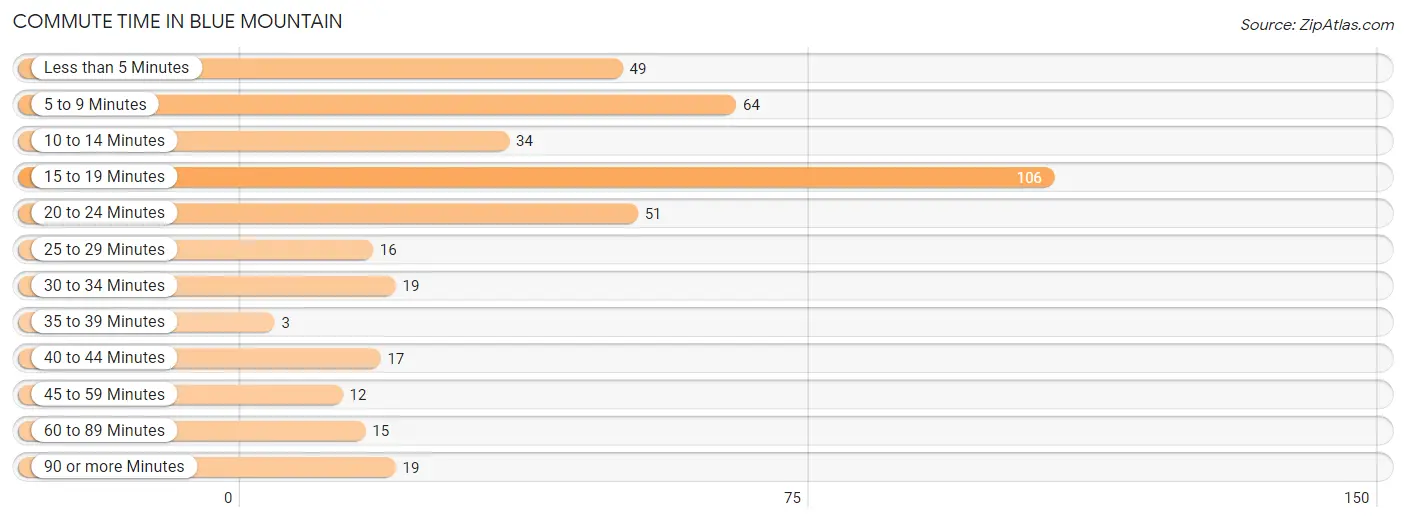
| Commute Time | # Commuters | % Commuters |
| Less than 5 Minutes | 49 | 12.1% |
| 5 to 9 Minutes | 64 | 15.8% |
| 10 to 14 Minutes | 34 | 8.4% |
| 15 to 19 Minutes | 106 | 26.2% |
| 20 to 24 Minutes | 51 | 12.6% |
| 25 to 29 Minutes | 16 | 4.0% |
| 30 to 34 Minutes | 19 | 4.7% |
| 35 to 39 Minutes | 3 | 0.7% |
| 40 to 44 Minutes | 17 | 4.2% |
| 45 to 59 Minutes | 12 | 3.0% |
| 60 to 89 Minutes | 15 | 3.7% |
| 90 or more Minutes | 19 | 4.7% |
Commute Time by Sex in Blue Mountain
The most common commute times in Blue Mountain are 15 to 19 minutes (34 commuters, 17.3%) for males and 15 to 19 minutes (72 commuters, 34.6%) for females.
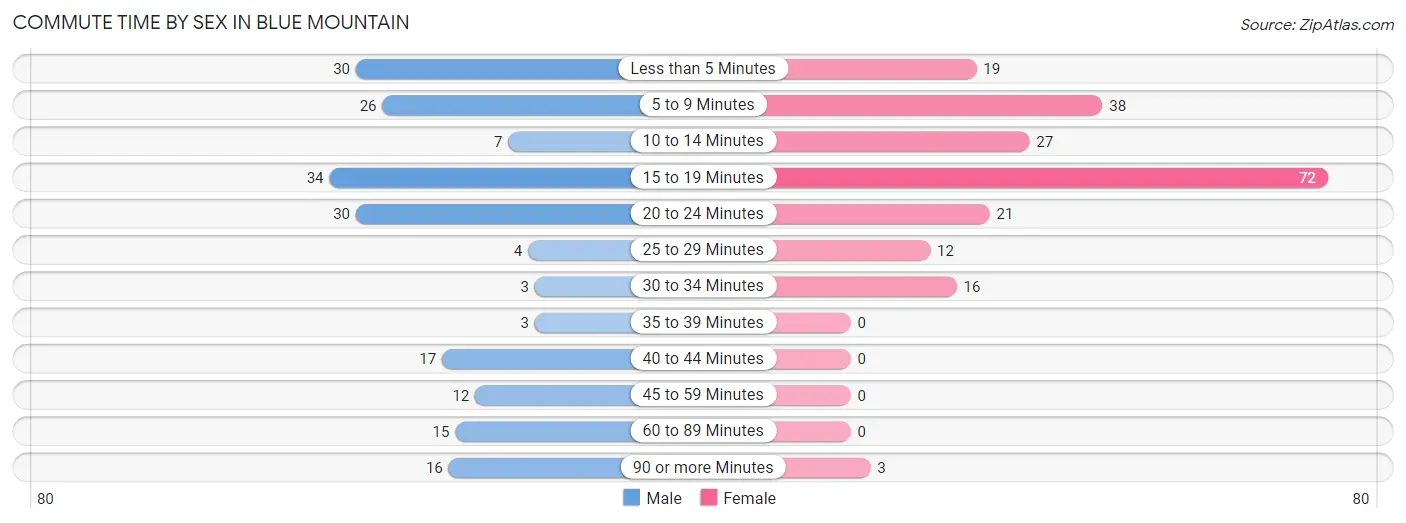
| Commute Time | Male | Female |
| Less than 5 Minutes | 30 (15.2%) | 19 (9.1%) |
| 5 to 9 Minutes | 26 (13.2%) | 38 (18.3%) |
| 10 to 14 Minutes | 7 (3.5%) | 27 (13.0%) |
| 15 to 19 Minutes | 34 (17.3%) | 72 (34.6%) |
| 20 to 24 Minutes | 30 (15.2%) | 21 (10.1%) |
| 25 to 29 Minutes | 4 (2.0%) | 12 (5.8%) |
| 30 to 34 Minutes | 3 (1.5%) | 16 (7.7%) |
| 35 to 39 Minutes | 3 (1.5%) | 0 (0.0%) |
| 40 to 44 Minutes | 17 (8.6%) | 0 (0.0%) |
| 45 to 59 Minutes | 12 (6.1%) | 0 (0.0%) |
| 60 to 89 Minutes | 15 (7.6%) | 0 (0.0%) |
| 90 or more Minutes | 16 (8.1%) | 3 (1.4%) |
Time of Departure to Work by Sex in Blue Mountain
The most frequent times of departure to work in Blue Mountain are 12:00 PM to 3:59 PM (49, 24.9%) for males and 7:30 AM to 7:59 AM (33, 15.9%) for females.
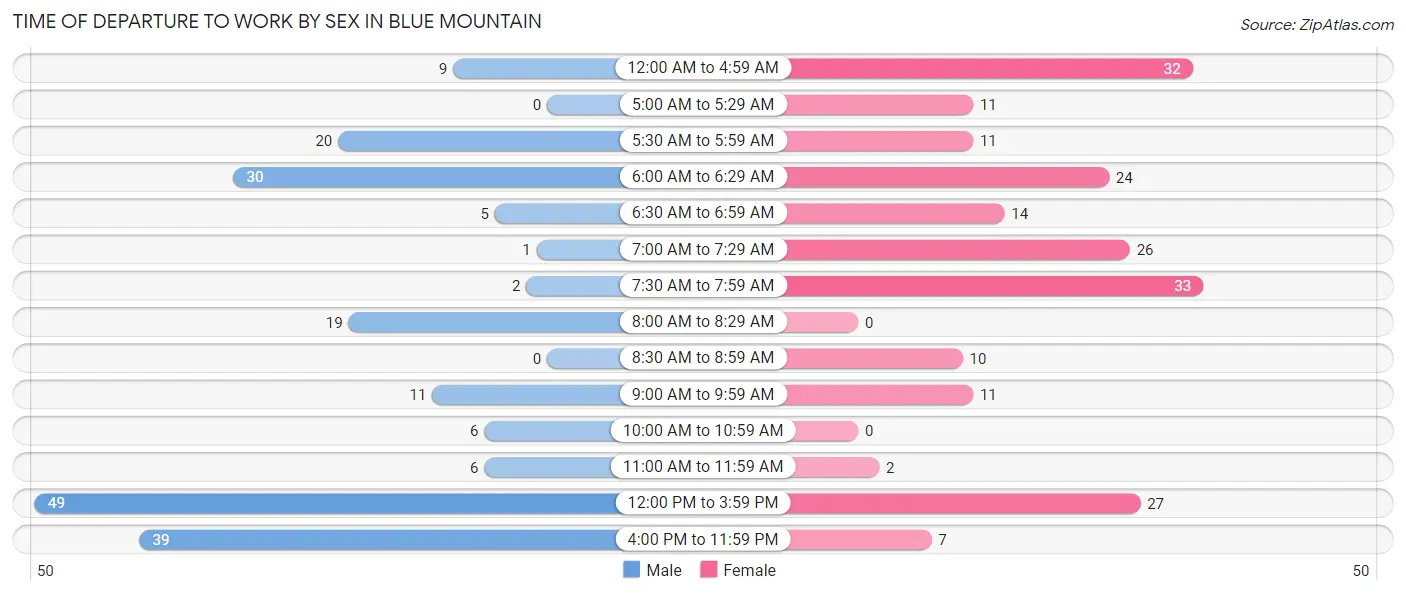
| Time of Departure | Male | Female |
| 12:00 AM to 4:59 AM | 9 (4.6%) | 32 (15.4%) |
| 5:00 AM to 5:29 AM | 0 (0.0%) | 11 (5.3%) |
| 5:30 AM to 5:59 AM | 20 (10.2%) | 11 (5.3%) |
| 6:00 AM to 6:29 AM | 30 (15.2%) | 24 (11.5%) |
| 6:30 AM to 6:59 AM | 5 (2.5%) | 14 (6.7%) |
| 7:00 AM to 7:29 AM | 1 (0.5%) | 26 (12.5%) |
| 7:30 AM to 7:59 AM | 2 (1.0%) | 33 (15.9%) |
| 8:00 AM to 8:29 AM | 19 (9.6%) | 0 (0.0%) |
| 8:30 AM to 8:59 AM | 0 (0.0%) | 10 (4.8%) |
| 9:00 AM to 9:59 AM | 11 (5.6%) | 11 (5.3%) |
| 10:00 AM to 10:59 AM | 6 (3.0%) | 0 (0.0%) |
| 11:00 AM to 11:59 AM | 6 (3.0%) | 2 (1.0%) |
| 12:00 PM to 3:59 PM | 49 (24.9%) | 27 (13.0%) |
| 4:00 PM to 11:59 PM | 39 (19.8%) | 7 (3.4%) |
| Total | 197 (100.0%) | 208 (100.0%) |
Housing Occupancy in Blue Mountain
Occupancy by Ownership in Blue Mountain
Of the total 302 dwellings in Blue Mountain, owner-occupied units account for 155 (51.3%), while renter-occupied units make up 147 (48.7%).
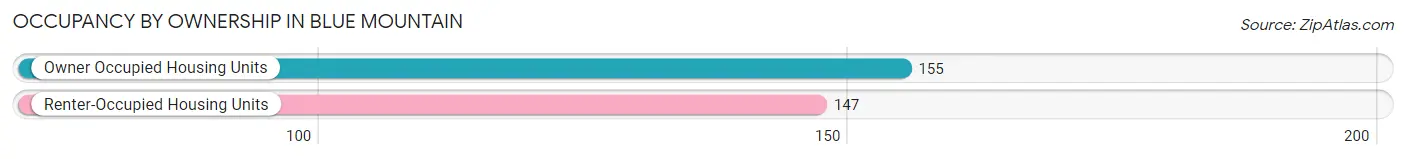
| Occupancy | # Housing Units | % Housing Units |
| Owner Occupied Housing Units | 155 | 51.3% |
| Renter-Occupied Housing Units | 147 | 48.7% |
| Total Occupied Housing Units | 302 | 100.0% |
Occupancy by Household Size in Blue Mountain
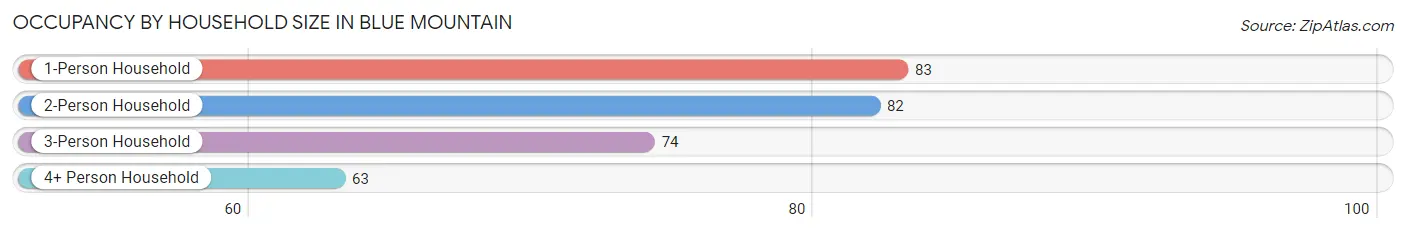
| Household Size | # Housing Units | % Housing Units |
| 1-Person Household | 83 | 27.5% |
| 2-Person Household | 82 | 27.2% |
| 3-Person Household | 74 | 24.5% |
| 4+ Person Household | 63 | 20.9% |
| Total Housing Units | 302 | 100.0% |
Occupancy by Ownership by Household Size in Blue Mountain
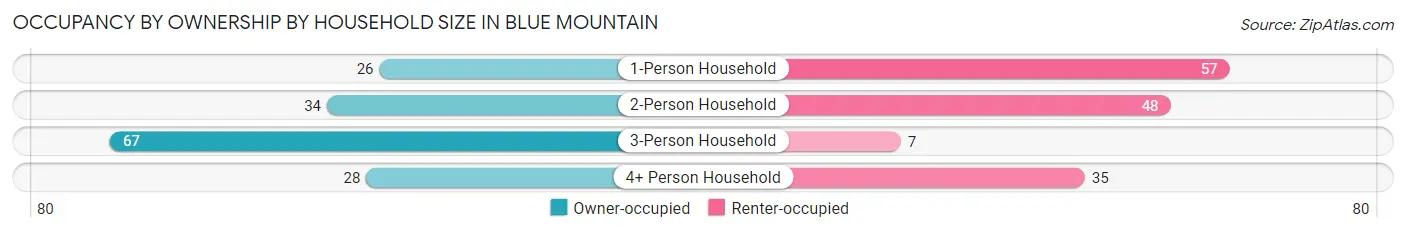
| Household Size | Owner-occupied | Renter-occupied |
| 1-Person Household | 26 (31.3%) | 57 (68.7%) |
| 2-Person Household | 34 (41.5%) | 48 (58.5%) |
| 3-Person Household | 67 (90.5%) | 7 (9.5%) |
| 4+ Person Household | 28 (44.4%) | 35 (55.6%) |
| Total Housing Units | 155 (51.3%) | 147 (48.7%) |
Occupancy by Educational Attainment in Blue Mountain
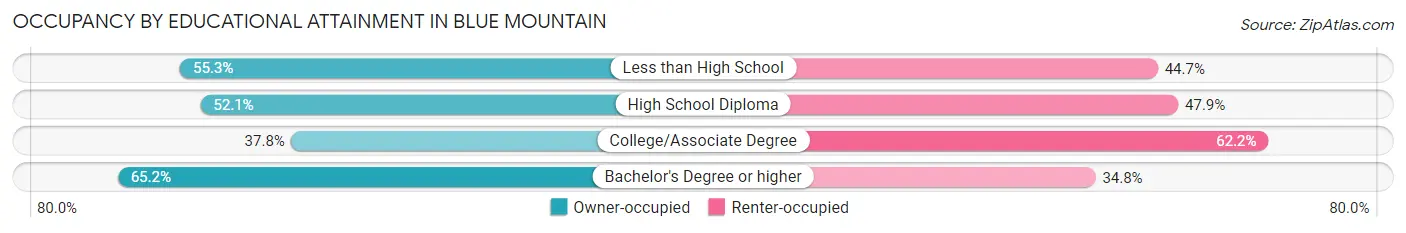
| Household Size | Owner-occupied | Renter-occupied |
| Less than High School | 57 (55.3%) | 46 (44.7%) |
| High School Diploma | 37 (52.1%) | 34 (47.9%) |
| College/Associate Degree | 31 (37.8%) | 51 (62.2%) |
| Bachelor's Degree or higher | 30 (65.2%) | 16 (34.8%) |
Occupancy by Age of Householder in Blue Mountain
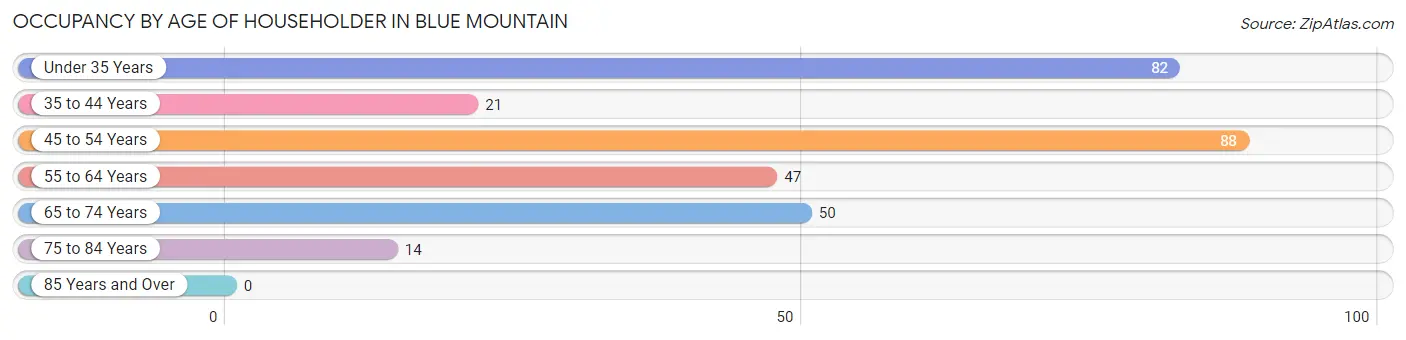
| Age Bracket | # Households | % Households |
| Under 35 Years | 82 | 27.2% |
| 35 to 44 Years | 21 | 7.0% |
| 45 to 54 Years | 88 | 29.1% |
| 55 to 64 Years | 47 | 15.6% |
| 65 to 74 Years | 50 | 16.6% |
| 75 to 84 Years | 14 | 4.6% |
| 85 Years and Over | 0 | 0.0% |
| Total | 302 | 100.0% |
Housing Finances in Blue Mountain
Median Income by Occupancy in Blue Mountain
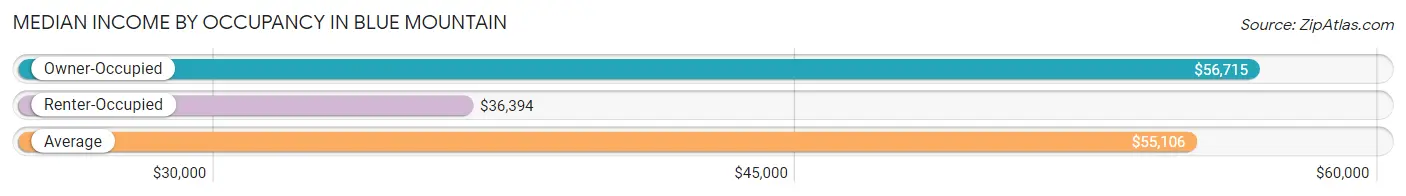
| Occupancy Type | # Households | Median Income |
| Owner-Occupied | 155 (51.3%) | $56,715 |
| Renter-Occupied | 147 (48.7%) | $36,394 |
| Average | 302 (100.0%) | $55,106 |
Occupancy by Householder Income Bracket in Blue Mountain
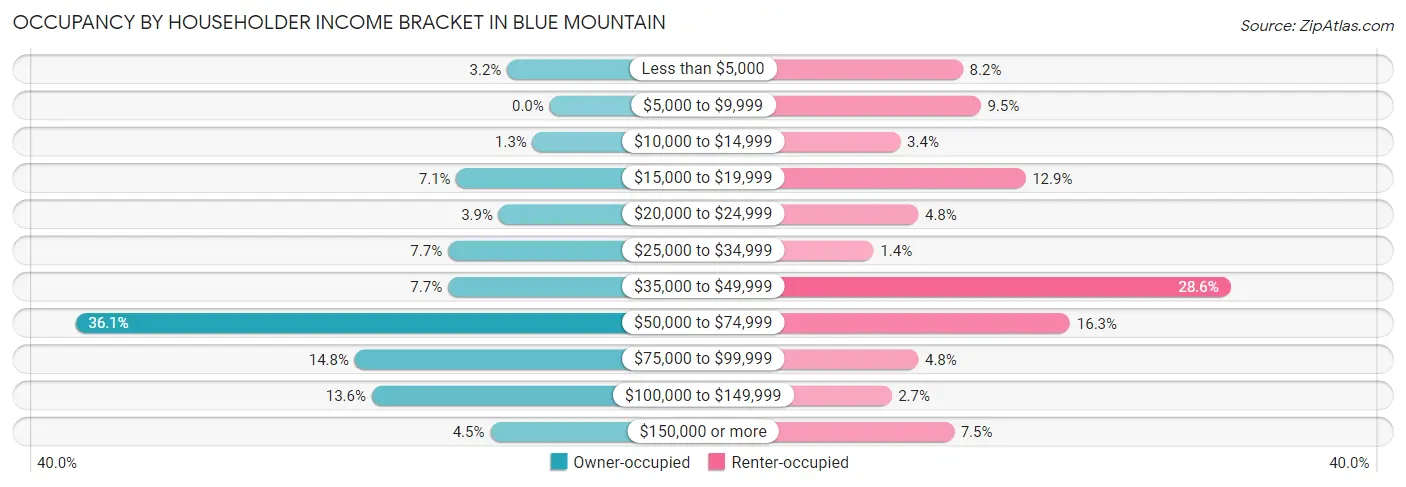
| Income Bracket | Owner-occupied | Renter-occupied |
| Less than $5,000 | 5 (3.2%) | 12 (8.2%) |
| $5,000 to $9,999 | 0 (0.0%) | 14 (9.5%) |
| $10,000 to $14,999 | 2 (1.3%) | 5 (3.4%) |
| $15,000 to $19,999 | 11 (7.1%) | 19 (12.9%) |
| $20,000 to $24,999 | 6 (3.9%) | 7 (4.8%) |
| $25,000 to $34,999 | 12 (7.7%) | 2 (1.4%) |
| $35,000 to $49,999 | 12 (7.7%) | 42 (28.6%) |
| $50,000 to $74,999 | 56 (36.1%) | 24 (16.3%) |
| $75,000 to $99,999 | 23 (14.8%) | 7 (4.8%) |
| $100,000 to $149,999 | 21 (13.6%) | 4 (2.7%) |
| $150,000 or more | 7 (4.5%) | 11 (7.5%) |
| Total | 155 (100.0%) | 147 (100.0%) |
Monthly Housing Cost Tiers in Blue Mountain
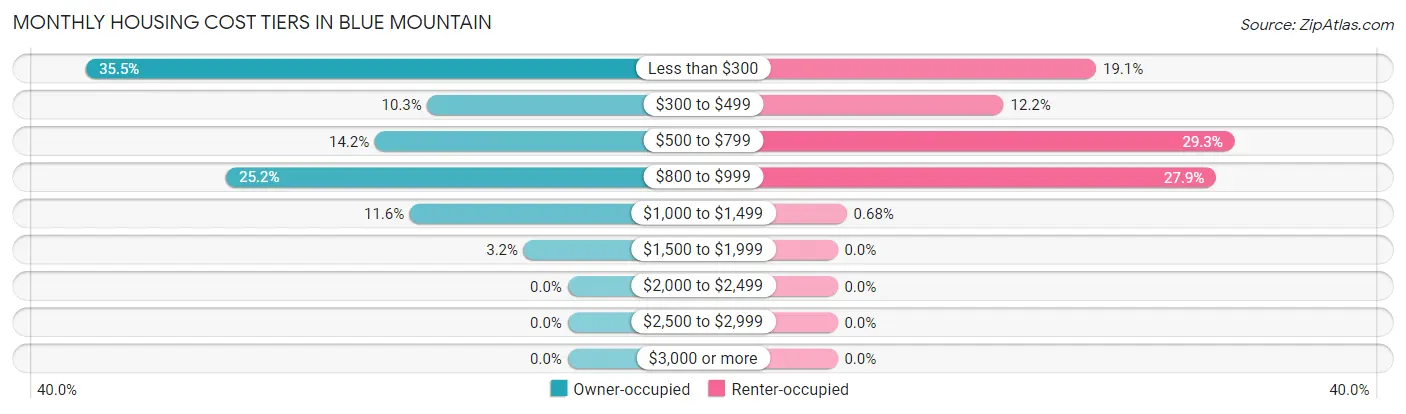
| Monthly Cost | Owner-occupied | Renter-occupied |
| Less than $300 | 55 (35.5%) | 28 (19.1%) |
| $300 to $499 | 16 (10.3%) | 18 (12.2%) |
| $500 to $799 | 22 (14.2%) | 43 (29.2%) |
| $800 to $999 | 39 (25.2%) | 41 (27.9%) |
| $1,000 to $1,499 | 18 (11.6%) | 1 (0.7%) |
| $1,500 to $1,999 | 5 (3.2%) | 0 (0.0%) |
| $2,000 to $2,499 | 0 (0.0%) | 0 (0.0%) |
| $2,500 to $2,999 | 0 (0.0%) | 0 (0.0%) |
| $3,000 or more | 0 (0.0%) | 0 (0.0%) |
| Total | 155 (100.0%) | 147 (100.0%) |
Physical Housing Characteristics in Blue Mountain
Housing Structures in Blue Mountain
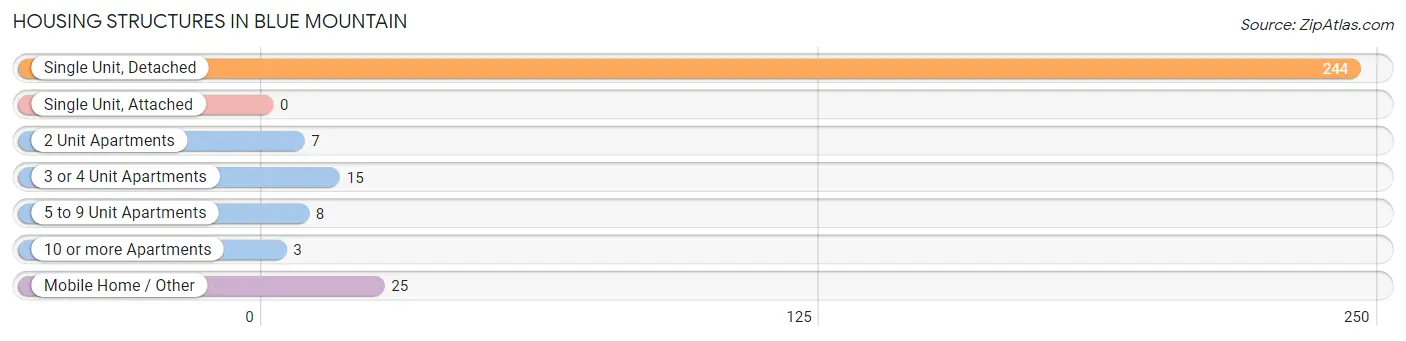
| Structure Type | # Housing Units | % Housing Units |
| Single Unit, Detached | 244 | 80.8% |
| Single Unit, Attached | 0 | 0.0% |
| 2 Unit Apartments | 7 | 2.3% |
| 3 or 4 Unit Apartments | 15 | 5.0% |
| 5 to 9 Unit Apartments | 8 | 2.6% |
| 10 or more Apartments | 3 | 1.0% |
| Mobile Home / Other | 25 | 8.3% |
| Total | 302 | 100.0% |
Housing Structures by Occupancy in Blue Mountain
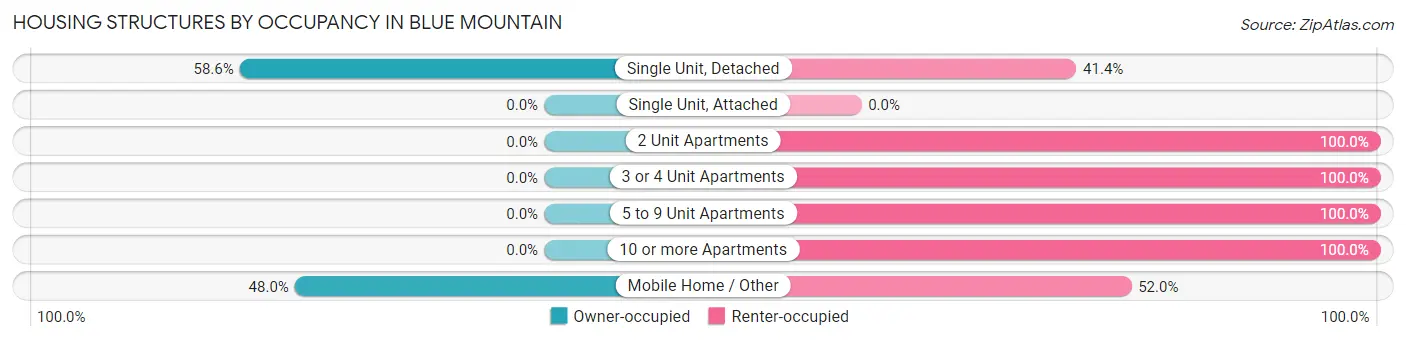
| Structure Type | Owner-occupied | Renter-occupied |
| Single Unit, Detached | 143 (58.6%) | 101 (41.4%) |
| Single Unit, Attached | 0 (0.0%) | 0 (0.0%) |
| 2 Unit Apartments | 0 (0.0%) | 7 (100.0%) |
| 3 or 4 Unit Apartments | 0 (0.0%) | 15 (100.0%) |
| 5 to 9 Unit Apartments | 0 (0.0%) | 8 (100.0%) |
| 10 or more Apartments | 0 (0.0%) | 3 (100.0%) |
| Mobile Home / Other | 12 (48.0%) | 13 (52.0%) |
| Total | 155 (51.3%) | 147 (48.7%) |
Housing Structures by Number of Rooms in Blue Mountain
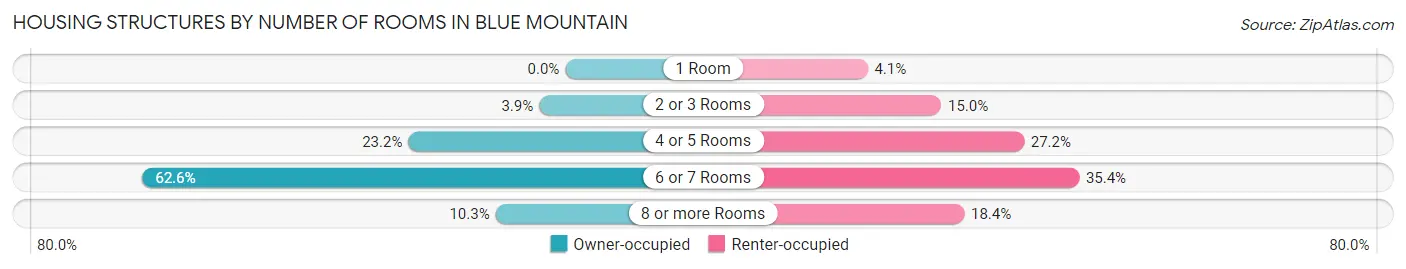
| Number of Rooms | Owner-occupied | Renter-occupied |
| 1 Room | 0 (0.0%) | 6 (4.1%) |
| 2 or 3 Rooms | 6 (3.9%) | 22 (15.0%) |
| 4 or 5 Rooms | 36 (23.2%) | 40 (27.2%) |
| 6 or 7 Rooms | 97 (62.6%) | 52 (35.4%) |
| 8 or more Rooms | 16 (10.3%) | 27 (18.4%) |
| Total | 155 (100.0%) | 147 (100.0%) |
Housing Structure by Heating Type in Blue Mountain
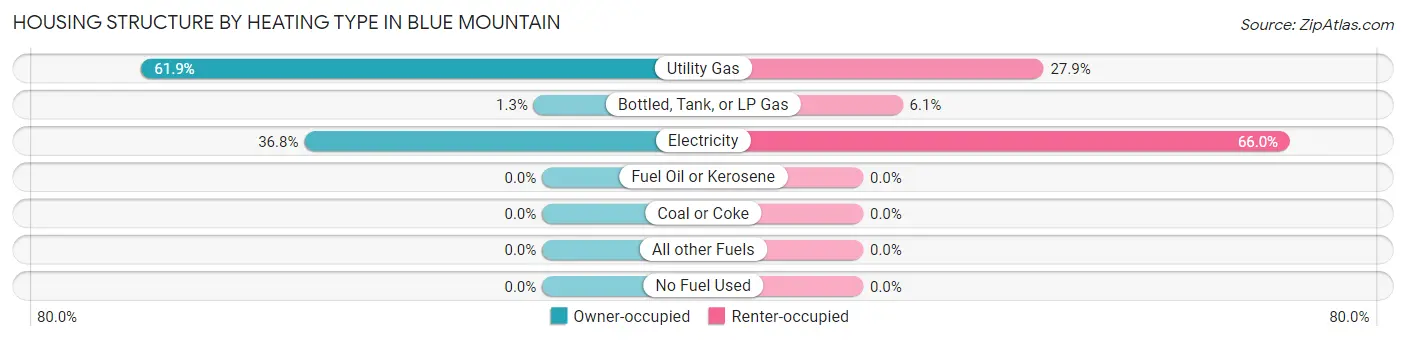
| Heating Type | Owner-occupied | Renter-occupied |
| Utility Gas | 96 (61.9%) | 41 (27.9%) |
| Bottled, Tank, or LP Gas | 2 (1.3%) | 9 (6.1%) |
| Electricity | 57 (36.8%) | 97 (66.0%) |
| Fuel Oil or Kerosene | 0 (0.0%) | 0 (0.0%) |
| Coal or Coke | 0 (0.0%) | 0 (0.0%) |
| All other Fuels | 0 (0.0%) | 0 (0.0%) |
| No Fuel Used | 0 (0.0%) | 0 (0.0%) |
| Total | 155 (100.0%) | 147 (100.0%) |
Household Vehicle Usage in Blue Mountain
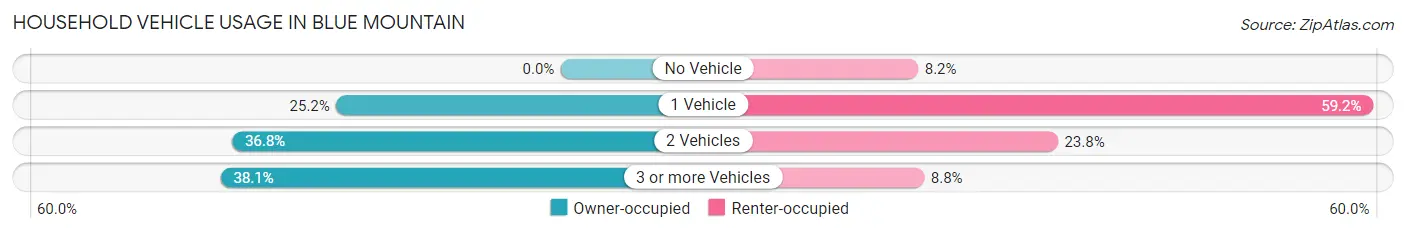
| Vehicles per Household | Owner-occupied | Renter-occupied |
| No Vehicle | 0 (0.0%) | 12 (8.2%) |
| 1 Vehicle | 39 (25.2%) | 87 (59.2%) |
| 2 Vehicles | 57 (36.8%) | 35 (23.8%) |
| 3 or more Vehicles | 59 (38.1%) | 13 (8.8%) |
| Total | 155 (100.0%) | 147 (100.0%) |
Real Estate & Mortgages in Blue Mountain
Real Estate and Mortgage Overview in Blue Mountain
| Characteristic | Without Mortgage | With Mortgage |
| Housing Units | 81 | 74 |
| Median Property Value | $56,700 | $97,500 |
| Median Household Income | $56,422 | $7 |
| Monthly Housing Costs | $247 | $0 |
| Real Estate Taxes | $850 | $9 |
Property Value by Mortgage Status in Blue Mountain
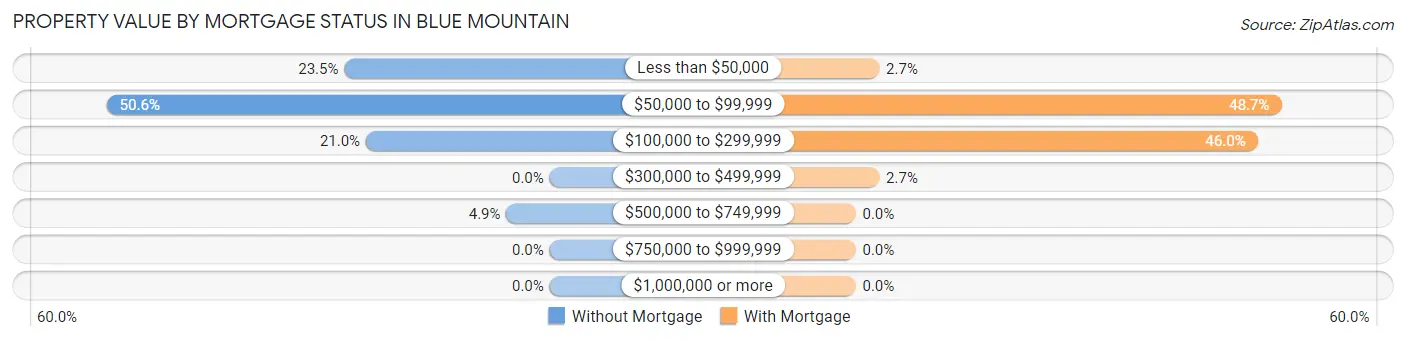
| Property Value | Without Mortgage | With Mortgage |
| Less than $50,000 | 19 (23.5%) | 2 (2.7%) |
| $50,000 to $99,999 | 41 (50.6%) | 36 (48.6%) |
| $100,000 to $299,999 | 17 (21.0%) | 34 (46.0%) |
| $300,000 to $499,999 | 0 (0.0%) | 2 (2.7%) |
| $500,000 to $749,999 | 4 (4.9%) | 0 (0.0%) |
| $750,000 to $999,999 | 0 (0.0%) | 0 (0.0%) |
| $1,000,000 or more | 0 (0.0%) | 0 (0.0%) |
| Total | 81 (100.0%) | 74 (100.0%) |
Household Income by Mortgage Status in Blue Mountain
| Household Income | Without Mortgage | With Mortgage |
| Less than $10,000 | 5 (6.2%) | 2 (2.7%) |
| $10,000 to $24,999 | 8 (9.9%) | 0 (0.0%) |
| $25,000 to $34,999 | 5 (6.2%) | 11 (14.9%) |
| $35,000 to $49,999 | 6 (7.4%) | 7 (9.5%) |
| $50,000 to $74,999 | 38 (46.9%) | 6 (8.1%) |
| $75,000 to $99,999 | 4 (4.9%) | 18 (24.3%) |
| $100,000 to $149,999 | 15 (18.5%) | 19 (25.7%) |
| $150,000 or more | 0 (0.0%) | 6 (8.1%) |
| Total | 81 (100.0%) | 74 (100.0%) |
Property Value to Household Income Ratio in Blue Mountain
| Value-to-Income Ratio | Without Mortgage | With Mortgage |
| Less than 2.0x | 54 (66.7%) | 57,321 (77,460.8%) |
| 2.0x to 2.9x | 10 (12.3%) | 51 (68.9%) |
| 3.0x to 3.9x | 7 (8.6%) | 10 (13.5%) |
| 4.0x or more | 10 (12.3%) | 1 (1.3%) |
| Total | 81 (100.0%) | 74 (100.0%) |
Real Estate Taxes by Mortgage Status in Blue Mountain
| Property Taxes | Without Mortgage | With Mortgage |
| Less than $800 | 10 (12.3%) | 0 (0.0%) |
| $800 to $1,499 | 10 (12.3%) | 22 (29.7%) |
| $800 to $1,499 | 2 (2.5%) | 33 (44.6%) |
| Total | 81 (100.0%) | 74 (100.0%) |
Health & Disability in Blue Mountain
Health Insurance Coverage by Age in Blue Mountain
| Age Bracket | With Coverage | Without Coverage |
| Under 6 Years | 57 (86.4%) | 9 (13.6%) |
| 6 to 18 Years | 218 (95.6%) | 10 (4.4%) |
| 19 to 25 Years | 247 (79.2%) | 65 (20.8%) |
| 26 to 34 Years | 79 (62.2%) | 48 (37.8%) |
| 35 to 44 Years | 41 (69.5%) | 18 (30.5%) |
| 45 to 54 Years | 104 (77.6%) | 30 (22.4%) |
| 55 to 64 Years | 72 (84.7%) | 13 (15.3%) |
| 65 to 74 Years | 62 (92.5%) | 5 (7.5%) |
| 75 Years and older | 17 (100.0%) | 0 (0.0%) |
| Total | 897 (81.9%) | 198 (18.1%) |
Health Insurance Coverage by Citizenship Status in Blue Mountain
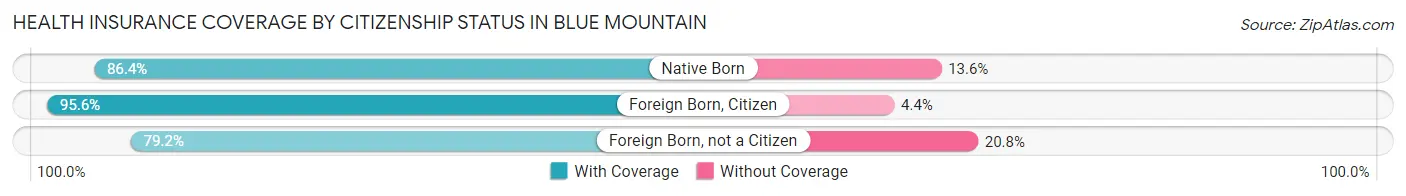
| Citizenship Status | With Coverage | Without Coverage |
| Native Born | 57 (86.4%) | 9 (13.6%) |
| Foreign Born, Citizen | 218 (95.6%) | 10 (4.4%) |
| Foreign Born, not a Citizen | 247 (79.2%) | 65 (20.8%) |
Health Insurance Coverage by Household Income in Blue Mountain
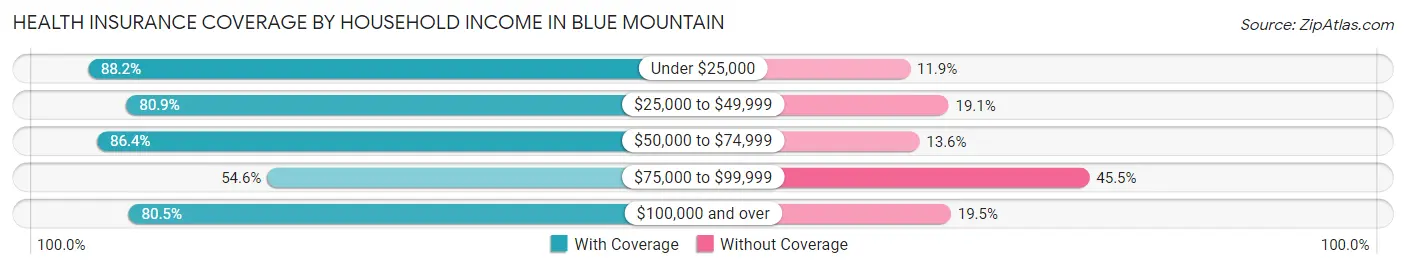
| Household Income | With Coverage | Without Coverage |
| Under $25,000 | 119 (88.1%) | 16 (11.8%) |
| $25,000 to $49,999 | 191 (80.9%) | 45 (19.1%) |
| $50,000 to $74,999 | 216 (86.4%) | 34 (13.6%) |
| $75,000 to $99,999 | 36 (54.5%) | 30 (45.5%) |
| $100,000 and over | 95 (80.5%) | 23 (19.5%) |
Public vs Private Health Insurance Coverage by Age in Blue Mountain
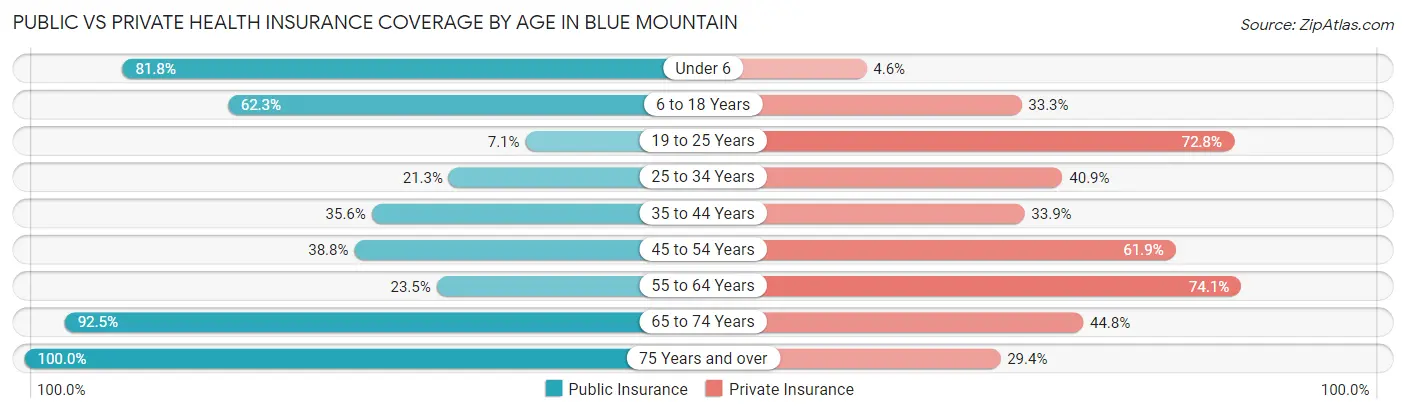
| Age Bracket | Public Insurance | Private Insurance |
| Under 6 | 54 (81.8%) | 3 (4.5%) |
| 6 to 18 Years | 142 (62.3%) | 76 (33.3%) |
| 19 to 25 Years | 22 (7.0%) | 227 (72.8%) |
| 25 to 34 Years | 27 (21.3%) | 52 (40.9%) |
| 35 to 44 Years | 21 (35.6%) | 20 (33.9%) |
| 45 to 54 Years | 52 (38.8%) | 83 (61.9%) |
| 55 to 64 Years | 20 (23.5%) | 63 (74.1%) |
| 65 to 74 Years | 62 (92.5%) | 30 (44.8%) |
| 75 Years and over | 17 (100.0%) | 5 (29.4%) |
| Total | 417 (38.1%) | 559 (51.0%) |
Disability Status by Sex by Age in Blue Mountain
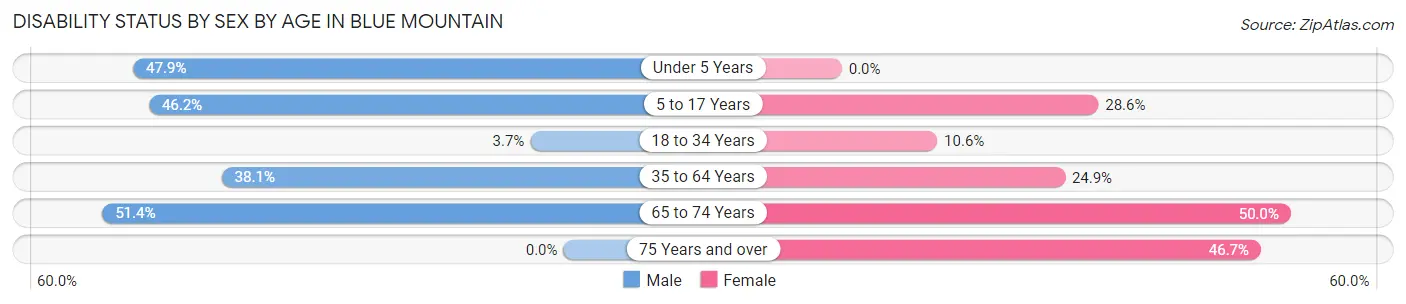
| Age Bracket | Male | Female |
| Under 5 Years | 23 (47.9%) | 0 (0.0%) |
| 5 to 17 Years | 36 (46.2%) | 16 (28.6%) |
| 18 to 34 Years | 9 (3.7%) | 31 (10.6%) |
| 35 to 64 Years | 43 (38.1%) | 41 (24.8%) |
| 65 to 74 Years | 19 (51.3%) | 15 (50.0%) |
| 75 Years and over | 0 (0.0%) | 7 (46.7%) |
Disability Class by Sex by Age in Blue Mountain
Disability Class: Hearing Difficulty
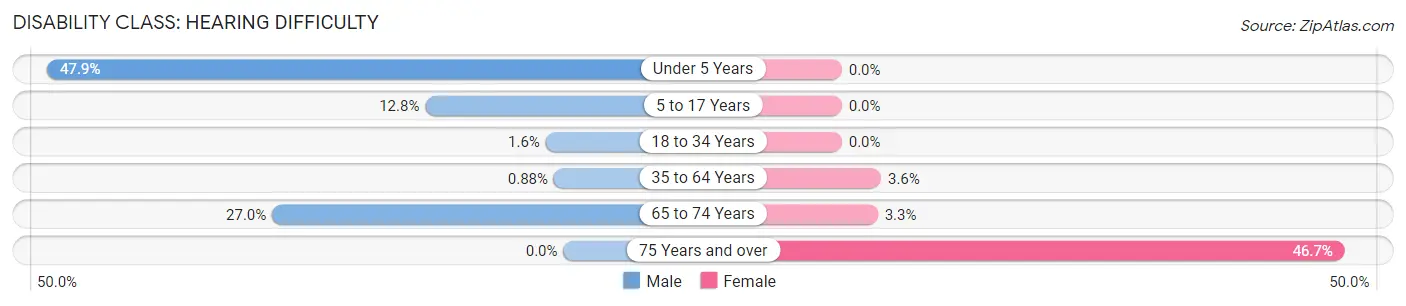
| Age Bracket | Male | Female |
| Under 5 Years | 23 (47.9%) | 0 (0.0%) |
| 5 to 17 Years | 10 (12.8%) | 0 (0.0%) |
| 18 to 34 Years | 4 (1.6%) | 0 (0.0%) |
| 35 to 64 Years | 1 (0.9%) | 6 (3.6%) |
| 65 to 74 Years | 10 (27.0%) | 1 (3.3%) |
| 75 Years and over | 0 (0.0%) | 7 (46.7%) |
Disability Class: Vision Difficulty
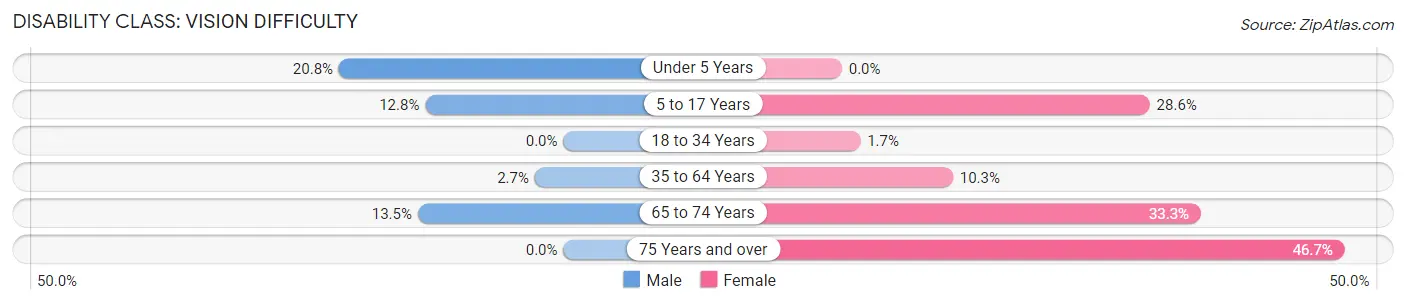
| Age Bracket | Male | Female |
| Under 5 Years | 10 (20.8%) | 0 (0.0%) |
| 5 to 17 Years | 10 (12.8%) | 16 (28.6%) |
| 18 to 34 Years | 0 (0.0%) | 5 (1.7%) |
| 35 to 64 Years | 3 (2.6%) | 17 (10.3%) |
| 65 to 74 Years | 5 (13.5%) | 10 (33.3%) |
| 75 Years and over | 0 (0.0%) | 7 (46.7%) |
Disability Class: Cognitive Difficulty
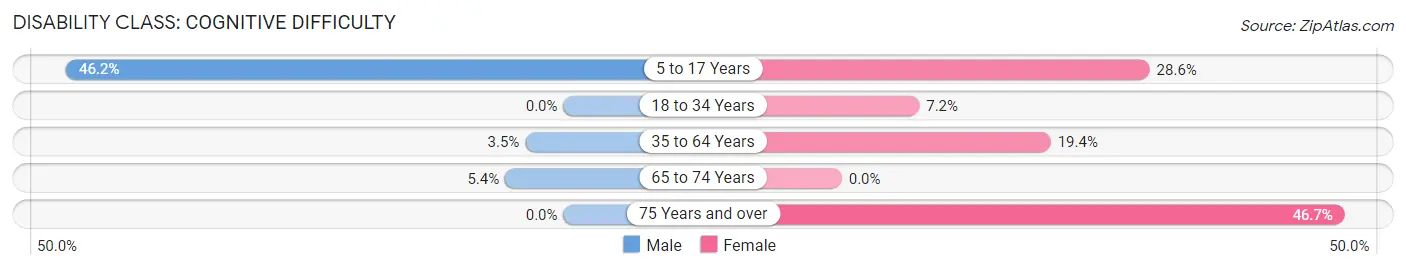
| Age Bracket | Male | Female |
| 5 to 17 Years | 36 (46.2%) | 16 (28.6%) |
| 18 to 34 Years | 0 (0.0%) | 21 (7.2%) |
| 35 to 64 Years | 4 (3.5%) | 32 (19.4%) |
| 65 to 74 Years | 2 (5.4%) | 0 (0.0%) |
| 75 Years and over | 0 (0.0%) | 7 (46.7%) |
Disability Class: Ambulatory Difficulty
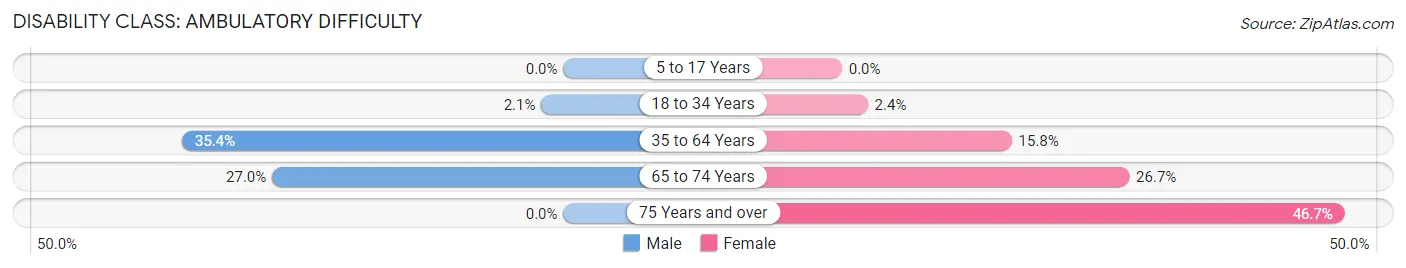
| Age Bracket | Male | Female |
| 5 to 17 Years | 0 (0.0%) | 0 (0.0%) |
| 18 to 34 Years | 5 (2.1%) | 7 (2.4%) |
| 35 to 64 Years | 40 (35.4%) | 26 (15.8%) |
| 65 to 74 Years | 10 (27.0%) | 8 (26.7%) |
| 75 Years and over | 0 (0.0%) | 7 (46.7%) |
Disability Class: Self-Care Difficulty
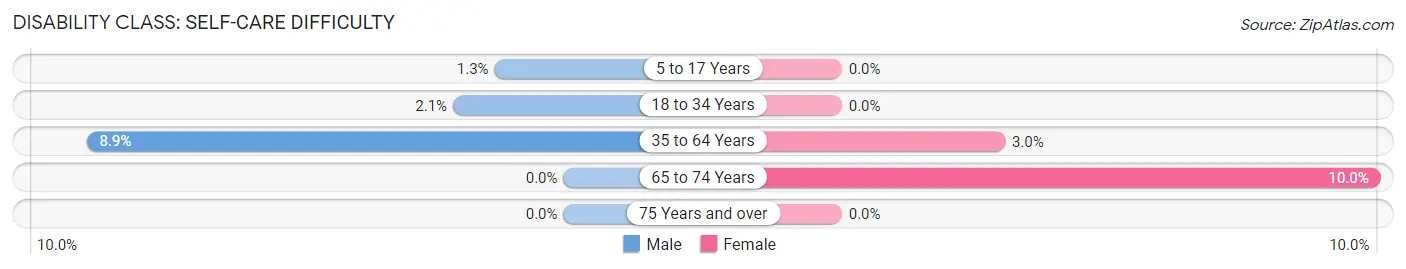
| Age Bracket | Male | Female |
| 5 to 17 Years | 1 (1.3%) | 0 (0.0%) |
| 18 to 34 Years | 5 (2.1%) | 0 (0.0%) |
| 35 to 64 Years | 10 (8.8%) | 5 (3.0%) |
| 65 to 74 Years | 0 (0.0%) | 3 (10.0%) |
| 75 Years and over | 0 (0.0%) | 0 (0.0%) |
Technology Access in Blue Mountain
Computing Device Access in Blue Mountain
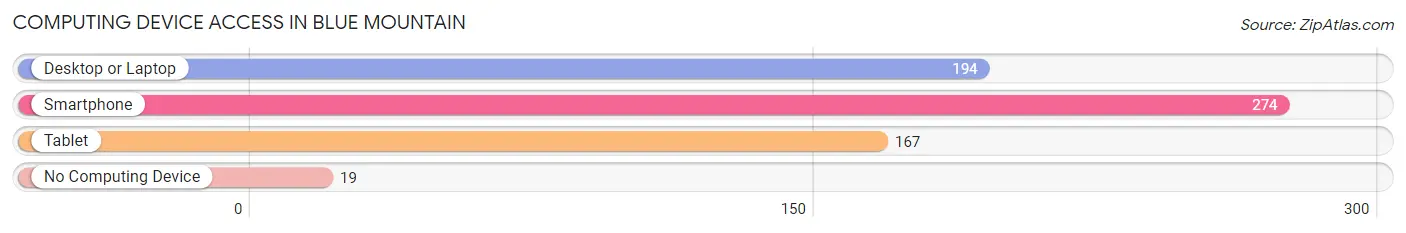
| Device Type | # Households | % Households |
| Desktop or Laptop | 194 | 64.2% |
| Smartphone | 274 | 90.7% |
| Tablet | 167 | 55.3% |
| No Computing Device | 19 | 6.3% |
| Total | 302 | 100.0% |
Internet Access in Blue Mountain
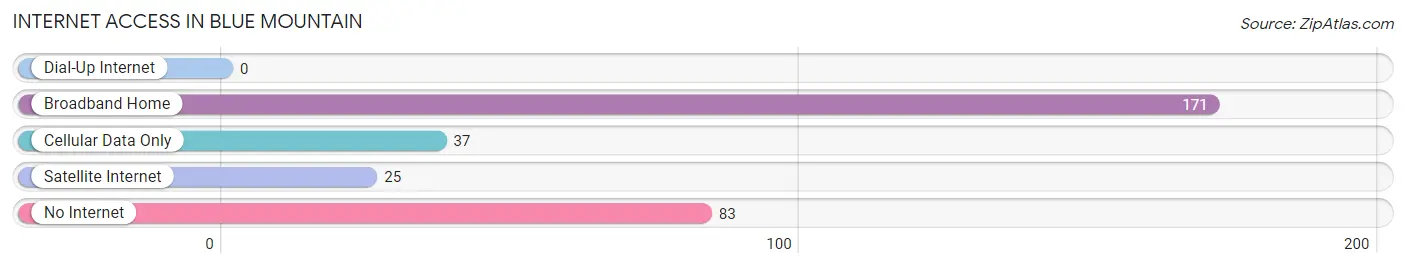
| Internet Type | # Households | % Households |
| Dial-Up Internet | 0 | 0.0% |
| Broadband Home | 171 | 56.6% |
| Cellular Data Only | 37 | 12.2% |
| Satellite Internet | 25 | 8.3% |
| No Internet | 83 | 27.5% |
| Total | 302 | 100.0% |
Blue Mountain Summary
Introduction
Blue Mountain is a small town located in the northeastern corner of Mississippi, in Tippah County. It is situated on the banks of the Tippah River, and is home to a population of approximately 1,500 people. The town is known for its rich history, its beautiful scenery, and its friendly people.
History
Blue Mountain was founded in 1837 by a group of settlers from North Carolina. The town was named after the nearby Blue Mountain, which is the highest point in Mississippi. The town quickly grew and became a thriving center of commerce and industry. The town was home to several cotton mills, a sawmill, and a gristmill.
In the late 1800s, the town was a major stop on the Mississippi Central Railroad. The railroad brought in new businesses and people, and the town continued to grow. In the early 1900s, the town was home to several churches, a school, and a post office.
In the 1950s, the town began to decline as the railroad stopped running and the cotton mills closed. The town was nearly abandoned by the 1970s, but in the 1980s, the town began to experience a resurgence. The town was revitalized with the opening of a new school, a library, and a community center.
Geography
Blue Mountain is located in the northeastern corner of Mississippi, in Tippah County. The town is situated on the banks of the Tippah River, and is surrounded by rolling hills and forests. The town is located about 30 miles from the Tennessee border, and about 50 miles from the Alabama border.
The town is located in a humid subtropical climate, with hot summers and mild winters. The average annual temperature is around 70 degrees Fahrenheit, and the average annual precipitation is around 50 inches.
Economy
Blue Mountain’s economy is largely based on agriculture and tourism. The town is home to several farms, and the surrounding area is known for its production of cotton, soybeans, and corn. The town is also home to several small businesses, including restaurants, shops, and a hardware store.
The town is also a popular tourist destination, and is home to several attractions, including the Blue Mountain State Park, the Tippah County Museum, and the Tippah County Historical Society. The town is also home to several festivals, including the Blue Mountain Music Festival and the Tippah County Fair.
Demographics
As of the 2010 census, the population of Blue Mountain was 1,521. The town is predominantly white, with a small African American population. The median household income is around $30,000, and the median home value is around $90,000. The town is home to several churches, and the most common religion is Christianity.
Conclusion
Blue Mountain is a small town located in the northeastern corner of Mississippi, in Tippah County. The town is known for its rich history, its beautiful scenery, and its friendly people. The town’s economy is largely based on agriculture and tourism, and the town is home to several attractions, including the Blue Mountain State Park, the Tippah County Museum, and the Tippah County Historical Society. The town is predominantly white, with a small African American population, and the median household income is around $30,000.
Common Questions
What is Per Capita Income in Blue Mountain?
Per Capita income in Blue Mountain is $17,792.
What is the Median Family Income in Blue Mountain?
Median Family Income in Blue Mountain is $56,596.
What is the Median Household income in Blue Mountain?
Median Household Income in Blue Mountain is $55,106.
What is Income or Wage Gap in Blue Mountain?
Income or Wage Gap in Blue Mountain is 56.8%.
Women in Blue Mountain earn 43.2 cents for every dollar earned by a man.
What is Inequality or Gini Index in Blue Mountain?
Inequality or Gini Index in Blue Mountain is 0.45.
What is the Total Population of Blue Mountain?
Total Population of Blue Mountain is 1,100.
What is the Total Male Population of Blue Mountain?
Total Male Population of Blue Mountain is 527.
What is the Total Female Population of Blue Mountain?
Total Female Population of Blue Mountain is 573.
What is the Ratio of Males per 100 Females in Blue Mountain?
There are 91.97 Males per 100 Females in Blue Mountain.
What is the Ratio of Females per 100 Males in Blue Mountain?
There are 108.73 Females per 100 Males in Blue Mountain.
What is the Median Population Age in Blue Mountain?
Median Population Age in Blue Mountain is 22.4 Years.
What is the Average Family Size in Blue Mountain
Average Family Size in Blue Mountain is 3.1 People.
What is the Average Household Size in Blue Mountain
Average Household Size in Blue Mountain is 2.7 People.
How Large is the Labor Force in Blue Mountain?
There are 460 People in the Labor Forcein in Blue Mountain.
What is the Percentage of People in the Labor Force in Blue Mountain?
50.5% of People are in the Labor Force in Blue Mountain.
What is the Unemployment Rate in Blue Mountain?
Unemployment Rate in Blue Mountain is 1.1%.