Zip Codes with the Highest Percentage of Population Employed in Food Preparation & Serving in Southaven, MS
RELATED REPORTS & OPTIONS
Food Preparation & Serving
Southaven
Compare Zip Codes
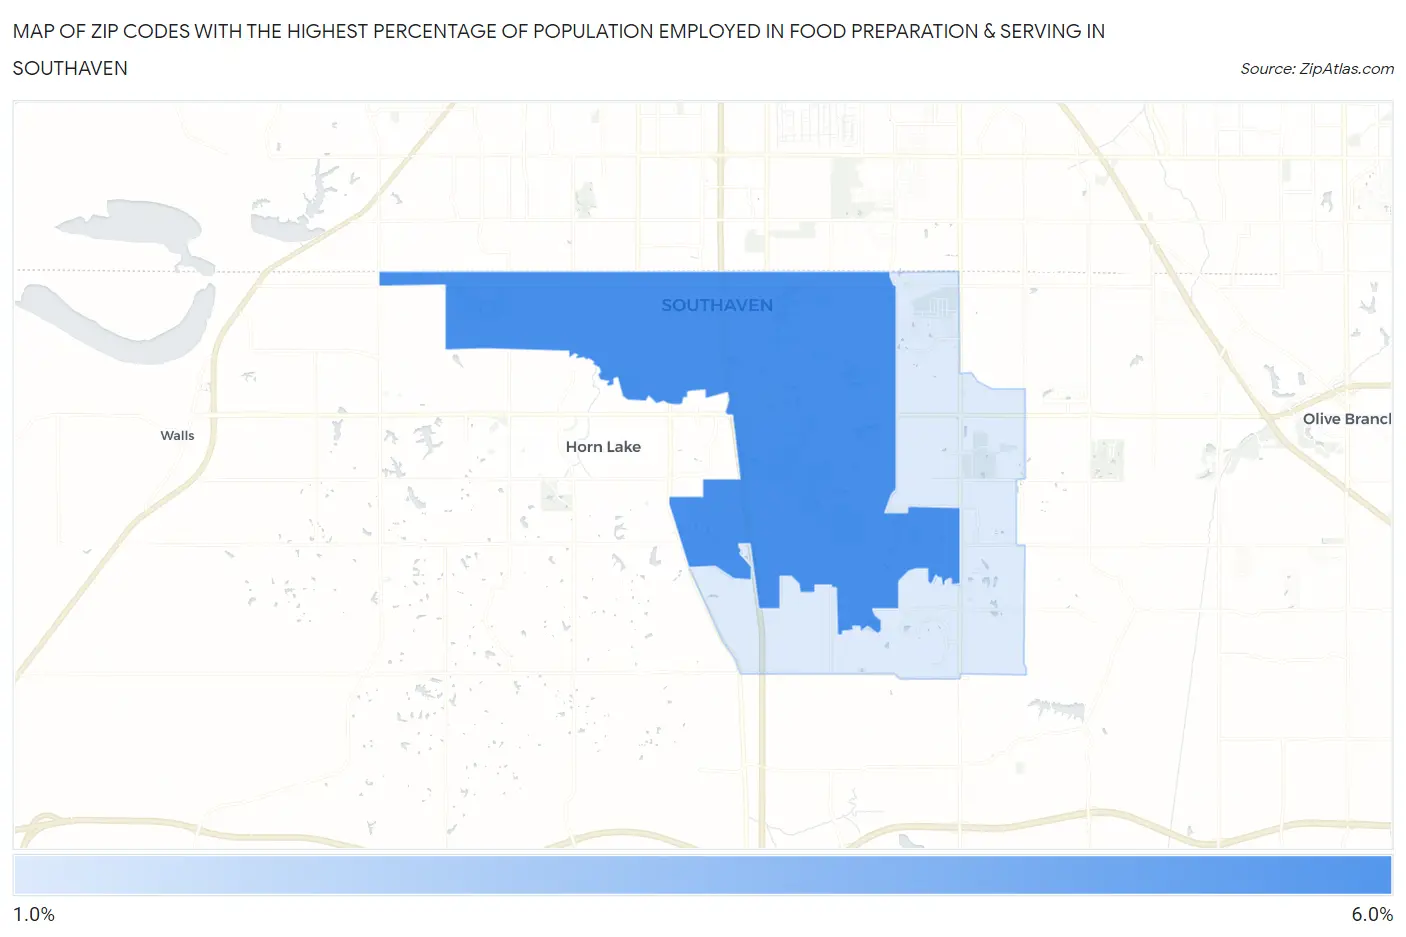
Map of Zip Codes with the Highest Percentage of Population Employed in Food Preparation & Serving in Southaven
1.8%
5.0%
Zip Codes with the Highest Percentage of Population Employed in Food Preparation & Serving in Southaven, MS
| Zip Code | % Employed | vs State | vs National | |
| 1. | 38671 | 5.0% | 5.6%(-0.586)#157 | 5.3%(-0.279)#12,917 |
| 2. | 38672 | 1.8% | 5.6%(-3.84)#282 | 5.3%(-3.53)#25,375 |
1
Common Questions
What are the Top Zip Codes with the Highest Percentage of Population Employed in Food Preparation & Serving in Southaven, MS?
Top Zip Codes with the Highest Percentage of Population Employed in Food Preparation & Serving in Southaven, MS are:
What zip code has the Highest Percentage of Population Employed in Food Preparation & Serving in Southaven, MS?
38671 has the Highest Percentage of Population Employed in Food Preparation & Serving in Southaven, MS with 5.0%.
What is the Percentage of Population Employed in Food Preparation & Serving in Southaven, MS?
Percentage of Population Employed in Food Preparation & Serving in Southaven is 3.8%.
What is the Percentage of Population Employed in Food Preparation & Serving in Mississippi?
Percentage of Population Employed in Food Preparation & Serving in Mississippi is 5.6%.
What is the Percentage of Population Employed in Food Preparation & Serving in the United States?
Percentage of Population Employed in Food Preparation & Serving in the United States is 5.3%.