Zip Codes with the Highest Percentage of Population Employed in Food Preparation & Serving in Mississippi
RELATED REPORTS & OPTIONS
Food Preparation & Serving
Mississippi
Compare Zip Codes
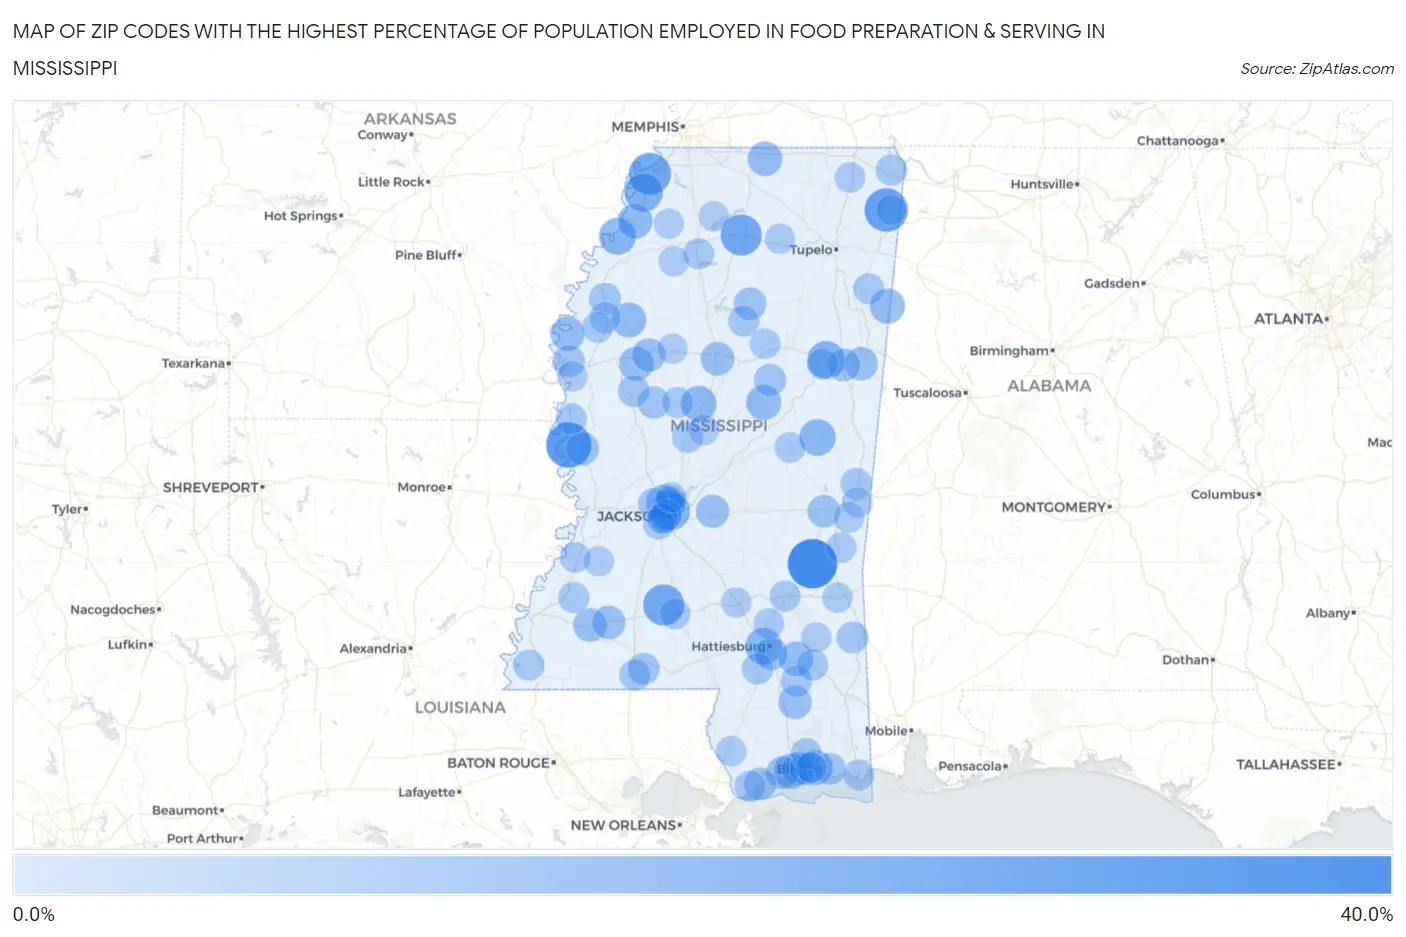
Map of Zip Codes with the Highest Percentage of Population Employed in Food Preparation & Serving in Mississippi
0.0%
40.0%
Zip Codes with the Highest Percentage of Population Employed in Food Preparation & Serving in Mississippi
| Zip Code | % Employed | vs State | vs National | |
| 1. | 39366 | 35.1% | 5.6%(+29.5)#1 | 5.3%(+29.8)#148 |
| 2. | 39113 | 28.6% | 5.6%(+23.0)#2 | 5.3%(+23.3)#237 |
| 3. | 38838 | 25.9% | 5.6%(+20.3)#3 | 5.3%(+20.6)#291 |
| 4. | 38664 | 23.8% | 5.6%(+18.2)#4 | 5.3%(+18.5)#351 |
| 5. | 39665 | 22.4% | 5.6%(+16.8)#5 | 5.3%(+17.1)#407 |
| 6. | 38677 | 22.3% | 5.6%(+16.8)#6 | 5.3%(+17.1)#409 |
| 7. | 38676 | 18.3% | 5.6%(+12.7)#7 | 5.3%(+13.0)#629 |
| 8. | 39762 | 17.6% | 5.6%(+12.1)#8 | 5.3%(+12.4)#685 |
| 9. | 39216 | 17.2% | 5.6%(+11.6)#9 | 5.3%(+11.9)#729 |
| 10. | 38631 | 16.2% | 5.6%(+10.6)#10 | 5.3%(+10.9)#836 |
| 11. | 39406 | 15.9% | 5.6%(+10.3)#11 | 5.3%(+10.6)#871 |
| 12. | 39354 | 15.6% | 5.6%(+10.0)#12 | 5.3%(+10.3)#902 |
| 13. | 39063 | 14.3% | 5.6%(+8.73)#13 | 5.3%(+9.04)#1,089 |
| 14. | 39213 | 14.0% | 5.6%(+8.41)#14 | 5.3%(+8.72)#1,159 |
| 15. | 39530 | 13.9% | 5.6%(+8.29)#15 | 5.3%(+8.60)#1,190 |
| 16. | 39501 | 13.7% | 5.6%(+8.11)#16 | 5.3%(+8.41)#1,232 |
| 17. | 39108 | 13.7% | 5.6%(+8.10)#17 | 5.3%(+8.40)#1,235 |
| 18. | 38844 | 13.6% | 5.6%(+8.01)#18 | 5.3%(+8.31)#1,256 |
| 19. | 38771 | 13.4% | 5.6%(+7.82)#19 | 5.3%(+8.13)#1,293 |
| 20. | 38644 | 13.3% | 5.6%(+7.74)#20 | 5.3%(+8.05)#1,311 |
| 21. | 38642 | 12.8% | 5.6%(+7.23)#21 | 5.3%(+7.53)#1,439 |
| 22. | 38761 | 12.5% | 5.6%(+6.87)#22 | 5.3%(+7.17)#1,529 |
| 23. | 39462 | 12.4% | 5.6%(+6.86)#23 | 5.3%(+7.16)#1,532 |
| 24. | 38725 | 12.4% | 5.6%(+6.79)#24 | 5.3%(+7.09)#1,550 |
| 25. | 38967 | 11.5% | 5.6%(+5.92)#25 | 5.3%(+6.23)#1,843 |
| 26. | 39653 | 11.4% | 5.6%(+5.86)#26 | 5.3%(+6.16)#1,859 |
| 27. | 39647 | 11.4% | 5.6%(+5.76)#27 | 5.3%(+6.07)#1,898 |
| 28. | 39577 | 11.3% | 5.6%(+5.73)#28 | 5.3%(+6.04)#1,906 |
| 29. | 38941 | 11.2% | 5.6%(+5.61)#29 | 5.3%(+5.91)#1,960 |
| 30. | 39145 | 10.9% | 5.6%(+5.32)#30 | 5.3%(+5.62)#2,101 |
| 31. | 39701 | 10.9% | 5.6%(+5.31)#31 | 5.3%(+5.62)#2,102 |
| 32. | 39054 | 10.8% | 5.6%(+5.16)#32 | 5.3%(+5.47)#2,177 |
| 33. | 39507 | 10.8% | 5.6%(+5.16)#33 | 5.3%(+5.47)#2,179 |
| 34. | 39206 | 10.6% | 5.6%(+5.02)#34 | 5.3%(+5.33)#2,256 |
| 35. | 39217 | 10.6% | 5.6%(+5.01)#35 | 5.3%(+5.32)#2,261 |
| 36. | 39401 | 10.4% | 5.6%(+4.77)#36 | 5.3%(+5.07)#2,394 |
| 37. | 39736 | 10.2% | 5.6%(+4.58)#37 | 5.3%(+4.88)#2,505 |
| 38. | 38914 | 10.1% | 5.6%(+4.51)#38 | 5.3%(+4.81)#2,560 |
| 39. | 39531 | 9.9% | 5.6%(+4.30)#39 | 5.3%(+4.61)#2,711 |
| 40. | 39560 | 9.9% | 5.6%(+4.29)#40 | 5.3%(+4.59)#2,728 |
| 41. | 39307 | 9.8% | 5.6%(+4.24)#41 | 5.3%(+4.55)#2,771 |
| 42. | 39576 | 9.8% | 5.6%(+4.21)#42 | 5.3%(+4.52)#2,794 |
| 43. | 39169 | 9.7% | 5.6%(+4.10)#43 | 5.3%(+4.41)#2,888 |
| 44. | 38703 | 9.6% | 5.6%(+4.04)#44 | 5.3%(+4.35)#2,938 |
| 45. | 39772 | 9.5% | 5.6%(+3.96)#45 | 5.3%(+4.26)#3,014 |
| 46. | 38762 | 9.2% | 5.6%(+3.65)#46 | 5.3%(+3.95)#3,283 |
| 47. | 39174 | 9.2% | 5.6%(+3.64)#47 | 5.3%(+3.94)#3,289 |
| 48. | 39648 | 8.8% | 5.6%(+3.23)#48 | 5.3%(+3.53)#3,710 |
| 49. | 39362 | 8.8% | 5.6%(+3.19)#49 | 5.3%(+3.50)#3,745 |
| 50. | 39038 | 8.7% | 5.6%(+3.15)#50 | 5.3%(+3.45)#3,798 |
| 51. | 39564 | 8.7% | 5.6%(+3.13)#51 | 5.3%(+3.44)#3,811 |
| 52. | 39209 | 8.4% | 5.6%(+2.77)#52 | 5.3%(+3.08)#4,218 |
| 53. | 39475 | 8.4% | 5.6%(+2.76)#53 | 5.3%(+3.07)#4,231 |
| 54. | 39425 | 8.3% | 5.6%(+2.73)#54 | 5.3%(+3.04)#4,288 |
| 55. | 39335 | 8.3% | 5.6%(+2.73)#55 | 5.3%(+3.04)#4,290 |
| 56. | 39652 | 8.2% | 5.6%(+2.57)#56 | 5.3%(+2.87)#4,495 |
| 57. | 39423 | 8.2% | 5.6%(+2.56)#57 | 5.3%(+2.87)#4,506 |
| 58. | 39203 | 8.1% | 5.6%(+2.52)#58 | 5.3%(+2.83)#4,553 |
| 59. | 39212 | 8.0% | 5.6%(+2.44)#59 | 5.3%(+2.75)#4,686 |
| 60. | 39520 | 7.9% | 5.6%(+2.36)#60 | 5.3%(+2.66)#4,807 |
| 61. | 39095 | 7.9% | 5.6%(+2.35)#61 | 5.3%(+2.65)#4,827 |
| 62. | 38929 | 7.9% | 5.6%(+2.29)#62 | 5.3%(+2.59)#4,924 |
| 63. | 39532 | 7.8% | 5.6%(+2.24)#63 | 5.3%(+2.54)#4,997 |
| 64. | 39069 | 7.8% | 5.6%(+2.23)#64 | 5.3%(+2.54)#5,004 |
| 65. | 38852 | 7.8% | 5.6%(+2.20)#65 | 5.3%(+2.50)#5,076 |
| 66. | 39440 | 7.8% | 5.6%(+2.19)#66 | 5.3%(+2.49)#5,092 |
| 67. | 39669 | 7.7% | 5.6%(+2.11)#67 | 5.3%(+2.42)#5,198 |
| 68. | 38744 | 7.6% | 5.6%(+2.05)#68 | 5.3%(+2.35)#5,311 |
| 69. | 39146 | 7.6% | 5.6%(+2.03)#69 | 5.3%(+2.34)#5,333 |
| 70. | 38732 | 7.6% | 5.6%(+2.03)#70 | 5.3%(+2.34)#5,346 |
| 71. | 38821 | 7.6% | 5.6%(+2.01)#71 | 5.3%(+2.32)#5,374 |
| 72. | 39759 | 7.6% | 5.6%(+2.01)#72 | 5.3%(+2.31)#5,378 |
| 73. | 38620 | 7.6% | 5.6%(+2.00)#73 | 5.3%(+2.31)#5,394 |
| 74. | 38730 | 7.6% | 5.6%(+1.97)#74 | 5.3%(+2.27)#5,453 |
| 75. | 39534 | 7.5% | 5.6%(+1.91)#75 | 5.3%(+2.21)#5,563 |
| 76. | 39350 | 7.5% | 5.6%(+1.88)#76 | 5.3%(+2.18)#5,612 |
| 77. | 39459 | 7.4% | 5.6%(+1.83)#77 | 5.3%(+2.13)#5,707 |
| 78. | 39581 | 7.4% | 5.6%(+1.81)#78 | 5.3%(+2.12)#5,739 |
| 79. | 39654 | 7.3% | 5.6%(+1.71)#79 | 5.3%(+2.02)#5,917 |
| 80. | 39744 | 7.3% | 5.6%(+1.69)#80 | 5.3%(+1.99)#5,960 |
| 81. | 39079 | 7.2% | 5.6%(+1.62)#81 | 5.3%(+1.92)#6,119 |
| 82. | 38865 | 7.2% | 5.6%(+1.60)#82 | 5.3%(+1.91)#6,146 |
| 83. | 39204 | 7.1% | 5.6%(+1.54)#83 | 5.3%(+1.85)#6,269 |
| 84. | 39301 | 7.0% | 5.6%(+1.44)#84 | 5.3%(+1.74)#6,485 |
| 85. | 39355 | 7.0% | 5.6%(+1.42)#85 | 5.3%(+1.73)#6,525 |
| 86. | 39150 | 7.0% | 5.6%(+1.42)#86 | 5.3%(+1.73)#6,531 |
| 87. | 39367 | 7.0% | 5.6%(+1.38)#87 | 5.3%(+1.68)#6,637 |
| 88. | 39157 | 7.0% | 5.6%(+1.36)#88 | 5.3%(+1.67)#6,680 |
| 89. | 39466 | 6.9% | 5.6%(+1.29)#89 | 5.3%(+1.60)#6,857 |
| 90. | 38622 | 6.8% | 5.6%(+1.24)#90 | 5.3%(+1.55)#6,981 |
| 91. | 38621 | 6.8% | 5.6%(+1.24)#91 | 5.3%(+1.54)#6,992 |
| 92. | 39476 | 6.8% | 5.6%(+1.23)#92 | 5.3%(+1.53)#7,017 |
| 93. | 39086 | 6.8% | 5.6%(+1.17)#93 | 5.3%(+1.47)#7,174 |
| 94. | 38871 | 6.8% | 5.6%(+1.17)#94 | 5.3%(+1.47)#7,176 |
| 95. | 38701 | 6.7% | 5.6%(+1.12)#95 | 5.3%(+1.43)#7,309 |
| 96. | 38619 | 6.7% | 5.6%(+1.11)#96 | 5.3%(+1.42)#7,334 |
| 97. | 39364 | 6.7% | 5.6%(+1.10)#97 | 5.3%(+1.40)#7,365 |
| 98. | 38827 | 6.7% | 5.6%(+1.08)#98 | 5.3%(+1.39)#7,402 |
| 99. | 39428 | 6.7% | 5.6%(+1.08)#99 | 5.3%(+1.38)#7,416 |
| 100. | 38930 | 6.6% | 5.6%(+1.03)#100 | 5.3%(+1.33)#7,557 |
Common Questions
What are the Top 10 Zip Codes with the Highest Percentage of Population Employed in Food Preparation & Serving in Mississippi?
Top 10 Zip Codes with the Highest Percentage of Population Employed in Food Preparation & Serving in Mississippi are:
What zip code has the Highest Percentage of Population Employed in Food Preparation & Serving in Mississippi?
39366 has the Highest Percentage of Population Employed in Food Preparation & Serving in Mississippi with 35.1%.
What is the Percentage of Population Employed in Food Preparation & Serving in the State of Mississippi?
Percentage of Population Employed in Food Preparation & Serving in Mississippi is 5.6%.
What is the Percentage of Population Employed in Food Preparation & Serving in the United States?
Percentage of Population Employed in Food Preparation & Serving in the United States is 5.3%.