Waveland, MS Map & Demographics
Waveland Map
Waveland Overview
$32,381
PER CAPITA INCOME
$75,052
AVG FAMILY INCOME
$56,396
AVG HOUSEHOLD INCOME
51.6%
WAGE / INCOME GAP [ % ]
48.4¢/ $1
WAGE / INCOME GAP [ $ ]
0.42
INEQUALITY / GINI INDEX
7,075
TOTAL POPULATION
3,350
MALE POPULATION
3,725
FEMALE POPULATION
89.93
MALES / 100 FEMALES
111.19
FEMALES / 100 MALES
44.1
MEDIAN AGE
2.9
AVG FAMILY SIZE
2.4
AVG HOUSEHOLD SIZE
3,764
LABOR FORCE [ PEOPLE ]
62.8%
PERCENT IN LABOR FORCE
9.0%
UNEMPLOYMENT RATE
Waveland Zip Codes
Waveland Area Codes
Income in Waveland
Income Overview in Waveland
Per Capita Income in Waveland is $32,381, while median incomes of families and households are $75,052 and $56,396 respectively.
| Characteristic | Number | Measure |
| Per Capita Income | 7,075 | $32,381 |
| Median Family Income | 1,991 | $75,052 |
| Mean Family Income | 1,991 | $85,915 |
| Median Household Income | 2,989 | $56,396 |
| Mean Household Income | 2,989 | $74,151 |
| Income Deficit | 1,991 | $0 |
| Wage / Income Gap (%) | 7,075 | 51.55% |
| Wage / Income Gap ($) | 7,075 | 48.45¢ per $1 |
| Gini / Inequality Index | 7,075 | 0.42 |
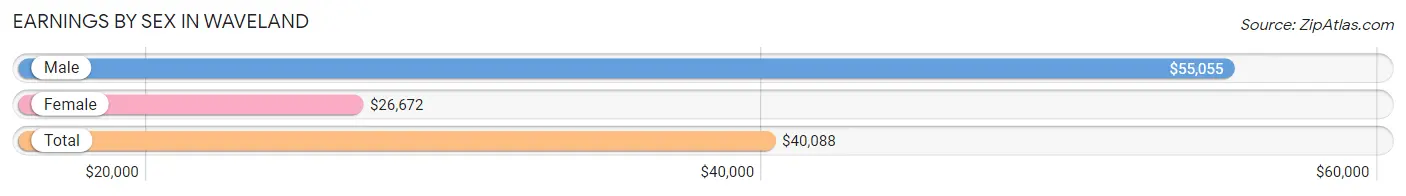
Earnings by Sex in Waveland
Average Earnings in Waveland are $40,088, $55,055 for men and $26,672 for women, a difference of 51.5%.
| Sex | Number | Average Earnings |
| Male | 2,009 (52.2%) | $55,055 |
| Female | 1,841 (47.8%) | $26,672 |
| Total | 3,850 (100.0%) | $40,088 |
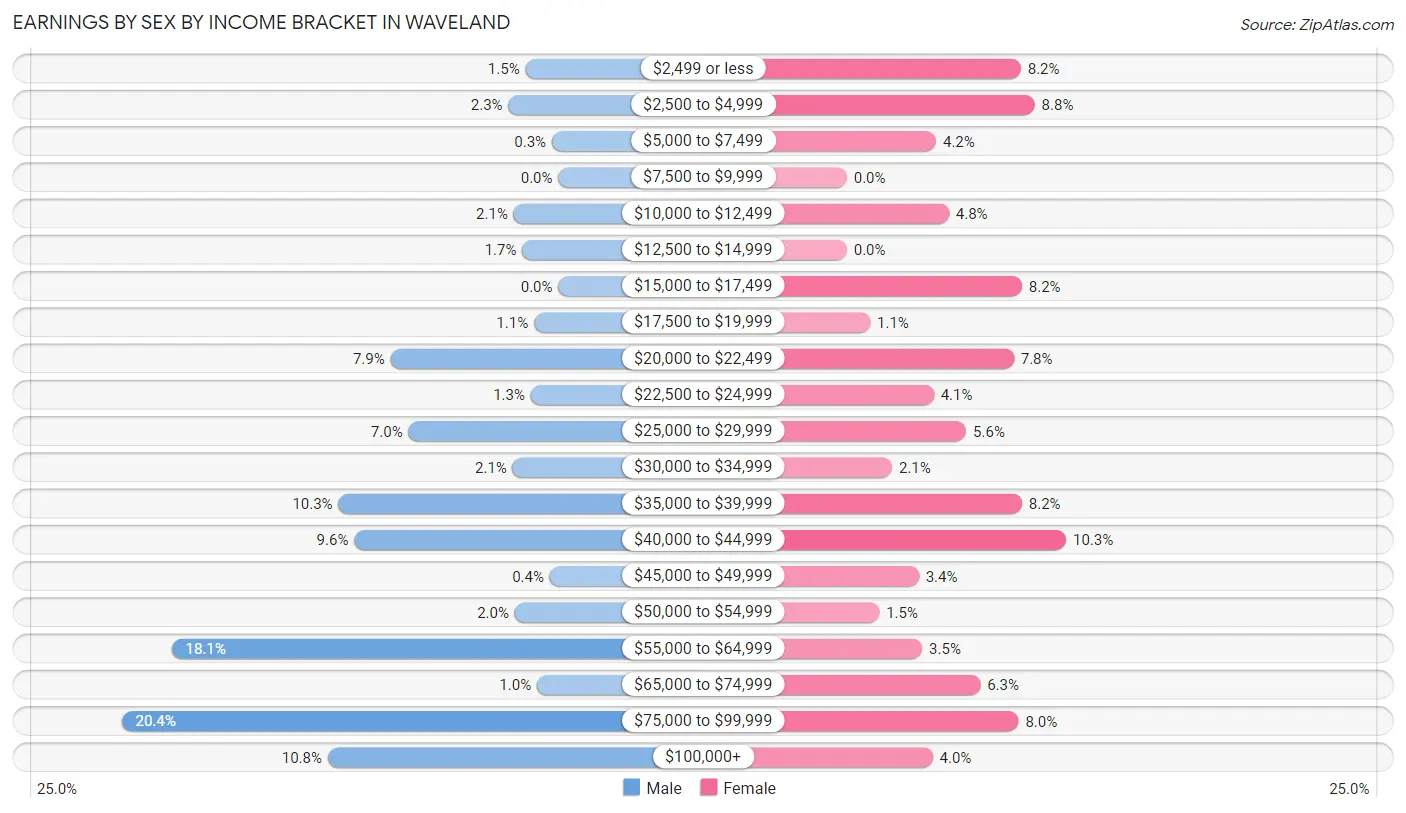
Earnings by Sex by Income Bracket in Waveland
The most common earnings brackets in Waveland are $75,000 to $99,999 for men (410 | 20.4%) and $40,000 to $44,999 for women (189 | 10.3%).
| Income | Male | Female |
| $2,499 or less | 31 (1.5%) | 150 (8.2%) |
| $2,500 to $4,999 | 47 (2.3%) | 162 (8.8%) |
| $5,000 to $7,499 | 6 (0.3%) | 77 (4.2%) |
| $7,500 to $9,999 | 0 (0.0%) | 0 (0.0%) |
| $10,000 to $12,499 | 42 (2.1%) | 88 (4.8%) |
| $12,500 to $14,999 | 34 (1.7%) | 0 (0.0%) |
| $15,000 to $17,499 | 0 (0.0%) | 151 (8.2%) |
| $17,500 to $19,999 | 23 (1.1%) | 20 (1.1%) |
| $20,000 to $22,499 | 158 (7.9%) | 144 (7.8%) |
| $22,500 to $24,999 | 26 (1.3%) | 75 (4.1%) |
| $25,000 to $29,999 | 141 (7.0%) | 103 (5.6%) |
| $30,000 to $34,999 | 43 (2.1%) | 39 (2.1%) |
| $35,000 to $39,999 | 207 (10.3%) | 151 (8.2%) |
| $40,000 to $44,999 | 192 (9.6%) | 189 (10.3%) |
| $45,000 to $49,999 | 8 (0.4%) | 62 (3.4%) |
| $50,000 to $54,999 | 41 (2.0%) | 28 (1.5%) |
| $55,000 to $64,999 | 363 (18.1%) | 65 (3.5%) |
| $65,000 to $74,999 | 20 (1.0%) | 115 (6.2%) |
| $75,000 to $99,999 | 410 (20.4%) | 148 (8.0%) |
| $100,000+ | 217 (10.8%) | 74 (4.0%) |
| Total | 2,009 (100.0%) | 1,841 (100.0%) |
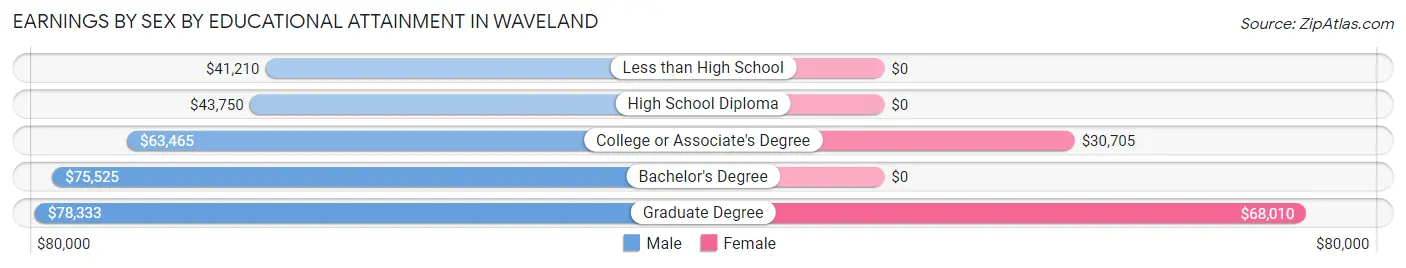
Earnings by Sex by Educational Attainment in Waveland
Average earnings in Waveland are $55,828 for men and $35,742 for women, a difference of 36.0%. Men with an educational attainment of graduate degree enjoy the highest average annual earnings of $78,333, while those with less than high school education earn the least with $41,210. Women with an educational attainment of graduate degree earn the most with the average annual earnings of $68,010, while those with college or associate's degree education have the smallest earnings of $30,705.
| Educational Attainment | Male Income | Female Income |
| Less than High School | $41,210 | $0 |
| High School Diploma | $43,750 | $0 |
| College or Associate's Degree | $63,465 | $30,705 |
| Bachelor's Degree | $75,525 | $0 |
| Graduate Degree | $78,333 | $68,010 |
| Total | $55,828 | $35,742 |
Family Income in Waveland
Family Income Brackets in Waveland
According to the Waveland family income data, there are 458 families falling into the $100,000 to $149,999 income range, which is the most common income bracket and makes up 23.0% of all families.
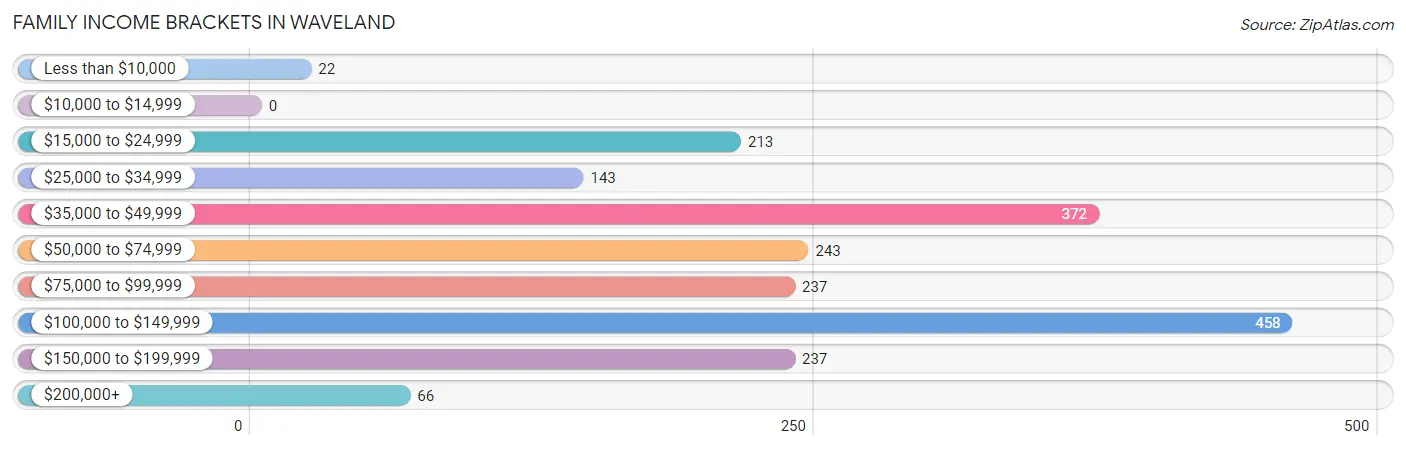
| Income Bracket | # Families | % Families |
| Less than $10,000 | 22 | 1.1% |
| $10,000 to $14,999 | 0 | 0.0% |
| $15,000 to $24,999 | 213 | 10.7% |
| $25,000 to $34,999 | 143 | 7.2% |
| $35,000 to $49,999 | 372 | 18.7% |
| $50,000 to $74,999 | 243 | 12.2% |
| $75,000 to $99,999 | 237 | 11.9% |
| $100,000 to $149,999 | 458 | 23.0% |
| $150,000 to $199,999 | 237 | 11.9% |
| $200,000+ | 66 | 3.3% |
Family Income by Famaliy Size in Waveland
4-person families (453 | 22.8%) account for the highest median family income in Waveland with $101,222 per family, while 2-person families (849 | 42.6%) have the highest median income of $35,886 per family member.
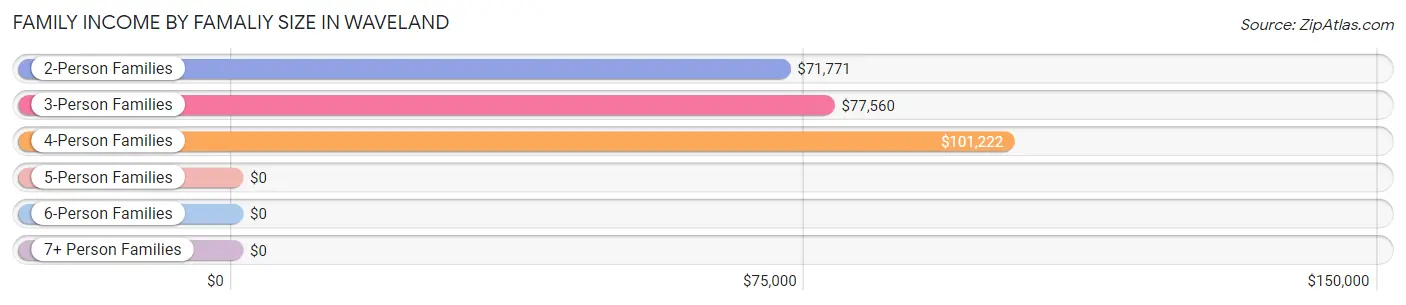
| Income Bracket | # Families | Median Income |
| 2-Person Families | 849 (42.6%) | $71,771 |
| 3-Person Families | 575 (28.9%) | $77,560 |
| 4-Person Families | 453 (22.8%) | $101,222 |
| 5-Person Families | 98 (4.9%) | $0 |
| 6-Person Families | 16 (0.8%) | $0 |
| 7+ Person Families | 0 (0.0%) | $0 |
| Total | 1,991 (100.0%) | $75,052 |
Family Income by Number of Earners in Waveland
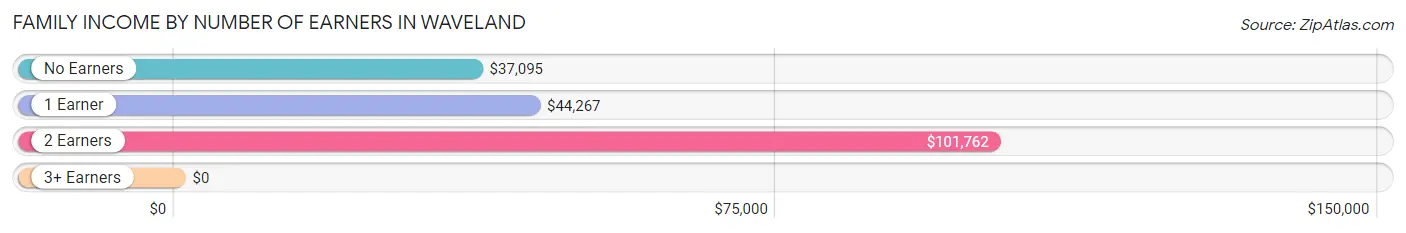
| Number of Earners | # Families | Median Income |
| No Earners | 346 (17.4%) | $37,095 |
| 1 Earner | 386 (19.4%) | $44,267 |
| 2 Earners | 1,057 (53.1%) | $101,762 |
| 3+ Earners | 202 (10.2%) | $0 |
| Total | 1,991 (100.0%) | $75,052 |
Household Income in Waveland
Household Income Brackets in Waveland
With 571 households falling in the category, the $100,000 to $149,999 income range is the most frequent in Waveland, accounting for 19.1% of all households. In contrast, only 78 households (2.6%) fall into the $200,000+ income bracket, making it the least populous group.
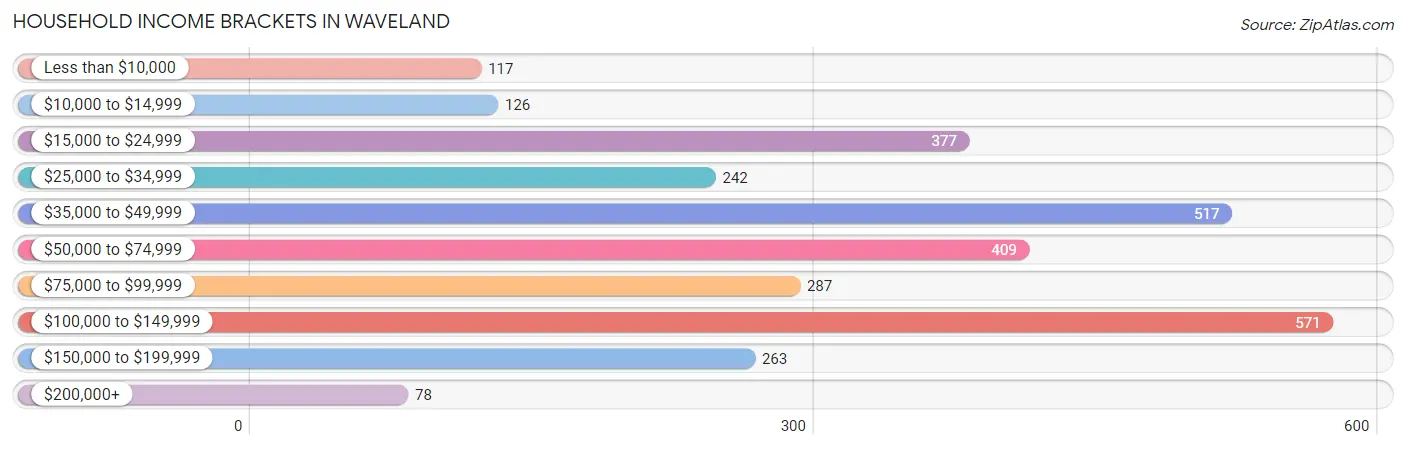
| Income Bracket | # Households | % Households |
| Less than $10,000 | 117 | 3.9% |
| $10,000 to $14,999 | 126 | 4.2% |
| $15,000 to $24,999 | 377 | 12.6% |
| $25,000 to $34,999 | 242 | 8.1% |
| $35,000 to $49,999 | 517 | 17.3% |
| $50,000 to $74,999 | 409 | 13.7% |
| $75,000 to $99,999 | 287 | 9.6% |
| $100,000 to $149,999 | 571 | 19.1% |
| $150,000 to $199,999 | 263 | 8.8% |
| $200,000+ | 78 | 2.6% |
Household Income by Householder Age in Waveland
The median household income in Waveland is $56,396, with the highest median household income of $83,798 found in the 25 to 44 years age bracket for the primary householder. A total of 669 households (22.4%) fall into this category. Meanwhile, the 15 to 24 years age bracket for the primary householder has the lowest median household income of $26,005, with 113 households (3.8%) in this group.
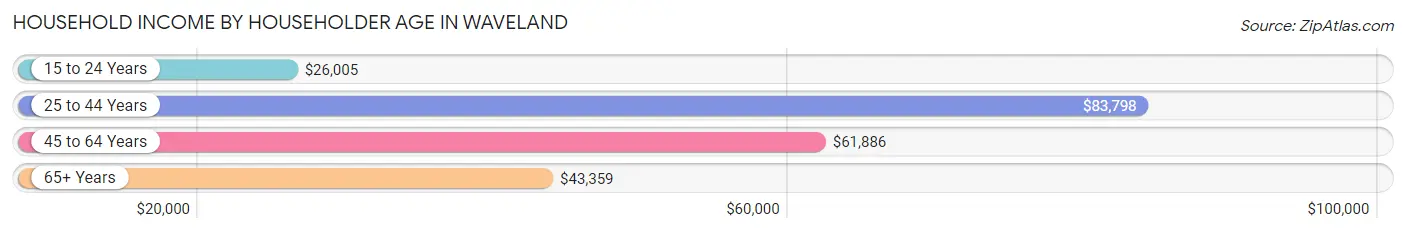
| Income Bracket | # Households | Median Income |
| 15 to 24 Years | 113 (3.8%) | $26,005 |
| 25 to 44 Years | 669 (22.4%) | $83,798 |
| 45 to 64 Years | 1,409 (47.1%) | $61,886 |
| 65+ Years | 798 (26.7%) | $43,359 |
| Total | 2,989 (100.0%) | $56,396 |
Poverty in Waveland
Income Below Poverty by Sex and Age in Waveland
With 10.3% poverty level for males and 17.3% for females among the residents of Waveland, 5 year old males and 75 year old and over females are the most vulnerable to poverty, with 73 males (79.3%) and 71 females (34.1%) in their respective age groups living below the poverty level.
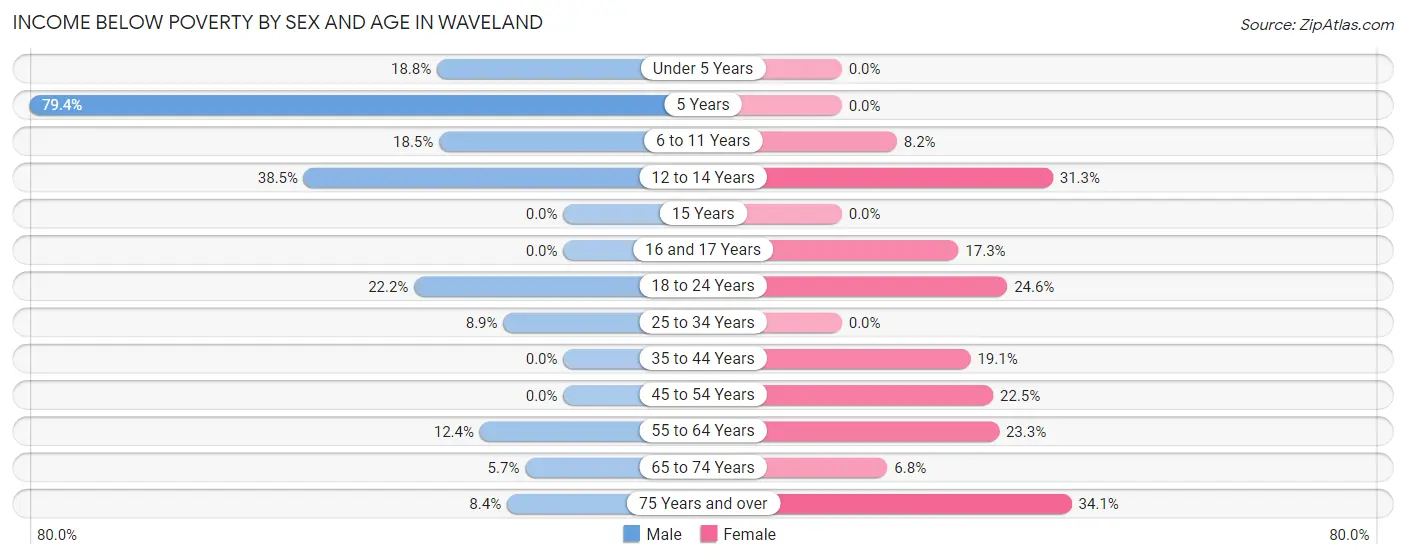
| Age Bracket | Male | Female |
| Under 5 Years | 30 (18.8%) | 0 (0.0%) |
| 5 Years | 73 (79.3%) | 0 (0.0%) |
| 6 to 11 Years | 19 (18.4%) | 13 (8.2%) |
| 12 to 14 Years | 42 (38.5%) | 47 (31.3%) |
| 15 Years | 0 (0.0%) | 0 (0.0%) |
| 16 and 17 Years | 0 (0.0%) | 66 (17.3%) |
| 18 to 24 Years | 35 (22.2%) | 56 (24.6%) |
| 25 to 34 Years | 49 (8.9%) | 0 (0.0%) |
| 35 to 44 Years | 0 (0.0%) | 95 (19.1%) |
| 45 to 54 Years | 0 (0.0%) | 153 (22.5%) |
| 55 to 64 Years | 52 (12.4%) | 102 (23.3%) |
| 65 to 74 Years | 21 (5.7%) | 31 (6.8%) |
| 75 Years and over | 20 (8.4%) | 71 (34.1%) |
| Total | 341 (10.3%) | 634 (17.3%) |
Income Above Poverty by Sex and Age in Waveland
According to the poverty statistics in Waveland, males aged 15 years and females aged under 5 years are the age groups that are most secure financially, with 100.0% of males and 100.0% of females in these age groups living above the poverty line.
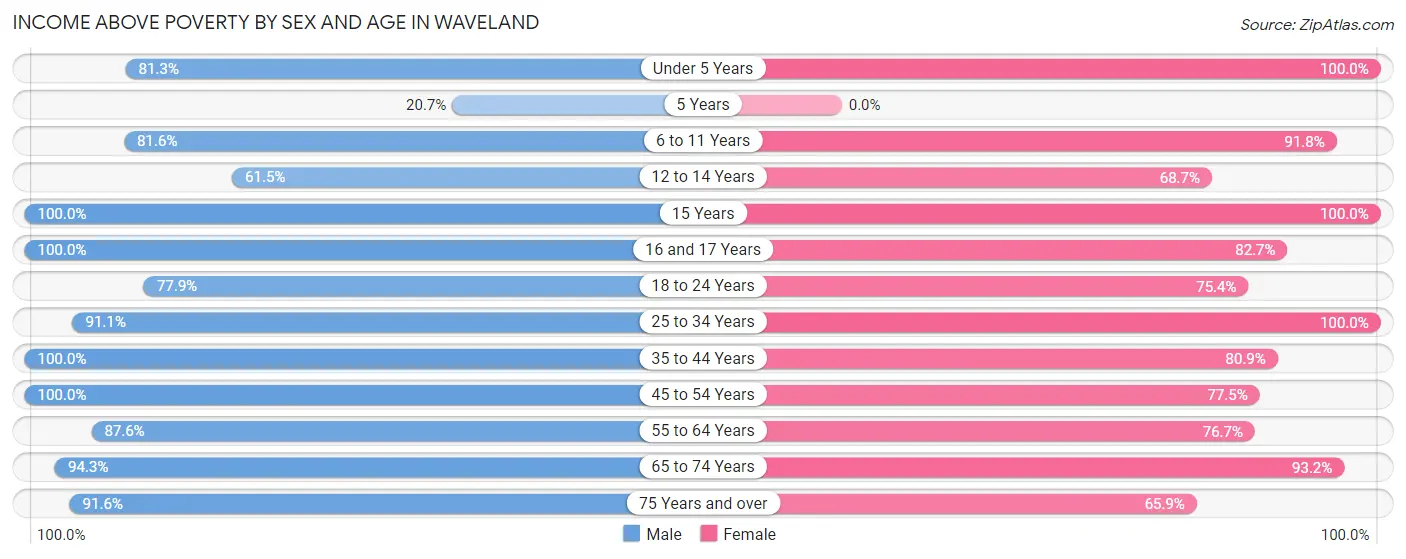
| Age Bracket | Male | Female |
| Under 5 Years | 130 (81.2%) | 115 (100.0%) |
| 5 Years | 19 (20.6%) | 0 (0.0%) |
| 6 to 11 Years | 84 (81.6%) | 146 (91.8%) |
| 12 to 14 Years | 67 (61.5%) | 103 (68.7%) |
| 15 Years | 47 (100.0%) | 23 (100.0%) |
| 16 and 17 Years | 103 (100.0%) | 315 (82.7%) |
| 18 to 24 Years | 123 (77.8%) | 172 (75.4%) |
| 25 to 34 Years | 501 (91.1%) | 320 (100.0%) |
| 35 to 44 Years | 271 (100.0%) | 402 (80.9%) |
| 45 to 54 Years | 673 (100.0%) | 528 (77.5%) |
| 55 to 64 Years | 367 (87.6%) | 335 (76.7%) |
| 65 to 74 Years | 350 (94.3%) | 427 (93.2%) |
| 75 Years and over | 219 (91.6%) | 137 (65.9%) |
| Total | 2,954 (89.6%) | 3,023 (82.7%) |
Income Below Poverty Among Married-Couple Families in Waveland
The poverty statistics for married-couple families in Waveland show that 2.4% or 34 of the total 1,396 families live below the poverty line. Families with 1 or 2 children have the highest poverty rate of 3.3%, comprising of 18 families. On the other hand, families with 3 or 4 children have the lowest poverty rate of 0.0%, which includes 0 families.
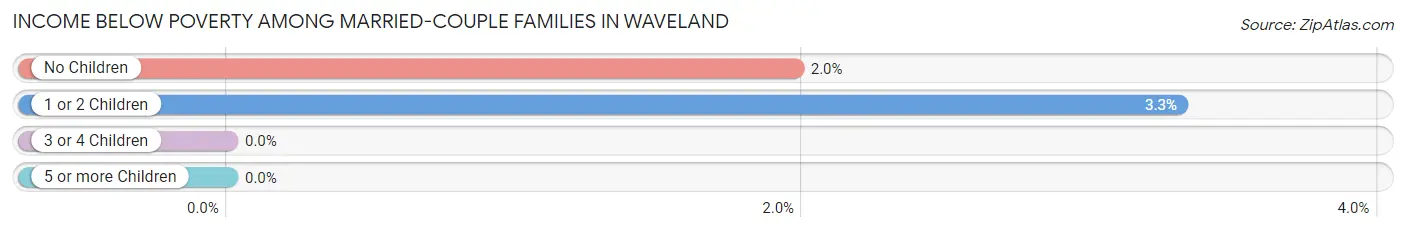
| Children | Above Poverty | Below Poverty |
| No Children | 796 (98.0%) | 16 (2.0%) |
| 1 or 2 Children | 525 (96.7%) | 18 (3.3%) |
| 3 or 4 Children | 41 (100.0%) | 0 (0.0%) |
| 5 or more Children | 0 (0.0%) | 0 (0.0%) |
| Total | 1,362 (97.6%) | 34 (2.4%) |
Income Below Poverty Among Single-Parent Households in Waveland
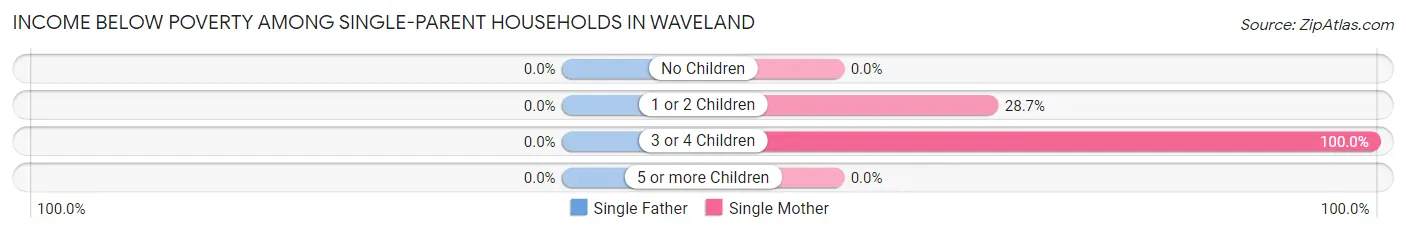
| Children | Single Father | Single Mother |
| No Children | 0 (0.0%) | 0 (0.0%) |
| 1 or 2 Children | 0 (0.0%) | 110 (28.7%) |
| 3 or 4 Children | 0 (0.0%) | 73 (100.0%) |
| 5 or more Children | 0 (0.0%) | 0 (0.0%) |
| Total | 0 (0.0%) | 183 (40.1%) |
Income Below Poverty Among Married-Couple vs Single-Parent Households in Waveland
The poverty data for Waveland shows that 34 of the married-couple family households (2.4%) and 183 of the single-parent households (30.8%) are living below the poverty level. Within the married-couple family households, those with 1 or 2 children have the highest poverty rate, with 18 households (3.3%) falling below the poverty line. Among the single-parent households, those with 3 or 4 children have the highest poverty rate, with 73 household (100.0%) living below poverty.
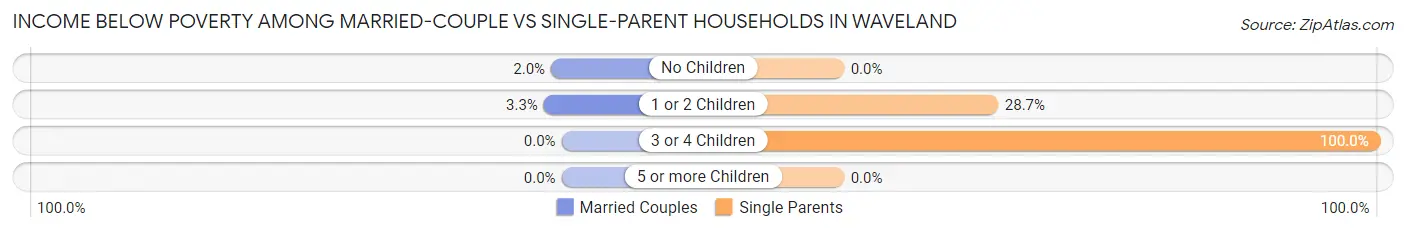
| Children | Married-Couple Families | Single-Parent Households |
| No Children | 16 (2.0%) | 0 (0.0%) |
| 1 or 2 Children | 18 (3.3%) | 110 (28.7%) |
| 3 or 4 Children | 0 (0.0%) | 73 (100.0%) |
| 5 or more Children | 0 (0.0%) | 0 (0.0%) |
| Total | 34 (2.4%) | 183 (30.8%) |
Race in Waveland
The most populous races in Waveland are White / Caucasian (5,785 | 81.8%), Black / African American (938 | 13.3%), and Two or more Races (292 | 4.1%).
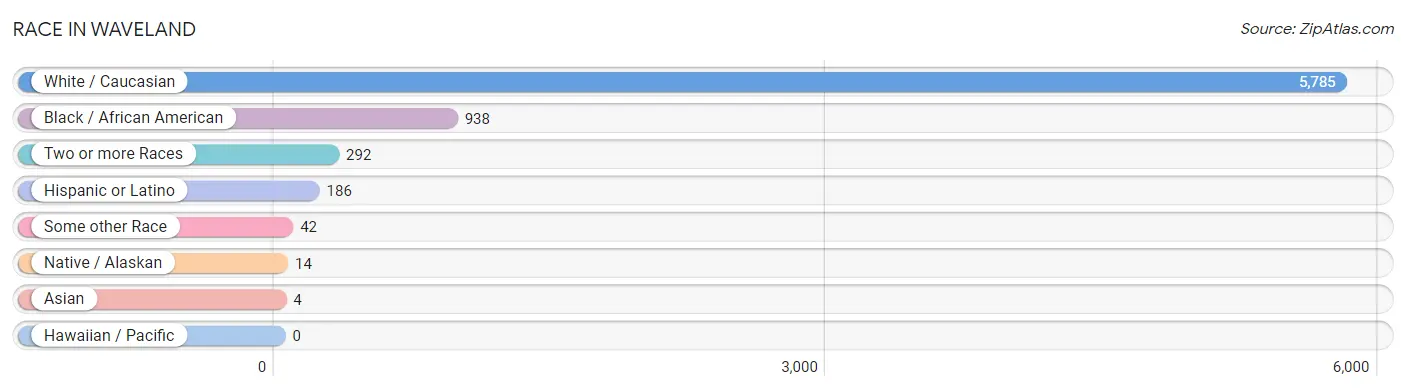
| Race | # Population | % Population |
| Asian | 4 | 0.1% |
| Black / African American | 938 | 13.3% |
| Hawaiian / Pacific | 0 | 0.0% |
| Hispanic or Latino | 186 | 2.6% |
| Native / Alaskan | 14 | 0.2% |
| White / Caucasian | 5,785 | 81.8% |
| Two or more Races | 292 | 4.1% |
| Some other Race | 42 | 0.6% |
| Total | 7,075 | 100.0% |
Ancestry in Waveland
The most populous ancestries reported in Waveland are German (811 | 11.5%), American (790 | 11.2%), French (602 | 8.5%), English (489 | 6.9%), and Irish (484 | 6.8%), together accounting for 44.9% of all Waveland residents.
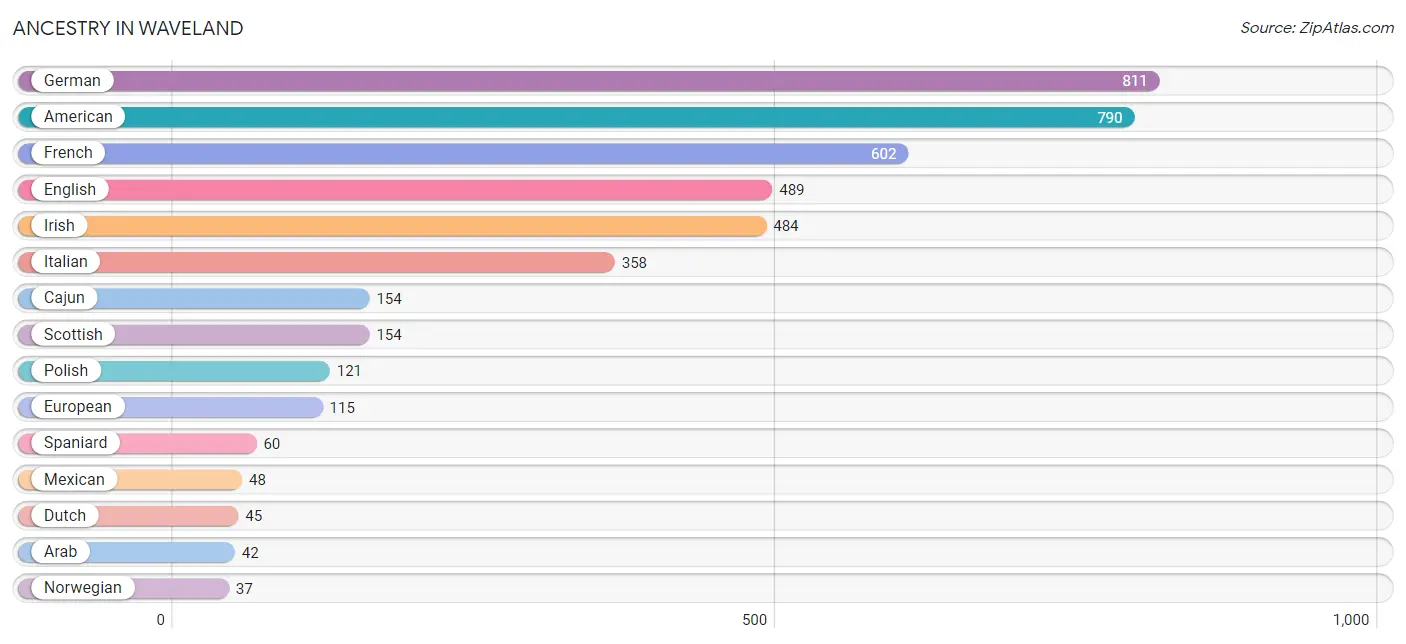
| Ancestry | # Population | % Population |
| American | 790 | 11.2% |
| Arab | 42 | 0.6% |
| Australian | 15 | 0.2% |
| Blackfeet | 10 | 0.1% |
| British | 12 | 0.2% |
| Cajun | 154 | 2.2% |
| Central American | 26 | 0.4% |
| Choctaw | 14 | 0.2% |
| Cuban | 18 | 0.3% |
| Czech | 17 | 0.2% |
| Dominican | 34 | 0.5% |
| Dutch | 45 | 0.6% |
| English | 489 | 6.9% |
| European | 115 | 1.6% |
| French | 602 | 8.5% |
| French Canadian | 27 | 0.4% |
| German | 811 | 11.5% |
| Irish | 484 | 6.8% |
| Italian | 358 | 5.1% |
| Mexican | 48 | 0.7% |
| Nicaraguan | 26 | 0.4% |
| Northern European | 25 | 0.4% |
| Norwegian | 37 | 0.5% |
| Pakistani | 4 | 0.1% |
| Polish | 121 | 1.7% |
| Portuguese | 22 | 0.3% |
| Scotch-Irish | 28 | 0.4% |
| Scottish | 154 | 2.2% |
| Slovak | 36 | 0.5% |
| Spaniard | 60 | 0.9% |
| Sri Lankan | 2 | 0.0% | View All 31 Rows |
Immigrants in Waveland
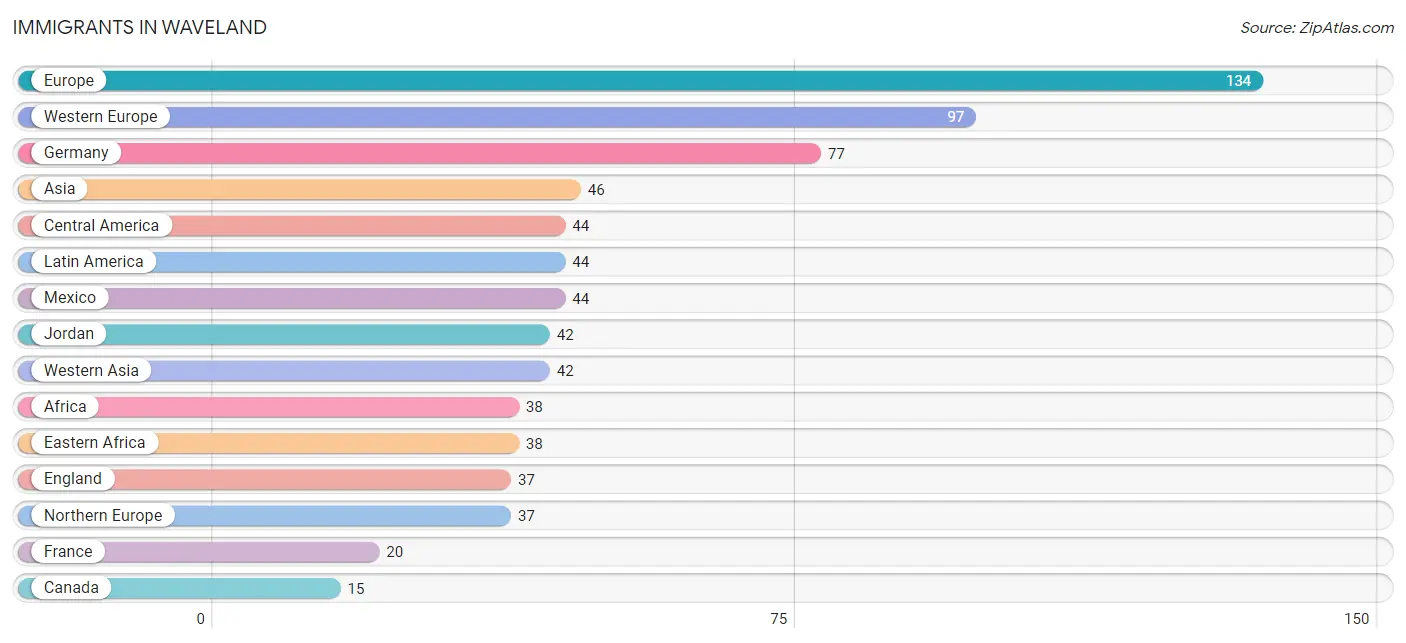
The most numerous immigrant groups reported in Waveland came from Europe (134 | 1.9%), Western Europe (97 | 1.4%), Germany (77 | 1.1%), Asia (46 | 0.6%), and Central America (44 | 0.6%), together accounting for 5.6% of all Waveland residents.
| Immigration Origin | # Population | % Population |
| Africa | 38 | 0.5% |
| Asia | 46 | 0.6% |
| Canada | 15 | 0.2% |
| Central America | 44 | 0.6% |
| Eastern Africa | 38 | 0.5% |
| England | 37 | 0.5% |
| Europe | 134 | 1.9% |
| France | 20 | 0.3% |
| Germany | 77 | 1.1% |
| Jordan | 42 | 0.6% |
| Latin America | 44 | 0.6% |
| Mexico | 44 | 0.6% |
| Northern Europe | 37 | 0.5% |
| South Eastern Asia | 4 | 0.1% |
| Thailand | 4 | 0.1% |
| Western Asia | 42 | 0.6% |
| Western Europe | 97 | 1.4% | View All 17 Rows |
Sex and Age in Waveland
Sex and Age in Waveland
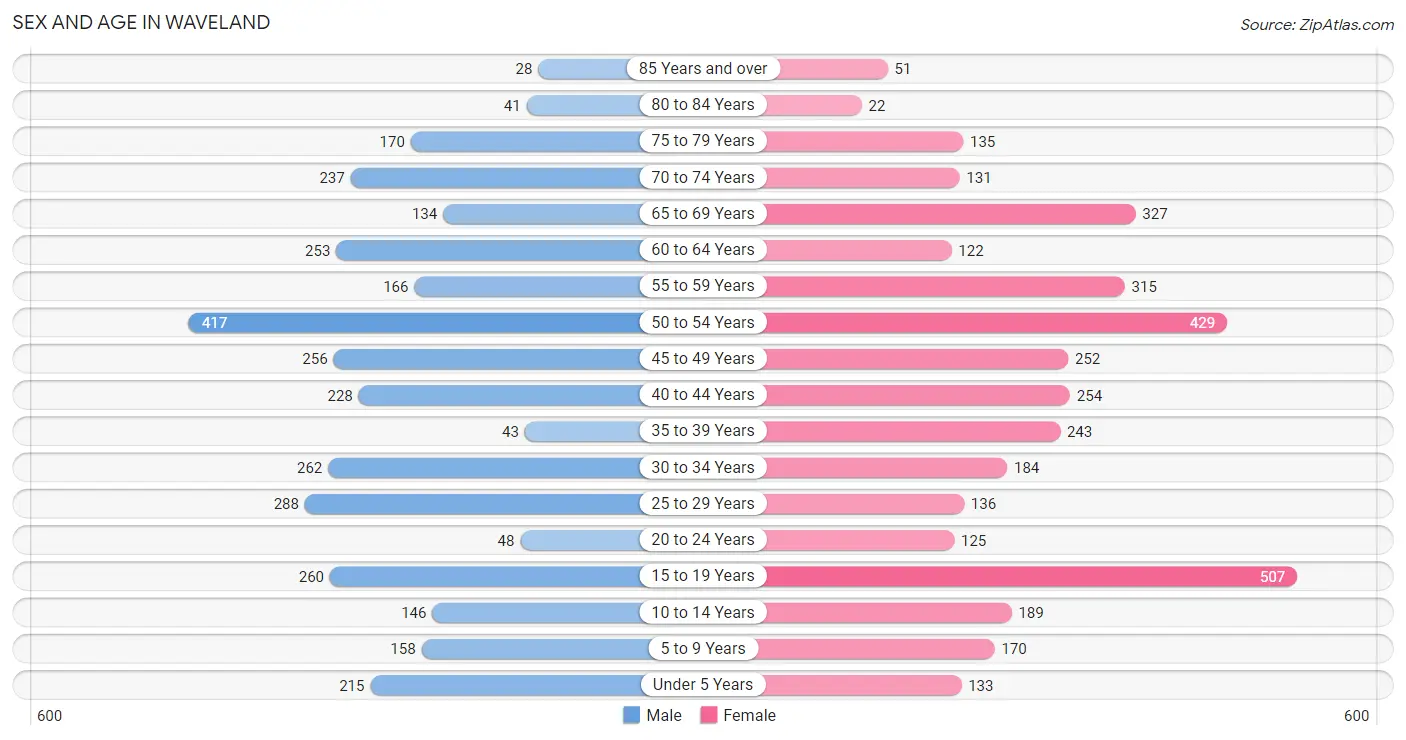
The most populous age groups in Waveland are 50 to 54 Years (417 | 12.4%) for men and 15 to 19 Years (507 | 13.6%) for women.
| Age Bracket | Male | Female |
| Under 5 Years | 215 (6.4%) | 133 (3.6%) |
| 5 to 9 Years | 158 (4.7%) | 170 (4.6%) |
| 10 to 14 Years | 146 (4.4%) | 189 (5.1%) |
| 15 to 19 Years | 260 (7.8%) | 507 (13.6%) |
| 20 to 24 Years | 48 (1.4%) | 125 (3.4%) |
| 25 to 29 Years | 288 (8.6%) | 136 (3.6%) |
| 30 to 34 Years | 262 (7.8%) | 184 (4.9%) |
| 35 to 39 Years | 43 (1.3%) | 243 (6.5%) |
| 40 to 44 Years | 228 (6.8%) | 254 (6.8%) |
| 45 to 49 Years | 256 (7.6%) | 252 (6.8%) |
| 50 to 54 Years | 417 (12.4%) | 429 (11.5%) |
| 55 to 59 Years | 166 (5.0%) | 315 (8.5%) |
| 60 to 64 Years | 253 (7.5%) | 122 (3.3%) |
| 65 to 69 Years | 134 (4.0%) | 327 (8.8%) |
| 70 to 74 Years | 237 (7.1%) | 131 (3.5%) |
| 75 to 79 Years | 170 (5.1%) | 135 (3.6%) |
| 80 to 84 Years | 41 (1.2%) | 22 (0.6%) |
| 85 Years and over | 28 (0.8%) | 51 (1.4%) |
| Total | 3,350 (100.0%) | 3,725 (100.0%) |
Families and Households in Waveland
Median Family Size in Waveland
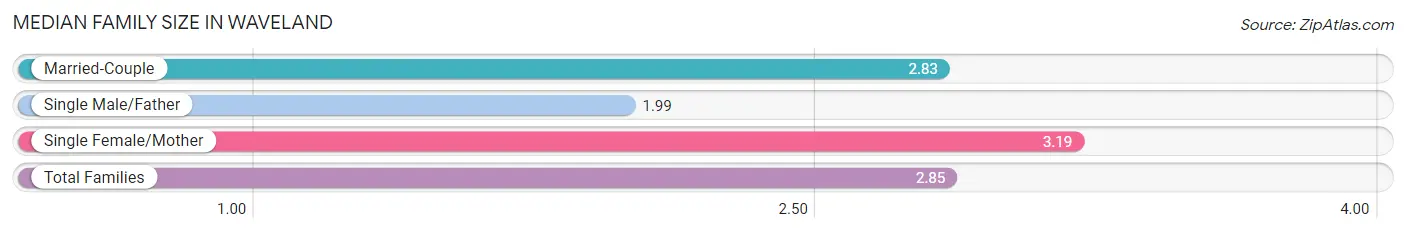
The median family size in Waveland is 2.85 persons per family, with single female/mother families (456 | 22.9%) accounting for the largest median family size of 3.19 persons per family. On the other hand, single male/father families (139 | 7.0%) represent the smallest median family size with 1.99 persons per family.
| Family Type | # Families | Family Size |
| Married-Couple | 1,396 (70.1%) | 2.83 |
| Single Male/Father | 139 (7.0%) | 1.99 |
| Single Female/Mother | 456 (22.9%) | 3.19 |
| Total Families | 1,991 (100.0%) | 2.85 |
Median Household Size in Waveland
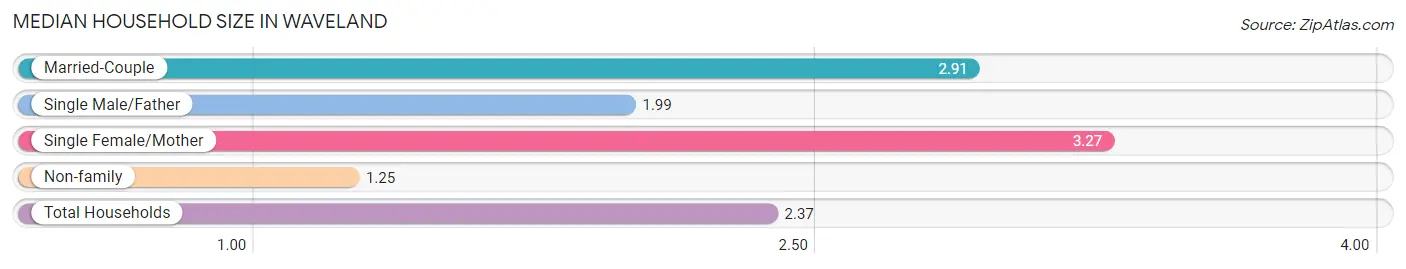
The median household size in Waveland is 2.37 persons per household, with single female/mother households (456 | 15.3%) accounting for the largest median household size of 3.27 persons per household. non-family households (998 | 33.4%) represent the smallest median household size with 1.25 persons per household.
| Household Type | # Households | Household Size |
| Married-Couple | 1,396 (46.7%) | 2.91 |
| Single Male/Father | 139 (4.6%) | 1.99 |
| Single Female/Mother | 456 (15.3%) | 3.27 |
| Non-family | 998 (33.4%) | 1.25 |
| Total Households | 2,989 (100.0%) | 2.37 |
Household Size by Marriage Status in Waveland
Out of a total of 2,989 households in Waveland, 1,991 (66.6%) are family households, while 998 (33.4%) are nonfamily households. The most numerous type of family households are 2-person households, comprising 849, and the most common type of nonfamily households are 1-person households, comprising 815.
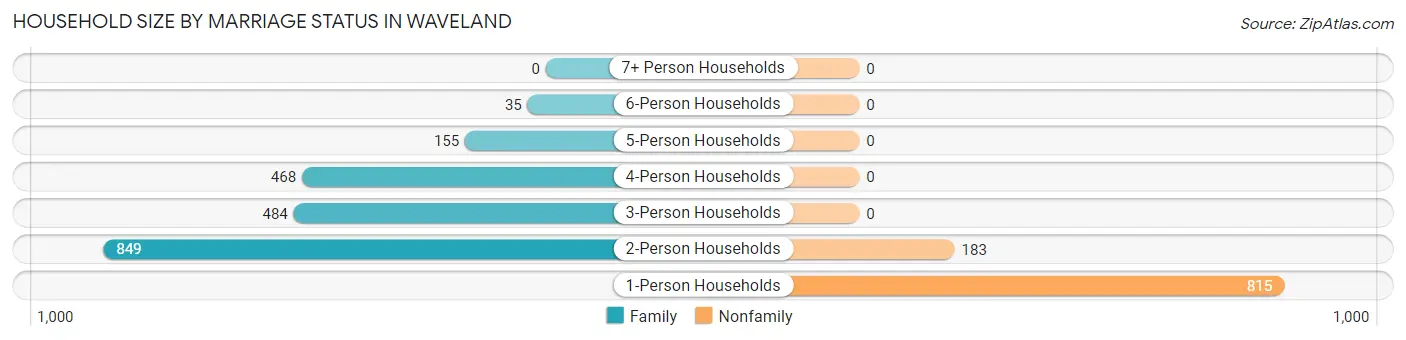
| Household Size | Family Households | Nonfamily Households |
| 1-Person Households | - | 815 (27.3%) |
| 2-Person Households | 849 (28.4%) | 183 (6.1%) |
| 3-Person Households | 484 (16.2%) | 0 (0.0%) |
| 4-Person Households | 468 (15.7%) | 0 (0.0%) |
| 5-Person Households | 155 (5.2%) | 0 (0.0%) |
| 6-Person Households | 35 (1.2%) | 0 (0.0%) |
| 7+ Person Households | 0 (0.0%) | 0 (0.0%) |
| Total | 1,991 (66.6%) | 998 (33.4%) |
Female Fertility in Waveland
Fertility by Age in Waveland
Average fertility rate in Waveland is 35.0 births per 1,000 women. Women in the age bracket of 20 to 34 years have the highest fertility rate with 74.0 births per 1,000 women. Women in the age bracket of 20 to 34 years acount for 53.2% of all women with births.
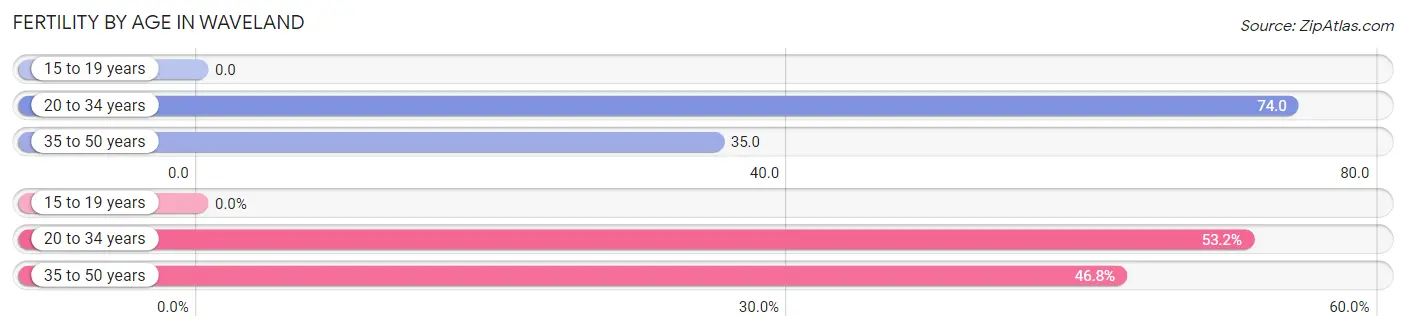
| Age Bracket | Women with Births | Births / 1,000 Women |
| 15 to 19 years | 0 (0.0%) | 0.0 |
| 20 to 34 years | 33 (53.2%) | 74.0 |
| 35 to 50 years | 29 (46.8%) | 35.0 |
| Total | 62 (100.0%) | 35.0 |
Fertility by Age by Marriage Status in Waveland
71.0% of women with births (62) in Waveland are married. The highest percentage of unmarried women with births falls into 20 to 34 years age bracket with 54.5% of them unmarried at the time of birth, while the lowest percentage of unmarried women with births belong to 35 to 50 years age bracket with 0.0% of them unmarried.
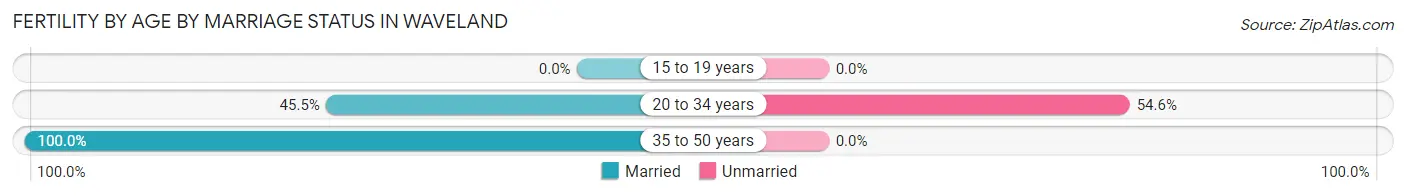
| Age Bracket | Married | Unmarried |
| 15 to 19 years | 0 (0.0%) | 0 (0.0%) |
| 20 to 34 years | 15 (45.5%) | 18 (54.5%) |
| 35 to 50 years | 29 (100.0%) | 0 (0.0%) |
| Total | 44 (71.0%) | 18 (29.0%) |
Fertility by Education in Waveland
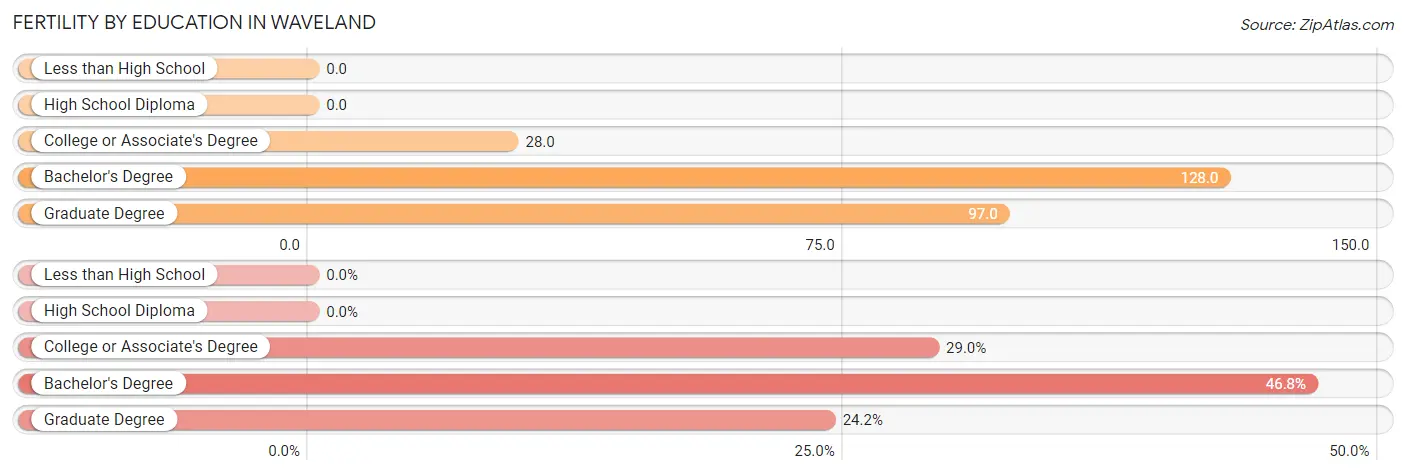
| Educational Attainment | Women with Births | Births / 1,000 Women |
| Less than High School | 0 (0.0%) | 0.0 |
| High School Diploma | 0 (0.0%) | 0.0 |
| College or Associate's Degree | 18 (29.0%) | 28.0 |
| Bachelor's Degree | 29 (46.8%) | 128.0 |
| Graduate Degree | 15 (24.2%) | 97.0 |
| Total | 62 (100.0%) | 35.0 |
Fertility by Education by Marriage Status in Waveland
29.0% of women with births in Waveland are unmarried. Women with the educational attainment of bachelor's degree are most likely to be married with 100.0% of them married at childbirth, while women with the educational attainment of college or associate's degree are least likely to be married with 100.0% of them unmarried at childbirth.
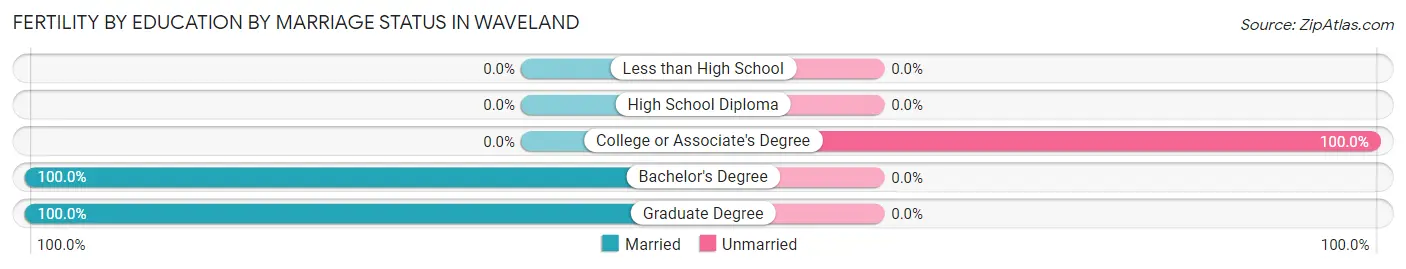
| Educational Attainment | Married | Unmarried |
| Less than High School | 0 (0.0%) | 0 (0.0%) |
| High School Diploma | 0 (0.0%) | 0 (0.0%) |
| College or Associate's Degree | 0 (0.0%) | 18 (100.0%) |
| Bachelor's Degree | 29 (100.0%) | 0 (0.0%) |
| Graduate Degree | 15 (100.0%) | 0 (0.0%) |
| Total | 44 (71.0%) | 18 (29.0%) |
Employment Characteristics in Waveland
Employment by Class of Employer in Waveland
Among the 3,374 employed individuals in Waveland, private company employees (2,386 | 70.7%), self-employed (not incorporated) (256 | 7.6%), and federal government employees (227 | 6.7%) make up the most common classes of employment.
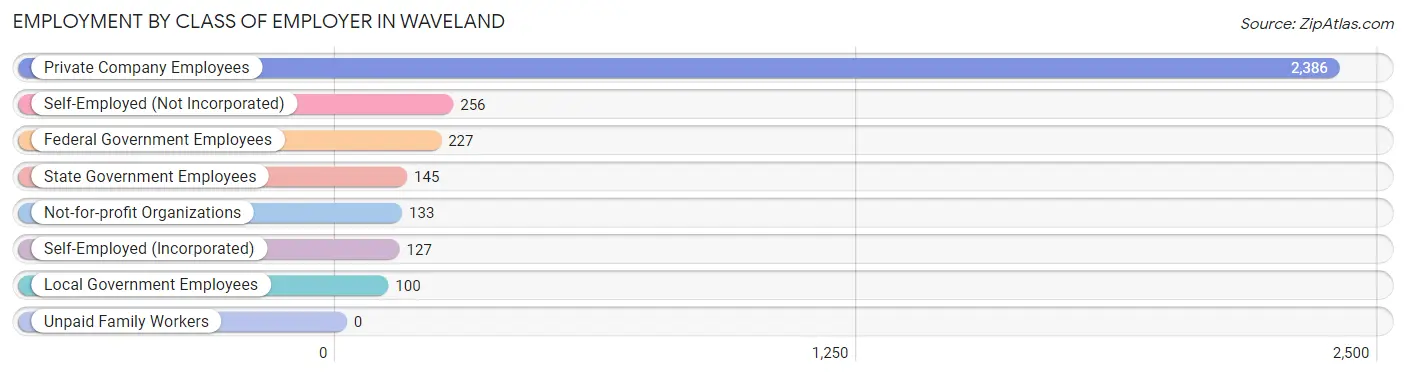
| Employer Class | # Employees | % Employees |
| Private Company Employees | 2,386 | 70.7% |
| Self-Employed (Incorporated) | 127 | 3.8% |
| Self-Employed (Not Incorporated) | 256 | 7.6% |
| Not-for-profit Organizations | 133 | 3.9% |
| Local Government Employees | 100 | 3.0% |
| State Government Employees | 145 | 4.3% |
| Federal Government Employees | 227 | 6.7% |
| Unpaid Family Workers | 0 | 0.0% |
| Total | 3,374 | 100.0% |
Employment Status by Age in Waveland
According to the labor force statistics for Waveland, out of the total population over 16 years of age (5,994), 62.8% or 3,764 individuals are in the labor force, with 9.0% or 339 of them unemployed. The age group with the highest labor force participation rate is 30 to 34 years, with 100.0% or 446 individuals in the labor force. Within the labor force, the 30 to 34 years age range has the highest percentage of unemployed individuals, with 38.8% or 173 of them being unemployed.
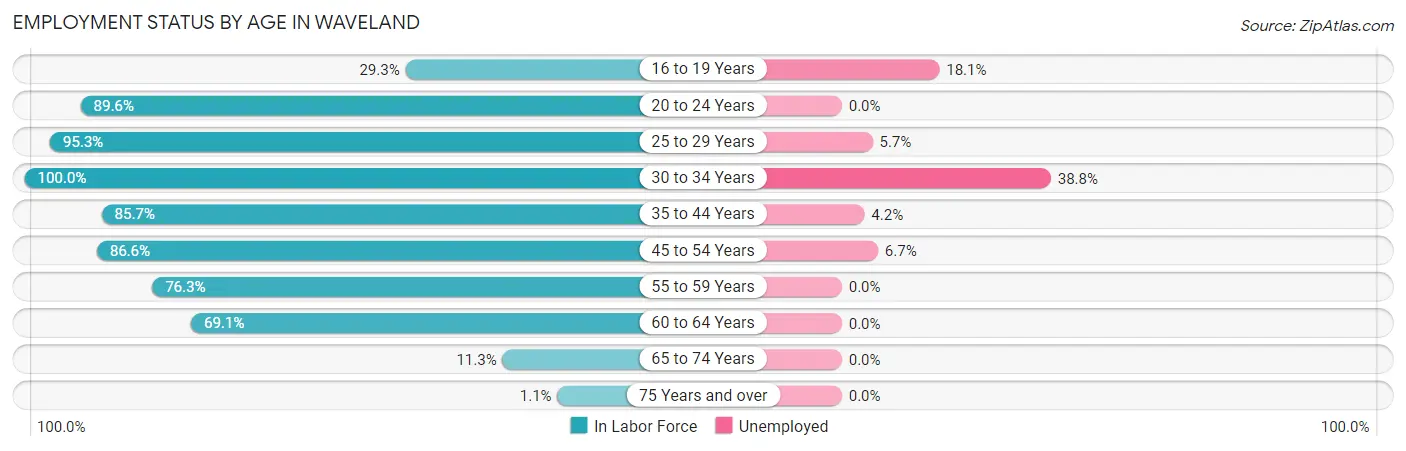
| Age Bracket | In Labor Force | Unemployed |
| 16 to 19 Years | 204 (29.3%) | 37 (18.1%) |
| 20 to 24 Years | 155 (89.6%) | 0 (0.0%) |
| 25 to 29 Years | 404 (95.3%) | 23 (5.7%) |
| 30 to 34 Years | 446 (100.0%) | 173 (38.8%) |
| 35 to 44 Years | 658 (85.7%) | 28 (4.2%) |
| 45 to 54 Years | 1,173 (86.6%) | 79 (6.7%) |
| 55 to 59 Years | 367 (76.3%) | 0 (0.0%) |
| 60 to 64 Years | 259 (69.1%) | 0 (0.0%) |
| 65 to 74 Years | 94 (11.3%) | 0 (0.0%) |
| 75 Years and over | 5 (1.1%) | 0 (0.0%) |
| Total | 3,764 (62.8%) | 339 (9.0%) |
Employment Status by Educational Attainment in Waveland
According to labor force statistics for Waveland, 85.9% of individuals (3,305) out of the total population between 25 and 64 years of age (3,848) are in the labor force, with 9.2% or 304 of them being unemployed. The group with the highest labor force participation rate are those with the educational attainment of bachelor's degree or higher, with 95.4% or 889 individuals in the labor force. Within the labor force, individuals with high school diploma education have the highest percentage of unemployment, with 24.5% or 163 of them being unemployed.
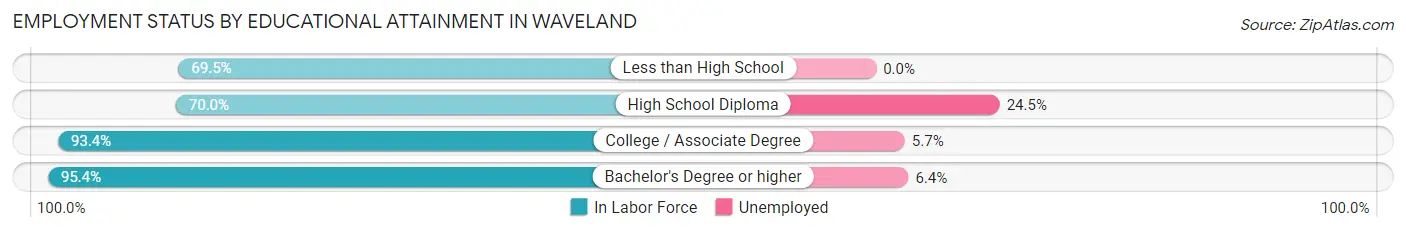
| Educational Attainment | In Labor Force | Unemployed |
| Less than High School | 248 (69.5%) | 0 (0.0%) |
| High School Diploma | 664 (70.0%) | 232 (24.5%) |
| College / Associate Degree | 1,505 (93.4%) | 92 (5.7%) |
| Bachelor's Degree or higher | 889 (95.4%) | 60 (6.4%) |
| Total | 3,305 (85.9%) | 354 (9.2%) |
Employment Occupations by Sex in Waveland
Management, Business, Science and Arts Occupations
The most common Management, Business, Science and Arts occupations in Waveland are Management (461 | 13.5%), Computers, Engineering & Science (370 | 10.9%), Life, Physical & Social Science (215 | 6.3%), Community & Social Service (164 | 4.8%), and Business & Financial (150 | 4.4%).

Management, Business, Science and Arts Occupations by Sex
Within the Management, Business, Science and Arts occupations in Waveland, the most male-oriented occupations are Architecture & Engineering (100.0%), Computers & Mathematics (79.9%), and Management (66.4%), while the most female-oriented occupations are Community & Social Service (100.0%), Education, Arts & Media (100.0%), and Legal Services & Support (100.0%).
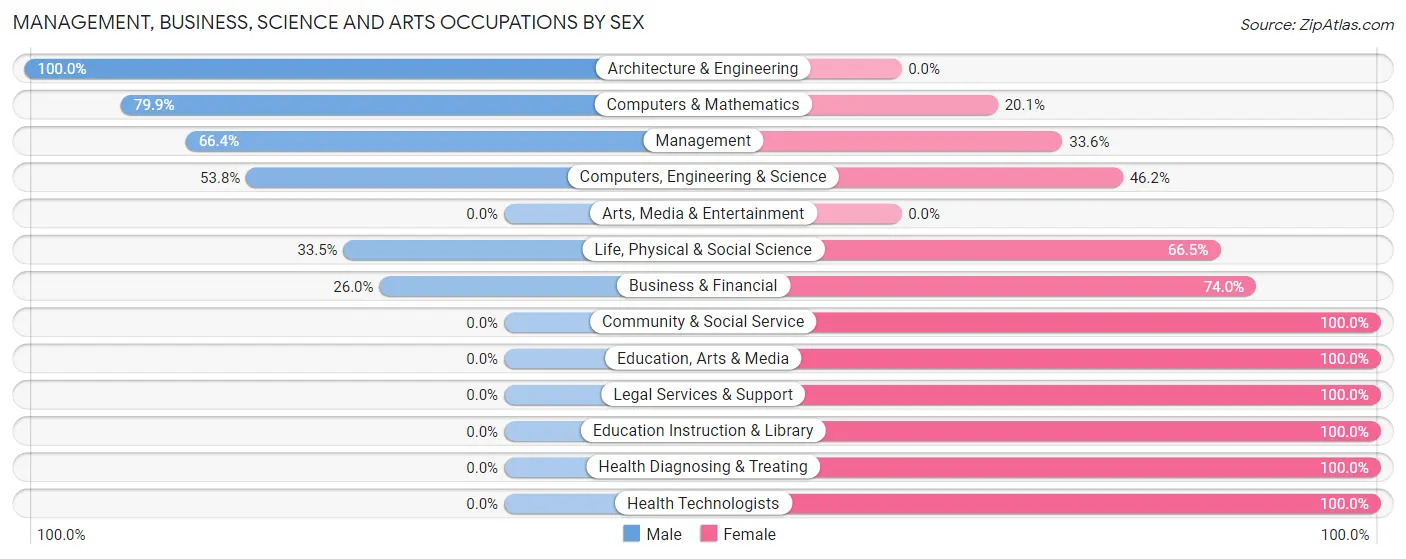
| Occupation | Male | Female |
| Management | 306 (66.4%) | 155 (33.6%) |
| Business & Financial | 39 (26.0%) | 111 (74.0%) |
| Computers, Engineering & Science | 199 (53.8%) | 171 (46.2%) |
| Computers & Mathematics | 111 (79.9%) | 28 (20.1%) |
| Architecture & Engineering | 16 (100.0%) | 0 (0.0%) |
| Life, Physical & Social Science | 72 (33.5%) | 143 (66.5%) |
| Community & Social Service | 0 (0.0%) | 164 (100.0%) |
| Education, Arts & Media | 0 (0.0%) | 81 (100.0%) |
| Legal Services & Support | 0 (0.0%) | 33 (100.0%) |
| Education Instruction & Library | 0 (0.0%) | 50 (100.0%) |
| Arts, Media & Entertainment | 0 (0.0%) | 0 (0.0%) |
| Health Diagnosing & Treating | 0 (0.0%) | 21 (100.0%) |
| Health Technologists | 0 (0.0%) | 7 (100.0%) |
| Total (Category) | 544 (46.7%) | 622 (53.3%) |
| Total (Overall) | 1,804 (53.0%) | 1,602 (47.0%) |
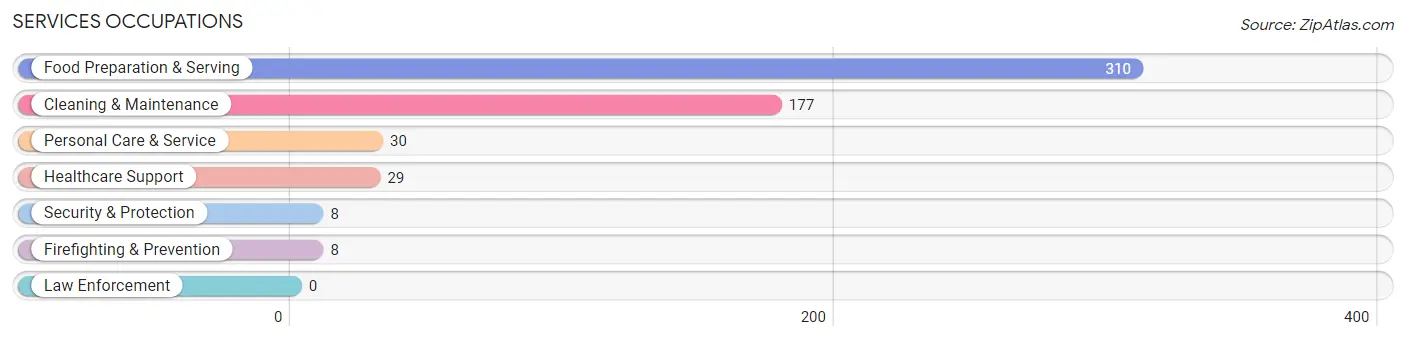
Services Occupations
The most common Services occupations in Waveland are Food Preparation & Serving (310 | 9.1%), Cleaning & Maintenance (177 | 5.2%), Personal Care & Service (30 | 0.9%), Healthcare Support (29 | 0.9%), and Security & Protection (8 | 0.2%).
Services Occupations by Sex
Within the Services occupations in Waveland, the most male-oriented occupations are Security & Protection (100.0%), Firefighting & Prevention (100.0%), and Food Preparation & Serving (87.4%), while the most female-oriented occupations are Healthcare Support (100.0%), Personal Care & Service (100.0%), and Cleaning & Maintenance (76.3%).
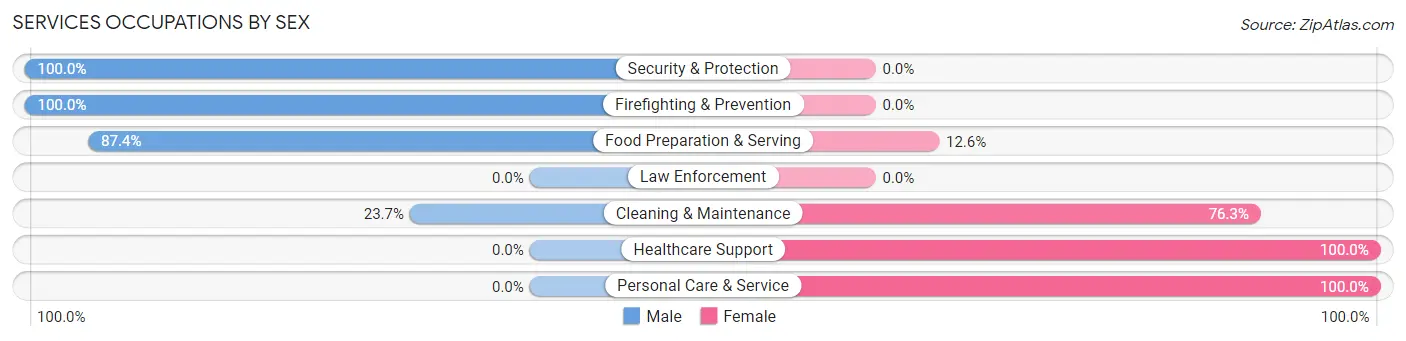
| Occupation | Male | Female |
| Healthcare Support | 0 (0.0%) | 29 (100.0%) |
| Security & Protection | 8 (100.0%) | 0 (0.0%) |
| Firefighting & Prevention | 8 (100.0%) | 0 (0.0%) |
| Law Enforcement | 0 (0.0%) | 0 (0.0%) |
| Food Preparation & Serving | 271 (87.4%) | 39 (12.6%) |
| Cleaning & Maintenance | 42 (23.7%) | 135 (76.3%) |
| Personal Care & Service | 0 (0.0%) | 30 (100.0%) |
| Total (Category) | 321 (57.9%) | 233 (42.1%) |
| Total (Overall) | 1,804 (53.0%) | 1,602 (47.0%) |
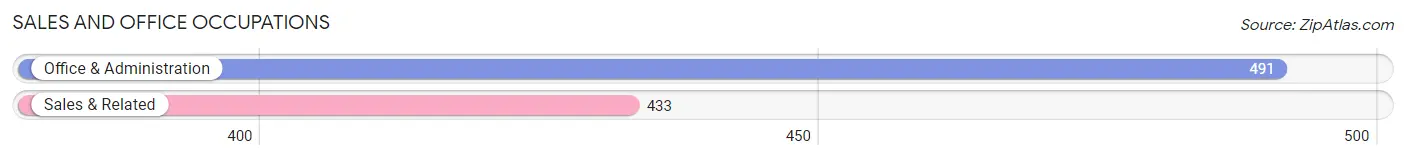
Sales and Office Occupations
The most common Sales and Office occupations in Waveland are Office & Administration (491 | 14.4%), and Sales & Related (433 | 12.7%).
Sales and Office Occupations by Sex
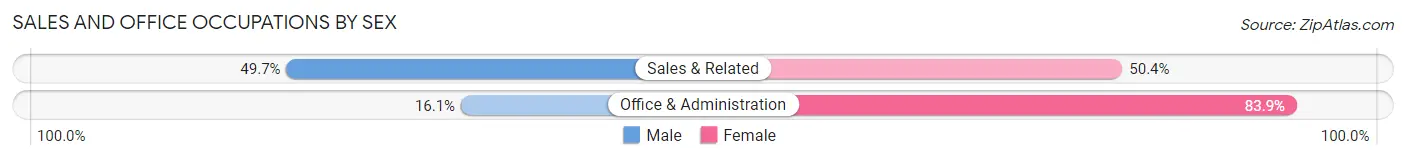
| Occupation | Male | Female |
| Sales & Related | 215 (49.6%) | 218 (50.3%) |
| Office & Administration | 79 (16.1%) | 412 (83.9%) |
| Total (Category) | 294 (31.8%) | 630 (68.2%) |
| Total (Overall) | 1,804 (53.0%) | 1,602 (47.0%) |
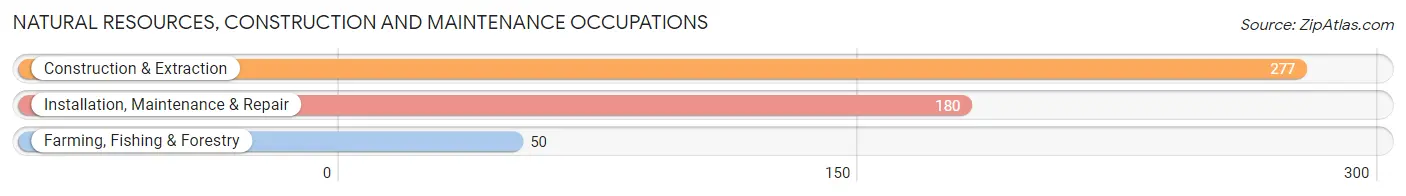
Natural Resources, Construction and Maintenance Occupations
The most common Natural Resources, Construction and Maintenance occupations in Waveland are Construction & Extraction (277 | 8.1%), Installation, Maintenance & Repair (180 | 5.3%), and Farming, Fishing & Forestry (50 | 1.5%).
Natural Resources, Construction and Maintenance Occupations by Sex
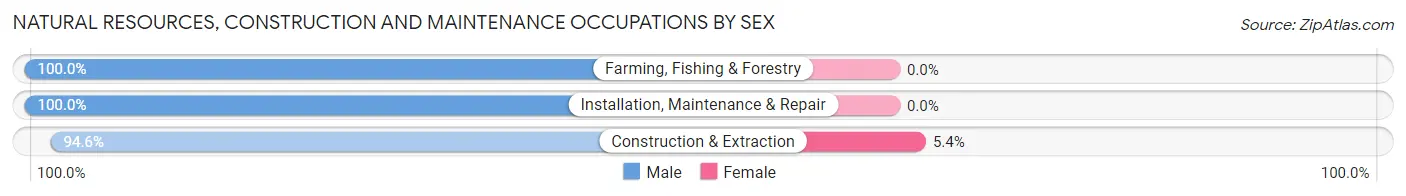
| Occupation | Male | Female |
| Farming, Fishing & Forestry | 50 (100.0%) | 0 (0.0%) |
| Construction & Extraction | 262 (94.6%) | 15 (5.4%) |
| Installation, Maintenance & Repair | 180 (100.0%) | 0 (0.0%) |
| Total (Category) | 492 (97.0%) | 15 (3.0%) |
| Total (Overall) | 1,804 (53.0%) | 1,602 (47.0%) |
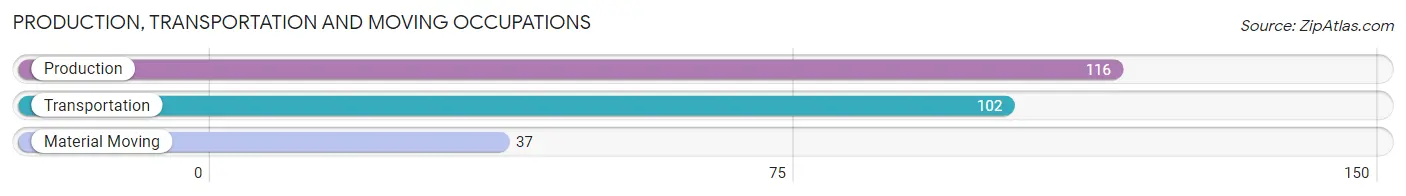
Production, Transportation and Moving Occupations
The most common Production, Transportation and Moving occupations in Waveland are Production (116 | 3.4%), Transportation (102 | 3.0%), and Material Moving (37 | 1.1%).
Production, Transportation and Moving Occupations by Sex
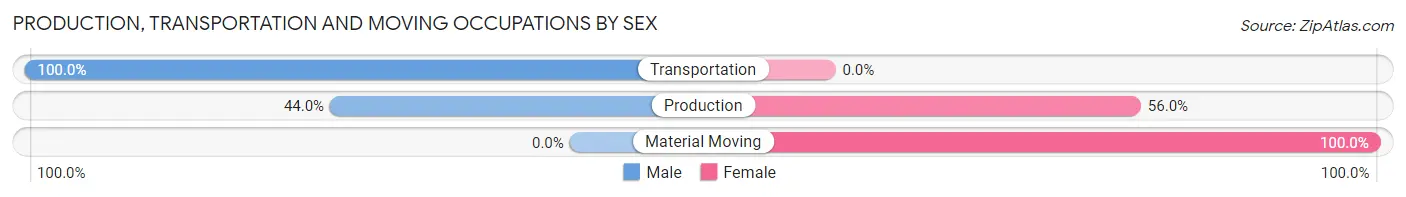
| Occupation | Male | Female |
| Production | 51 (44.0%) | 65 (56.0%) |
| Transportation | 102 (100.0%) | 0 (0.0%) |
| Material Moving | 0 (0.0%) | 37 (100.0%) |
| Total (Category) | 153 (60.0%) | 102 (40.0%) |
| Total (Overall) | 1,804 (53.0%) | 1,602 (47.0%) |
Employment Industries by Sex in Waveland
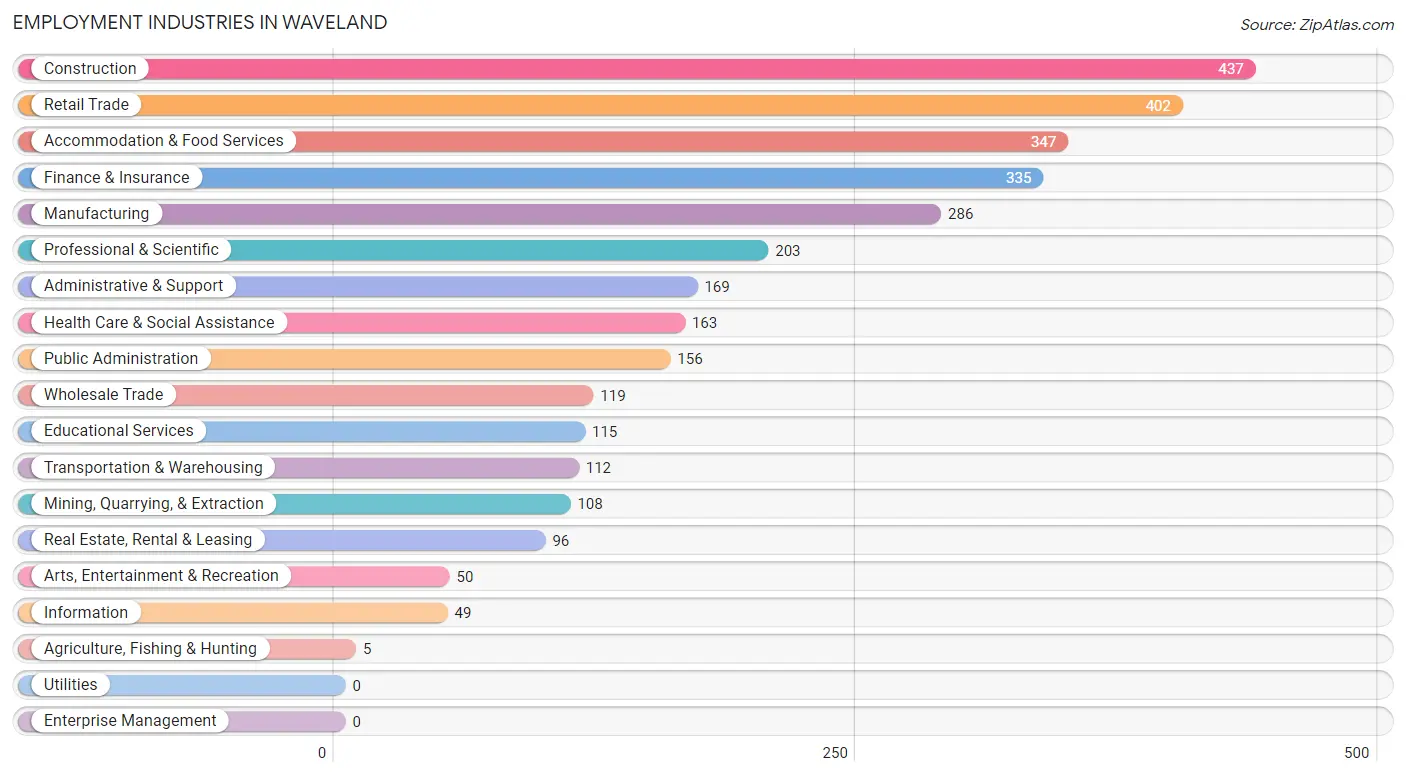
Employment Industries in Waveland
The major employment industries in Waveland include Construction (437 | 12.8%), Retail Trade (402 | 11.8%), Accommodation & Food Services (347 | 10.2%), Finance & Insurance (335 | 9.8%), and Manufacturing (286 | 8.4%).
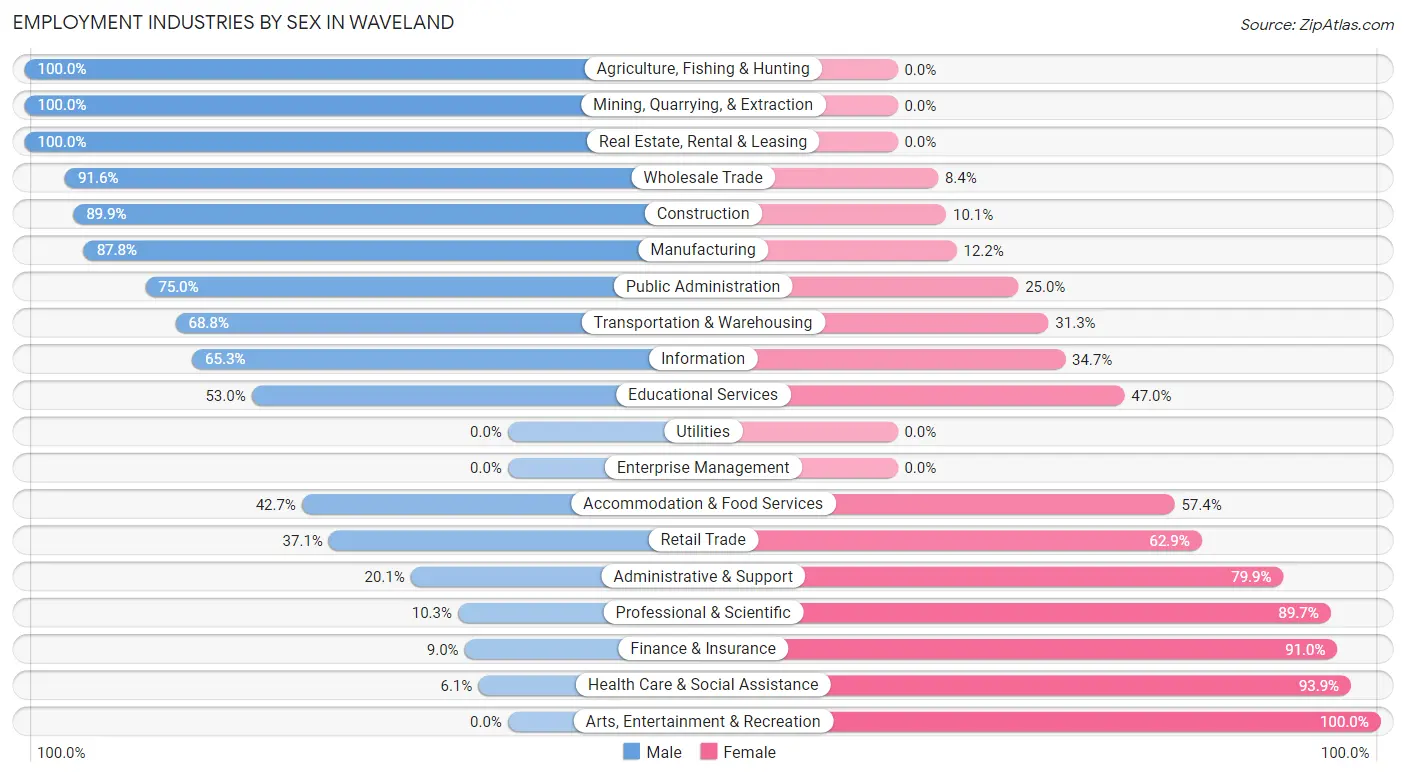
Employment Industries by Sex in Waveland
The Waveland industries that see more men than women are Agriculture, Fishing & Hunting (100.0%), Mining, Quarrying, & Extraction (100.0%), and Real Estate, Rental & Leasing (100.0%), whereas the industries that tend to have a higher number of women are Arts, Entertainment & Recreation (100.0%), Health Care & Social Assistance (93.9%), and Finance & Insurance (91.0%).
| Industry | Male | Female |
| Agriculture, Fishing & Hunting | 5 (100.0%) | 0 (0.0%) |
| Mining, Quarrying, & Extraction | 108 (100.0%) | 0 (0.0%) |
| Construction | 393 (89.9%) | 44 (10.1%) |
| Manufacturing | 251 (87.8%) | 35 (12.2%) |
| Wholesale Trade | 109 (91.6%) | 10 (8.4%) |
| Retail Trade | 149 (37.1%) | 253 (62.9%) |
| Transportation & Warehousing | 77 (68.8%) | 35 (31.2%) |
| Utilities | 0 (0.0%) | 0 (0.0%) |
| Information | 32 (65.3%) | 17 (34.7%) |
| Finance & Insurance | 30 (9.0%) | 305 (91.0%) |
| Real Estate, Rental & Leasing | 96 (100.0%) | 0 (0.0%) |
| Professional & Scientific | 21 (10.3%) | 182 (89.7%) |
| Enterprise Management | 0 (0.0%) | 0 (0.0%) |
| Administrative & Support | 34 (20.1%) | 135 (79.9%) |
| Educational Services | 61 (53.0%) | 54 (47.0%) |
| Health Care & Social Assistance | 10 (6.1%) | 153 (93.9%) |
| Arts, Entertainment & Recreation | 0 (0.0%) | 50 (100.0%) |
| Accommodation & Food Services | 148 (42.6%) | 199 (57.4%) |
| Public Administration | 117 (75.0%) | 39 (25.0%) |
| Total | 1,804 (53.0%) | 1,602 (47.0%) |
Education in Waveland
School Enrollment in Waveland
The most common levels of schooling among the 1,265 students in Waveland are high school (583 | 46.1%), elementary school (298 | 23.6%), and middle school (152 | 12.0%).
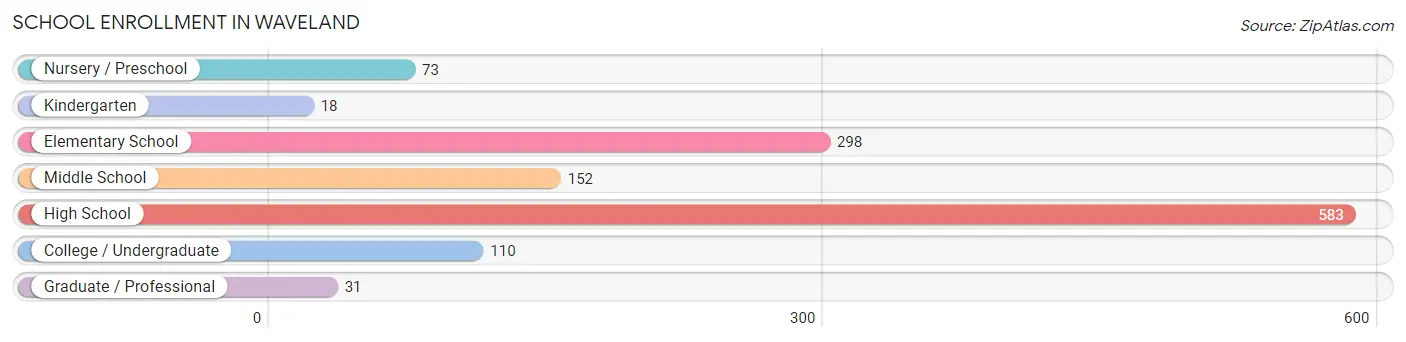
| School Level | # Students | % Students |
| Nursery / Preschool | 73 | 5.8% |
| Kindergarten | 18 | 1.4% |
| Elementary School | 298 | 23.6% |
| Middle School | 152 | 12.0% |
| High School | 583 | 46.1% |
| College / Undergraduate | 110 | 8.7% |
| Graduate / Professional | 31 | 2.5% |
| Total | 1,265 | 100.0% |
School Enrollment by Age by Funding Source in Waveland
Out of a total of 1,265 students who are enrolled in schools in Waveland, 438 (34.6%) attend a private institution, while the remaining 827 (65.4%) are enrolled in public schools. The age group of 35 years and over has the highest likelihood of being enrolled in private schools, with 40 (58.0% in the age bracket) enrolled. Conversely, the age group of 18 to 19 year olds has the lowest likelihood of being enrolled in a private school, with 59 (100.0% in the age bracket) attending a public institution.
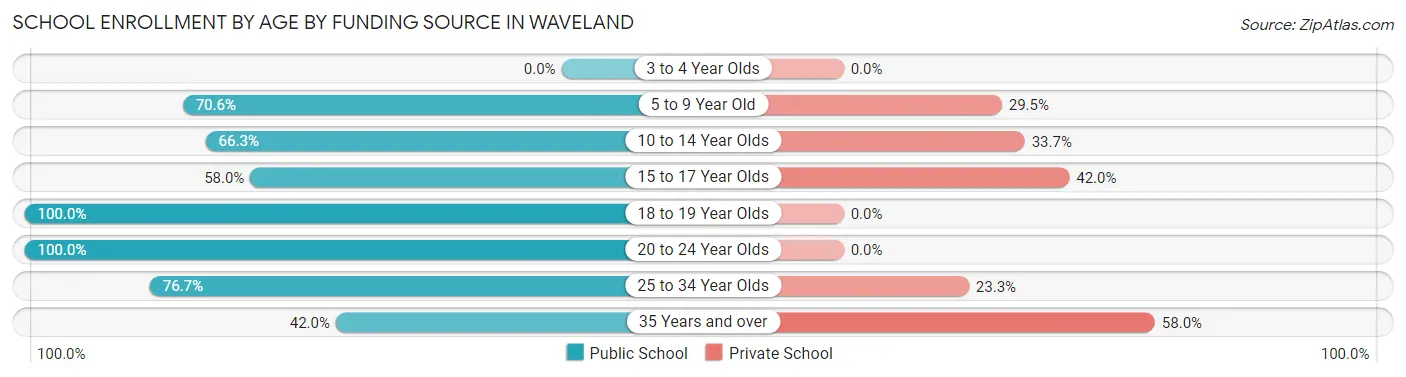
| Age Bracket | Public School | Private School |
| 3 to 4 Year Olds | 0 (0.0%) | 0 (0.0%) |
| 5 to 9 Year Old | 218 (70.6%) | 91 (29.4%) |
| 10 to 14 Year Olds | 222 (66.3%) | 113 (33.7%) |
| 15 to 17 Year Olds | 258 (58.0%) | 187 (42.0%) |
| 18 to 19 Year Olds | 59 (100.0%) | 0 (0.0%) |
| 20 to 24 Year Olds | 18 (100.0%) | 0 (0.0%) |
| 25 to 34 Year Olds | 23 (76.7%) | 7 (23.3%) |
| 35 Years and over | 29 (42.0%) | 40 (58.0%) |
| Total | 827 (65.4%) | 438 (34.6%) |
Educational Attainment by Field of Study in Waveland
Business (266 | 22.1%), physical & health sciences (149 | 12.4%), education (120 | 10.0%), arts & humanities (115 | 9.6%), and literature & languages (112 | 9.3%) are the most common fields of study among 1,204 individuals in Waveland who have obtained a bachelor's degree or higher.
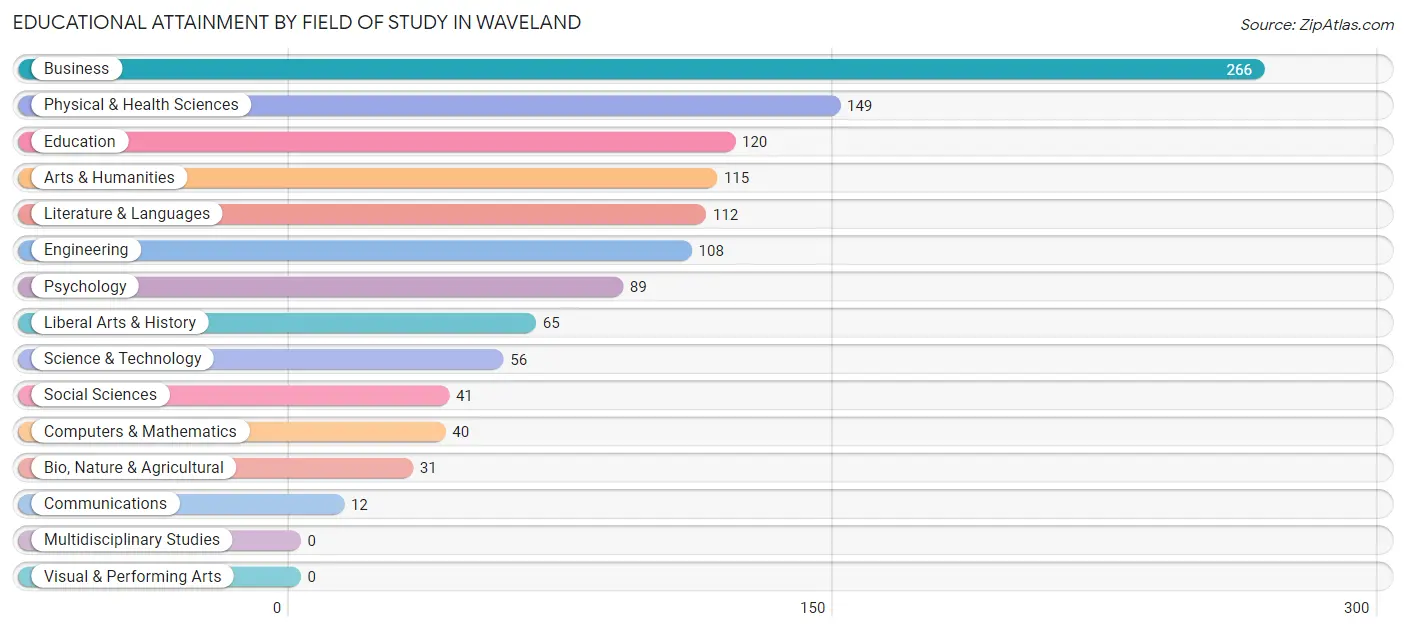
| Field of Study | # Graduates | % Graduates |
| Computers & Mathematics | 40 | 3.3% |
| Bio, Nature & Agricultural | 31 | 2.6% |
| Physical & Health Sciences | 149 | 12.4% |
| Psychology | 89 | 7.4% |
| Social Sciences | 41 | 3.4% |
| Engineering | 108 | 9.0% |
| Multidisciplinary Studies | 0 | 0.0% |
| Science & Technology | 56 | 4.6% |
| Business | 266 | 22.1% |
| Education | 120 | 10.0% |
| Literature & Languages | 112 | 9.3% |
| Liberal Arts & History | 65 | 5.4% |
| Visual & Performing Arts | 0 | 0.0% |
| Communications | 12 | 1.0% |
| Arts & Humanities | 115 | 9.6% |
| Total | 1,204 | 100.0% |
Transportation & Commute in Waveland
Vehicle Availability by Sex in Waveland
The most prevalent vehicle ownership categories in Waveland are males with 2 vehicles (1,025, accounting for 56.2%) and females with 2 vehicles (697, making up 66.1%).
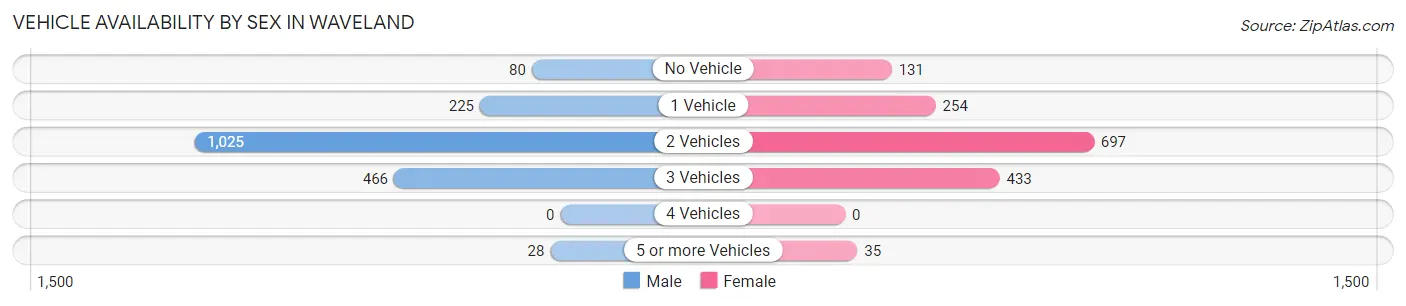
| Vehicles Available | Male | Female |
| No Vehicle | 80 (4.4%) | 131 (8.5%) |
| 1 Vehicle | 225 (12.3%) | 254 (16.4%) |
| 2 Vehicles | 1,025 (56.2%) | 697 (45.0%) |
| 3 Vehicles | 466 (25.6%) | 433 (27.9%) |
| 4 Vehicles | 0 (0.0%) | 0 (0.0%) |
| 5 or more Vehicles | 28 (1.5%) | 35 (2.3%) |
| Total | 1,824 (100.0%) | 1,550 (100.0%) |
Commute Time in Waveland
The most frequently occuring commute durations in Waveland are 10 to 14 minutes (639 commuters, 20.3%), 15 to 19 minutes (616 commuters, 19.6%), and 5 to 9 minutes (309 commuters, 9.8%).
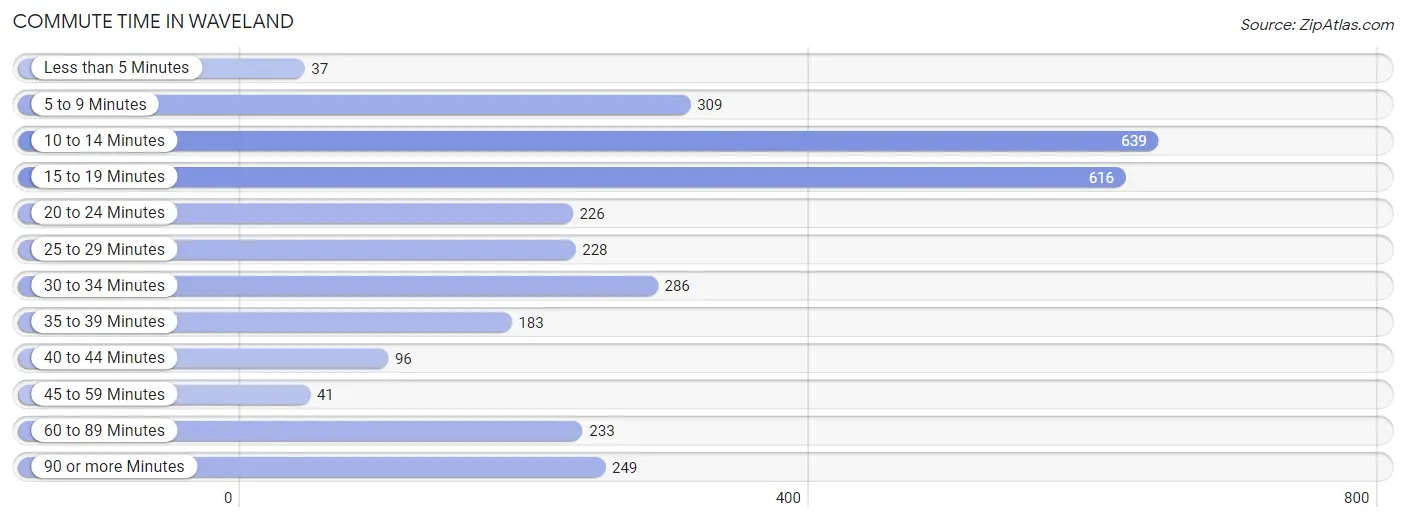
| Commute Time | # Commuters | % Commuters |
| Less than 5 Minutes | 37 | 1.2% |
| 5 to 9 Minutes | 309 | 9.8% |
| 10 to 14 Minutes | 639 | 20.3% |
| 15 to 19 Minutes | 616 | 19.6% |
| 20 to 24 Minutes | 226 | 7.2% |
| 25 to 29 Minutes | 228 | 7.2% |
| 30 to 34 Minutes | 286 | 9.1% |
| 35 to 39 Minutes | 183 | 5.8% |
| 40 to 44 Minutes | 96 | 3.0% |
| 45 to 59 Minutes | 41 | 1.3% |
| 60 to 89 Minutes | 233 | 7.4% |
| 90 or more Minutes | 249 | 7.9% |
Commute Time by Sex in Waveland
The most common commute times in Waveland are 10 to 14 minutes (521 commuters, 30.0%) for males and 15 to 19 minutes (275 commuters, 19.5%) for females.
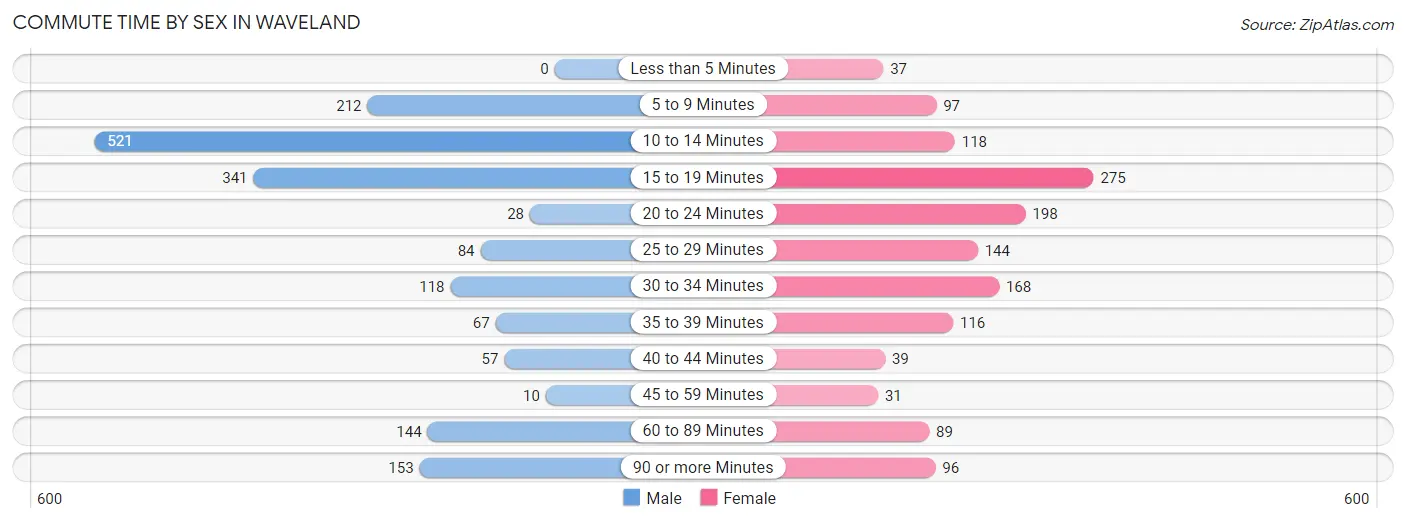
| Commute Time | Male | Female |
| Less than 5 Minutes | 0 (0.0%) | 37 (2.6%) |
| 5 to 9 Minutes | 212 (12.2%) | 97 (6.9%) |
| 10 to 14 Minutes | 521 (30.0%) | 118 (8.4%) |
| 15 to 19 Minutes | 341 (19.7%) | 275 (19.5%) |
| 20 to 24 Minutes | 28 (1.6%) | 198 (14.1%) |
| 25 to 29 Minutes | 84 (4.8%) | 144 (10.2%) |
| 30 to 34 Minutes | 118 (6.8%) | 168 (11.9%) |
| 35 to 39 Minutes | 67 (3.9%) | 116 (8.2%) |
| 40 to 44 Minutes | 57 (3.3%) | 39 (2.8%) |
| 45 to 59 Minutes | 10 (0.6%) | 31 (2.2%) |
| 60 to 89 Minutes | 144 (8.3%) | 89 (6.3%) |
| 90 or more Minutes | 153 (8.8%) | 96 (6.8%) |
Time of Departure to Work by Sex in Waveland
The most frequent times of departure to work in Waveland are 7:30 AM to 7:59 AM (325, 18.7%) for males and 7:30 AM to 7:59 AM (404, 28.7%) for females.
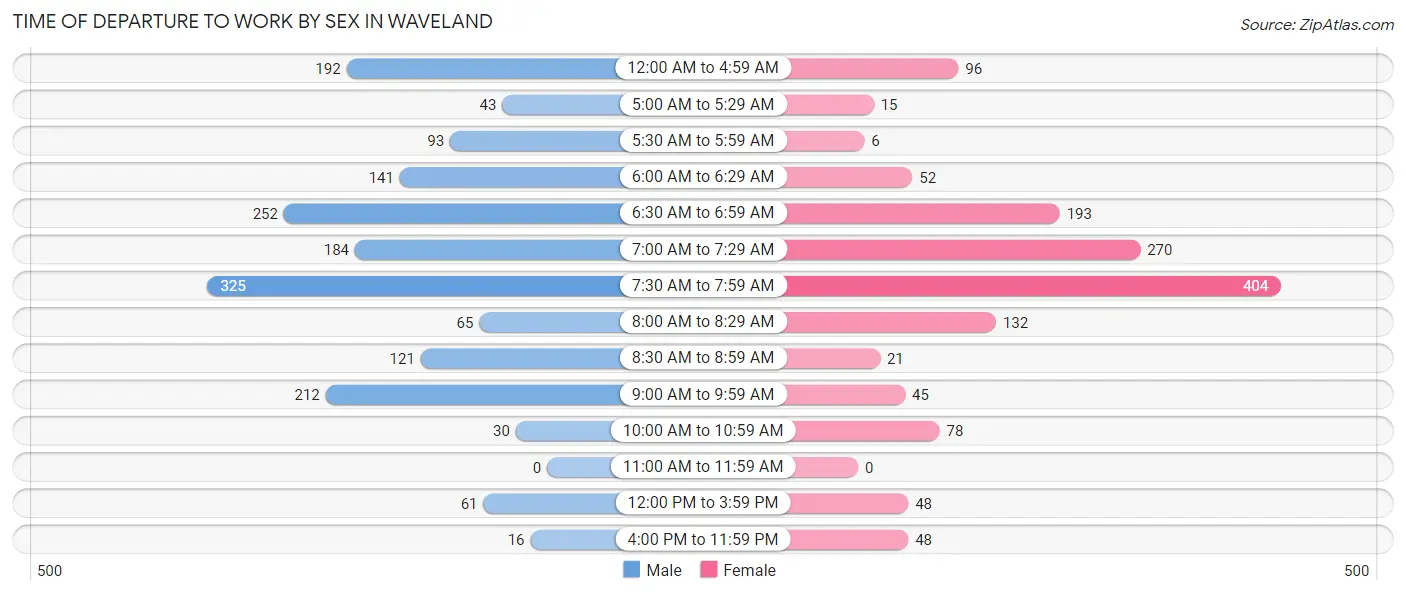
| Time of Departure | Male | Female |
| 12:00 AM to 4:59 AM | 192 (11.1%) | 96 (6.8%) |
| 5:00 AM to 5:29 AM | 43 (2.5%) | 15 (1.1%) |
| 5:30 AM to 5:59 AM | 93 (5.4%) | 6 (0.4%) |
| 6:00 AM to 6:29 AM | 141 (8.1%) | 52 (3.7%) |
| 6:30 AM to 6:59 AM | 252 (14.5%) | 193 (13.7%) |
| 7:00 AM to 7:29 AM | 184 (10.6%) | 270 (19.2%) |
| 7:30 AM to 7:59 AM | 325 (18.7%) | 404 (28.7%) |
| 8:00 AM to 8:29 AM | 65 (3.7%) | 132 (9.4%) |
| 8:30 AM to 8:59 AM | 121 (7.0%) | 21 (1.5%) |
| 9:00 AM to 9:59 AM | 212 (12.2%) | 45 (3.2%) |
| 10:00 AM to 10:59 AM | 30 (1.7%) | 78 (5.5%) |
| 11:00 AM to 11:59 AM | 0 (0.0%) | 0 (0.0%) |
| 12:00 PM to 3:59 PM | 61 (3.5%) | 48 (3.4%) |
| 4:00 PM to 11:59 PM | 16 (0.9%) | 48 (3.4%) |
| Total | 1,735 (100.0%) | 1,408 (100.0%) |
Housing Occupancy in Waveland
Occupancy by Ownership in Waveland
Of the total 2,989 dwellings in Waveland, owner-occupied units account for 2,007 (67.1%), while renter-occupied units make up 982 (32.9%).
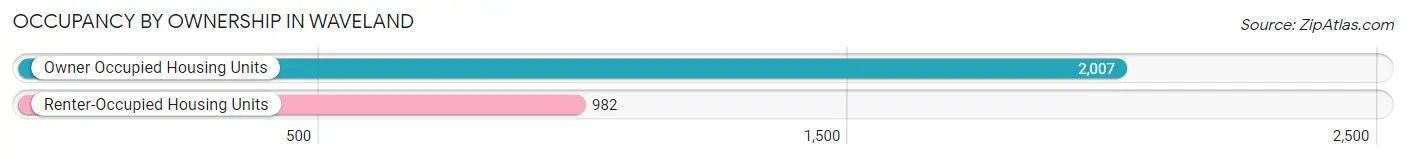
| Occupancy | # Housing Units | % Housing Units |
| Owner Occupied Housing Units | 2,007 | 67.1% |
| Renter-Occupied Housing Units | 982 | 32.9% |
| Total Occupied Housing Units | 2,989 | 100.0% |
Occupancy by Household Size in Waveland
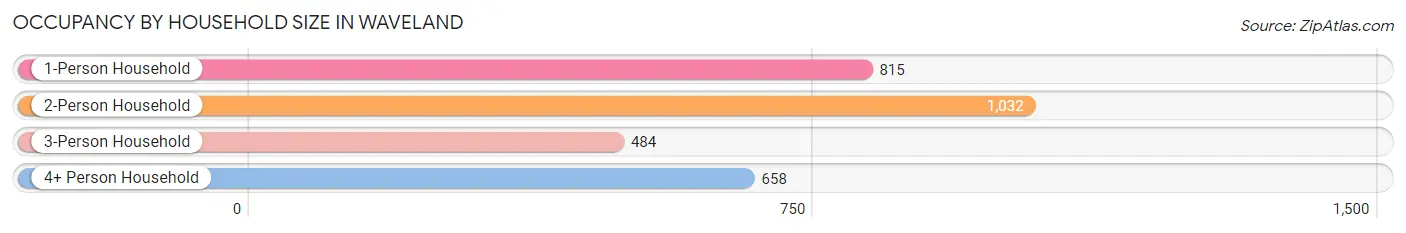
| Household Size | # Housing Units | % Housing Units |
| 1-Person Household | 815 | 27.3% |
| 2-Person Household | 1,032 | 34.5% |
| 3-Person Household | 484 | 16.2% |
| 4+ Person Household | 658 | 22.0% |
| Total Housing Units | 2,989 | 100.0% |
Occupancy by Ownership by Household Size in Waveland
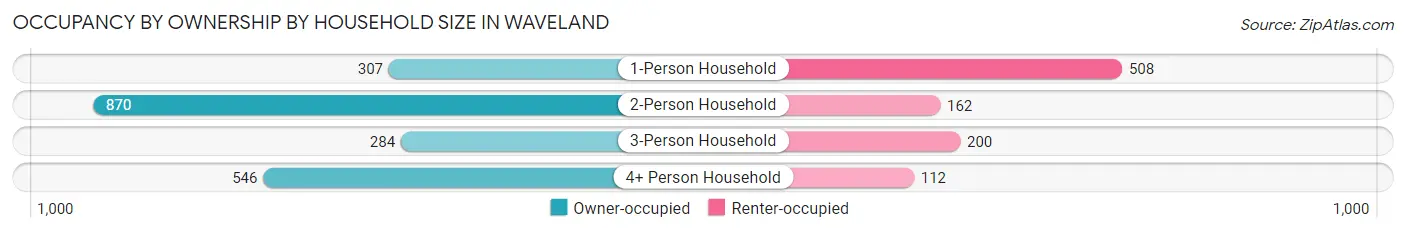
| Household Size | Owner-occupied | Renter-occupied |
| 1-Person Household | 307 (37.7%) | 508 (62.3%) |
| 2-Person Household | 870 (84.3%) | 162 (15.7%) |
| 3-Person Household | 284 (58.7%) | 200 (41.3%) |
| 4+ Person Household | 546 (83.0%) | 112 (17.0%) |
| Total Housing Units | 2,007 (67.1%) | 982 (32.9%) |
Occupancy by Educational Attainment in Waveland
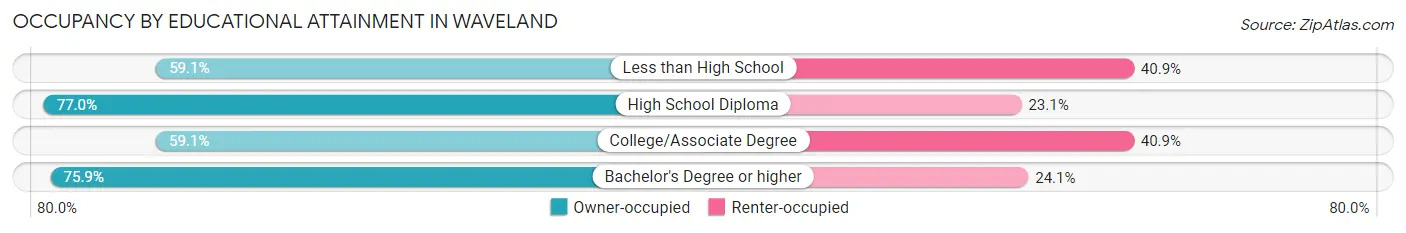
| Household Size | Owner-occupied | Renter-occupied |
| Less than High School | 201 (59.1%) | 139 (40.9%) |
| High School Diploma | 474 (76.9%) | 142 (23.1%) |
| College/Associate Degree | 744 (59.1%) | 514 (40.9%) |
| Bachelor's Degree or higher | 588 (75.9%) | 187 (24.1%) |
Occupancy by Age of Householder in Waveland
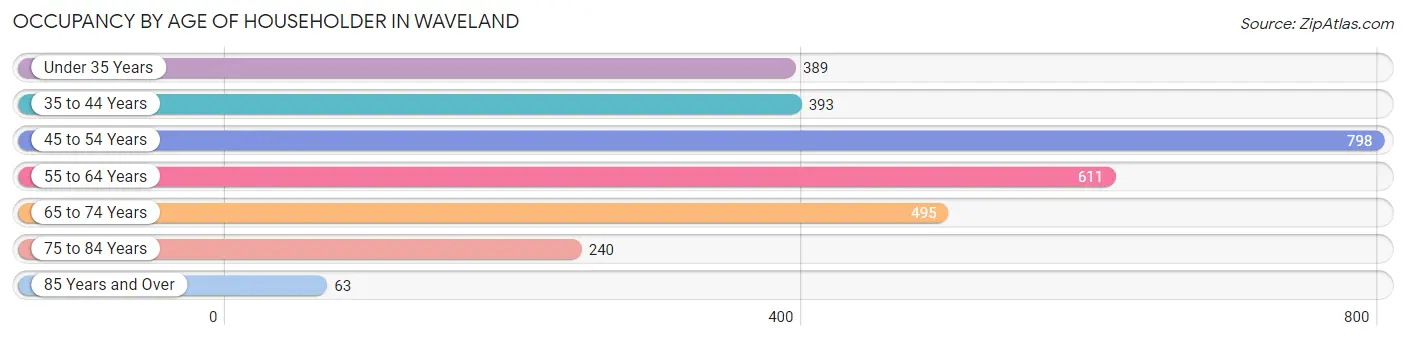
| Age Bracket | # Households | % Households |
| Under 35 Years | 389 | 13.0% |
| 35 to 44 Years | 393 | 13.2% |
| 45 to 54 Years | 798 | 26.7% |
| 55 to 64 Years | 611 | 20.4% |
| 65 to 74 Years | 495 | 16.6% |
| 75 to 84 Years | 240 | 8.0% |
| 85 Years and Over | 63 | 2.1% |
| Total | 2,989 | 100.0% |
Housing Finances in Waveland
Median Income by Occupancy in Waveland
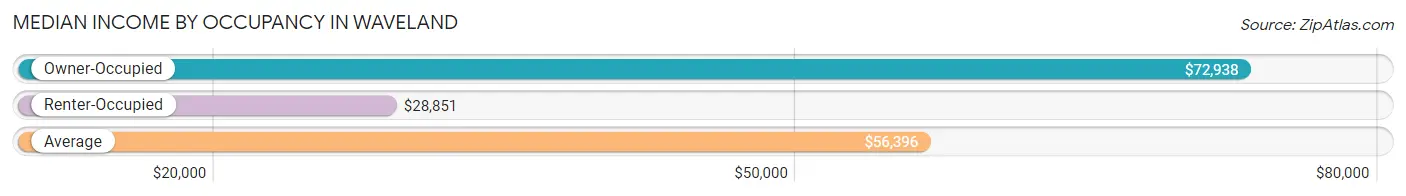
| Occupancy Type | # Households | Median Income |
| Owner-Occupied | 2,007 (67.1%) | $72,938 |
| Renter-Occupied | 982 (32.9%) | $28,851 |
| Average | 2,989 (100.0%) | $56,396 |
Occupancy by Householder Income Bracket in Waveland
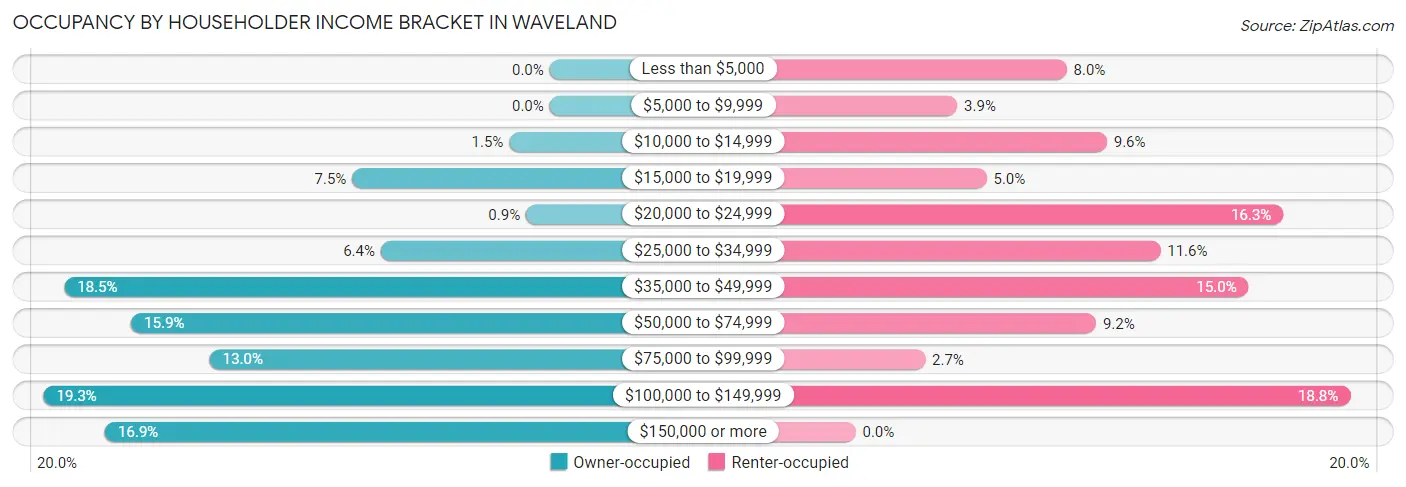
| Income Bracket | Owner-occupied | Renter-occupied |
| Less than $5,000 | 0 (0.0%) | 79 (8.0%) |
| $5,000 to $9,999 | 0 (0.0%) | 38 (3.9%) |
| $10,000 to $14,999 | 31 (1.5%) | 94 (9.6%) |
| $15,000 to $19,999 | 151 (7.5%) | 49 (5.0%) |
| $20,000 to $24,999 | 18 (0.9%) | 160 (16.3%) |
| $25,000 to $34,999 | 129 (6.4%) | 114 (11.6%) |
| $35,000 to $49,999 | 371 (18.5%) | 147 (15.0%) |
| $50,000 to $74,999 | 320 (15.9%) | 90 (9.2%) |
| $75,000 to $99,999 | 260 (13.0%) | 26 (2.6%) |
| $100,000 to $149,999 | 387 (19.3%) | 185 (18.8%) |
| $150,000 or more | 340 (16.9%) | 0 (0.0%) |
| Total | 2,007 (100.0%) | 982 (100.0%) |
Monthly Housing Cost Tiers in Waveland
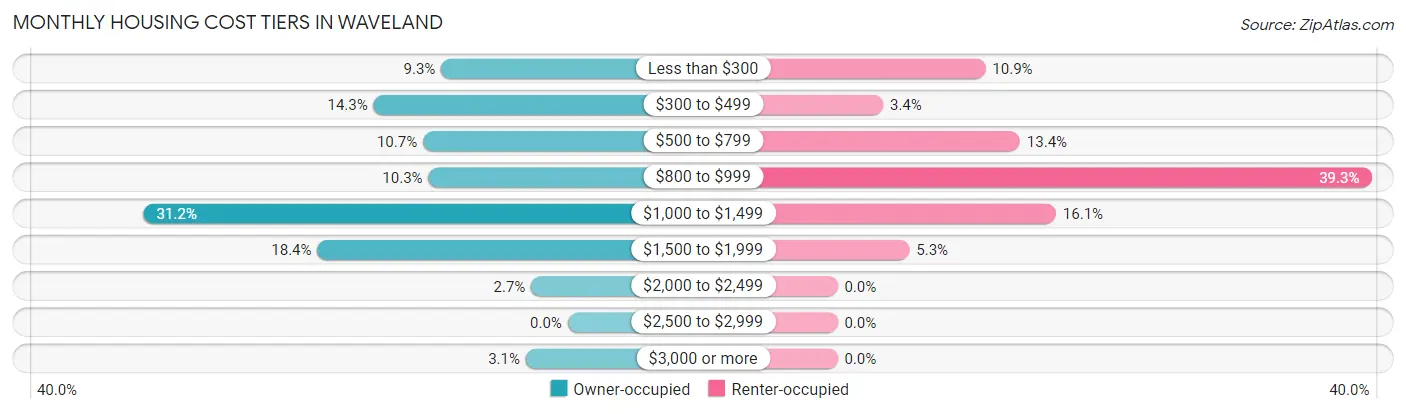
| Monthly Cost | Owner-occupied | Renter-occupied |
| Less than $300 | 187 (9.3%) | 107 (10.9%) |
| $300 to $499 | 287 (14.3%) | 33 (3.4%) |
| $500 to $799 | 214 (10.7%) | 132 (13.4%) |
| $800 to $999 | 206 (10.3%) | 386 (39.3%) |
| $1,000 to $1,499 | 627 (31.2%) | 158 (16.1%) |
| $1,500 to $1,999 | 370 (18.4%) | 52 (5.3%) |
| $2,000 to $2,499 | 54 (2.7%) | 0 (0.0%) |
| $2,500 to $2,999 | 0 (0.0%) | 0 (0.0%) |
| $3,000 or more | 62 (3.1%) | 0 (0.0%) |
| Total | 2,007 (100.0%) | 982 (100.0%) |
Physical Housing Characteristics in Waveland
Housing Structures in Waveland
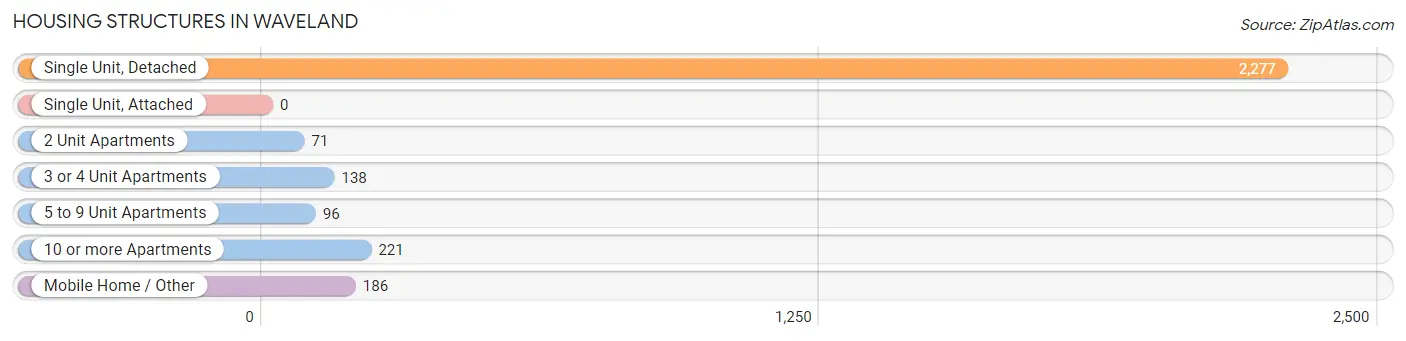
| Structure Type | # Housing Units | % Housing Units |
| Single Unit, Detached | 2,277 | 76.2% |
| Single Unit, Attached | 0 | 0.0% |
| 2 Unit Apartments | 71 | 2.4% |
| 3 or 4 Unit Apartments | 138 | 4.6% |
| 5 to 9 Unit Apartments | 96 | 3.2% |
| 10 or more Apartments | 221 | 7.4% |
| Mobile Home / Other | 186 | 6.2% |
| Total | 2,989 | 100.0% |
Housing Structures by Occupancy in Waveland
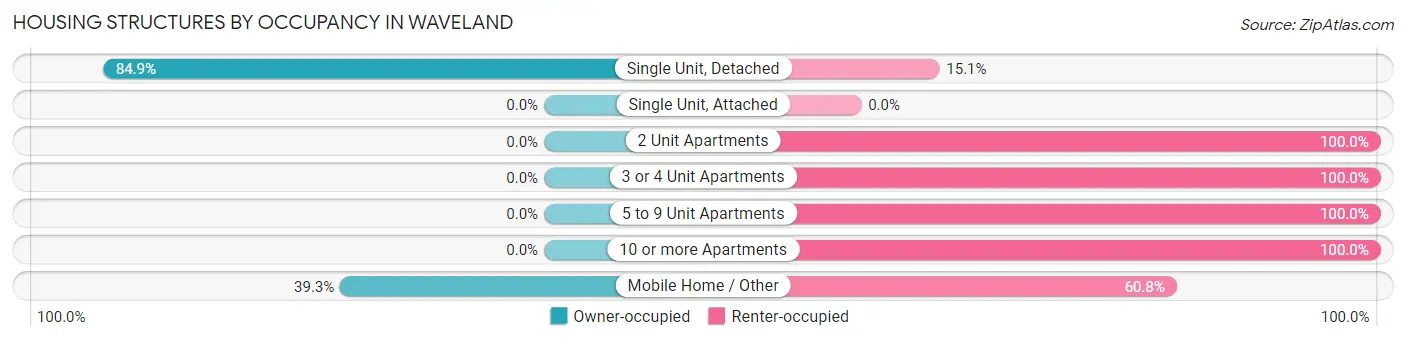
| Structure Type | Owner-occupied | Renter-occupied |
| Single Unit, Detached | 1,934 (84.9%) | 343 (15.1%) |
| Single Unit, Attached | 0 (0.0%) | 0 (0.0%) |
| 2 Unit Apartments | 0 (0.0%) | 71 (100.0%) |
| 3 or 4 Unit Apartments | 0 (0.0%) | 138 (100.0%) |
| 5 to 9 Unit Apartments | 0 (0.0%) | 96 (100.0%) |
| 10 or more Apartments | 0 (0.0%) | 221 (100.0%) |
| Mobile Home / Other | 73 (39.3%) | 113 (60.8%) |
| Total | 2,007 (67.1%) | 982 (32.9%) |
Housing Structures by Number of Rooms in Waveland
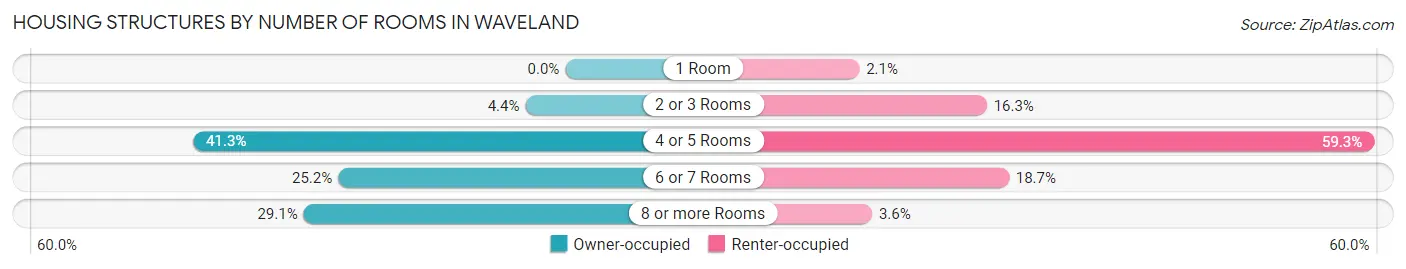
| Number of Rooms | Owner-occupied | Renter-occupied |
| 1 Room | 0 (0.0%) | 21 (2.1%) |
| 2 or 3 Rooms | 89 (4.4%) | 160 (16.3%) |
| 4 or 5 Rooms | 829 (41.3%) | 582 (59.3%) |
| 6 or 7 Rooms | 506 (25.2%) | 184 (18.7%) |
| 8 or more Rooms | 583 (29.0%) | 35 (3.6%) |
| Total | 2,007 (100.0%) | 982 (100.0%) |
Housing Structure by Heating Type in Waveland
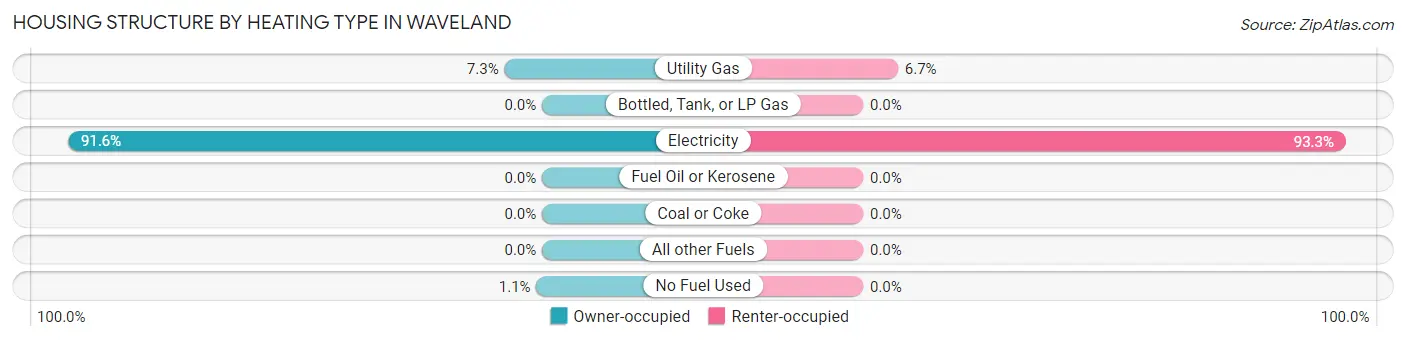
| Heating Type | Owner-occupied | Renter-occupied |
| Utility Gas | 146 (7.3%) | 66 (6.7%) |
| Bottled, Tank, or LP Gas | 0 (0.0%) | 0 (0.0%) |
| Electricity | 1,839 (91.6%) | 916 (93.3%) |
| Fuel Oil or Kerosene | 0 (0.0%) | 0 (0.0%) |
| Coal or Coke | 0 (0.0%) | 0 (0.0%) |
| All other Fuels | 0 (0.0%) | 0 (0.0%) |
| No Fuel Used | 22 (1.1%) | 0 (0.0%) |
| Total | 2,007 (100.0%) | 982 (100.0%) |
Household Vehicle Usage in Waveland
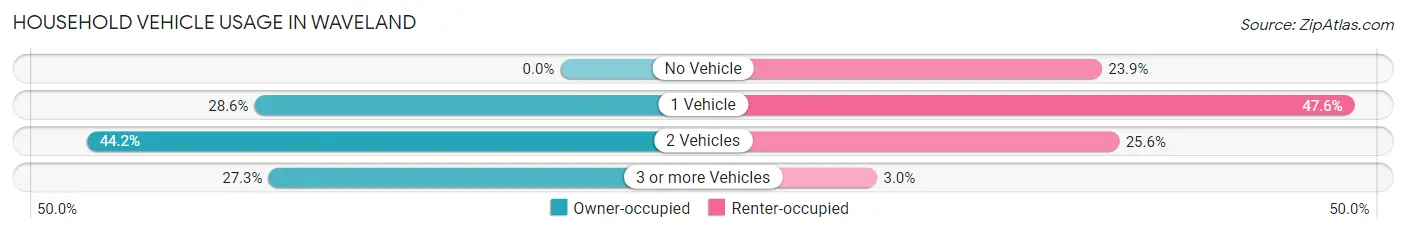
| Vehicles per Household | Owner-occupied | Renter-occupied |
| No Vehicle | 0 (0.0%) | 235 (23.9%) |
| 1 Vehicle | 573 (28.5%) | 467 (47.6%) |
| 2 Vehicles | 887 (44.2%) | 251 (25.6%) |
| 3 or more Vehicles | 547 (27.3%) | 29 (2.9%) |
| Total | 2,007 (100.0%) | 982 (100.0%) |
Real Estate & Mortgages in Waveland
Real Estate and Mortgage Overview in Waveland
| Characteristic | Without Mortgage | With Mortgage |
| Housing Units | 768 | 1,239 |
| Median Property Value | $178,800 | $197,500 |
| Median Household Income | $43,169 | $328 |
| Monthly Housing Costs | $433 | $62 |
| Real Estate Taxes | $1,598 | $121 |
Property Value by Mortgage Status in Waveland
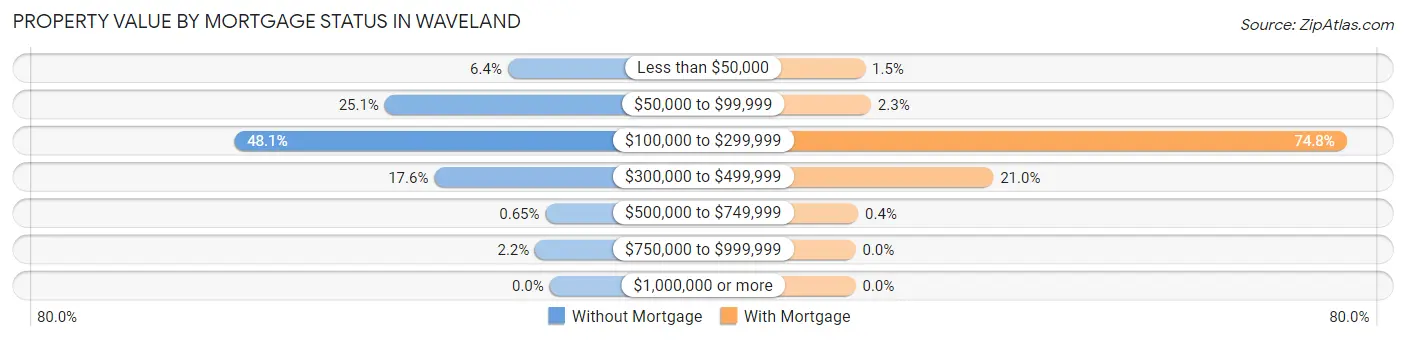
| Property Value | Without Mortgage | With Mortgage |
| Less than $50,000 | 49 (6.4%) | 18 (1.5%) |
| $50,000 to $99,999 | 193 (25.1%) | 29 (2.3%) |
| $100,000 to $299,999 | 369 (48.0%) | 927 (74.8%) |
| $300,000 to $499,999 | 135 (17.6%) | 260 (21.0%) |
| $500,000 to $749,999 | 5 (0.6%) | 5 (0.4%) |
| $750,000 to $999,999 | 17 (2.2%) | 0 (0.0%) |
| $1,000,000 or more | 0 (0.0%) | 0 (0.0%) |
| Total | 768 (100.0%) | 1,239 (100.0%) |
Household Income by Mortgage Status in Waveland
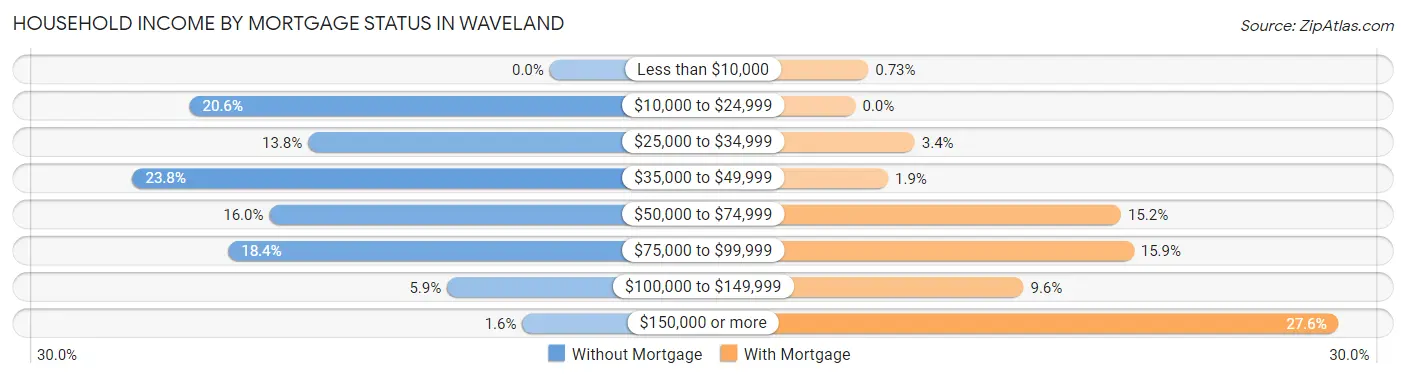
| Household Income | Without Mortgage | With Mortgage |
| Less than $10,000 | 0 (0.0%) | 9 (0.7%) |
| $10,000 to $24,999 | 158 (20.6%) | 0 (0.0%) |
| $25,000 to $34,999 | 106 (13.8%) | 42 (3.4%) |
| $35,000 to $49,999 | 183 (23.8%) | 23 (1.9%) |
| $50,000 to $74,999 | 123 (16.0%) | 188 (15.2%) |
| $75,000 to $99,999 | 141 (18.4%) | 197 (15.9%) |
| $100,000 to $149,999 | 45 (5.9%) | 119 (9.6%) |
| $150,000 or more | 12 (1.6%) | 342 (27.6%) |
| Total | 768 (100.0%) | 1,239 (100.0%) |
Property Value to Household Income Ratio in Waveland
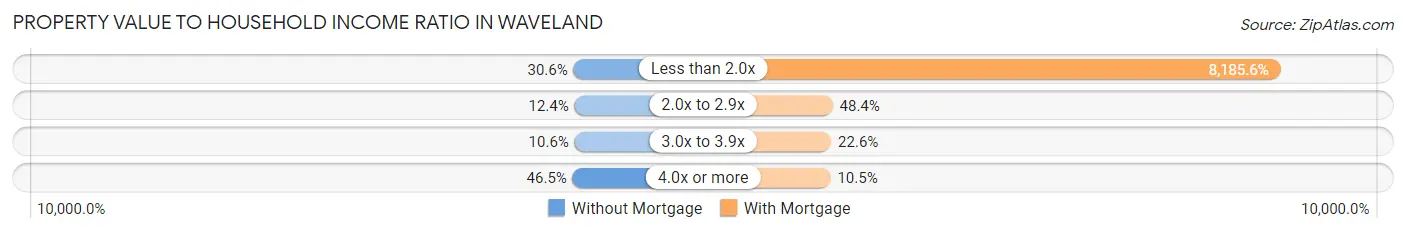
| Value-to-Income Ratio | Without Mortgage | With Mortgage |
| Less than 2.0x | 235 (30.6%) | 101,419 (8,185.6%) |
| 2.0x to 2.9x | 95 (12.4%) | 600 (48.4%) |
| 3.0x to 3.9x | 81 (10.5%) | 280 (22.6%) |
| 4.0x or more | 357 (46.5%) | 130 (10.5%) |
| Total | 768 (100.0%) | 1,239 (100.0%) |
Real Estate Taxes by Mortgage Status in Waveland
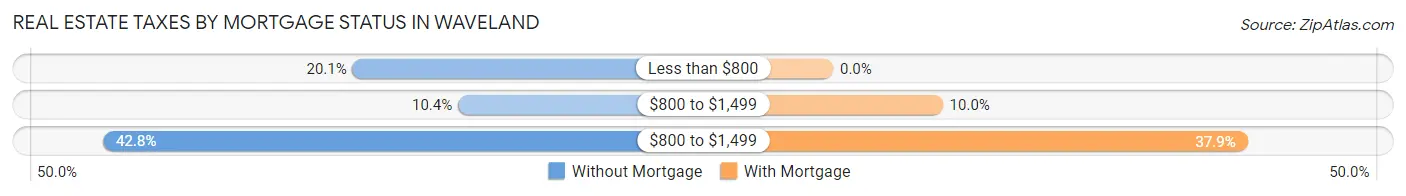
| Property Taxes | Without Mortgage | With Mortgage |
| Less than $800 | 154 (20.1%) | 0 (0.0%) |
| $800 to $1,499 | 80 (10.4%) | 124 (10.0%) |
| $800 to $1,499 | 329 (42.8%) | 469 (37.9%) |
| Total | 768 (100.0%) | 1,239 (100.0%) |
Health & Disability in Waveland
Health Insurance Coverage by Age in Waveland
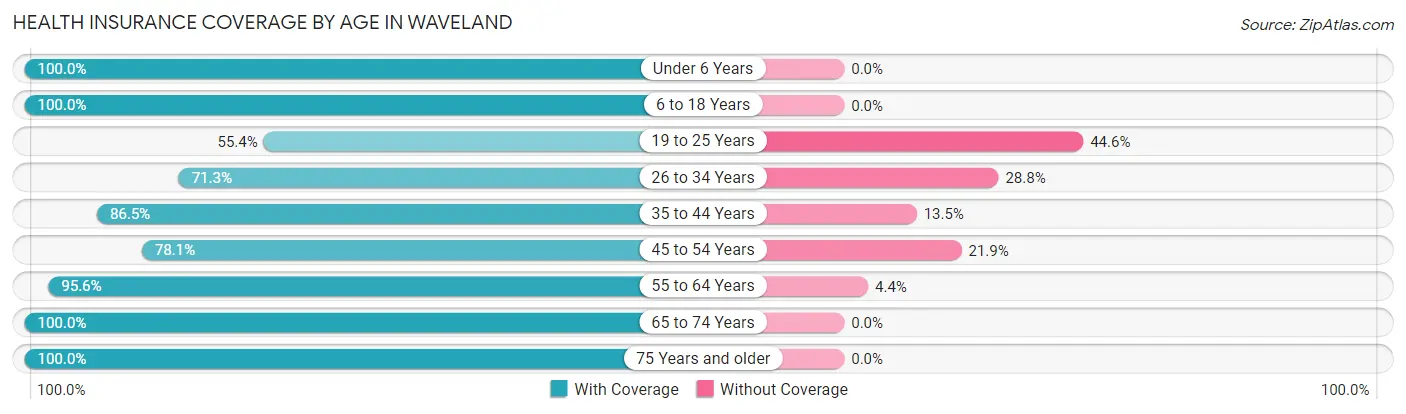
| Age Bracket | With Coverage | Without Coverage |
| Under 6 Years | 440 (100.0%) | 0 (0.0%) |
| 6 to 18 Years | 1,221 (100.0%) | 0 (0.0%) |
| 19 to 25 Years | 163 (55.4%) | 131 (44.6%) |
| 26 to 34 Years | 617 (71.3%) | 249 (28.7%) |
| 35 to 44 Years | 647 (86.5%) | 101 (13.5%) |
| 45 to 54 Years | 1,058 (78.1%) | 296 (21.9%) |
| 55 to 64 Years | 818 (95.6%) | 38 (4.4%) |
| 65 to 74 Years | 829 (100.0%) | 0 (0.0%) |
| 75 Years and older | 447 (100.0%) | 0 (0.0%) |
| Total | 6,240 (88.4%) | 815 (11.6%) |
Health Insurance Coverage by Citizenship Status in Waveland
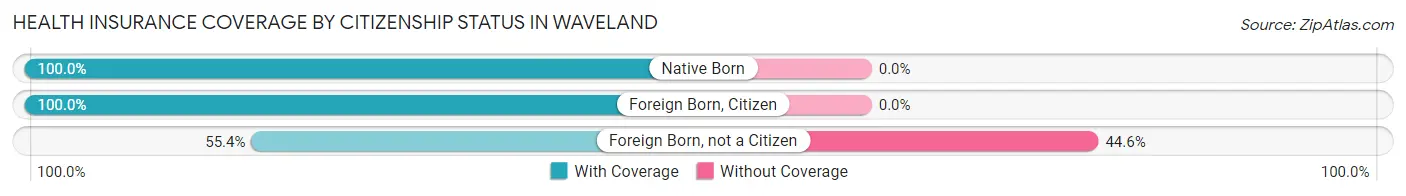
| Citizenship Status | With Coverage | Without Coverage |
| Native Born | 440 (100.0%) | 0 (0.0%) |
| Foreign Born, Citizen | 1,221 (100.0%) | 0 (0.0%) |
| Foreign Born, not a Citizen | 163 (55.4%) | 131 (44.6%) |
Health Insurance Coverage by Household Income in Waveland
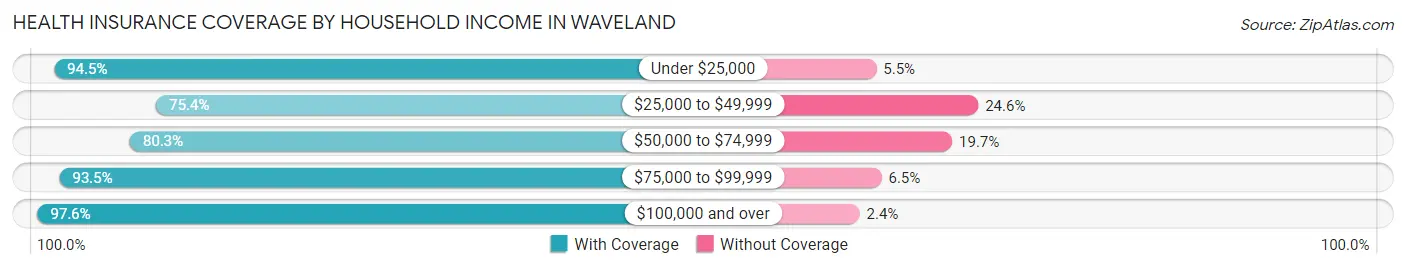
| Household Income | With Coverage | Without Coverage |
| Under $25,000 | 1,024 (94.5%) | 60 (5.5%) |
| $25,000 to $49,999 | 1,368 (75.4%) | 447 (24.6%) |
| $50,000 to $74,999 | 830 (80.3%) | 204 (19.7%) |
| $75,000 to $99,999 | 661 (93.5%) | 46 (6.5%) |
| $100,000 and over | 2,357 (97.6%) | 58 (2.4%) |
Public vs Private Health Insurance Coverage by Age in Waveland
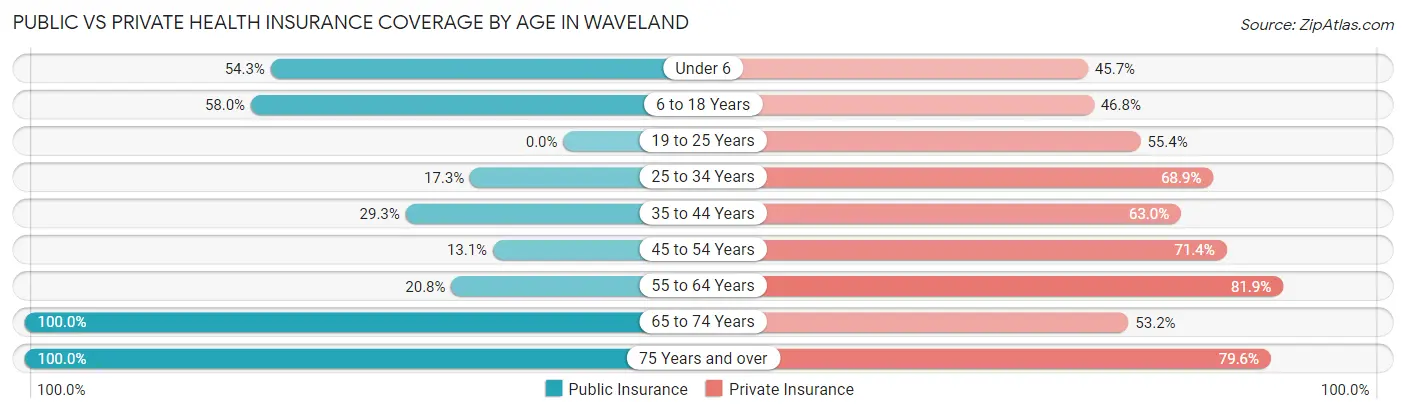
| Age Bracket | Public Insurance | Private Insurance |
| Under 6 | 239 (54.3%) | 201 (45.7%) |
| 6 to 18 Years | 708 (58.0%) | 571 (46.8%) |
| 19 to 25 Years | 0 (0.0%) | 163 (55.4%) |
| 25 to 34 Years | 150 (17.3%) | 597 (68.9%) |
| 35 to 44 Years | 219 (29.3%) | 471 (63.0%) |
| 45 to 54 Years | 177 (13.1%) | 967 (71.4%) |
| 55 to 64 Years | 178 (20.8%) | 701 (81.9%) |
| 65 to 74 Years | 829 (100.0%) | 441 (53.2%) |
| 75 Years and over | 447 (100.0%) | 356 (79.6%) |
| Total | 2,947 (41.8%) | 4,468 (63.3%) |
Disability Status by Sex by Age in Waveland
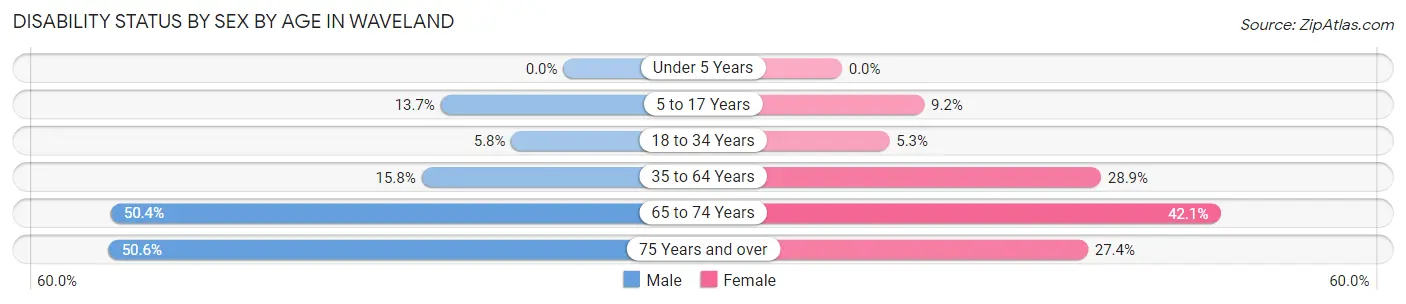
| Age Bracket | Male | Female |
| Under 5 Years | 0 (0.0%) | 0 (0.0%) |
| 5 to 17 Years | 62 (13.7%) | 70 (9.2%) |
| 18 to 34 Years | 41 (5.8%) | 29 (5.3%) |
| 35 to 64 Years | 212 (15.8%) | 466 (28.8%) |
| 65 to 74 Years | 187 (50.4%) | 193 (42.1%) |
| 75 Years and over | 121 (50.6%) | 57 (27.4%) |
Disability Class by Sex by Age in Waveland
Disability Class: Hearing Difficulty
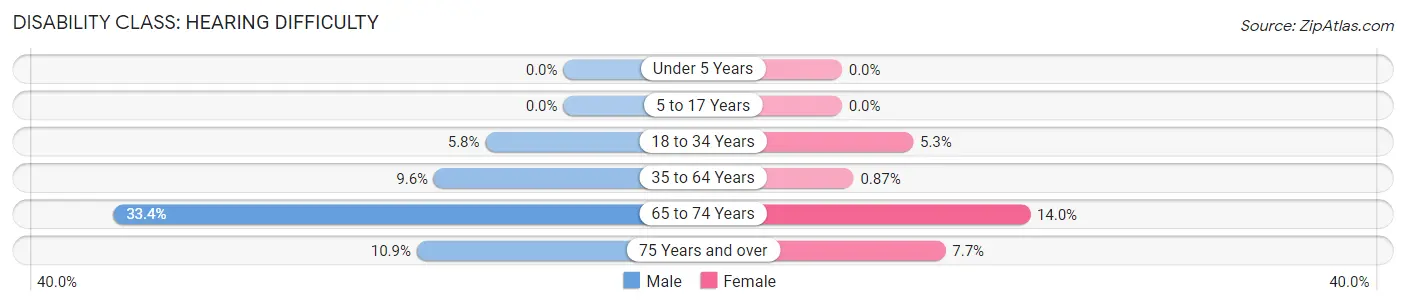
| Age Bracket | Male | Female |
| Under 5 Years | 0 (0.0%) | 0 (0.0%) |
| 5 to 17 Years | 0 (0.0%) | 0 (0.0%) |
| 18 to 34 Years | 41 (5.8%) | 29 (5.3%) |
| 35 to 64 Years | 129 (9.6%) | 14 (0.9%) |
| 65 to 74 Years | 124 (33.4%) | 64 (14.0%) |
| 75 Years and over | 26 (10.9%) | 16 (7.7%) |
Disability Class: Vision Difficulty
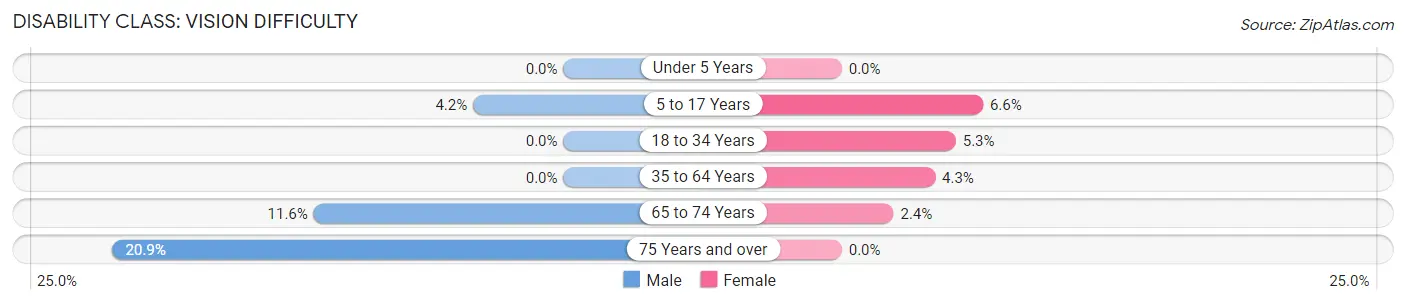
| Age Bracket | Male | Female |
| Under 5 Years | 0 (0.0%) | 0 (0.0%) |
| 5 to 17 Years | 19 (4.2%) | 50 (6.6%) |
| 18 to 34 Years | 0 (0.0%) | 29 (5.3%) |
| 35 to 64 Years | 0 (0.0%) | 70 (4.3%) |
| 65 to 74 Years | 43 (11.6%) | 11 (2.4%) |
| 75 Years and over | 50 (20.9%) | 0 (0.0%) |
Disability Class: Cognitive Difficulty
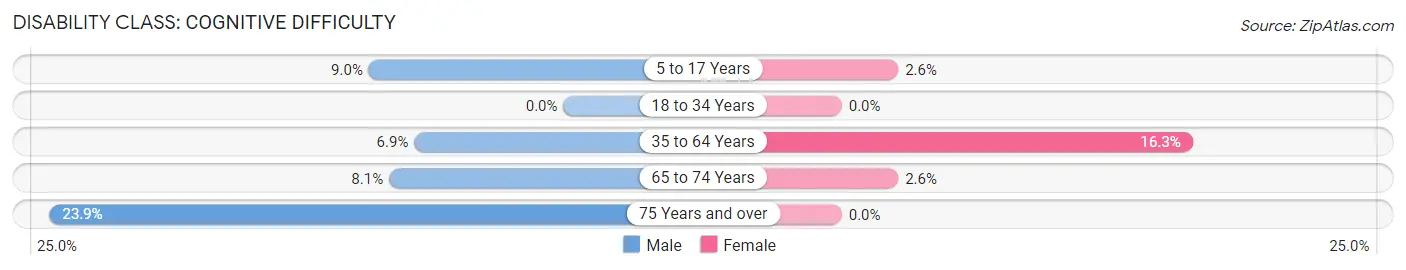
| Age Bracket | Male | Female |
| 5 to 17 Years | 41 (9.0%) | 20 (2.6%) |
| 18 to 34 Years | 0 (0.0%) | 0 (0.0%) |
| 35 to 64 Years | 93 (6.9%) | 263 (16.3%) |
| 65 to 74 Years | 30 (8.1%) | 12 (2.6%) |
| 75 Years and over | 57 (23.8%) | 0 (0.0%) |
Disability Class: Ambulatory Difficulty
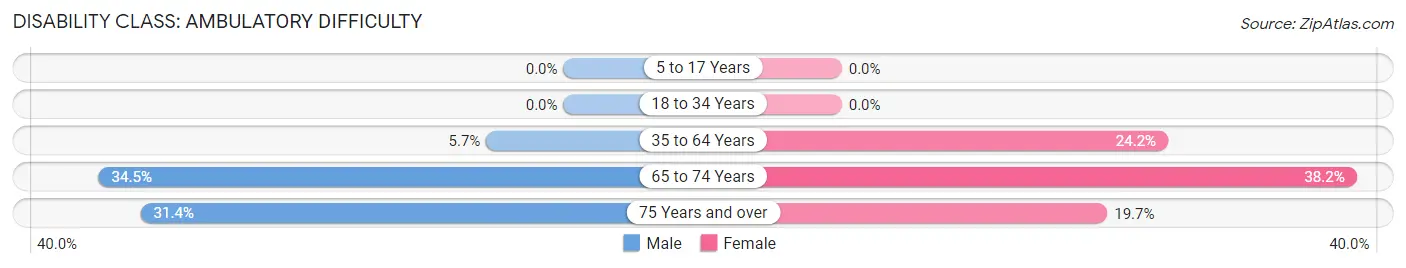
| Age Bracket | Male | Female |
| 5 to 17 Years | 0 (0.0%) | 0 (0.0%) |
| 18 to 34 Years | 0 (0.0%) | 0 (0.0%) |
| 35 to 64 Years | 77 (5.7%) | 391 (24.2%) |
| 65 to 74 Years | 128 (34.5%) | 175 (38.2%) |
| 75 Years and over | 75 (31.4%) | 41 (19.7%) |
Disability Class: Self-Care Difficulty
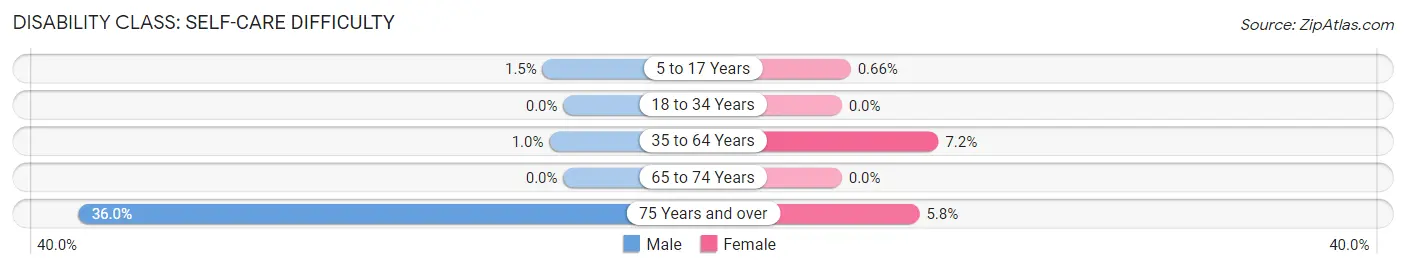
| Age Bracket | Male | Female |
| 5 to 17 Years | 7 (1.5%) | 5 (0.7%) |
| 18 to 34 Years | 0 (0.0%) | 0 (0.0%) |
| 35 to 64 Years | 14 (1.0%) | 116 (7.2%) |
| 65 to 74 Years | 0 (0.0%) | 0 (0.0%) |
| 75 Years and over | 86 (36.0%) | 12 (5.8%) |
Technology Access in Waveland
Computing Device Access in Waveland
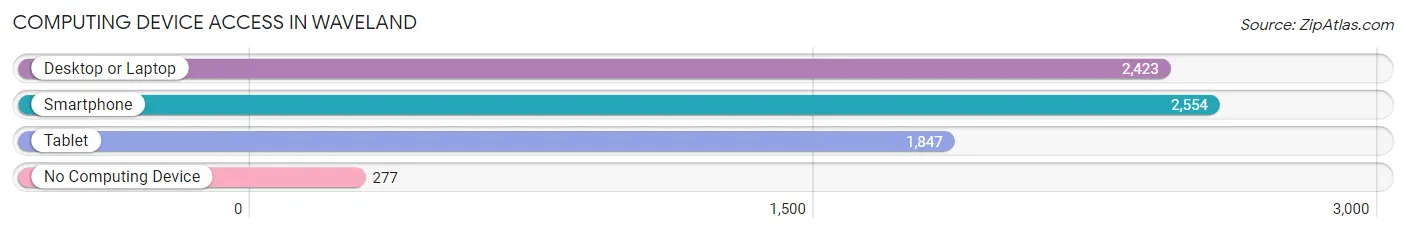
| Device Type | # Households | % Households |
| Desktop or Laptop | 2,423 | 81.1% |
| Smartphone | 2,554 | 85.5% |
| Tablet | 1,847 | 61.8% |
| No Computing Device | 277 | 9.3% |
| Total | 2,989 | 100.0% |
Internet Access in Waveland
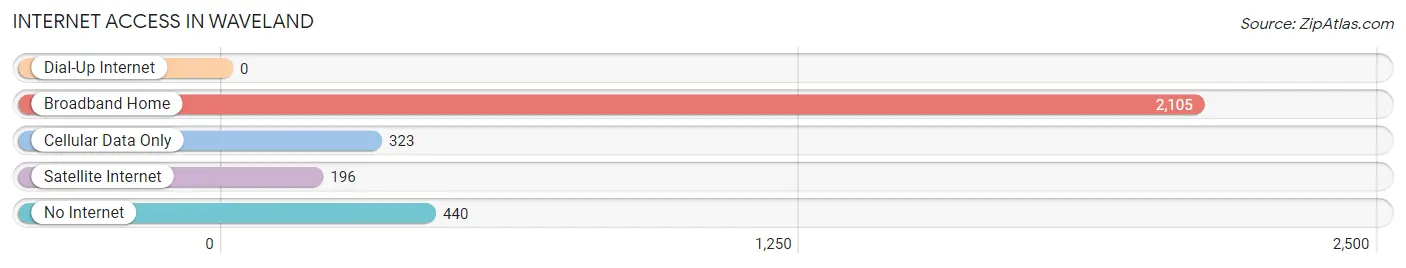
| Internet Type | # Households | % Households |
| Dial-Up Internet | 0 | 0.0% |
| Broadband Home | 2,105 | 70.4% |
| Cellular Data Only | 323 | 10.8% |
| Satellite Internet | 196 | 6.6% |
| No Internet | 440 | 14.7% |
| Total | 2,989 | 100.0% |
Waveland Summary
Waveland, Mississippi is a small city located in Hancock County, Mississippi, United States. It is situated along the Gulf of Mexico, approximately 50 miles east of New Orleans, Louisiana. The city has a population of 6,674 as of the 2010 census. Waveland is part of the Gulfport-Biloxi-Pascagoula Metropolitan Statistical Area.
History
Waveland was founded in 1819 by William Waveland, a wealthy planter from Virginia. The city was originally known as Waveland’s Landing, and was a popular port for ships traveling between New Orleans and Mobile. In 1836, the city was incorporated and renamed Waveland.
During the Civil War, Waveland was occupied by Union forces in 1862. The city was heavily damaged by Hurricane Camille in 1969, and was further damaged by Hurricane Katrina in 2005.
Geography
Waveland is located at 30°17'25" North, 89°20'25" West (30.290278, -89.340278). The city has a total area of 8.2 square miles, of which 8.1 square miles is land and 0.1 square miles is water.
The city is situated along the Gulf of Mexico, and is bordered by Bay St. Louis to the east and Diamondhead to the west. Waveland is located approximately 50 miles east of New Orleans, Louisiana, and is part of the Gulfport-Biloxi-Pascagoula Metropolitan Statistical Area.
Economy
Waveland’s economy is largely based on tourism and the service industry. The city is home to several hotels, restaurants, and other tourist attractions. Waveland is also home to several manufacturing and industrial businesses, including a paper mill and a seafood processing plant.
Demographics
As of the 2010 census, Waveland had a population of 6,674. The racial makeup of the city was 79.2% White, 17.2% African American, 0.7% Native American, 0.5% Asian, 0.1% Pacific Islander, 0.7% from other races, and 1.7% from two or more races. Hispanic or Latino of any race were 2.2% of the population.
The median income for a household in Waveland was $37,917, and the median income for a family was $45,938. The per capita income for the city was $20,845. About 15.2% of families and 18.2% of the population were below the poverty line, including 28.2% of those under age 18 and 11.2% of those age 65 or over.
Common Questions
What is Per Capita Income in Waveland?
Per Capita income in Waveland is $32,381.
What is the Median Family Income in Waveland?
Median Family Income in Waveland is $75,052.
What is the Median Household income in Waveland?
Median Household Income in Waveland is $56,396.
What is Income or Wage Gap in Waveland?
Income or Wage Gap in Waveland is 51.6%.
Women in Waveland earn 48.4 cents for every dollar earned by a man.
What is Inequality or Gini Index in Waveland?
Inequality or Gini Index in Waveland is 0.42.
What is the Total Population of Waveland?
Total Population of Waveland is 7,075.
What is the Total Male Population of Waveland?
Total Male Population of Waveland is 3,350.
What is the Total Female Population of Waveland?
Total Female Population of Waveland is 3,725.
What is the Ratio of Males per 100 Females in Waveland?
There are 89.93 Males per 100 Females in Waveland.
What is the Ratio of Females per 100 Males in Waveland?
There are 111.19 Females per 100 Males in Waveland.
What is the Median Population Age in Waveland?
Median Population Age in Waveland is 44.1 Years.
What is the Average Family Size in Waveland
Average Family Size in Waveland is 2.9 People.
What is the Average Household Size in Waveland
Average Household Size in Waveland is 2.4 People.
How Large is the Labor Force in Waveland?
There are 3,764 People in the Labor Forcein in Waveland.
What is the Percentage of People in the Labor Force in Waveland?
62.8% of People are in the Labor Force in Waveland.
What is the Unemployment Rate in Waveland?
Unemployment Rate in Waveland is 9.0%.