Zip Codes with the Highest Percentage of Population Employed in Food Preparation & Serving in Jackson, MS
RELATED REPORTS & OPTIONS
Food Preparation & Serving
Jackson
Compare Zip Codes
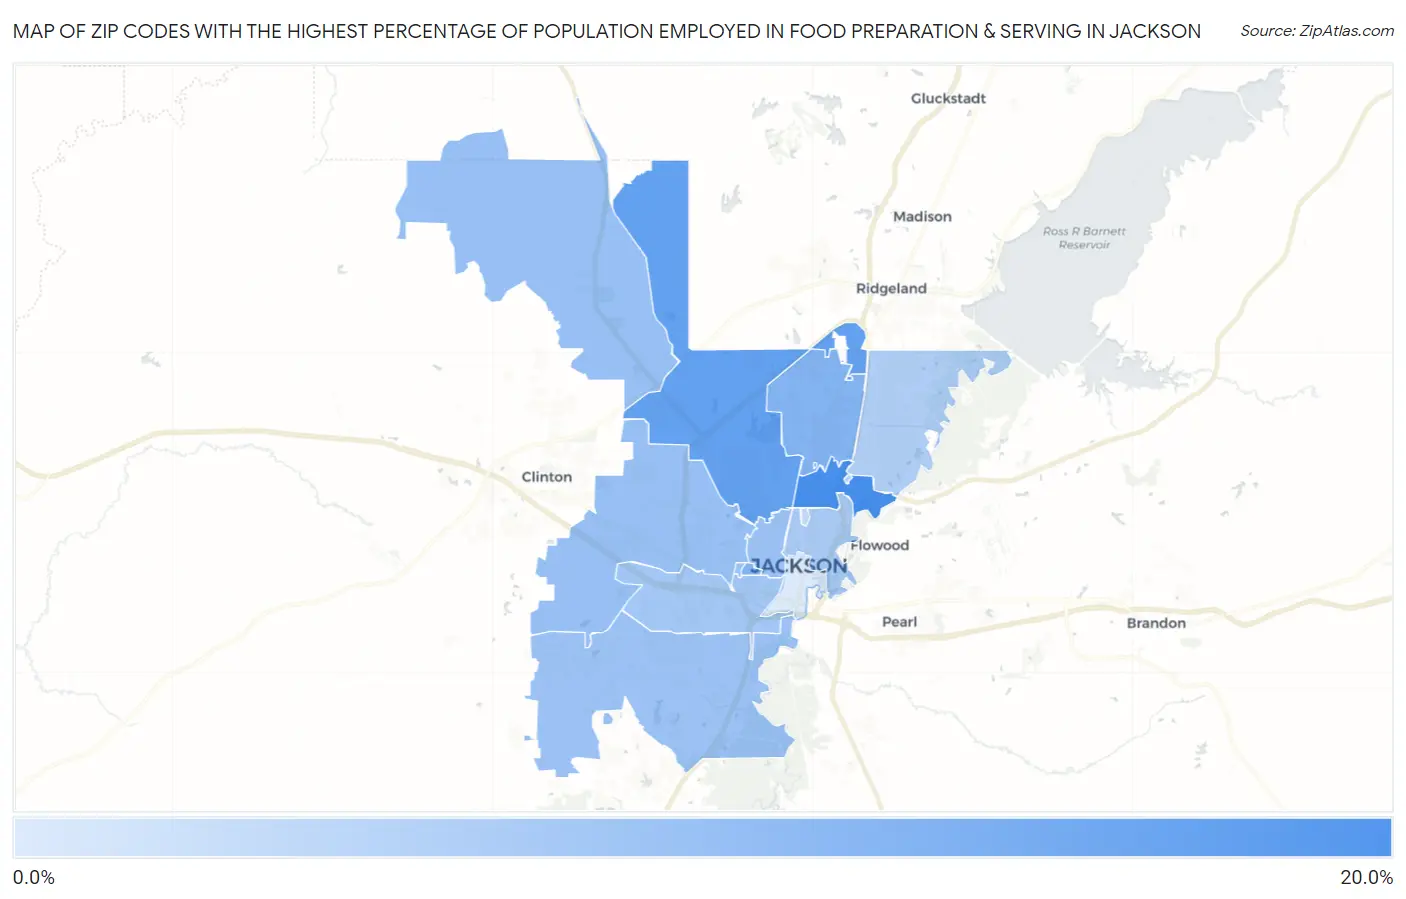
Map of Zip Codes with the Highest Percentage of Population Employed in Food Preparation & Serving in Jackson
1.4%
17.2%
Zip Codes with the Highest Percentage of Population Employed in Food Preparation & Serving in Jackson, MS
| Zip Code | % Employed | vs State | vs National | |
| 1. | 39216 | 17.2% | 5.6%(+11.6)#9 | 5.3%(+11.9)#729 |
| 2. | 39213 | 14.0% | 5.6%(+8.41)#14 | 5.3%(+8.72)#1,159 |
| 3. | 39206 | 10.6% | 5.6%(+5.02)#34 | 5.3%(+5.33)#2,256 |
| 4. | 39217 | 10.6% | 5.6%(+5.01)#35 | 5.3%(+5.32)#2,261 |
| 5. | 39209 | 8.4% | 5.6%(+2.77)#52 | 5.3%(+3.08)#4,218 |
| 6. | 39203 | 8.1% | 5.6%(+2.52)#58 | 5.3%(+2.83)#4,553 |
| 7. | 39212 | 8.0% | 5.6%(+2.44)#59 | 5.3%(+2.75)#4,686 |
| 8. | 39204 | 7.1% | 5.6%(+1.54)#83 | 5.3%(+1.85)#6,269 |
| 9. | 39202 | 6.5% | 5.6%(+0.949)#104 | 5.3%(+1.26)#7,762 |
| 10. | 39211 | 5.9% | 5.6%(+0.333)#125 | 5.3%(+0.640)#9,594 |
| 11. | 39210 | 4.1% | 5.6%(-1.46)#196 | 5.3%(-1.15)#16,573 |
| 12. | 39201 | 1.4% | 5.6%(-4.24)#297 | 5.3%(-3.93)#26,296 |
1
Common Questions
What are the Top 10 Zip Codes with the Highest Percentage of Population Employed in Food Preparation & Serving in Jackson, MS?
Top 10 Zip Codes with the Highest Percentage of Population Employed in Food Preparation & Serving in Jackson, MS are:
What zip code has the Highest Percentage of Population Employed in Food Preparation & Serving in Jackson, MS?
39216 has the Highest Percentage of Population Employed in Food Preparation & Serving in Jackson, MS with 17.2%.
What is the Percentage of Population Employed in Food Preparation & Serving in Jackson, MS?
Percentage of Population Employed in Food Preparation & Serving in Jackson is 8.8%.
What is the Percentage of Population Employed in Food Preparation & Serving in Mississippi?
Percentage of Population Employed in Food Preparation & Serving in Mississippi is 5.6%.
What is the Percentage of Population Employed in Food Preparation & Serving in the United States?
Percentage of Population Employed in Food Preparation & Serving in the United States is 5.3%.